
The Application of X-ray Micro-CT in the Study of HTS Tape Coils

 ,
, 
Abstract
:1. Introduction
2. Materials and Methods
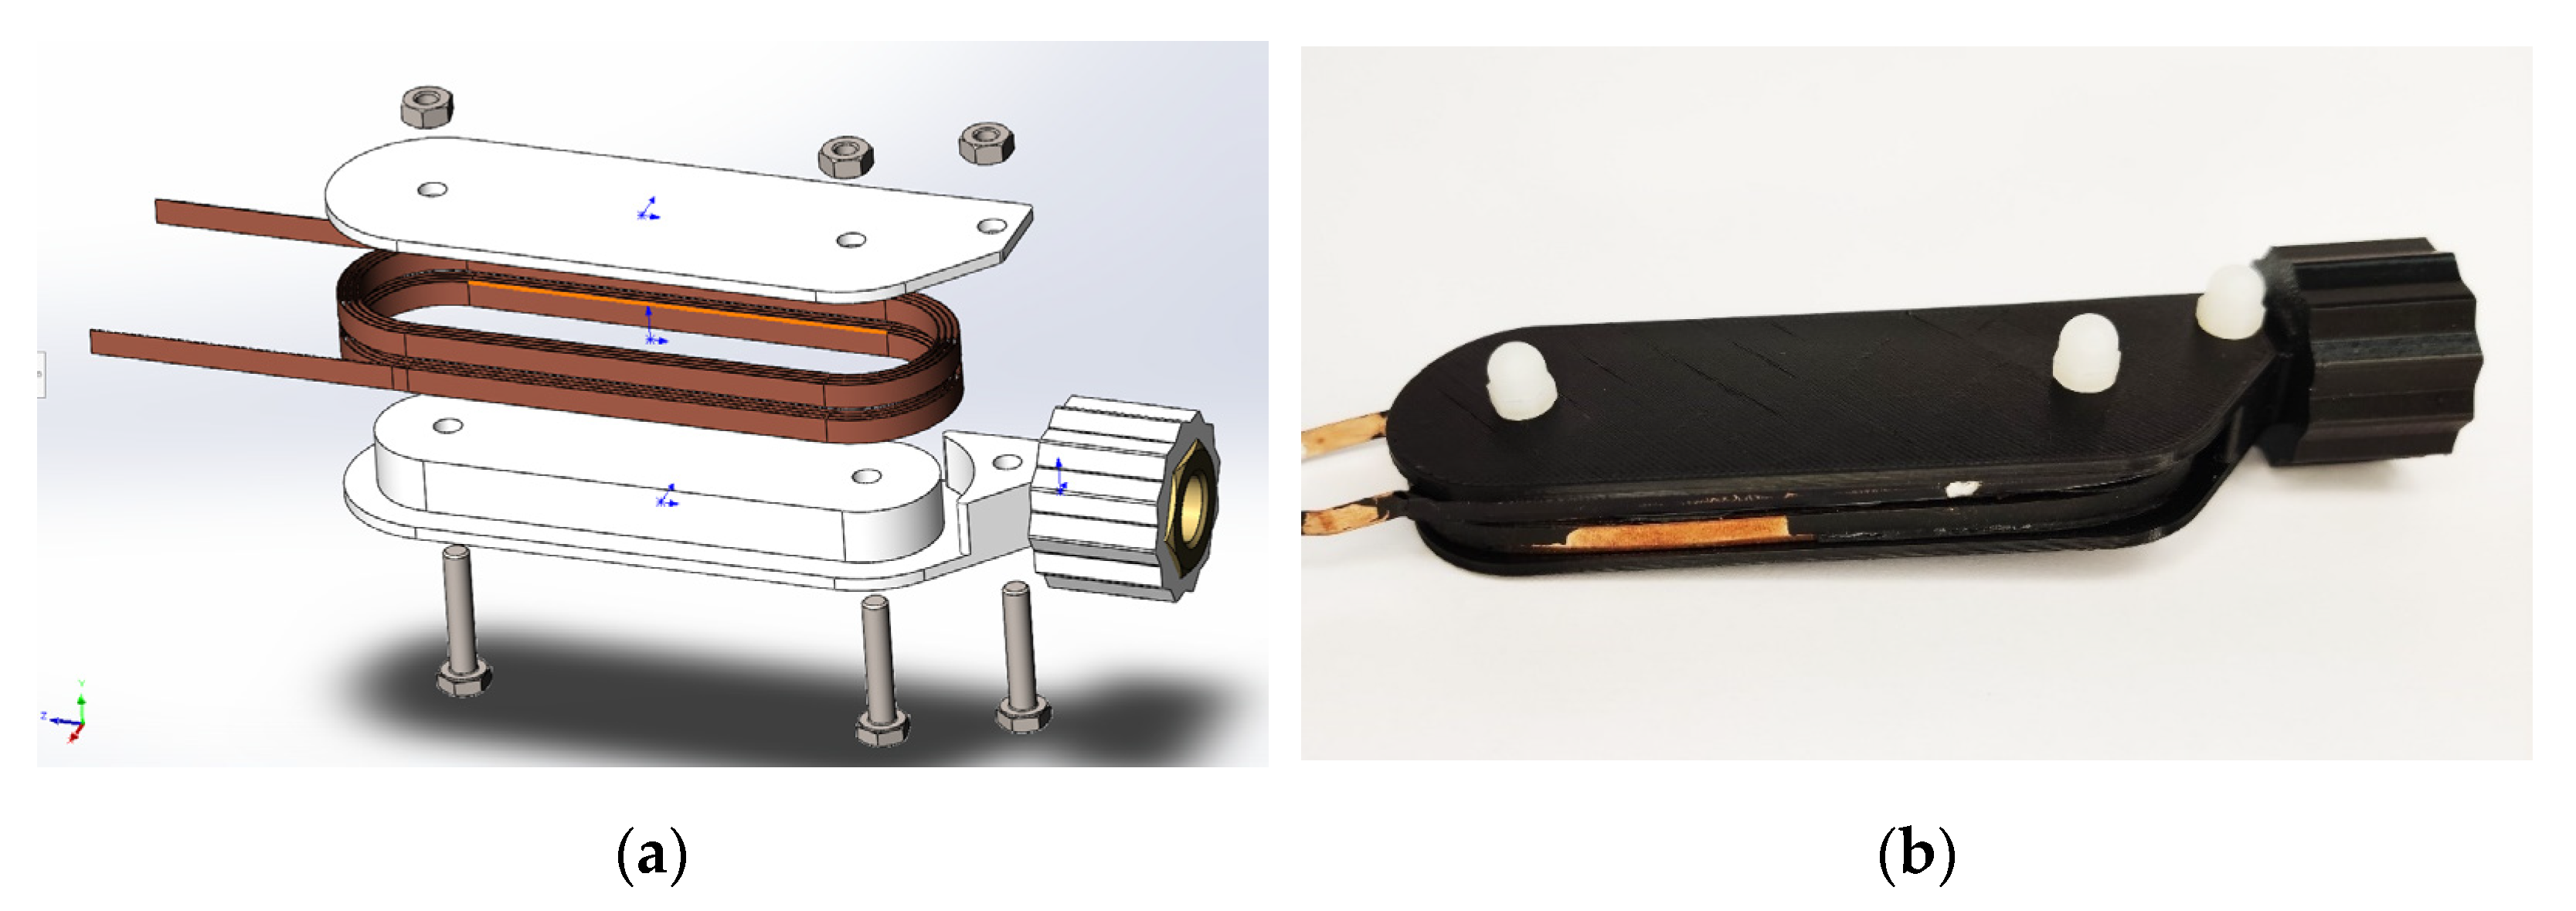
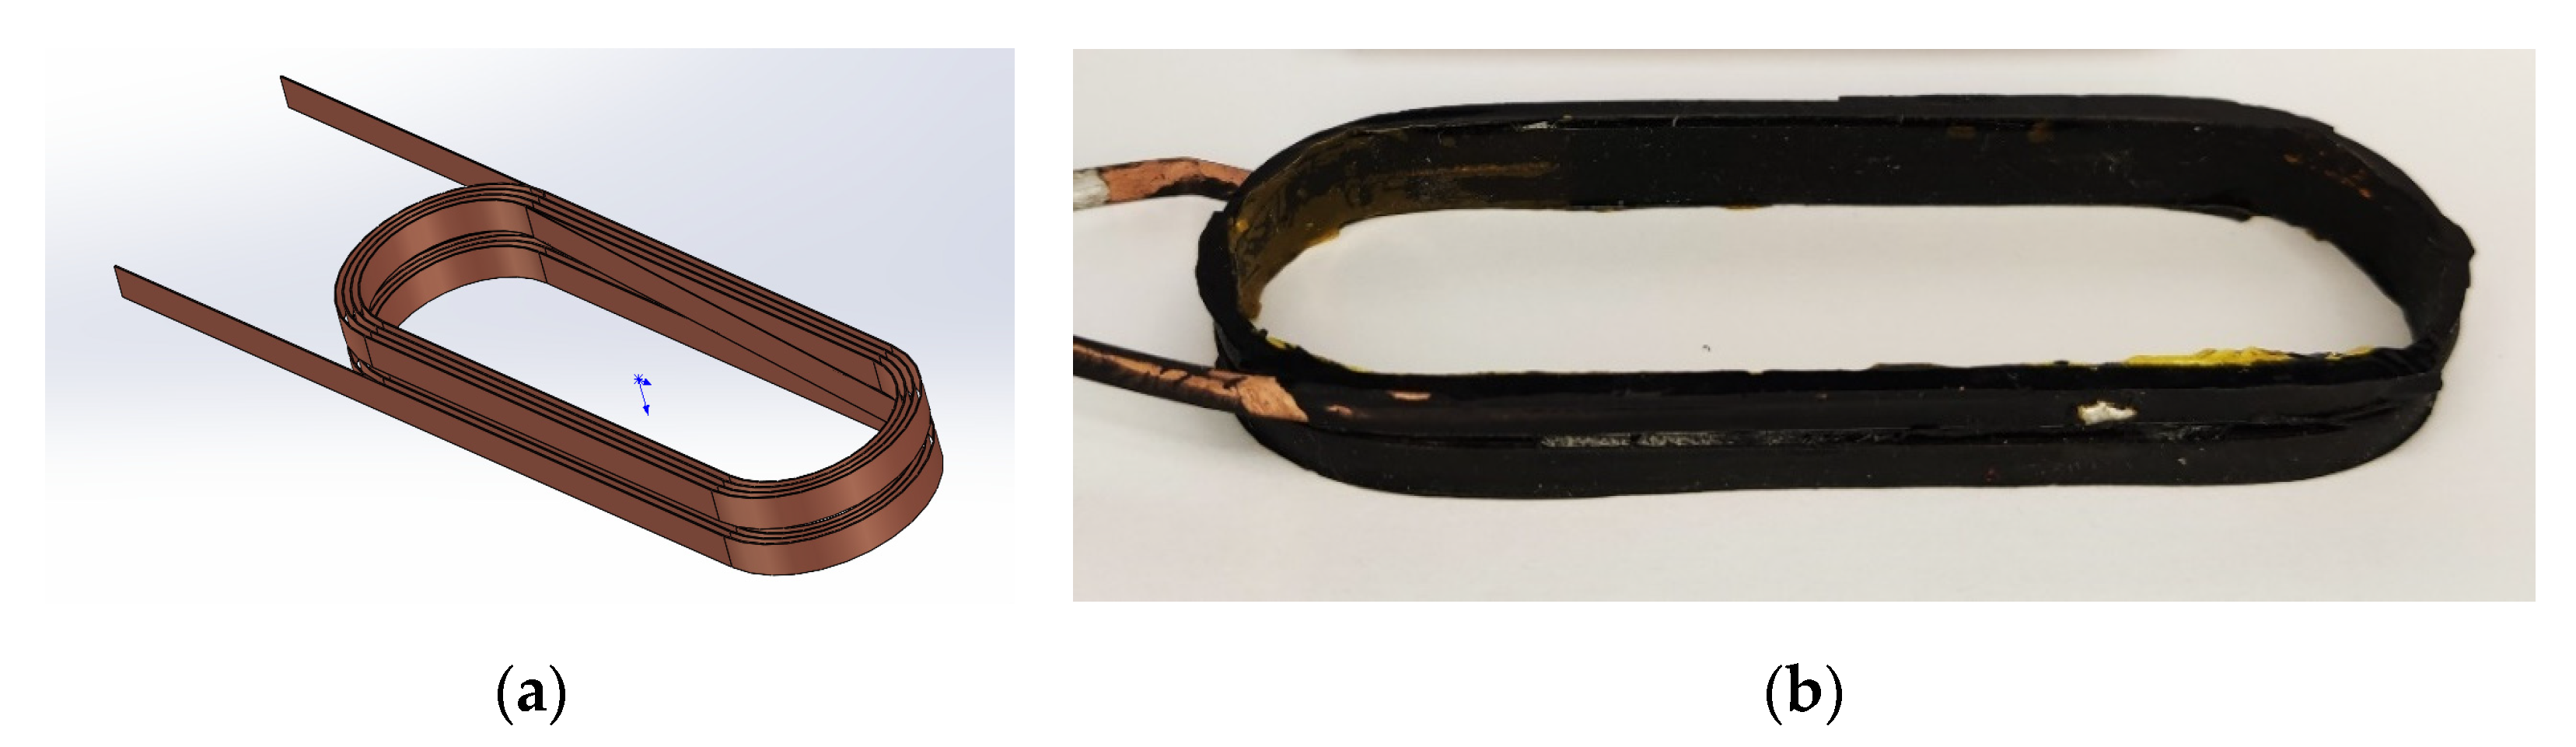
2.1. Research Object
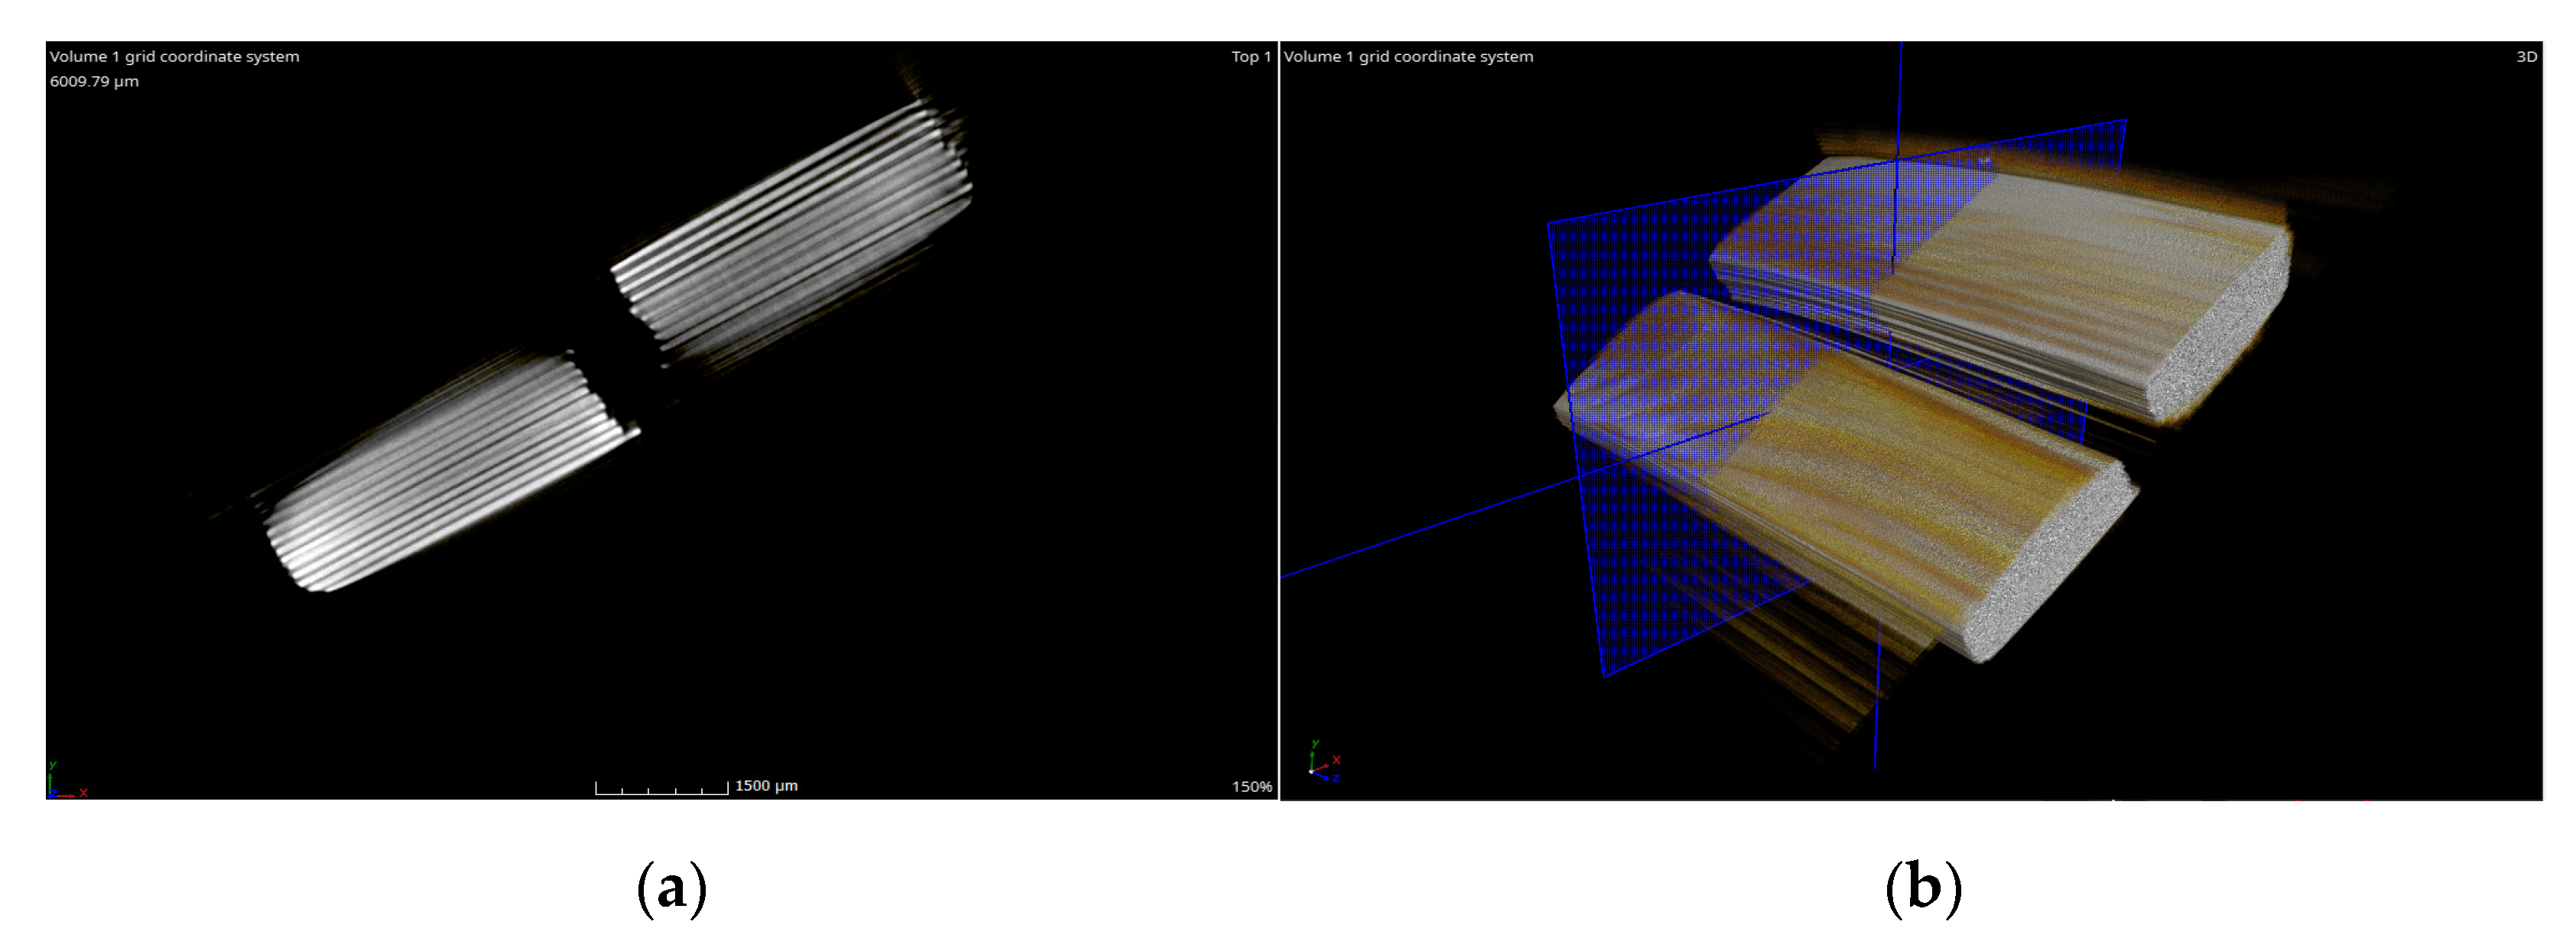
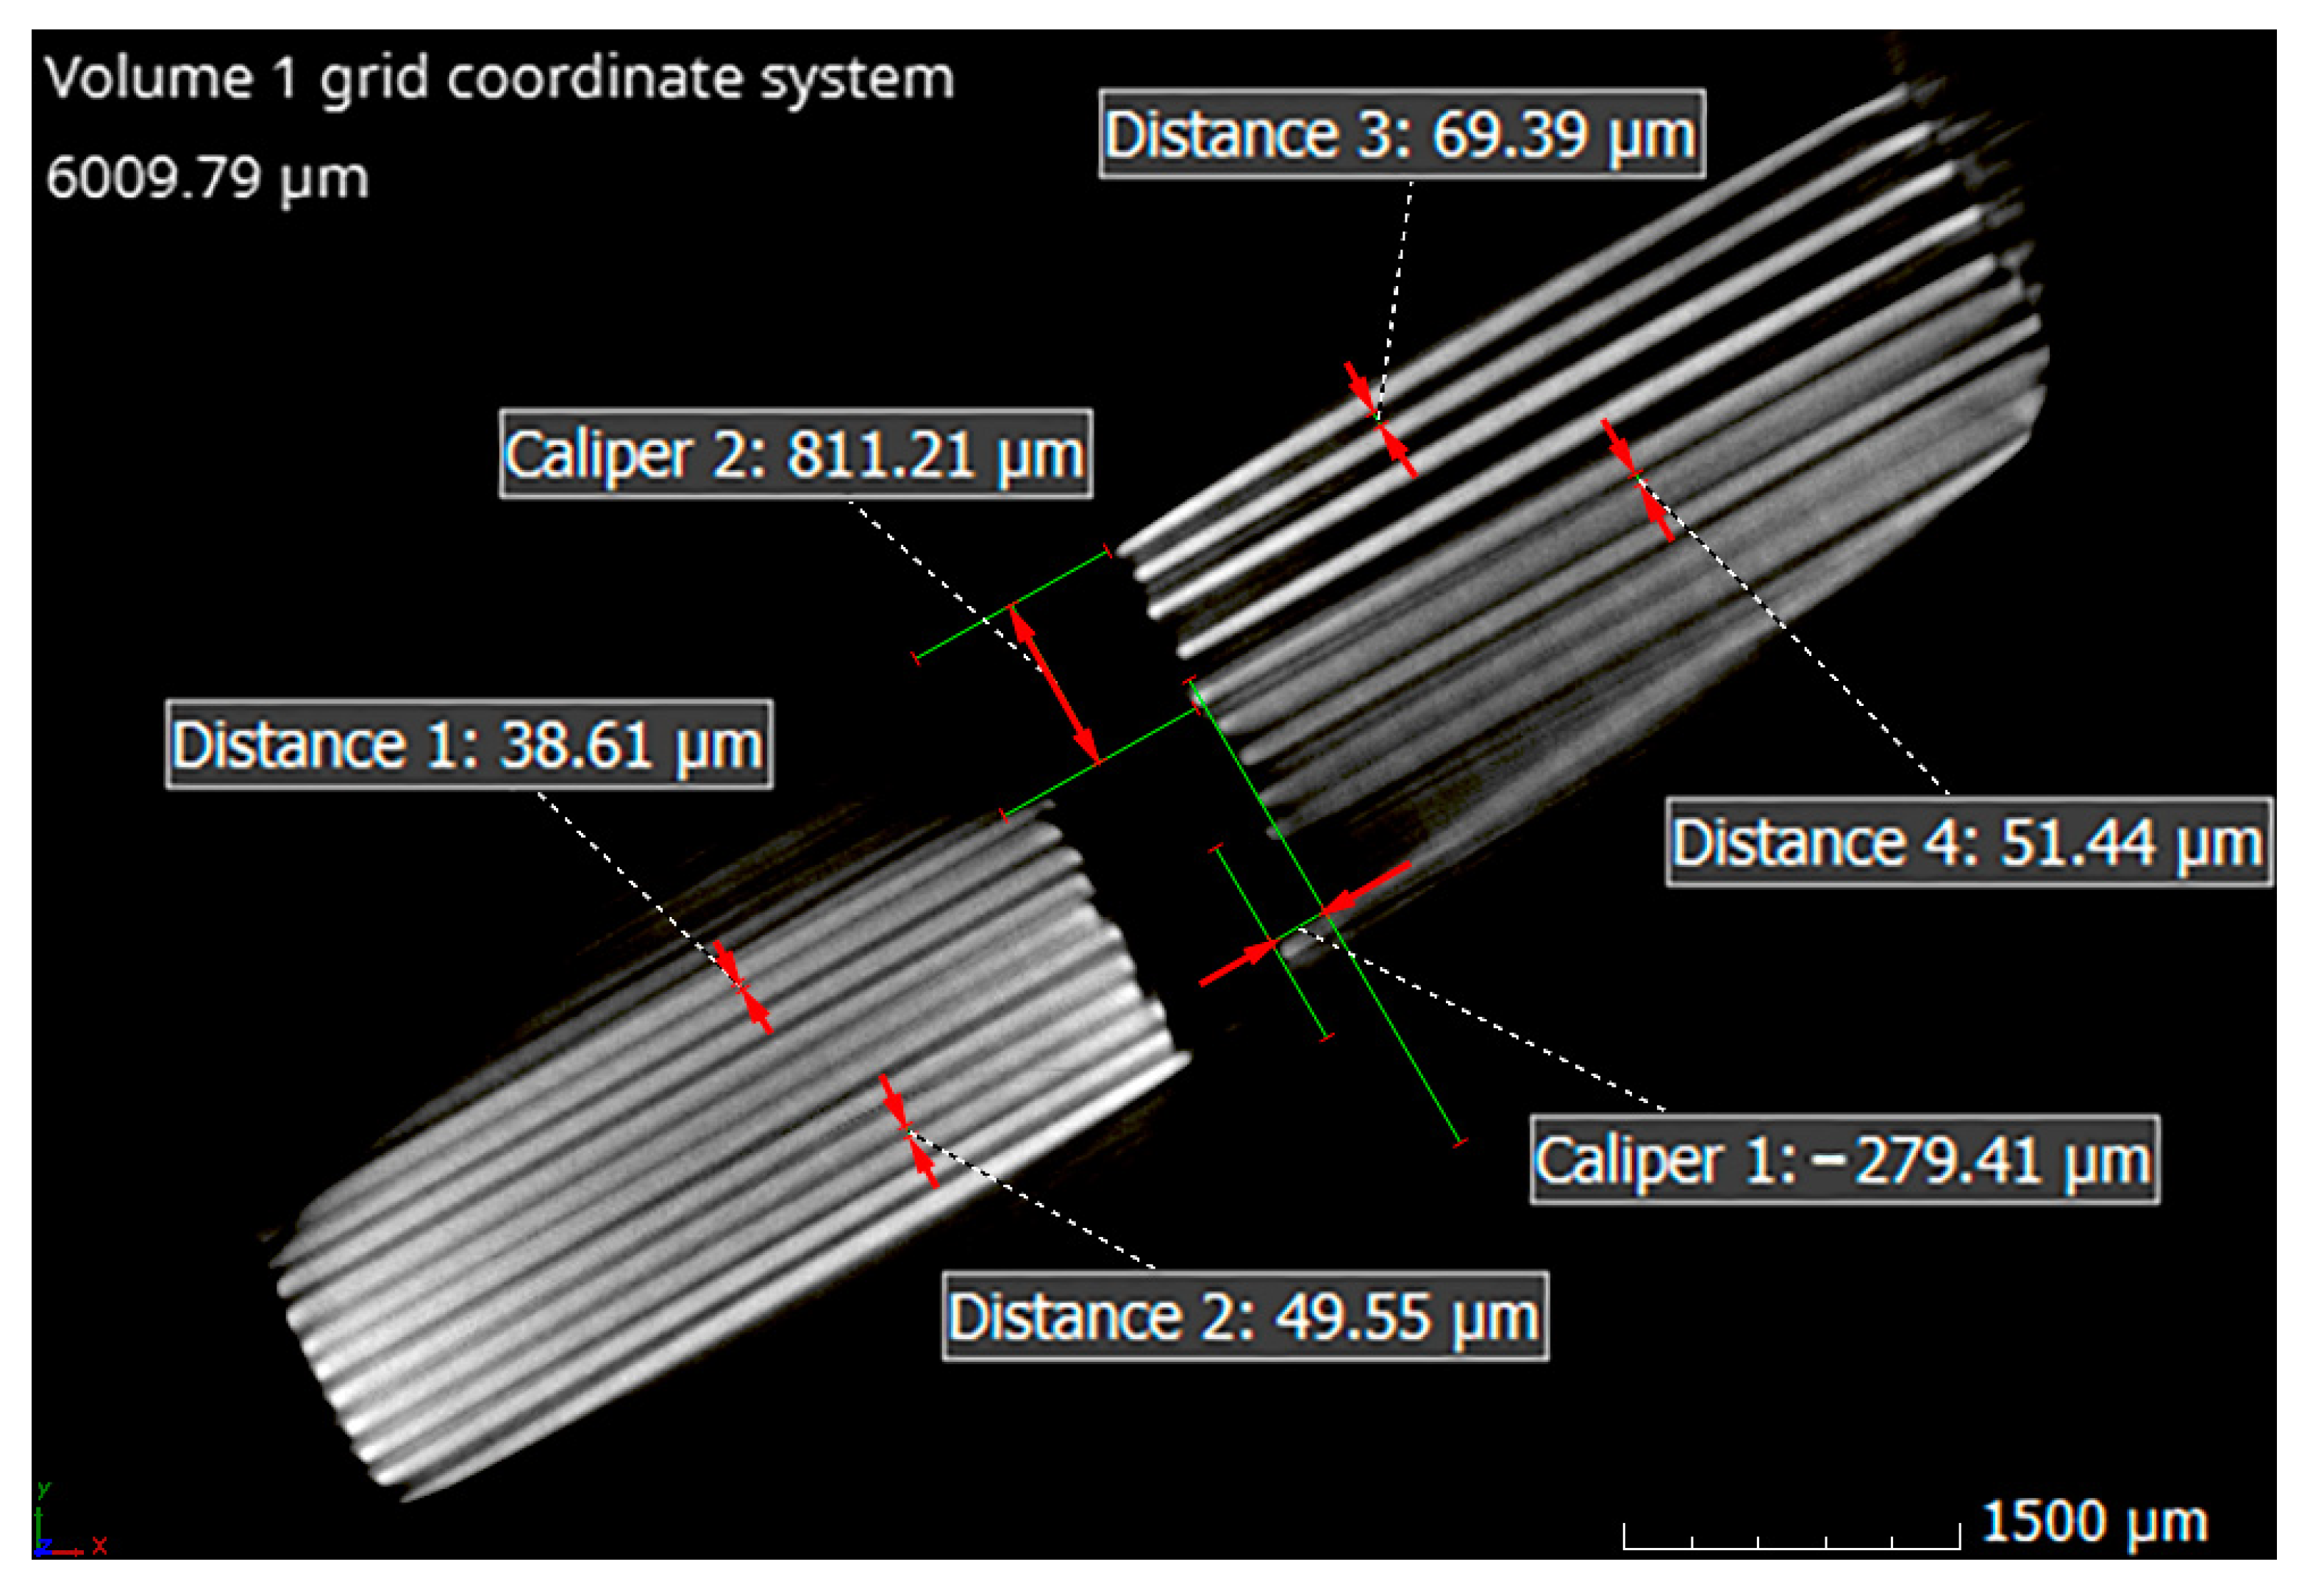
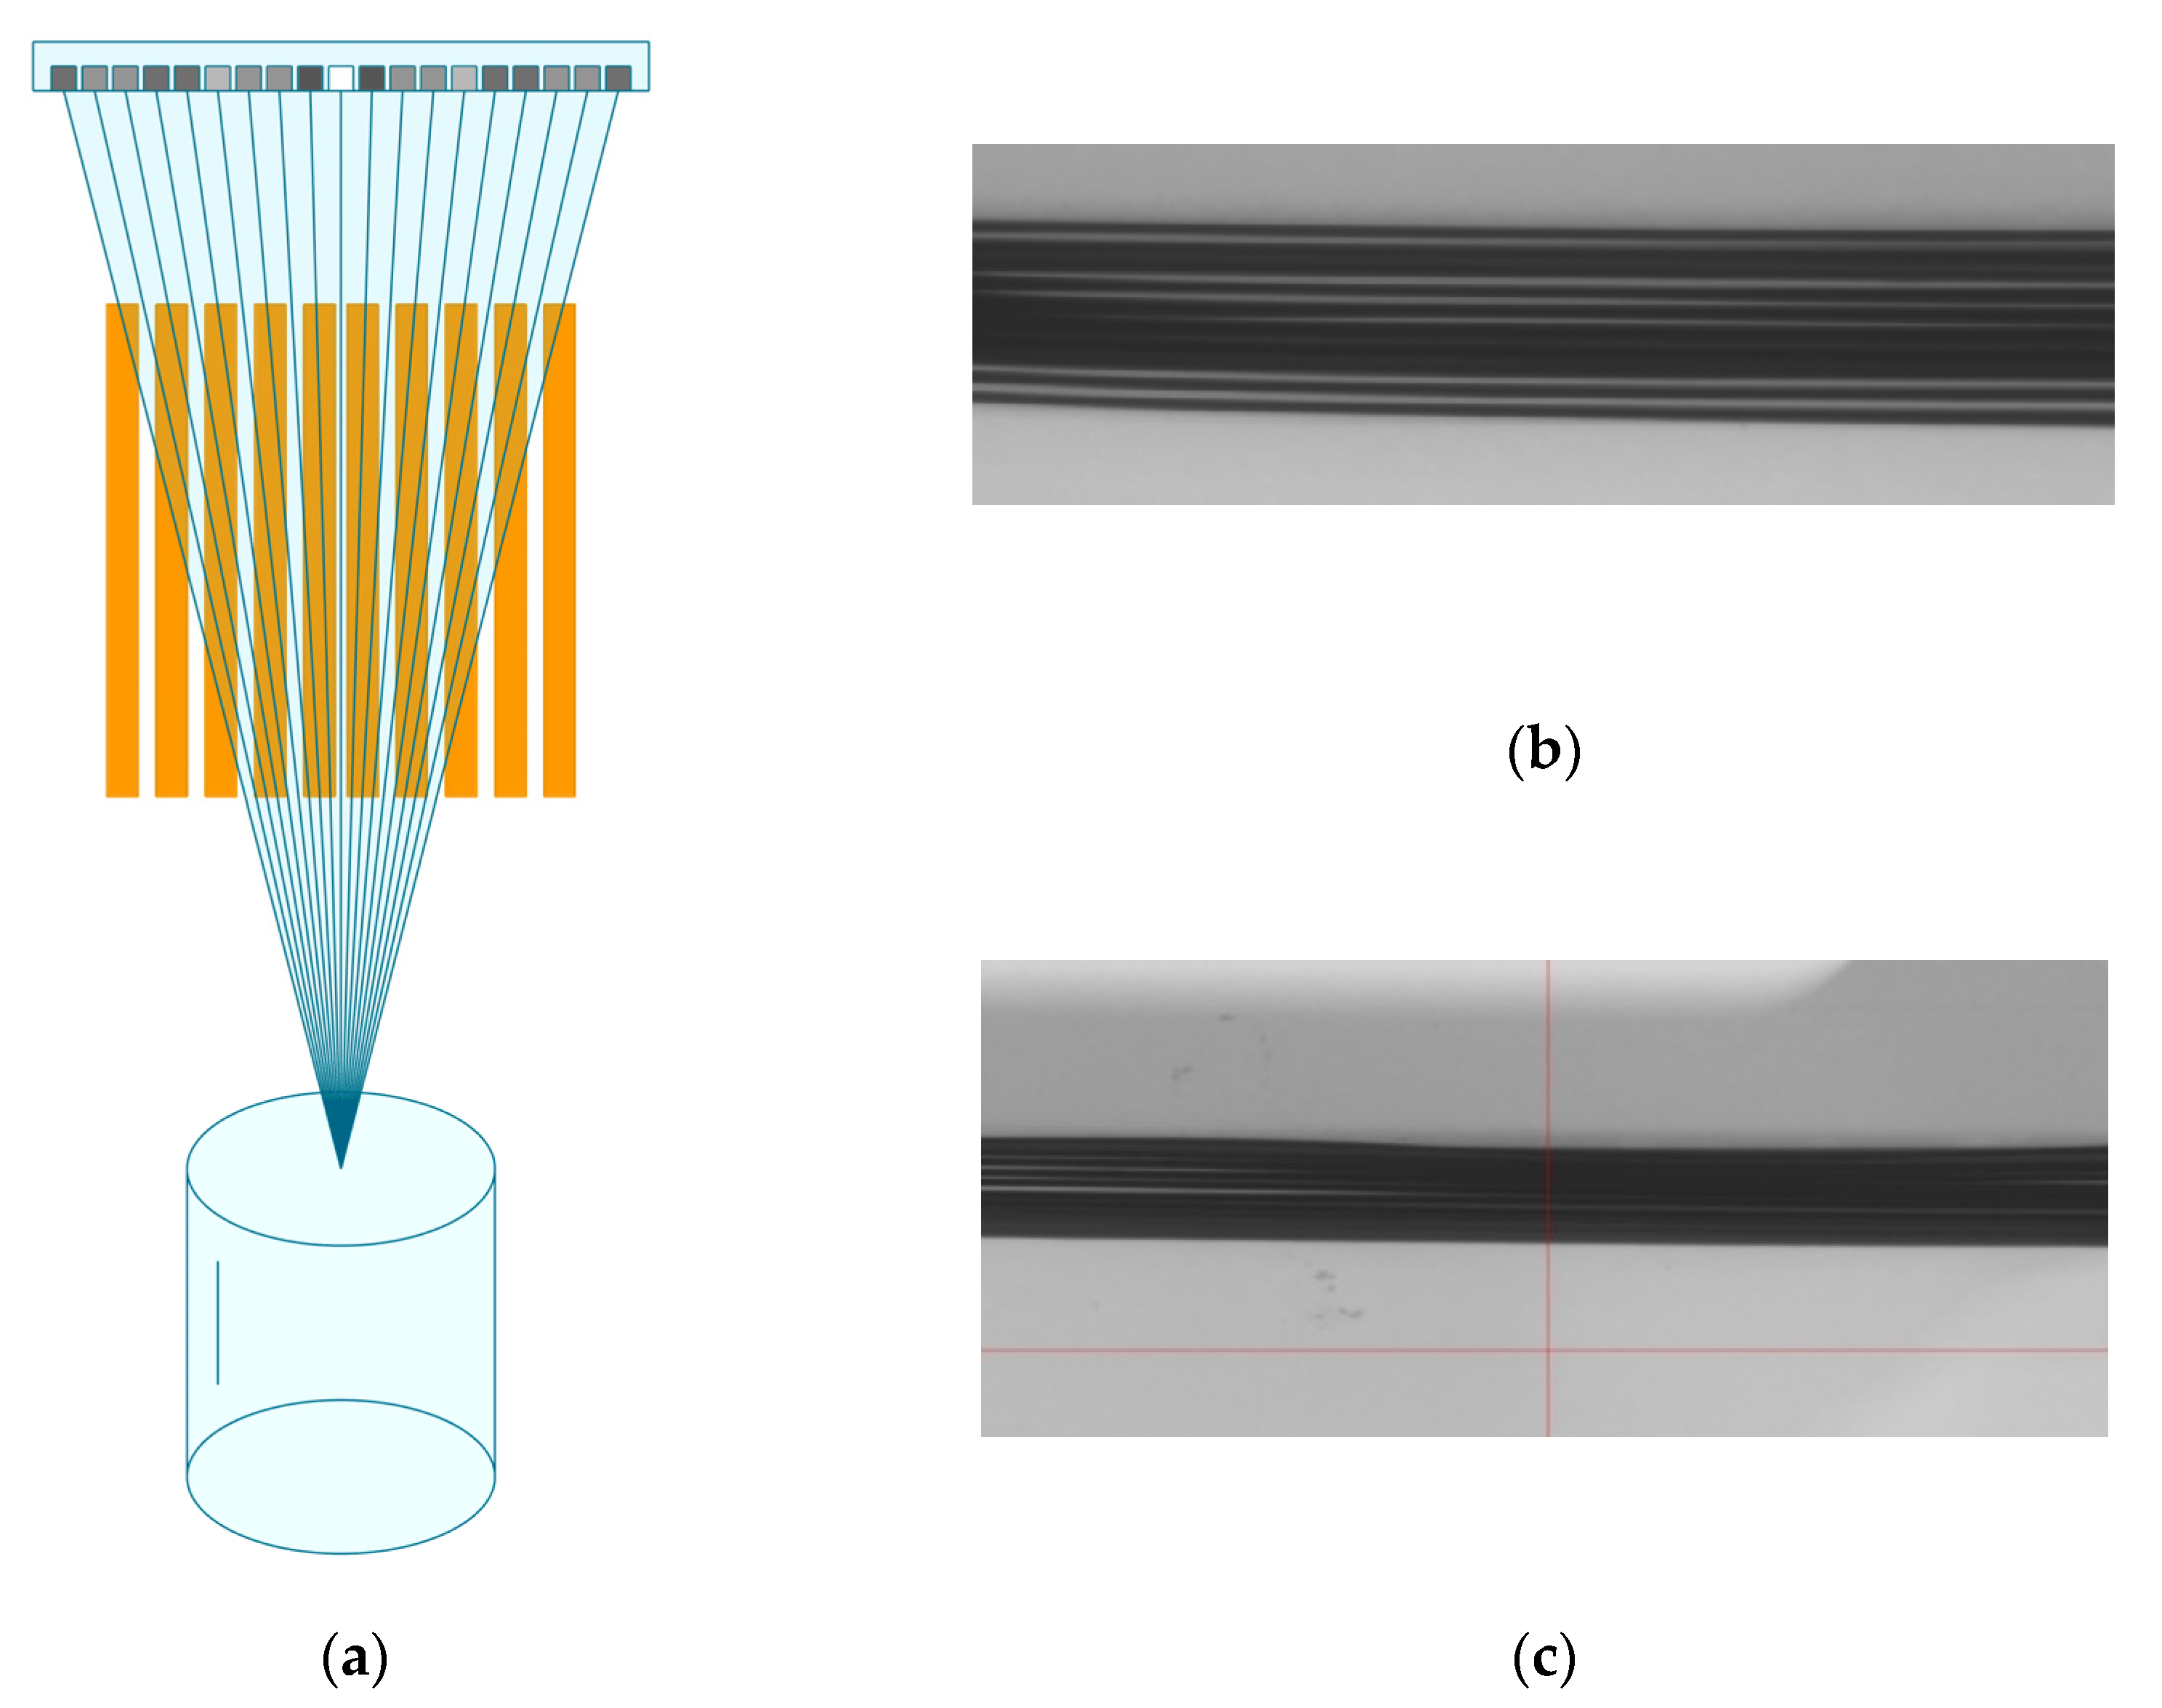
2.2. Research Methodology
3. Results
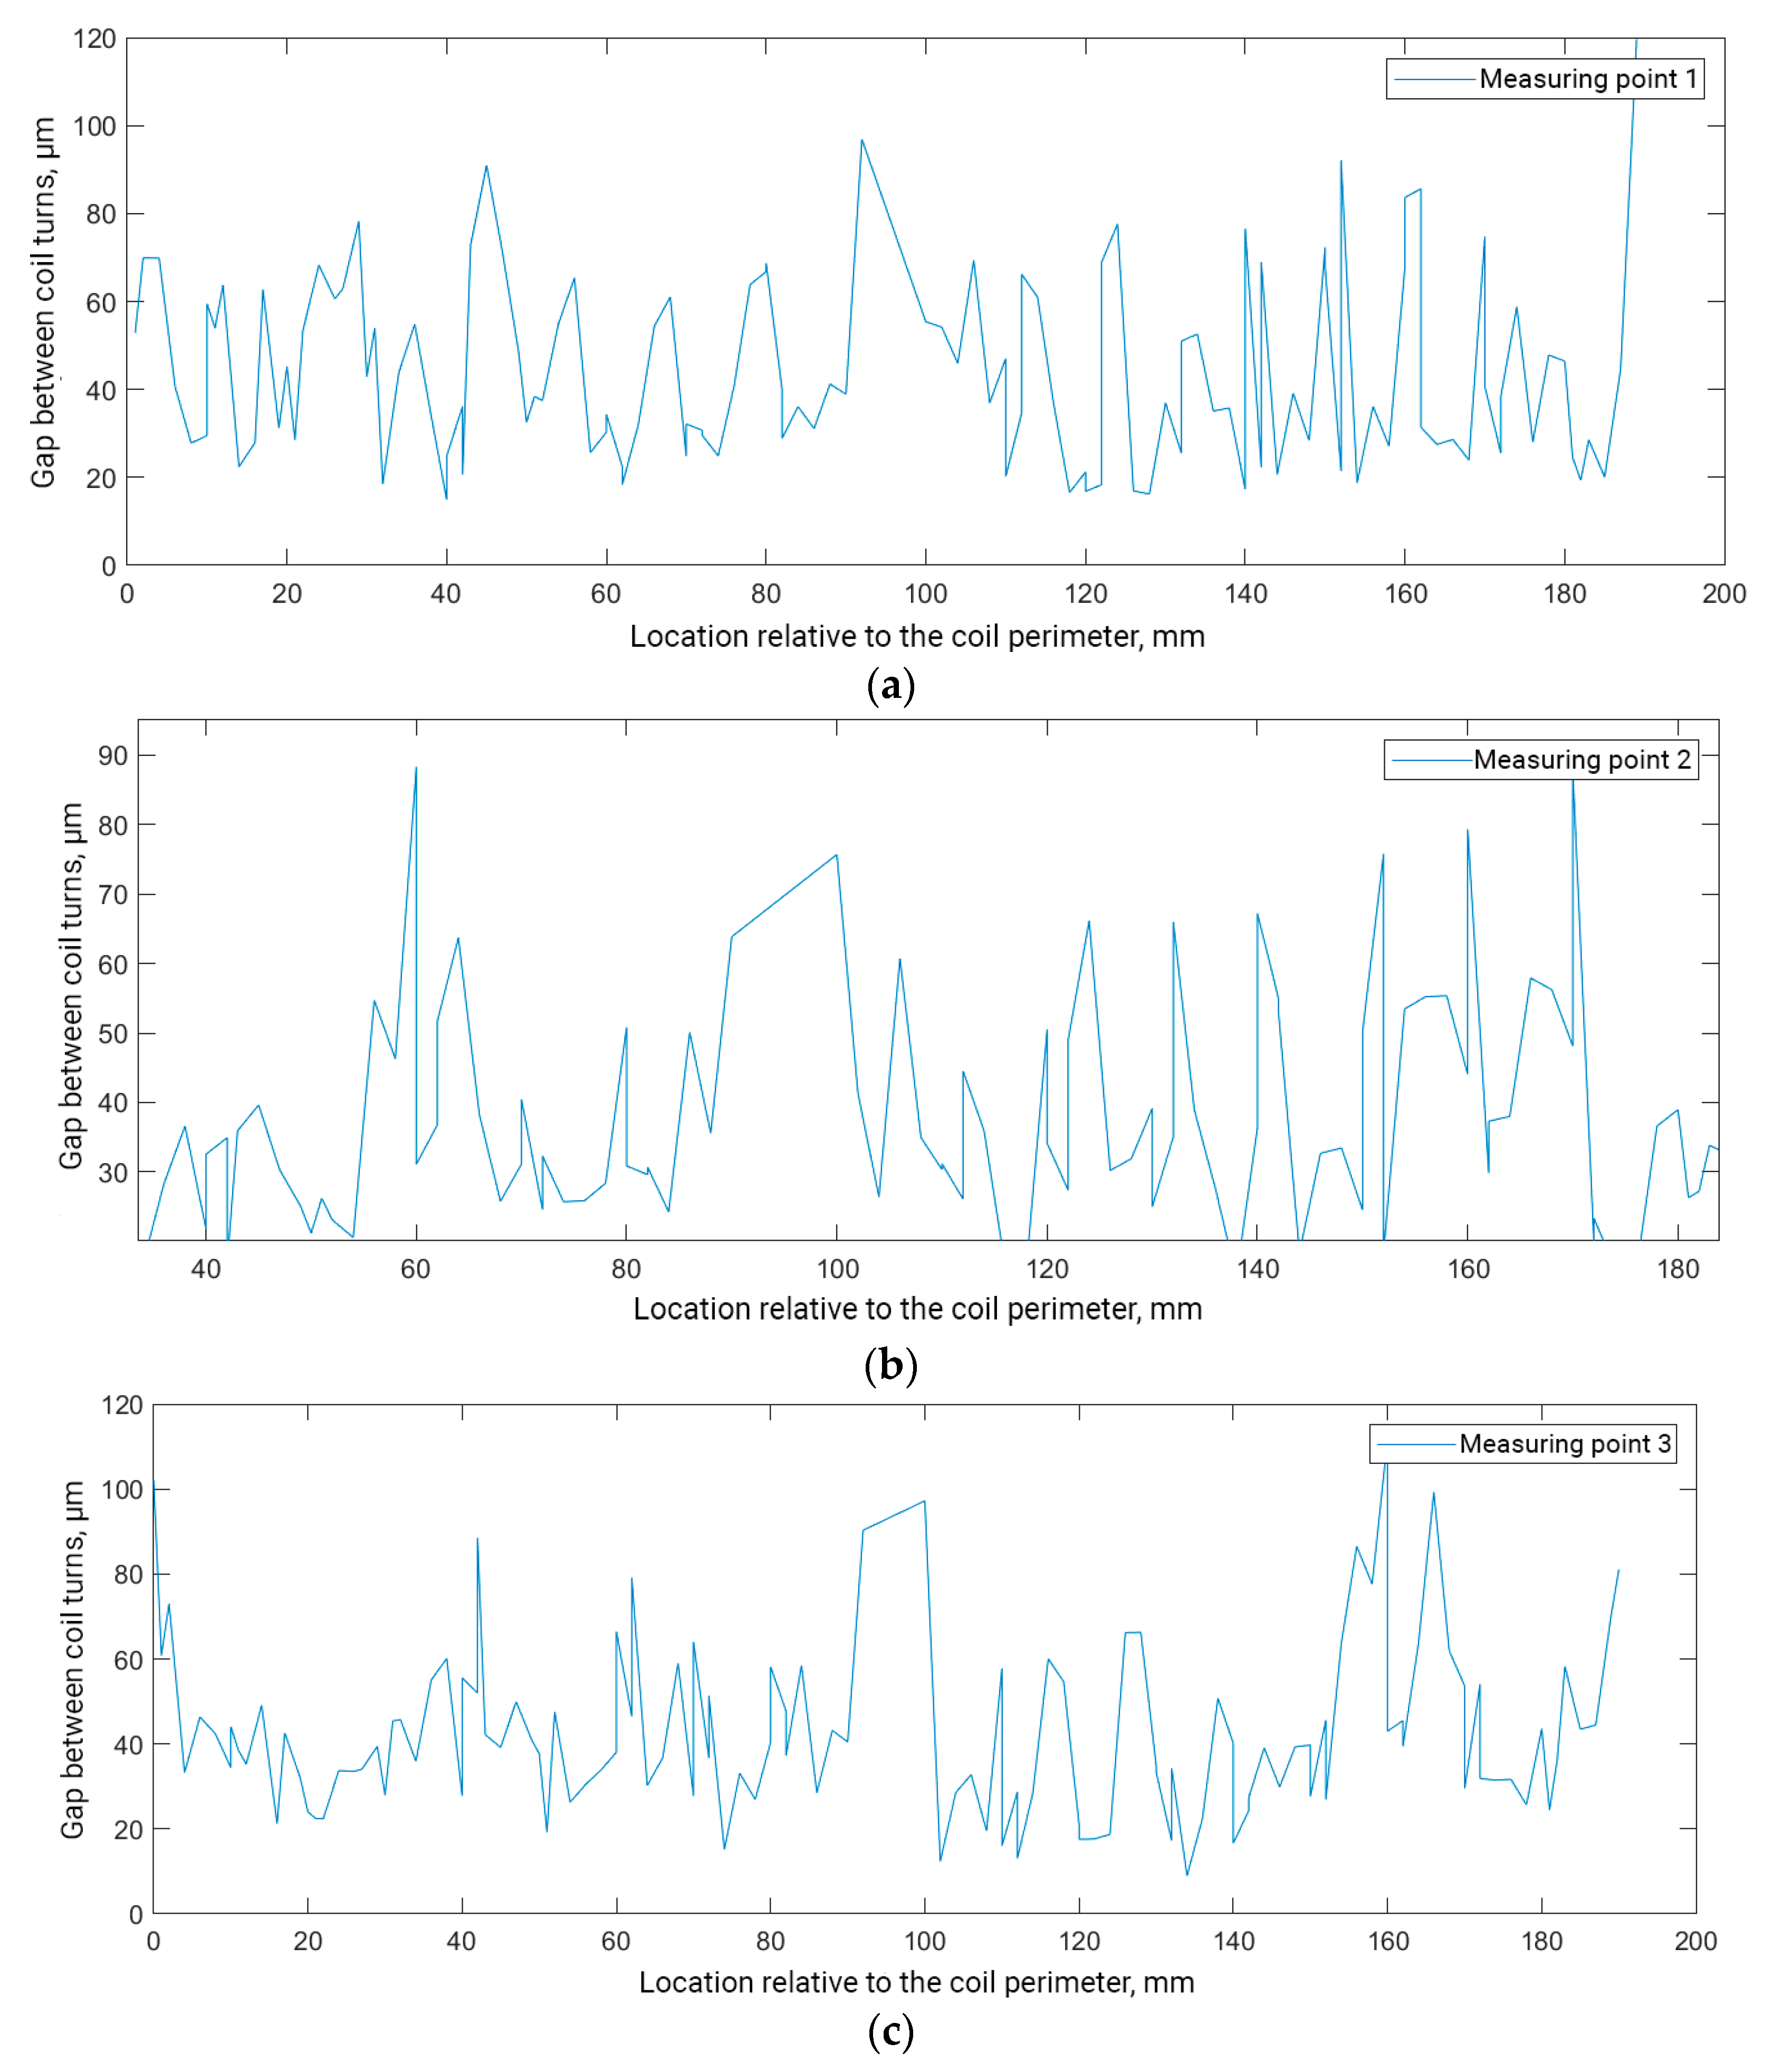
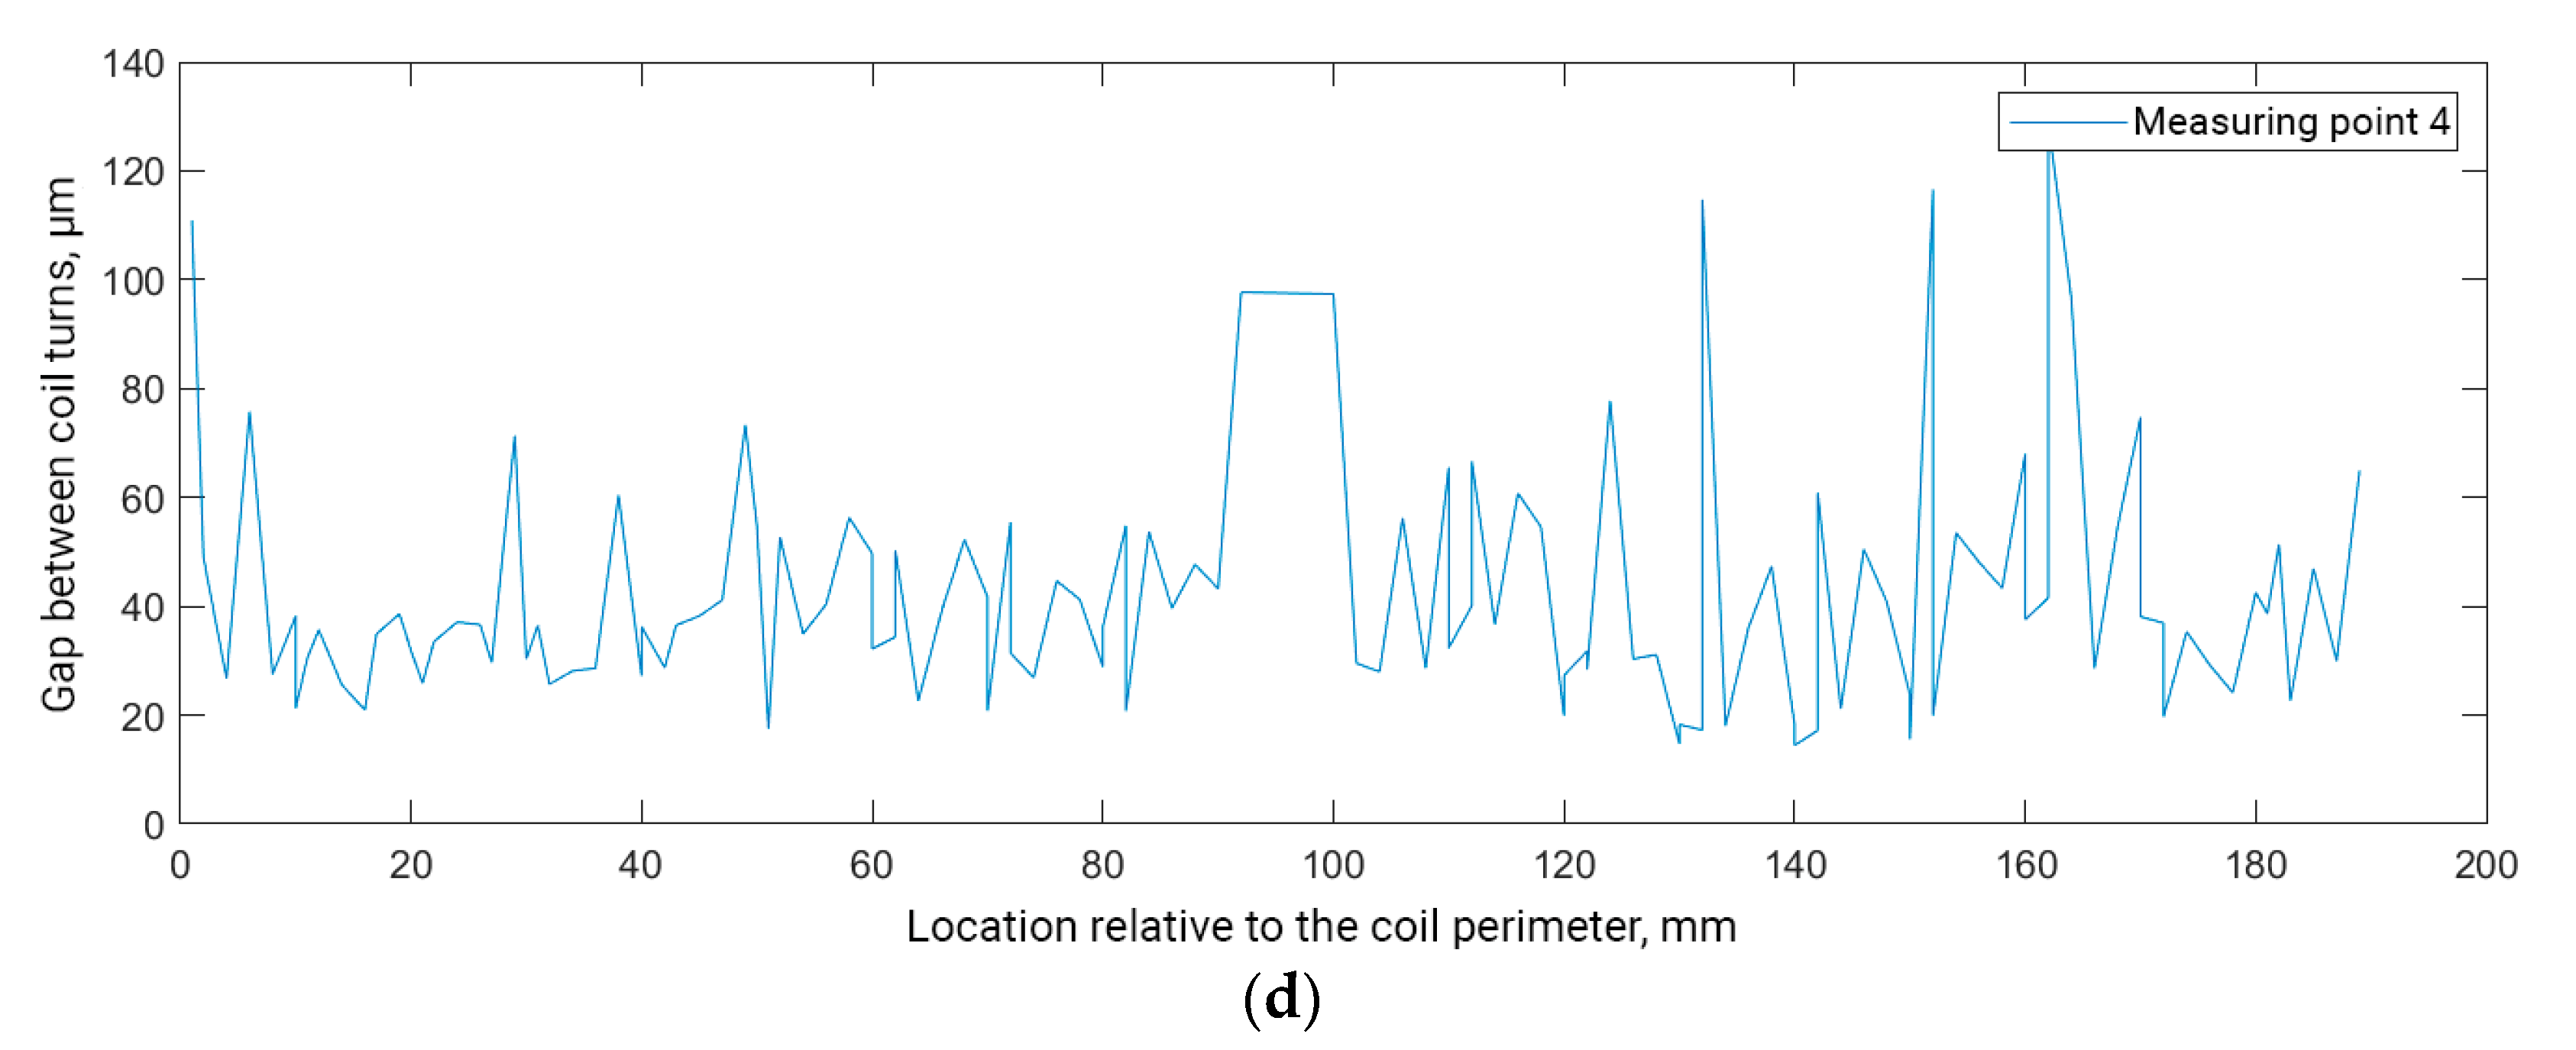
3.1. Graphs of Gaps between Turns of the Coil
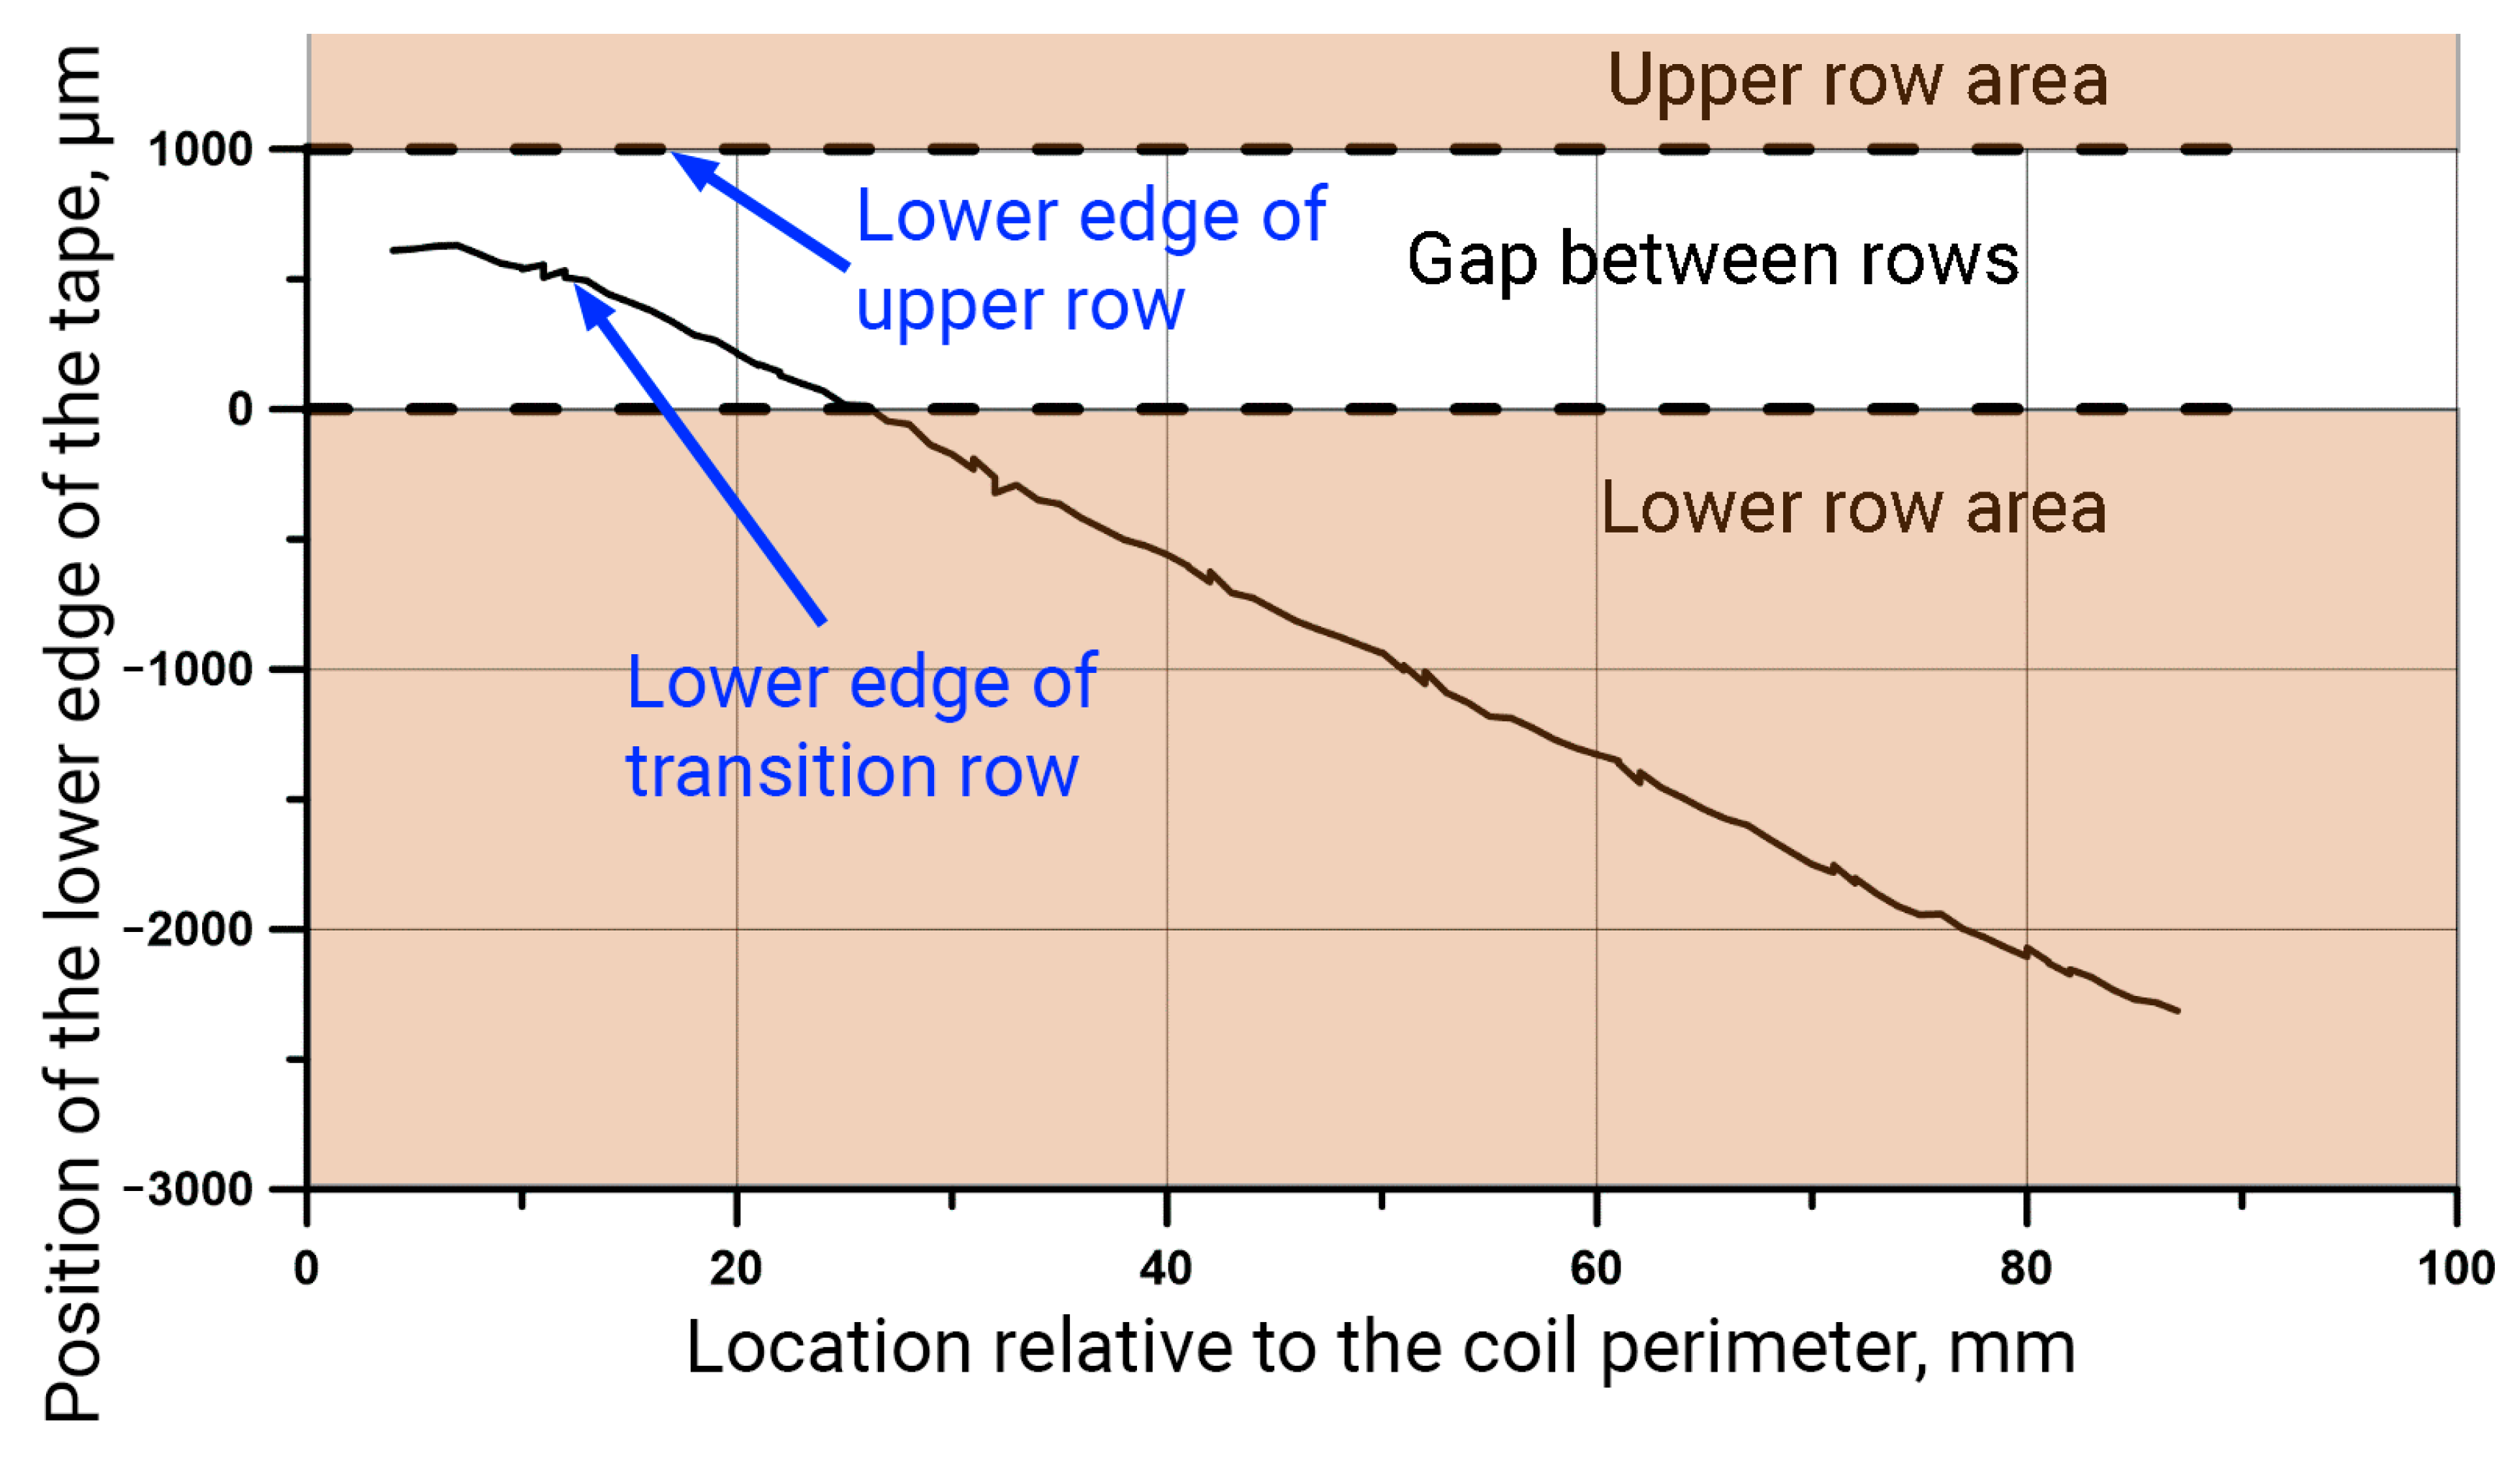
3.2. Graphs of the Location of the Transition Turn
4. Discussion
5. Conclusions
- For the studied coils, the interturn distances do not exceed 120 µm, which with a tape thickness of 100 µm corresponds to a fill factor of 0.5;
- Nonuniformity of the turn-to-turn gap may be caused by the uneven capture of the compound on the tape surface, which may occur due to insufficient wettability of the copper coating of the tape;
- In general, the graphs of the distance between the turns should be close to a straight line. At the same time, in the process of developing the technology, the permissible values of the gaps, as well as their standard deviations, should be formulated. The values will be controlled during the CT examination of the manufactured samples;
- The location of the transition turn is estimated in the comparison with the ideal position. For the three coils under study, some deviation from the ideal position is observed. A significant deviation can serve as an indicator of coil deformation and damaged HTS layer.
Author Contributions
Funding
Institutional Review Board Statement
Informed Consent Statement
Data Availability Statement
Conflicts of Interest
References
- Recent Advances in SuperOx 2G HTS Wire Manufacturing Facilities, Performance and Customisation; Ministry of Science and Higher Education of Russia: Moscow, Russia, 2020.
- Kozub, S.; Bogdanov, I.; Kashtanov, E.; Shuvalov, V.; Smirnov, V.; Sytnik, V.; Shcherbakov, P.; Tkachenko, L.; Dezhin, D.; Kovalev, K. HTS racetrack coils for electrical machines. Refrig. Sci. Technol. 2014, 2, 283–287. [Google Scholar]
- Zanegin, S.; Ivanov, N.; Shishov, D.; Kovalev, K.; Zubko, V. Manufacturing and Testing of AC HTS-2 Coil for Small Electrical Motor. J. Supercond. Nov. Magn. 2019, 33, 355–359. [Google Scholar] [CrossRef]
- Statra, Y.; Menana, H.; Belguerras, L.; Douine, B. A volume integral approach for the modelling and design of HTS coils. COMPEL Int. J. Comput. Math. Electr. Electron. Eng. 2019, 38, 1133–1140. [Google Scholar] [CrossRef]
- Kim, C.; Sung, H.-J.; Go, B.-S.; Sim, K.; Nam, G.D.; Kim, S.; Park, M. Design, Fabrication, and Testing of a Full-Scale HTS Coil for a 10 MW HTS Wind Power Generator. IEEE Trans. Appl. Supercond. 2021, 31, 1–5. [Google Scholar] [CrossRef]
- Statra, Y.; Menana, H.; Douine, B.; Lubin, T. Axial-Field Synchronous Machine With HTS Armature Windings: Realization and Preliminary Tests. IEEE Trans. Appl. Supercond. 2022, 32, 1–5. [Google Scholar] [CrossRef]
- Fu, W.; Wang, C.; Zhang, T.; Zhou, H.; Ling, J.; Li, M.; Bian, T.; Zhang, S.; Zhu, X.; An, S. Fabrication and Test of a 1:4 Scaled HTS Coil for the Defocusing Magnet of 2 GeV FFAG Accelerator. IEEE Trans. Appl. Supercond. 2022, 32, 1–4. [Google Scholar] [CrossRef]
- Abe, T.; Badel, A.; Okada, T.; Awaji, S.; Fujita, S.; Koki, T.; Iijima, Y.; Daibo, M. REBCO coil with robust behavior against local defects wound using two-tape bundle. IEEE Trans. Appl. Supercond. 2022, 32, 1–6. [Google Scholar] [CrossRef]
- Lu, L.; Wu, W.; Yu, X.; Jin, Z. High-Temperature Superconducting Non-Insulation Closed-Loop Coils for Electro-Dynamic Suspension System. Electronics 2021, 10, 1980. [Google Scholar] [CrossRef]
- High-Temperature Superconducting Wire Critical Current Database. Available online: http://htsdb.wimbush.eu/ (accessed on 26 April 2022).
- Wang, Y.S. Keynote talk Review of AC loss measuring methods for HTS tape and unit. IEEE Int. Conf. Appl. Supercond. Electromagn. Devices 2013, 1, 534. [Google Scholar] [CrossRef]
- Warr, R.; Jewell, M.C.; Mitchell, N.; Rack, A.; Swanson, J.; Tronza, V.; Cernik, R. High-energy synchrotron X-ray tomography coupled with digital image correlation highlights likely failure points inside ITER toroidal field conductors. Sci. Rep. 2021, 11, 1–8. [Google Scholar] [CrossRef] [PubMed]
- Bagni, T.; Bovone, G.; Rack, A.; Mauro, D.; Barth, C.; Matera, D.; Buta, F.; Senatore, C. Machine learning applied to X-ray tomography as a new tool to analyze the voids in RRP Nb3Sn wires. Sci. Rep. 2021, 11, 1–14. [Google Scholar] [CrossRef] [PubMed]
- Antoncík, F.; Jankovský, O.; Hlásek, T.; Bartunek, V. Nanosized Pinning Centers in the Rare Earth-Barium-Copper-Oxide Thin-Film Superconductors. Nanomaterials 2020, 10, 1429. [Google Scholar] [CrossRef] [PubMed]
- Loctite Stycast 2850FT. Technical Data Sheet. Available online: https://tdsna.henkel.com/NA/UT/HNAUTTDS.nsf/web/35541AEFDE6FDF8485257576004480E6/$File/STYCAST2850FT-EN.pdf (accessed on 26 April 2022).
- Ida, N.; Meyendorf, N. Handbook of Advanced Nondestructive Evaluation; Springer: Cham, Switzerland, 2019; p. 1036. [Google Scholar] [CrossRef]
- Vásárhelyi, L.; Kónya, Z.; Kukovecz, Á.; Vajtai, R. Microcomputed tomography–based characterization of advanced materials: A review. Mater. Today Adv. 2020, 8, 100084. [Google Scholar] [CrossRef]
- Carmignato, S.; Dewulf, W.; Leach, R. Industrial X-ray Computed Tomography; Springer: Berlin/Heidelberg, Germany, 2018; ISBN 978-3-319-59573-3. [Google Scholar] [CrossRef]
- Frank, N. The Mathematics of Computerized Tomography. In Classics in Applied Mathematics, 1st ed.; Society for Industrial Mathematics: Philadelphia, PA, USA, 2001; p. 184. [Google Scholar] [CrossRef]
- Frank, N.; Frank, W. Mathematical Methods in Image Reconstruction. In Monographs on Mathematical Modeling and Computation; Society for Industrial Mathematics: Philadelphia, PA, USA, 2001; p. 228. [Google Scholar] [CrossRef]
- Orekhov, A.A.; Ripetskiy, A.V.; Fedoseev, D.V. Surface Roughness Assessment Based On Discrete Model Representation For Additive Manufactured Parts. Periódico Tchê Química 2018, 15, 514. [Google Scholar]


| HTS Tape Manufacturer | SuperOX, 4 mm, Substrate 60 µm, Copper 5 µm |
|---|---|
| Insulation | Polyimide |
| Coil type | Double pancake |
| Number of turns | 12 |
| Axial length, mm | 100 |
| Critical current at 77K, A: | |
| Short sample in own field | 150 |
| Coil #1 | 93 |
| Coil #2 | 95 |
| Coil #3 | 97 |
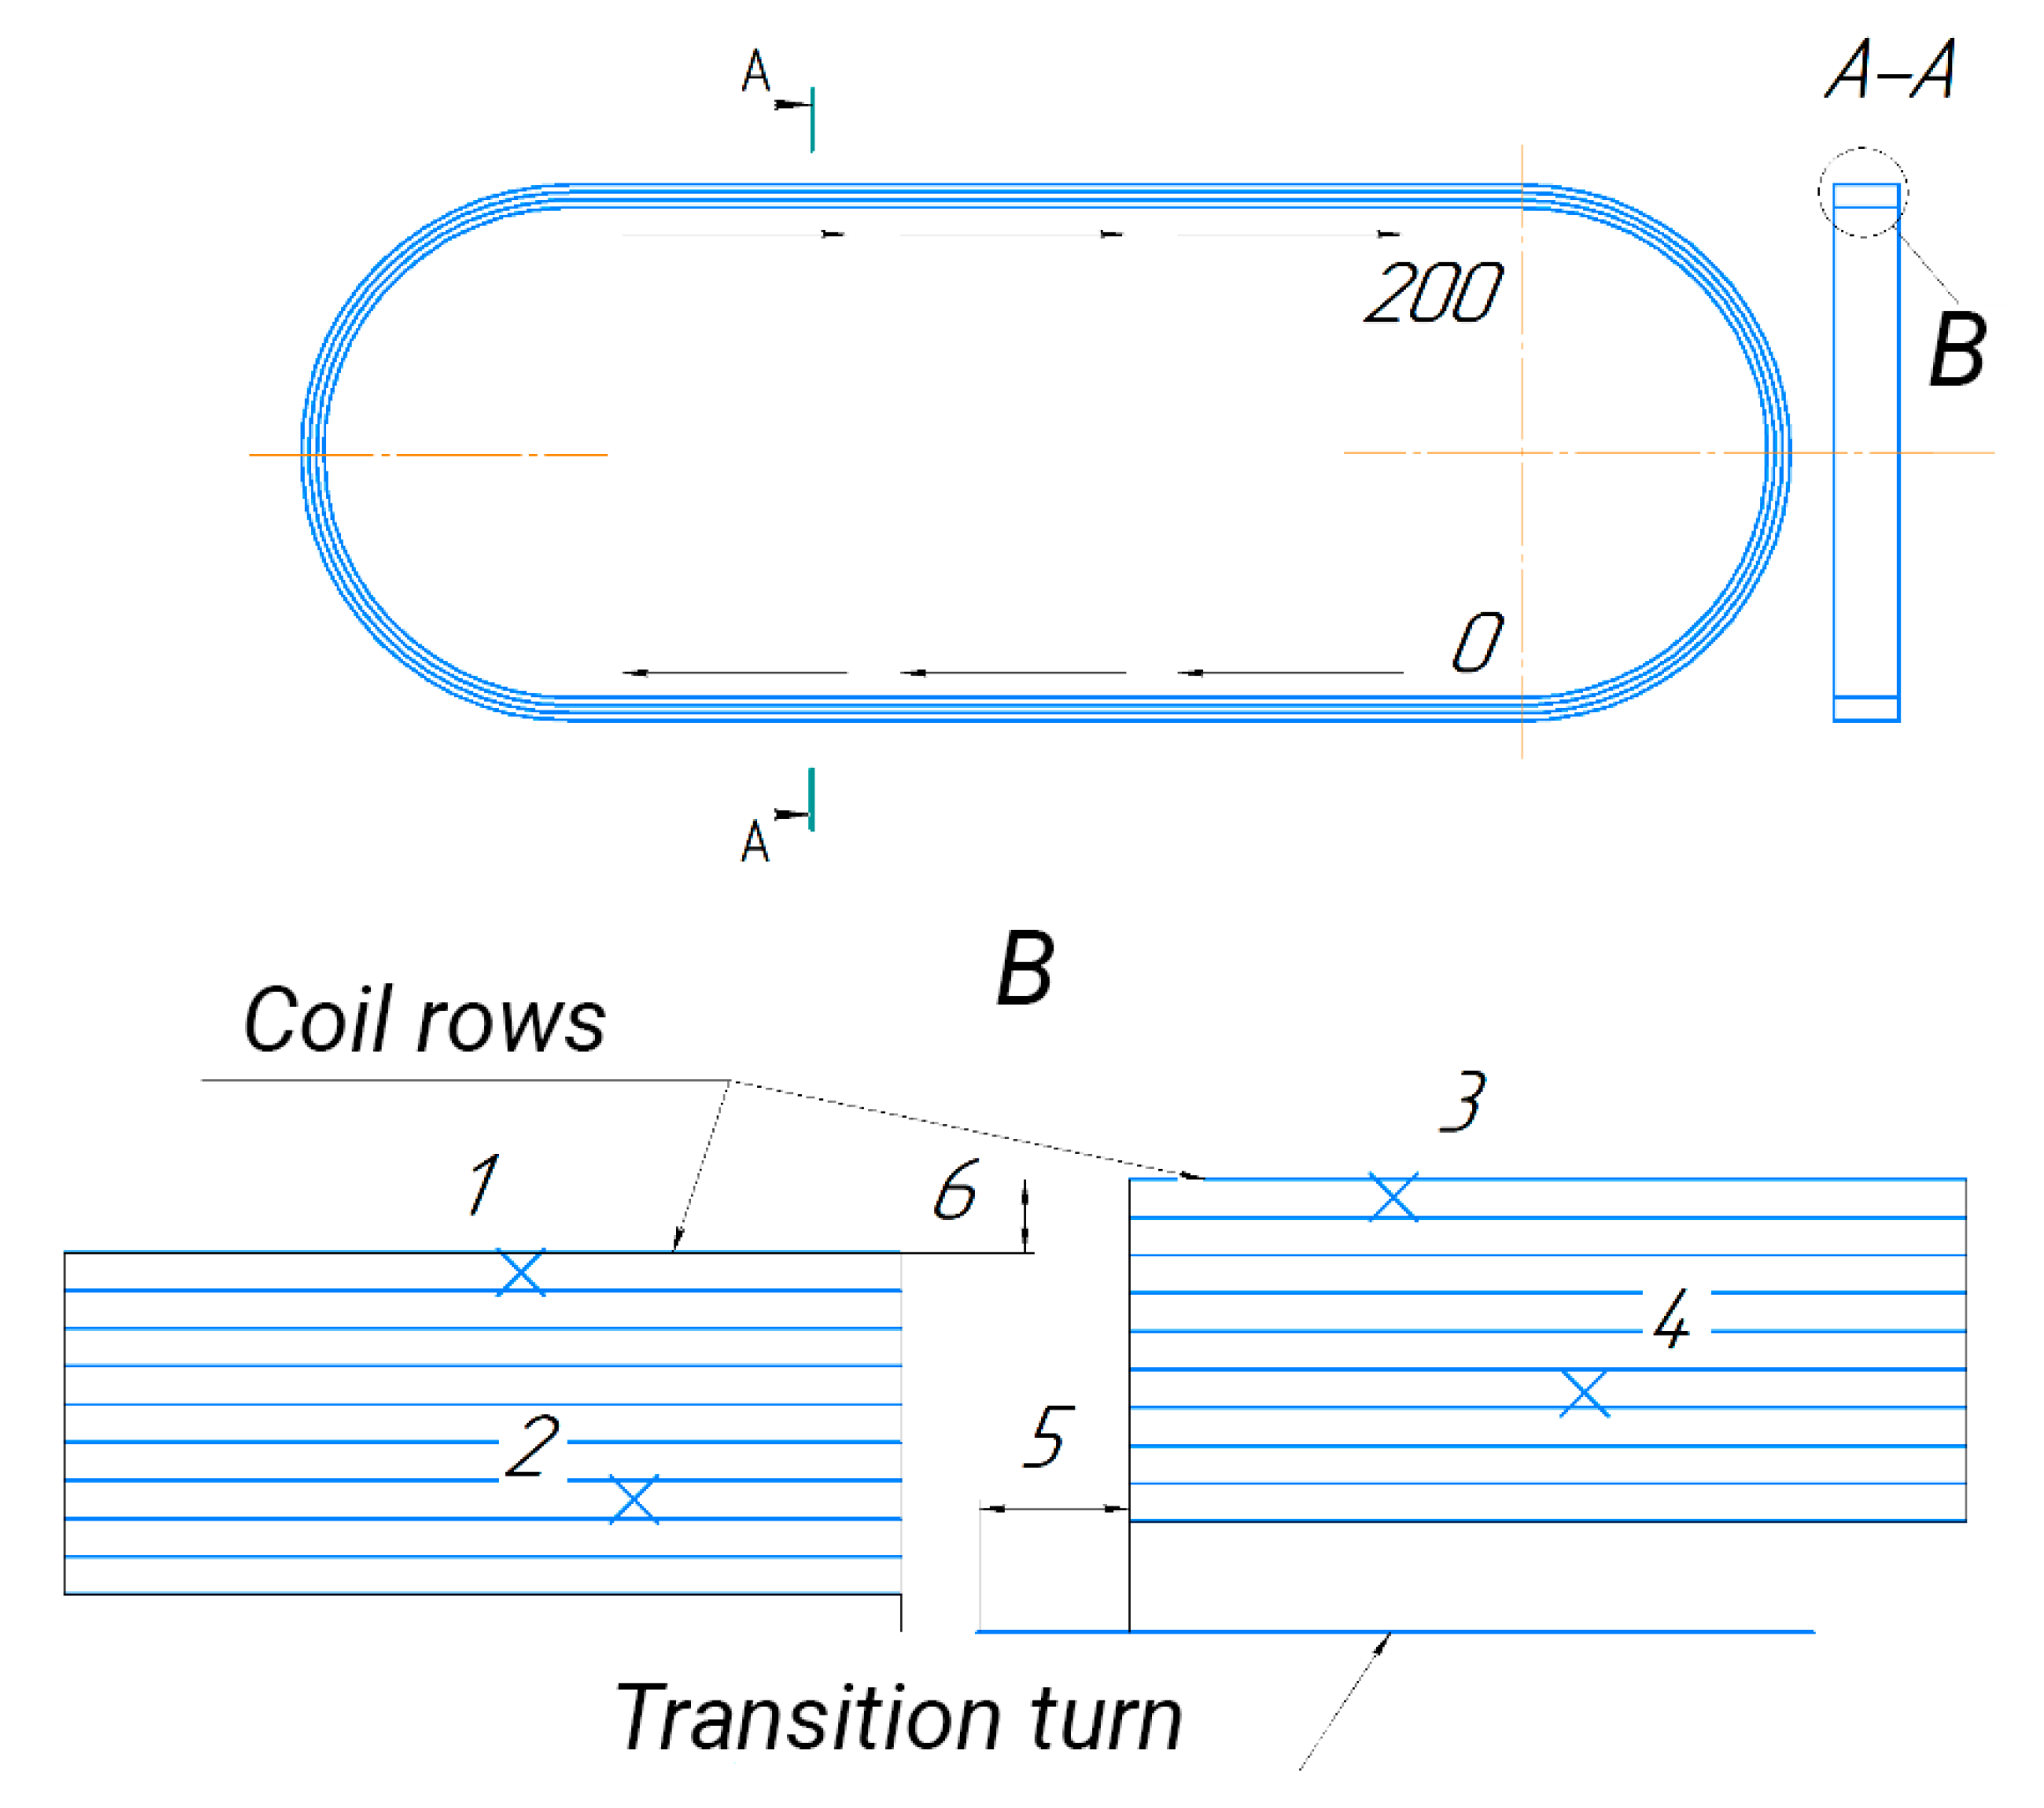
| Description | Designation in Figure 6 | Designation in Figure 7 |
|---|---|---|
| Places for measuring the distance between adjacent turns in different parts of the coil | 1, 2, 3, 4 | «Distance 1», «Distance 2», «Distance 3», «Distance 4» |
| Place for measuring the position of the transition turn relative to one side of the coil | 5 | «Caliper 1» |
| Place for measuring the relative distance between the two layers of the coil | 6 | «Caliper 2» |
Publisher’s Note: MDPI stays neutral with regard to jurisdictional claims in published maps and institutional affiliations. |
© 2022 by the authors. Licensee MDPI, Basel, Switzerland. This article is an open access article distributed under the terms and conditions of the Creative Commons Attribution (CC BY) license (https://creativecommons.org/licenses/by/4.0/).
Share and Cite
Minasyan, V.B.; Ivanov, N.S.; Malykh, E.A.; Zanegin, Y.A.; Douine, B. The Application of X-ray Micro-CT in the Study of HTS Tape Coils. Inventions 2022, 7, 60. https://doi.org/10.3390/inventions7030060
Minasyan VB, Ivanov NS, Malykh EA, Zanegin YA, Douine B. The Application of X-ray Micro-CT in the Study of HTS Tape Coils. Inventions. 2022; 7(3):60. https://doi.org/10.3390/inventions7030060
Chicago/Turabian StyleMinasyan, Vitaly B., Nikolay S. Ivanov, Elizaveta A. Malykh, Yuri A. Zanegin, and Bruno Douine. 2022. "The Application of X-ray Micro-CT in the Study of HTS Tape Coils" Inventions 7, no. 3: 60. https://doi.org/10.3390/inventions7030060
APA StyleMinasyan, V. B., Ivanov, N. S., Malykh, E. A., Zanegin, Y. A., & Douine, B. (2022). The Application of X-ray Micro-CT in the Study of HTS Tape Coils. Inventions, 7(3), 60. https://doi.org/10.3390/inventions7030060