
Identification and Classification of the Tea Samples by Using Sensory Mechanism and Arduino UNO


Abstract
:1. Introduction
2. Materials and Methods
2.1. Research Problem
2.2. Research Objective of This Study
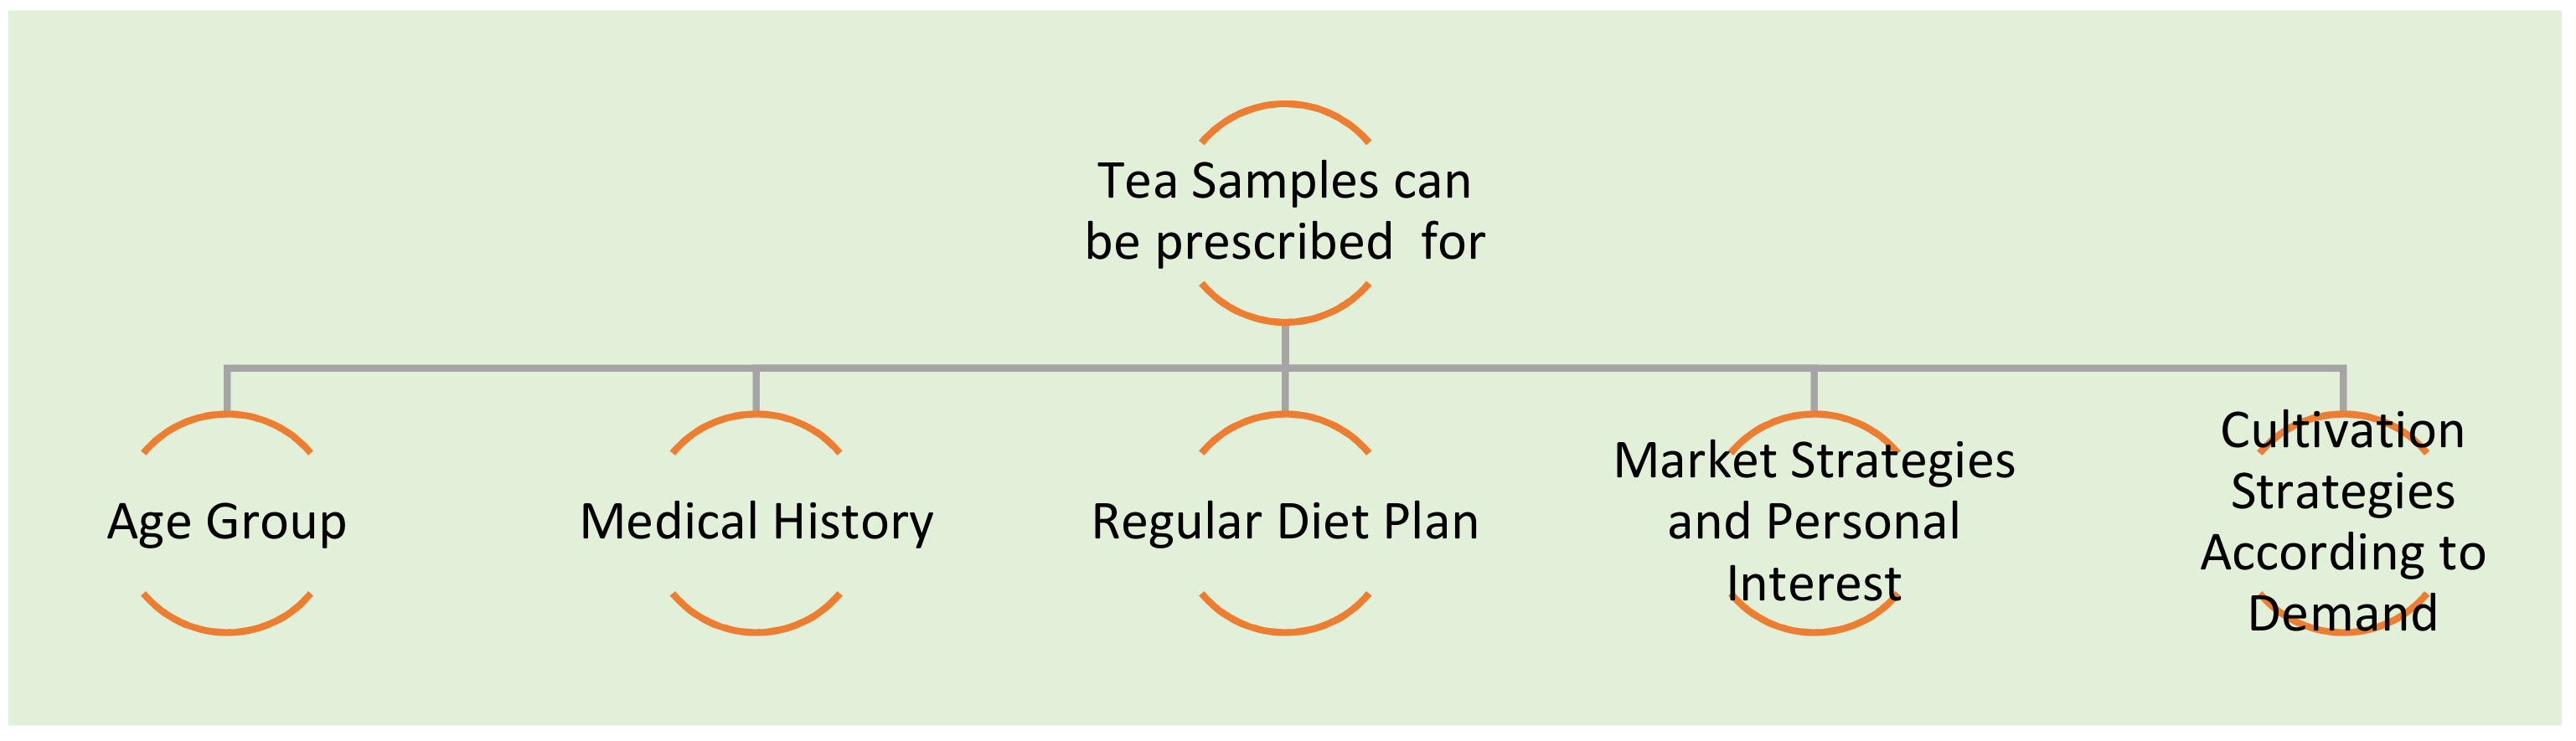
- Thatwill classify the tea samples—and recommend the tea for the specific health diet based on its pH level.
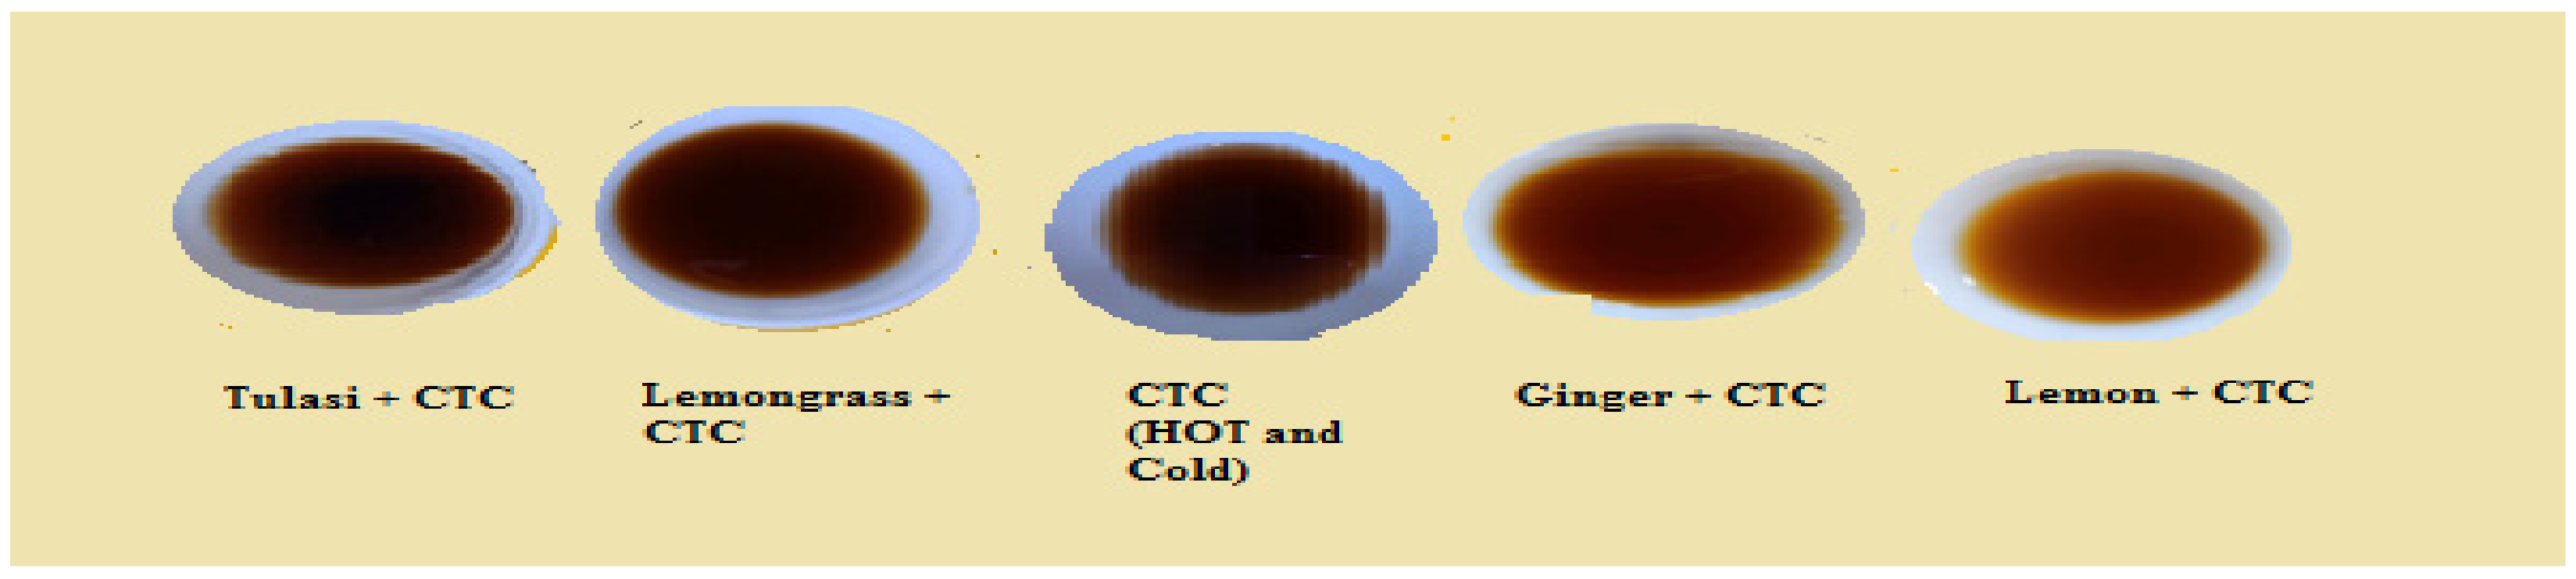
- Thatwill find the effects of additives such as lemon, ginger, lemongrass, etc. on tea pH value.
- It will give early intimation for the quantity that tea lovers can consume.
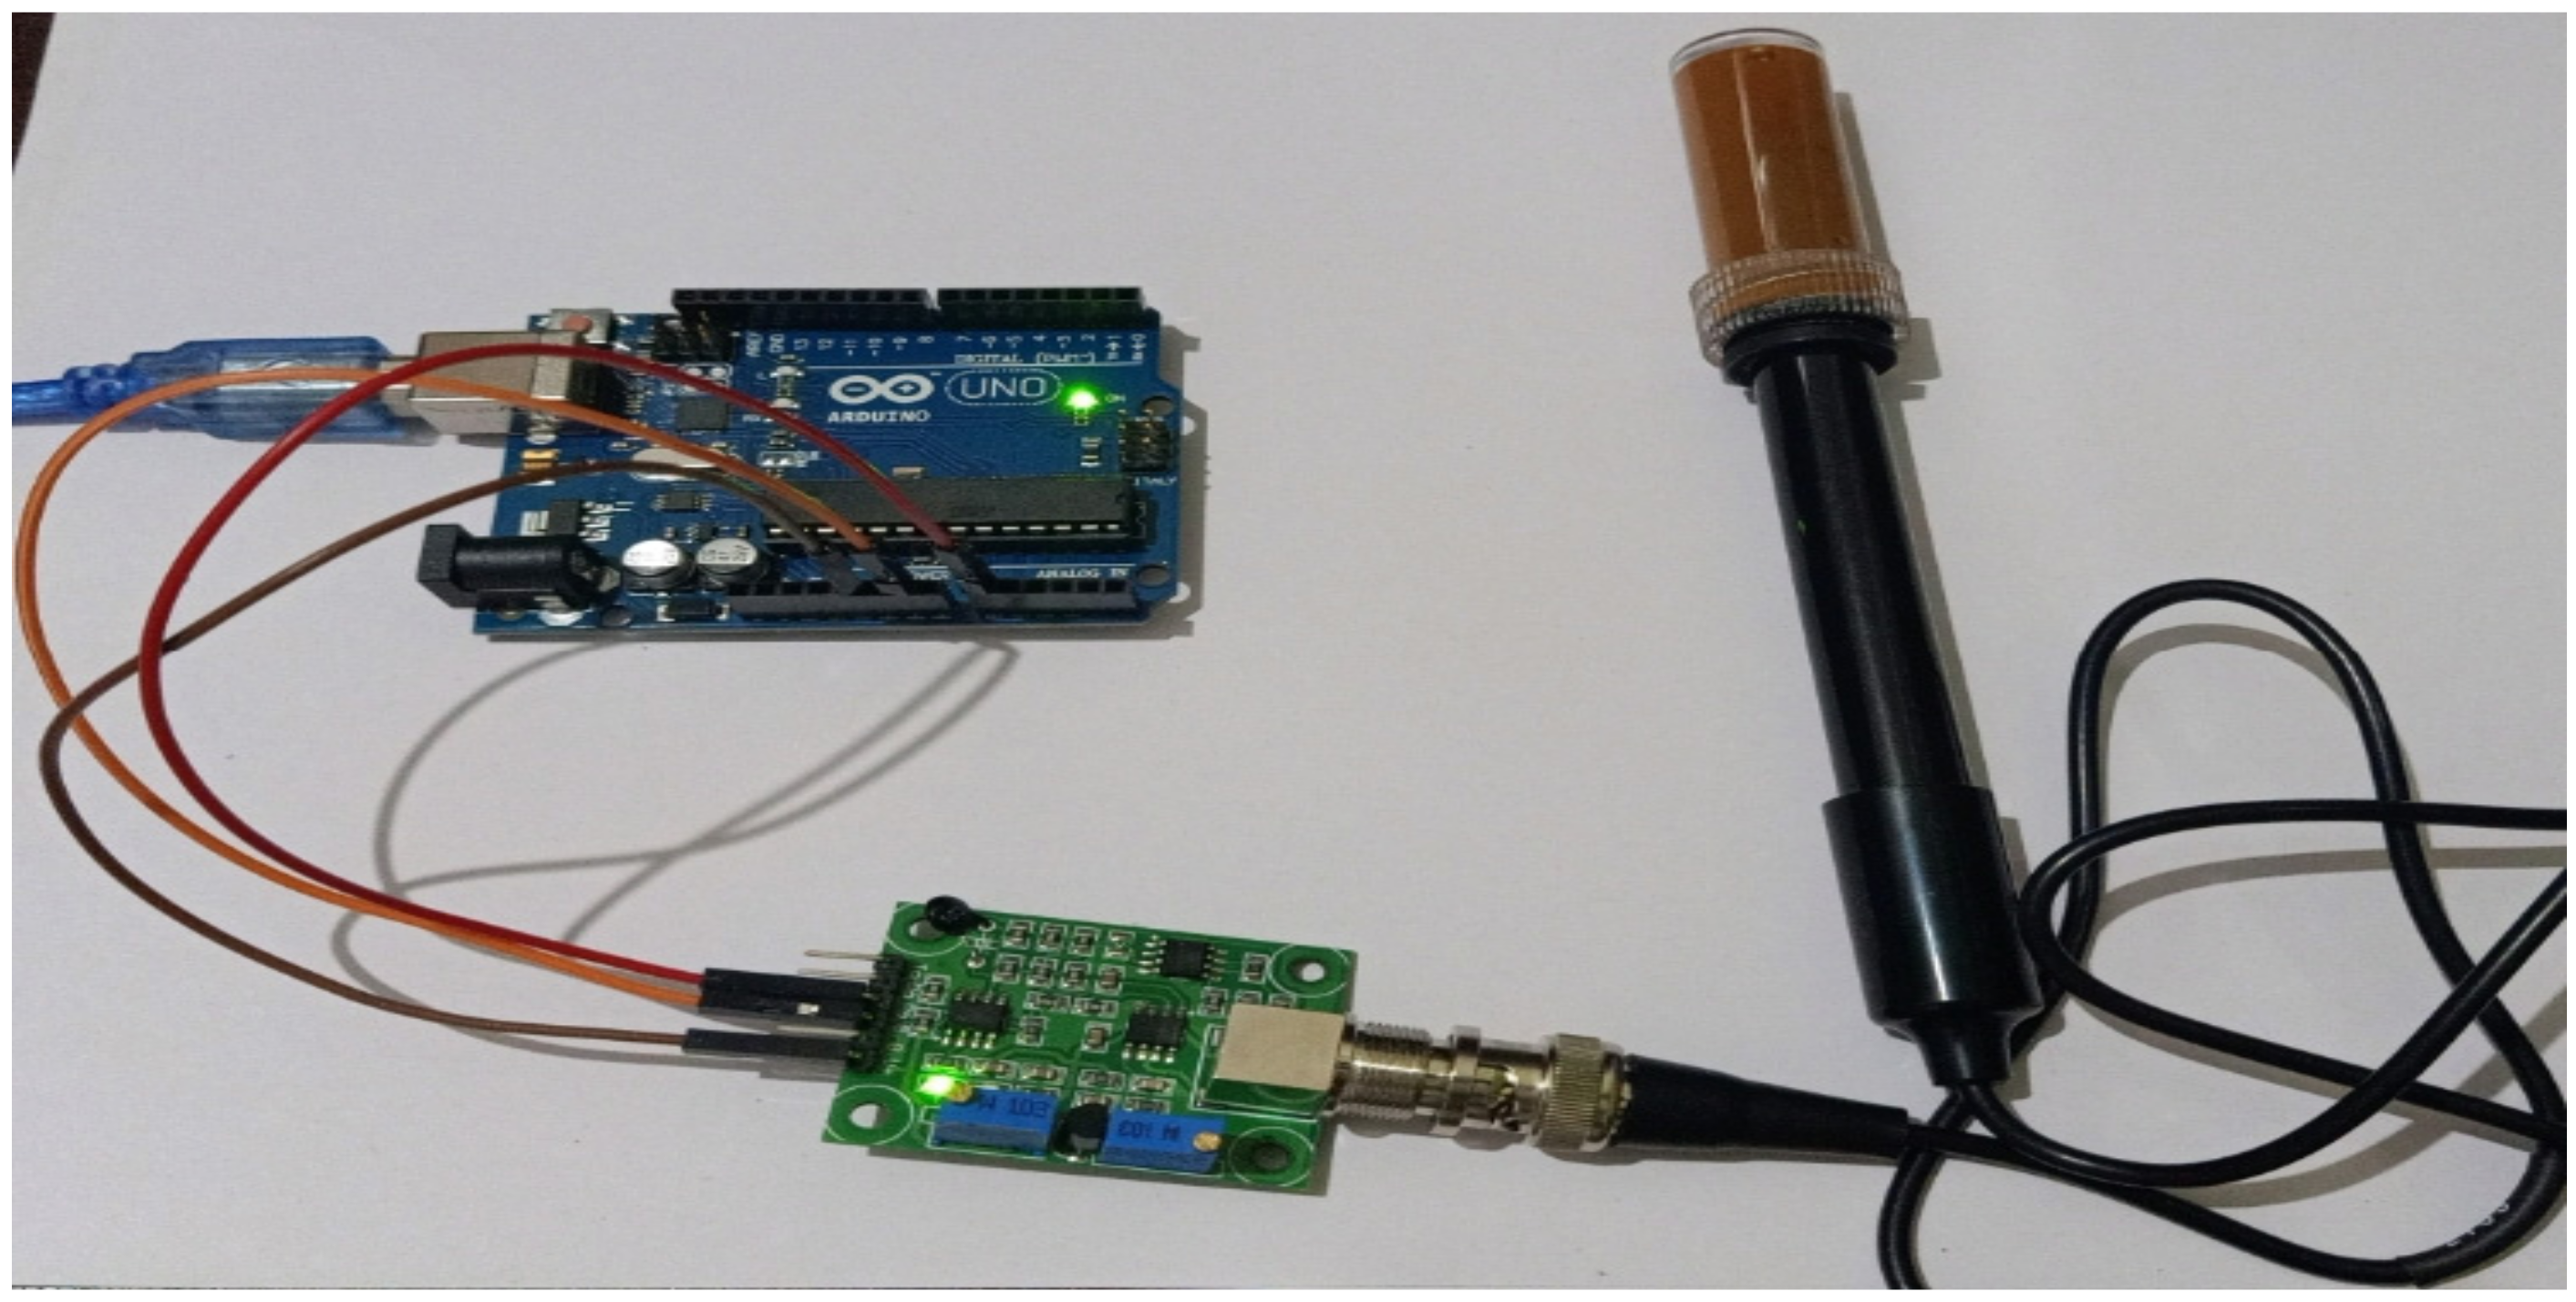
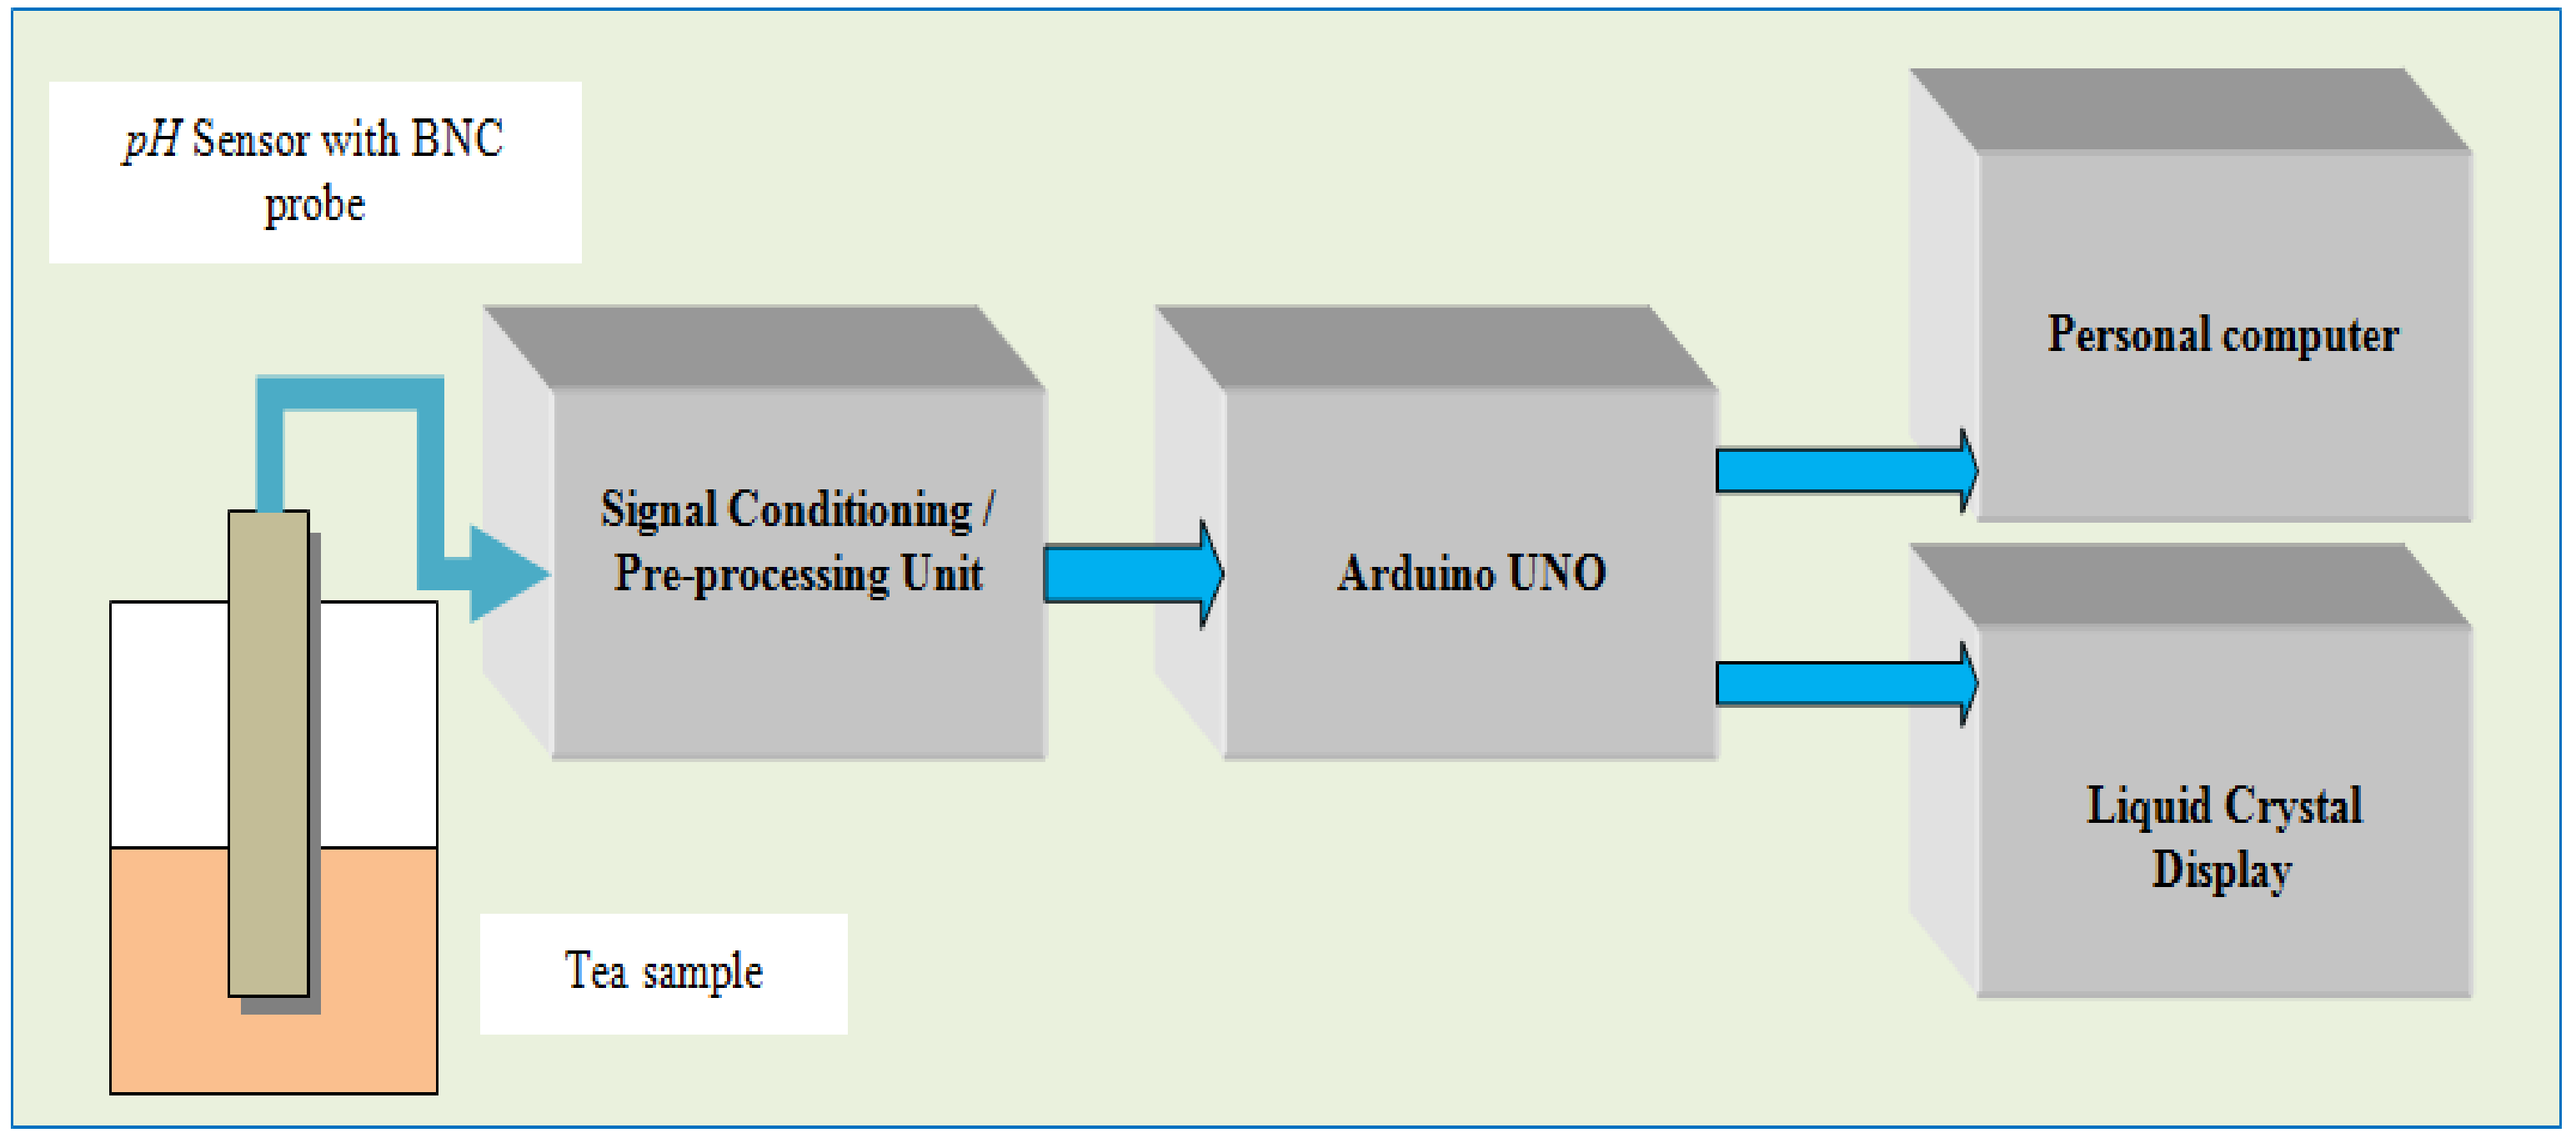
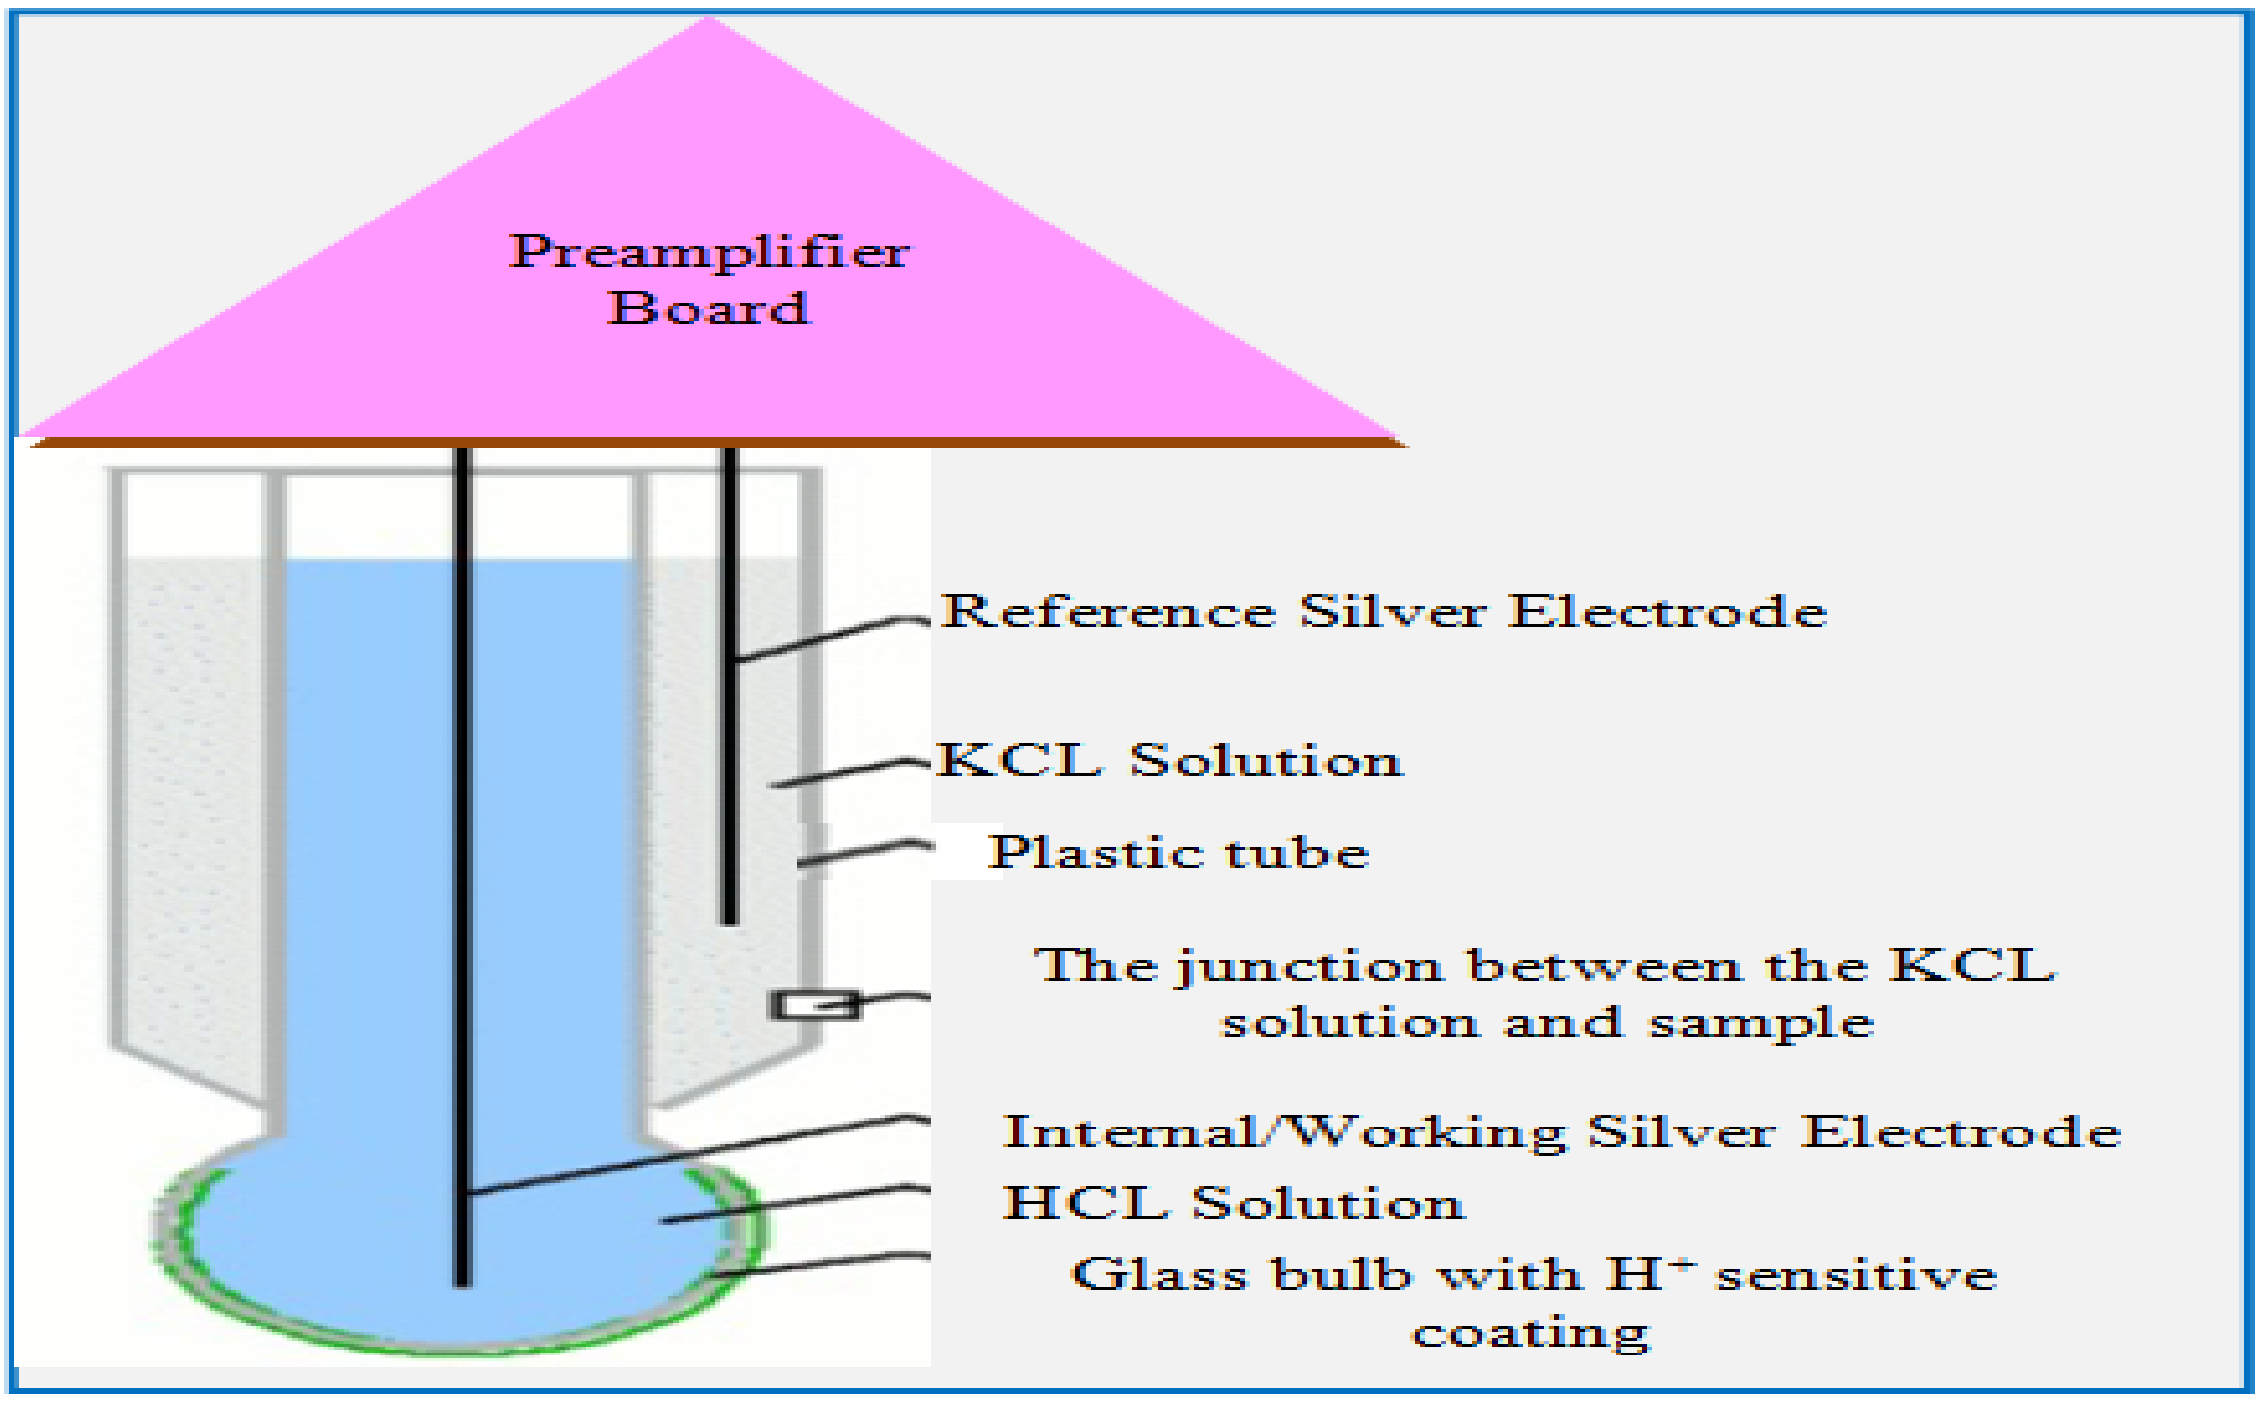
2.3. The pH Sensor and Its Principle
2.3.1. The pH Sensor Plastic Tube
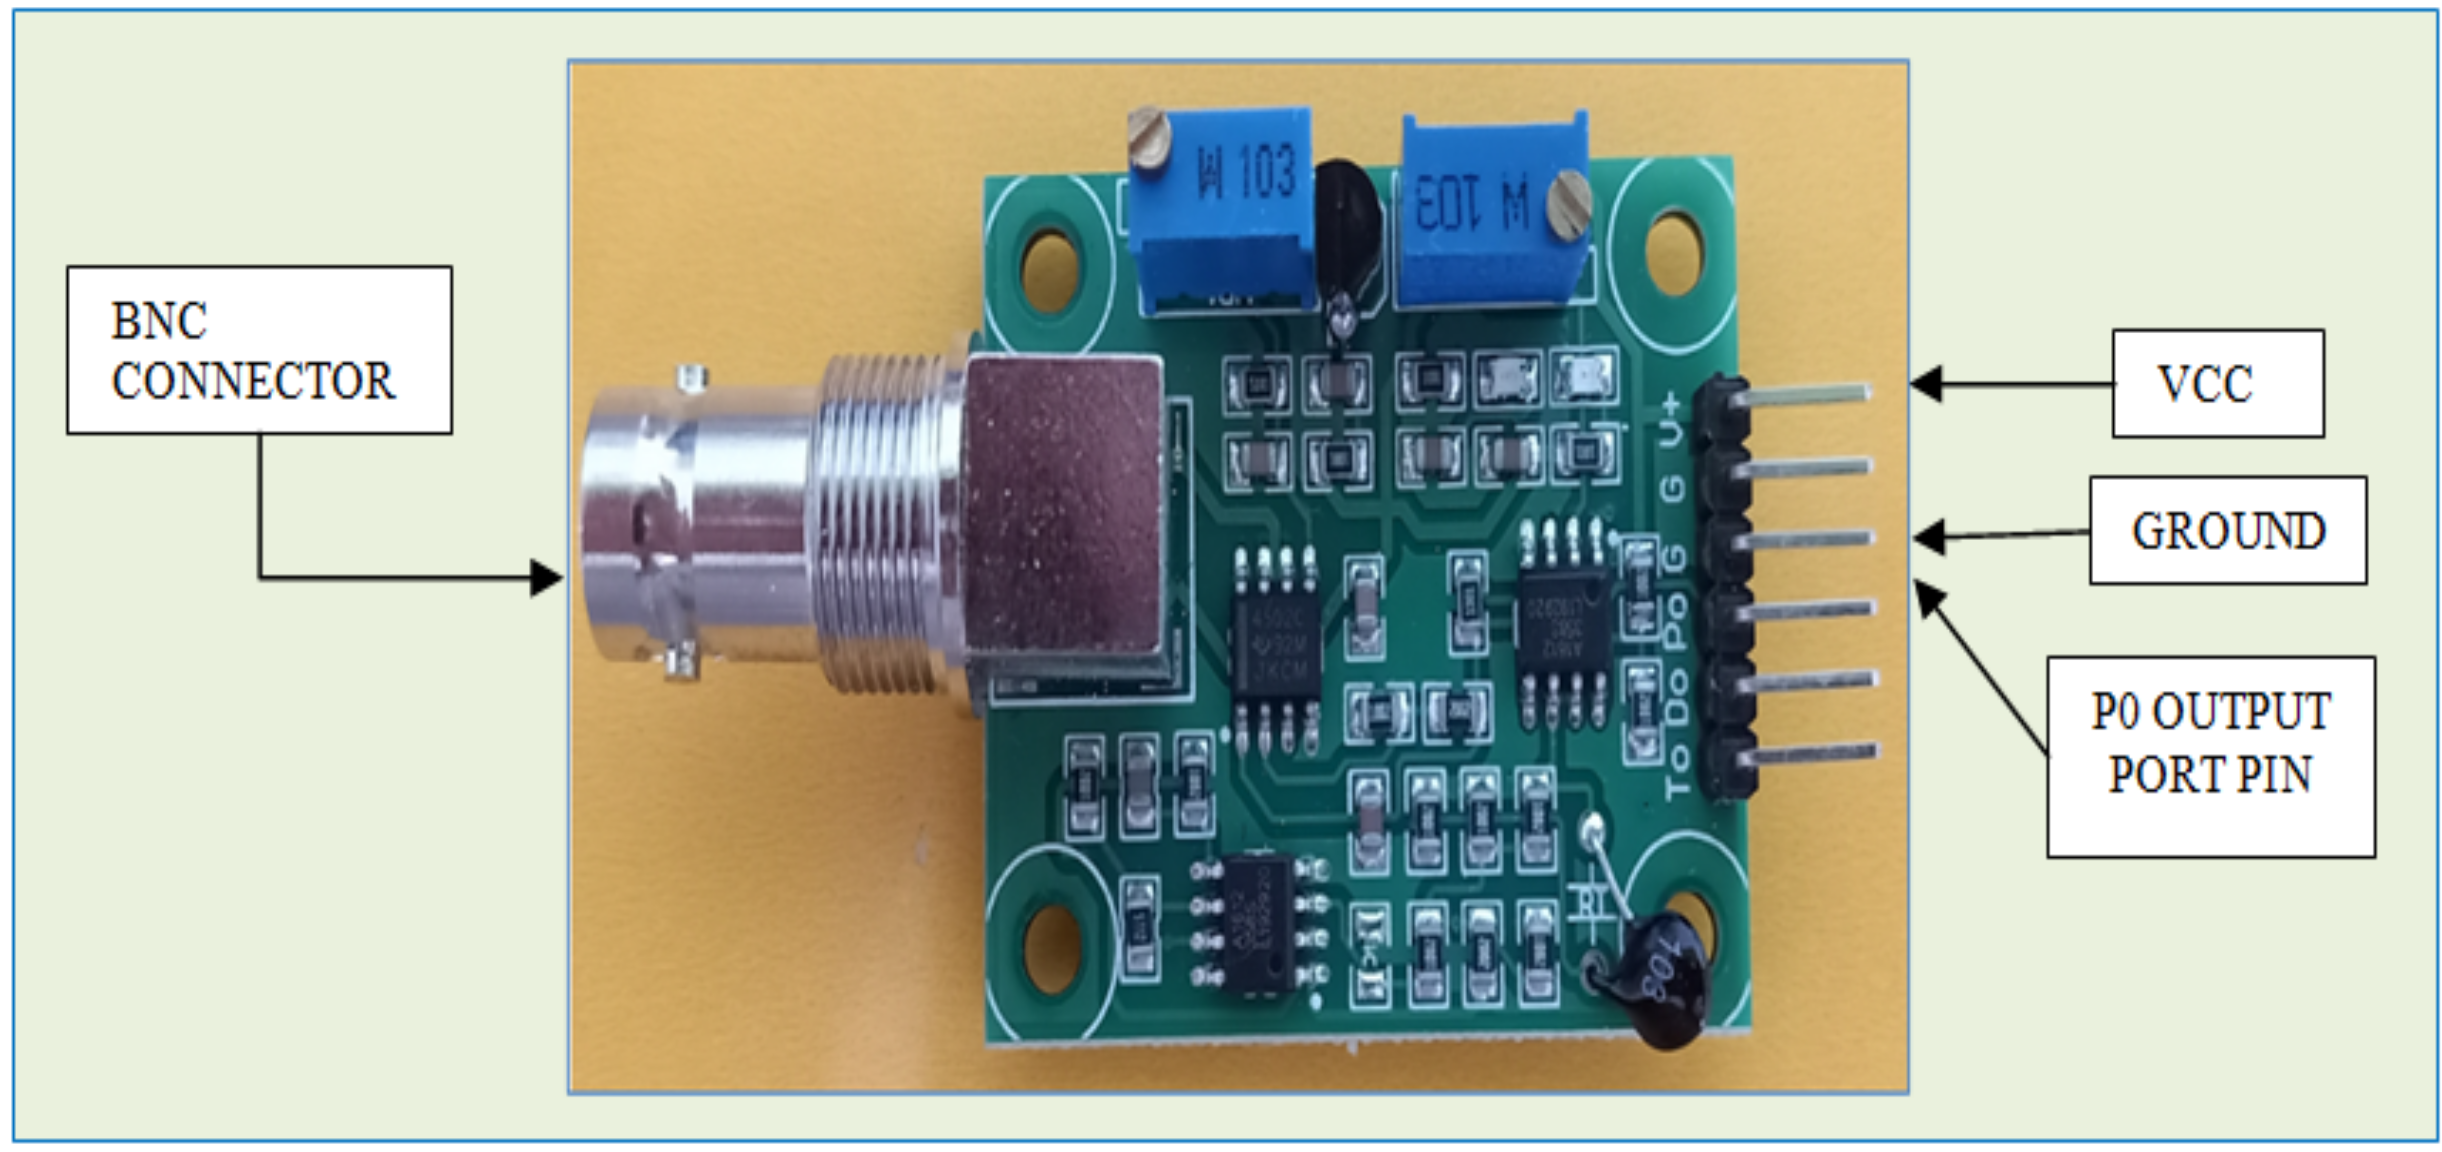
2.3.2. Signal Conditioning and Pre-Processing Unit
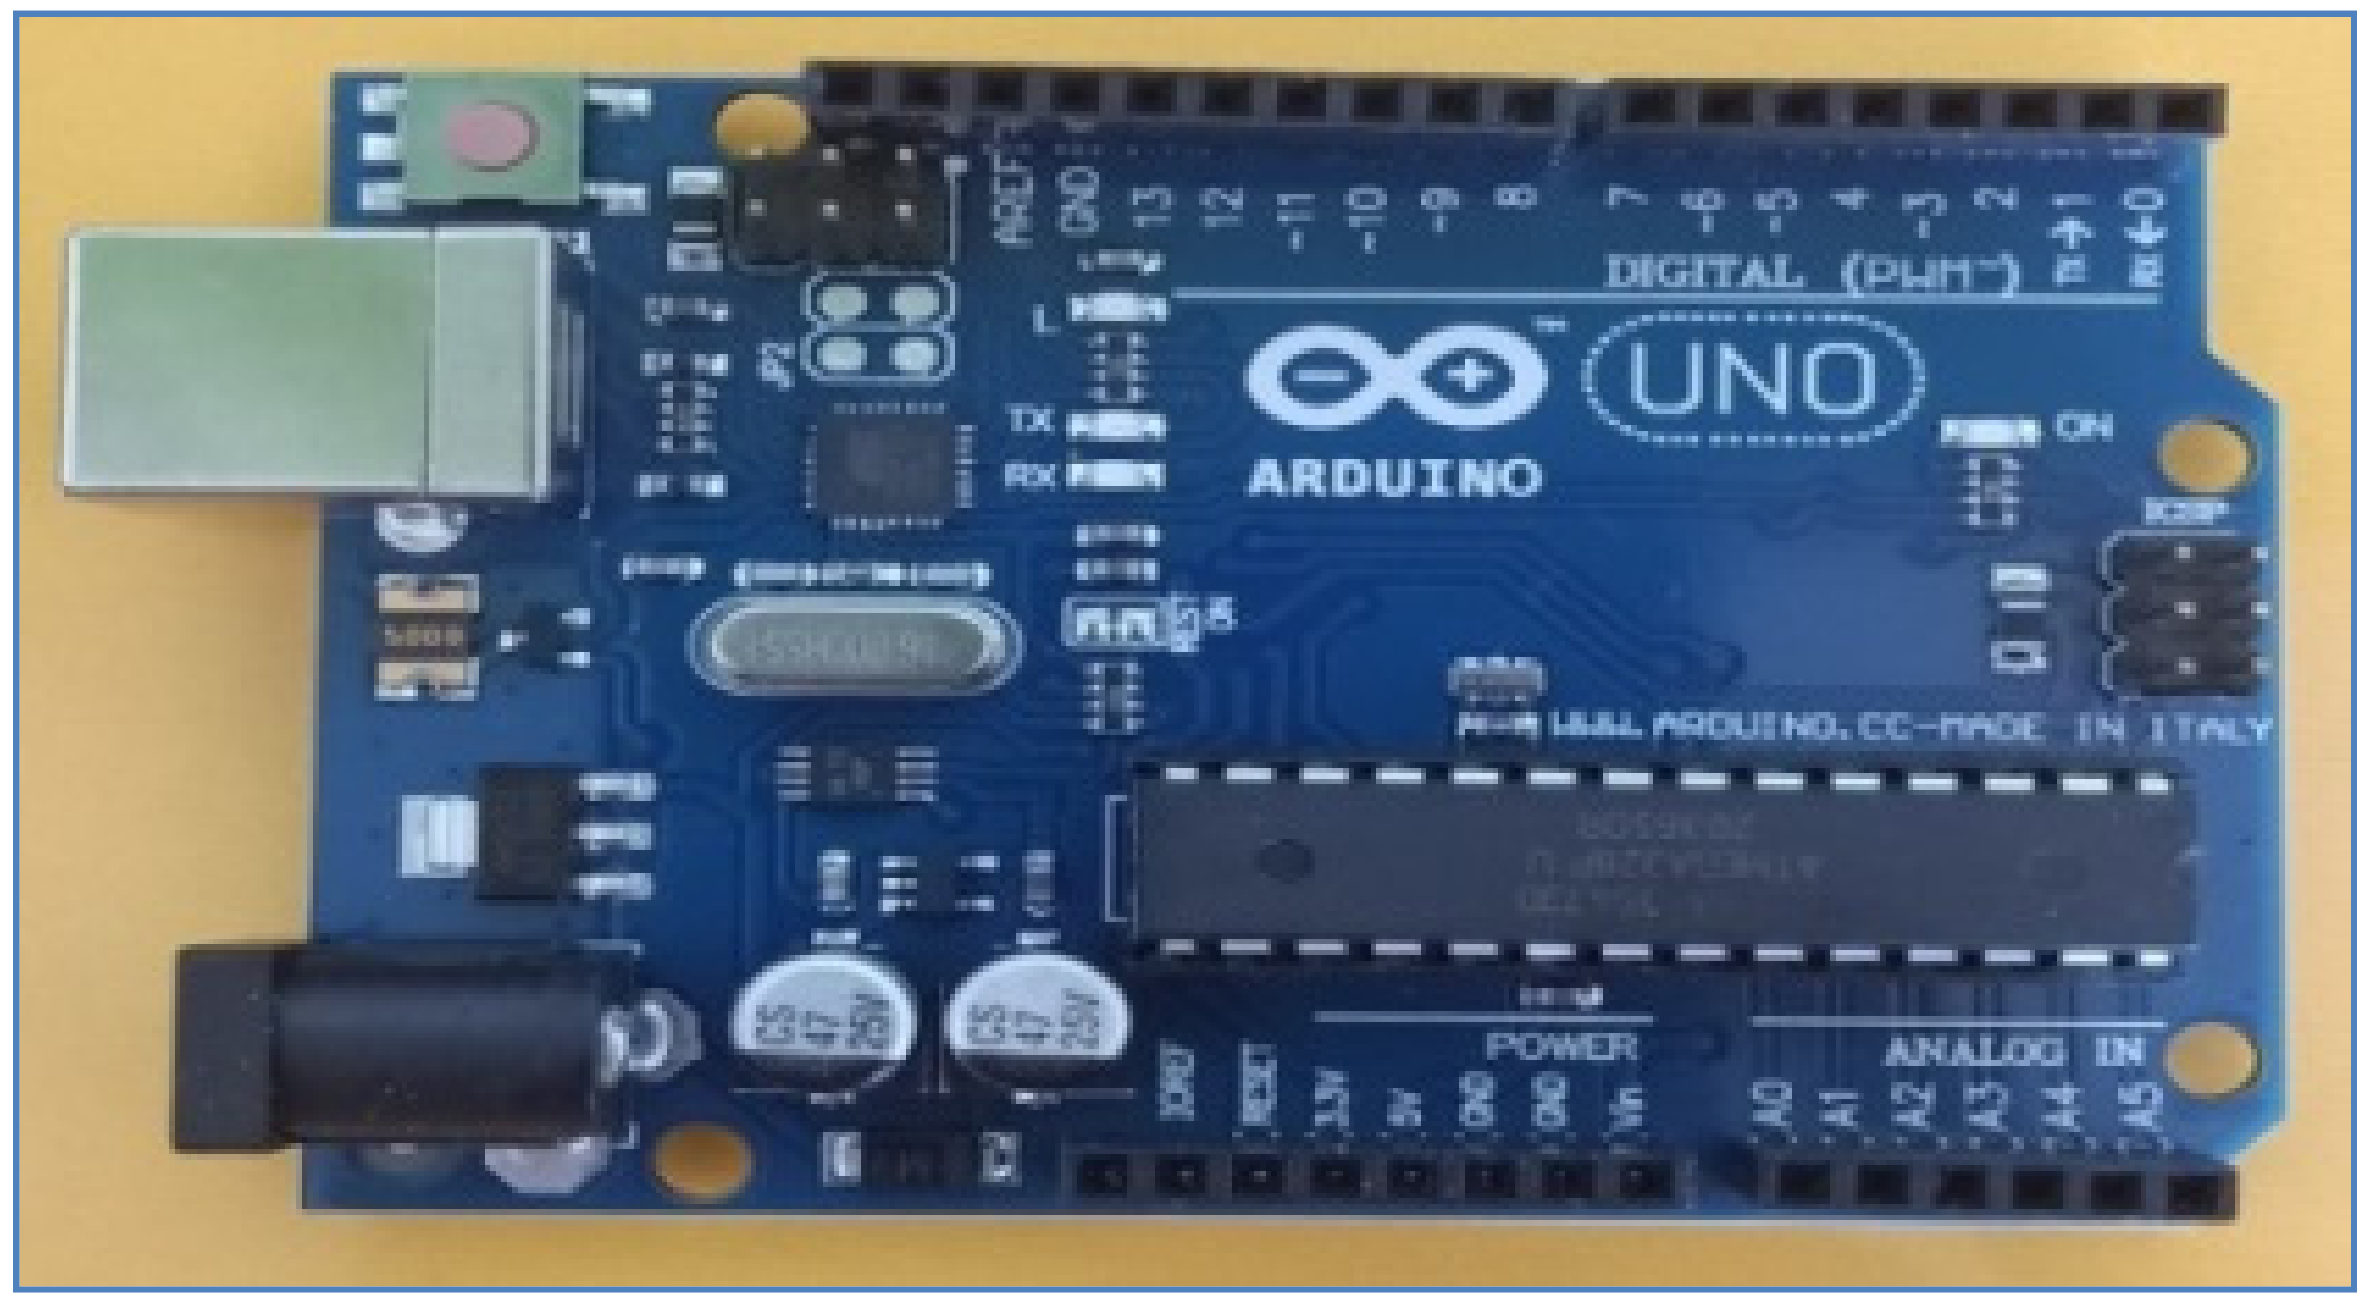
2.3.3. Arduino UNO
2.3.4. Arduino Window-Based Software (IDE)
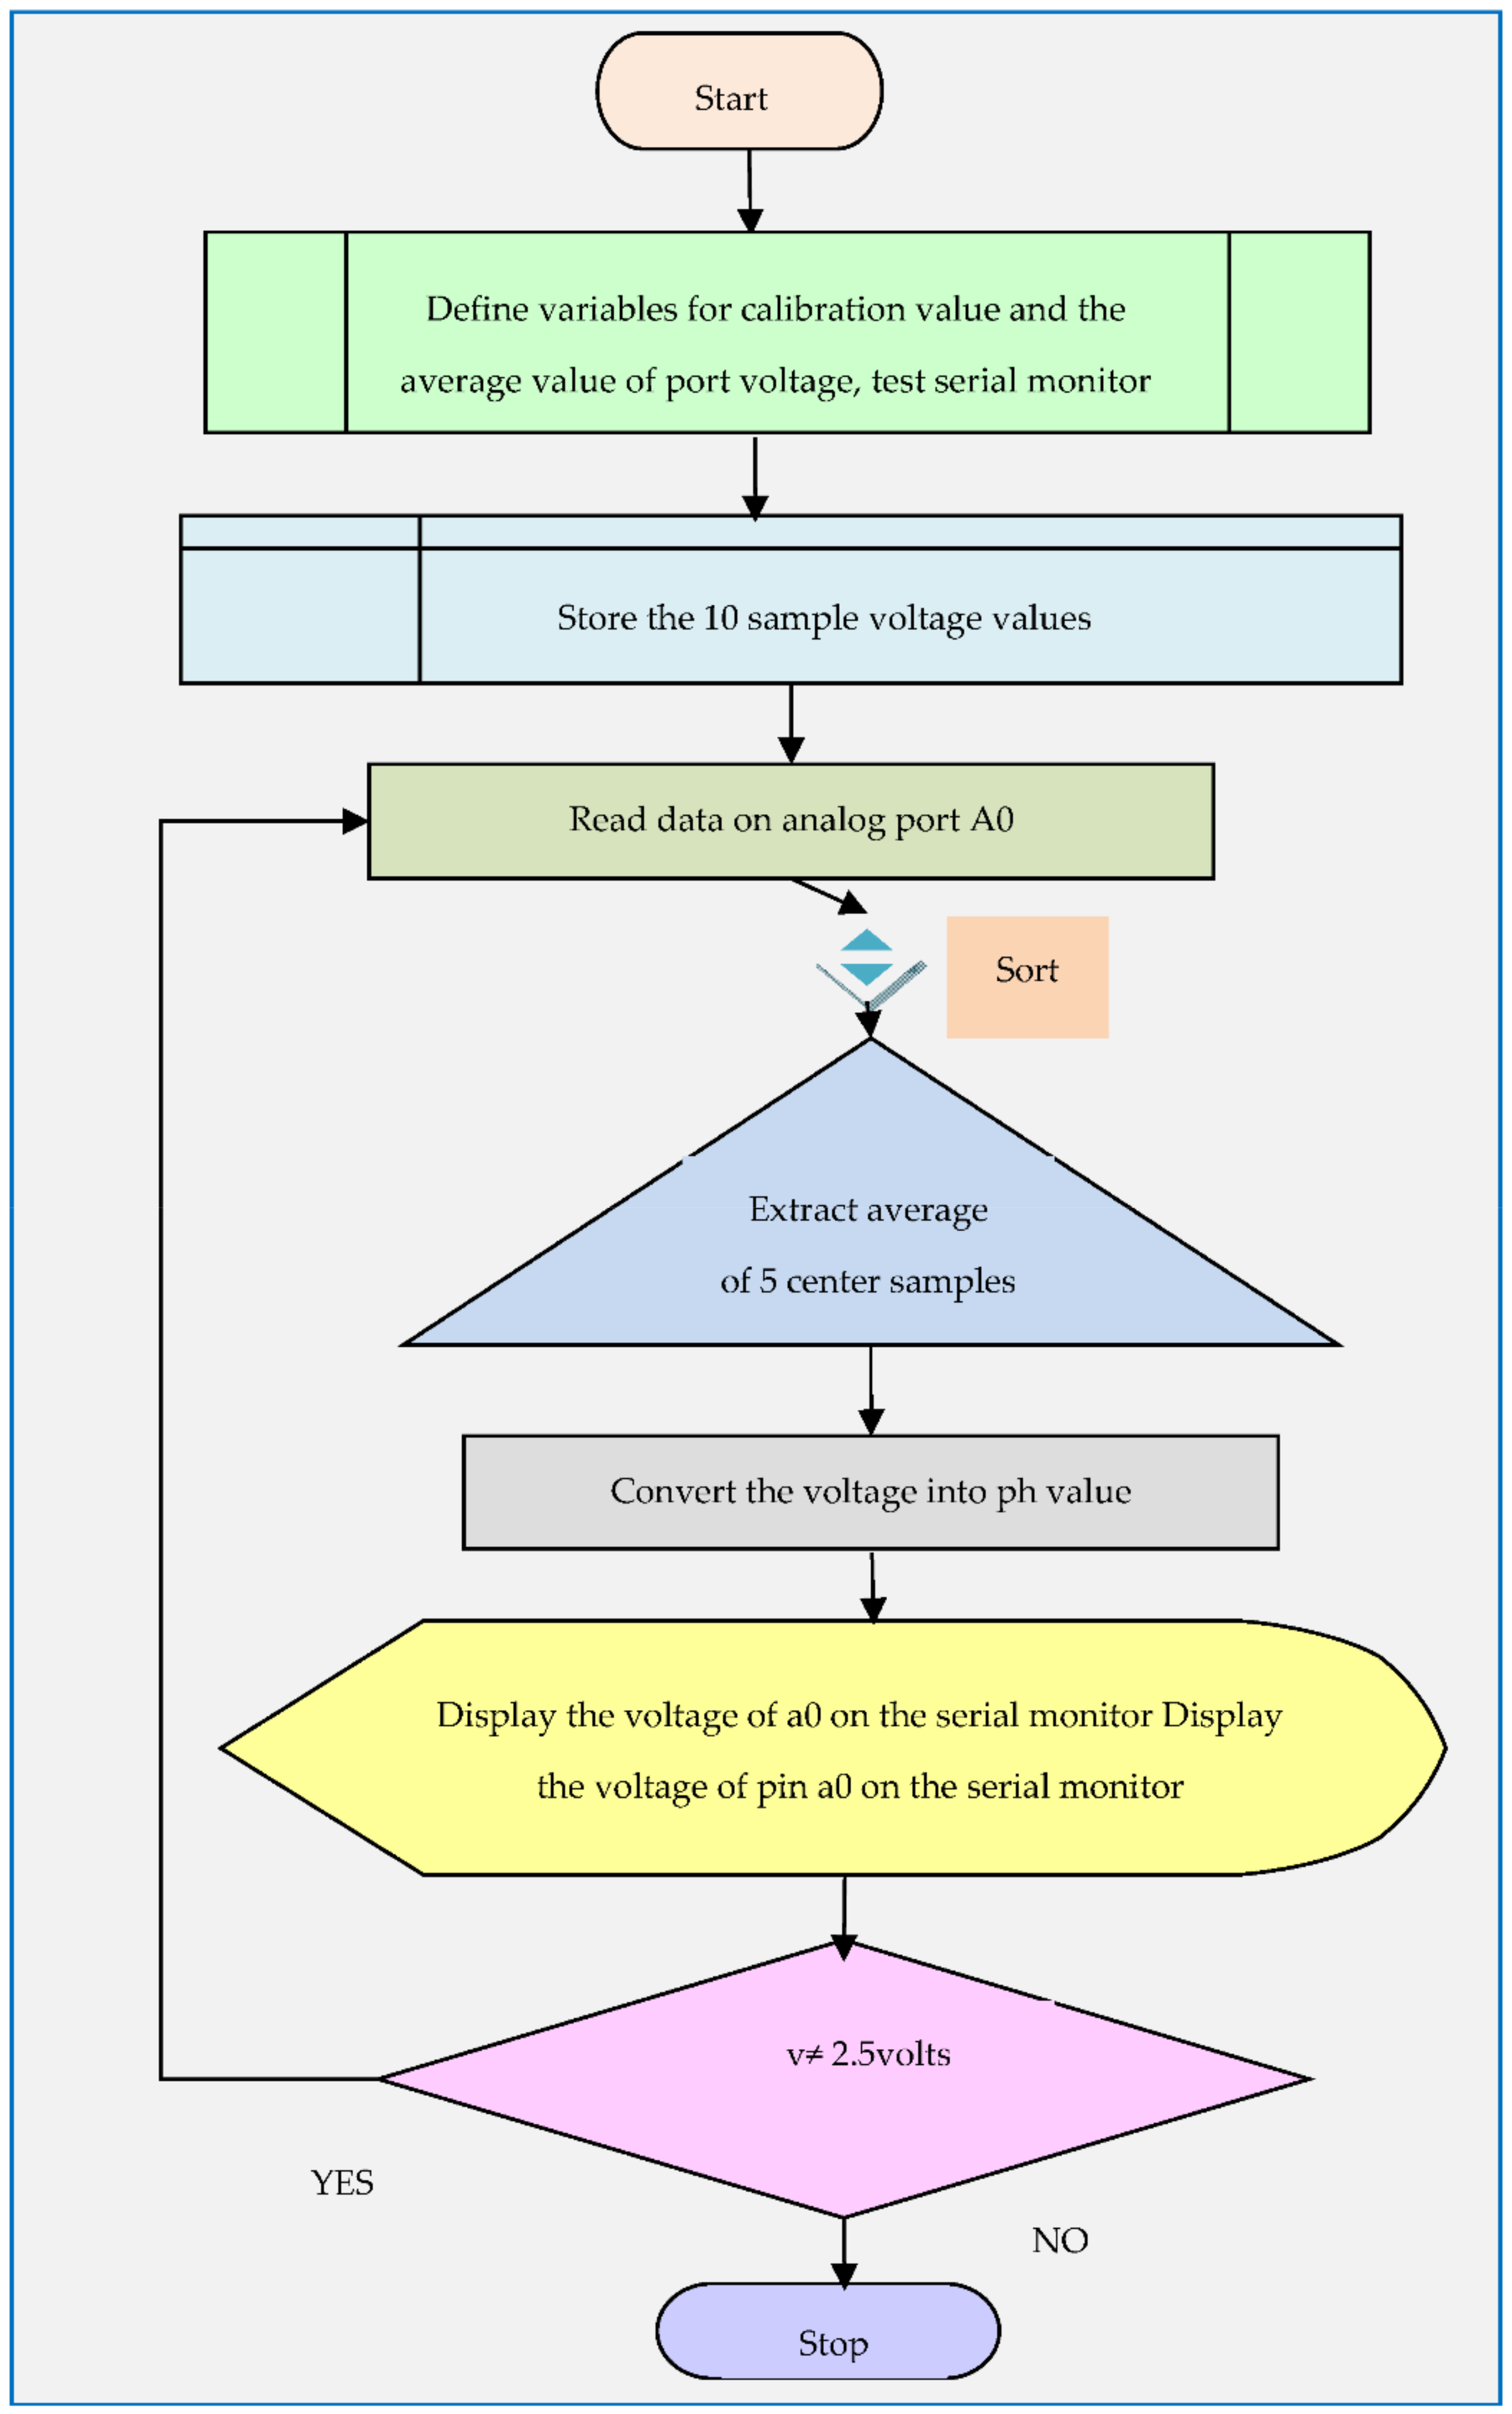
2.4. Algorithm for pH Sensor Calibration and Measurement Sensor Calibration
2.4.1. pH Sensor Calibration
2.4.2. pH Sensor Measurement
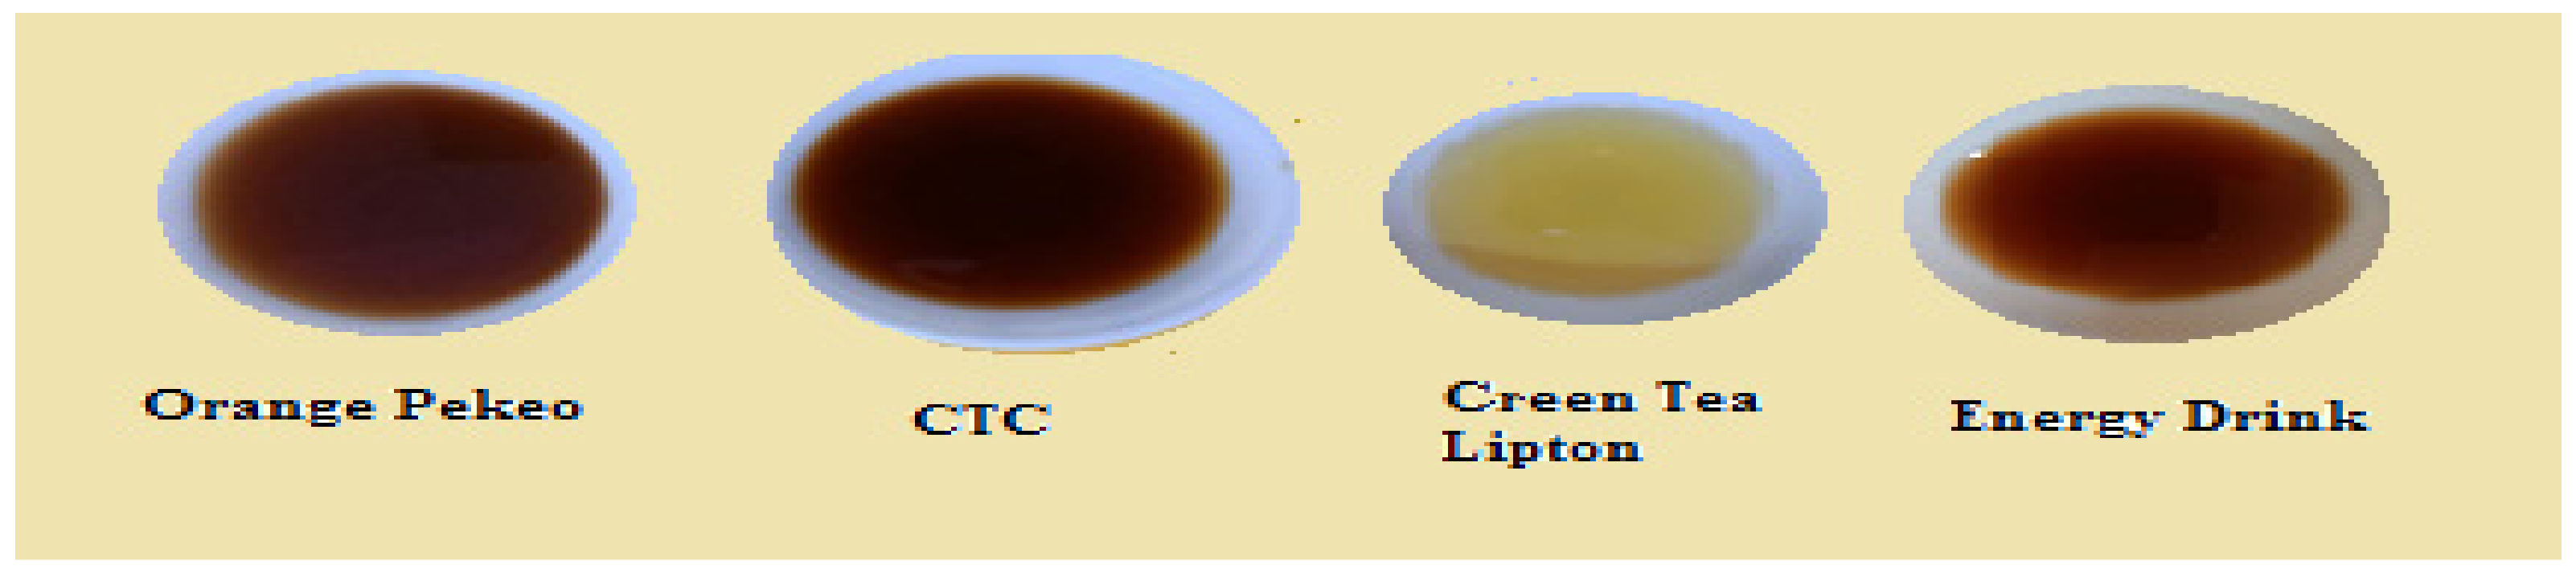
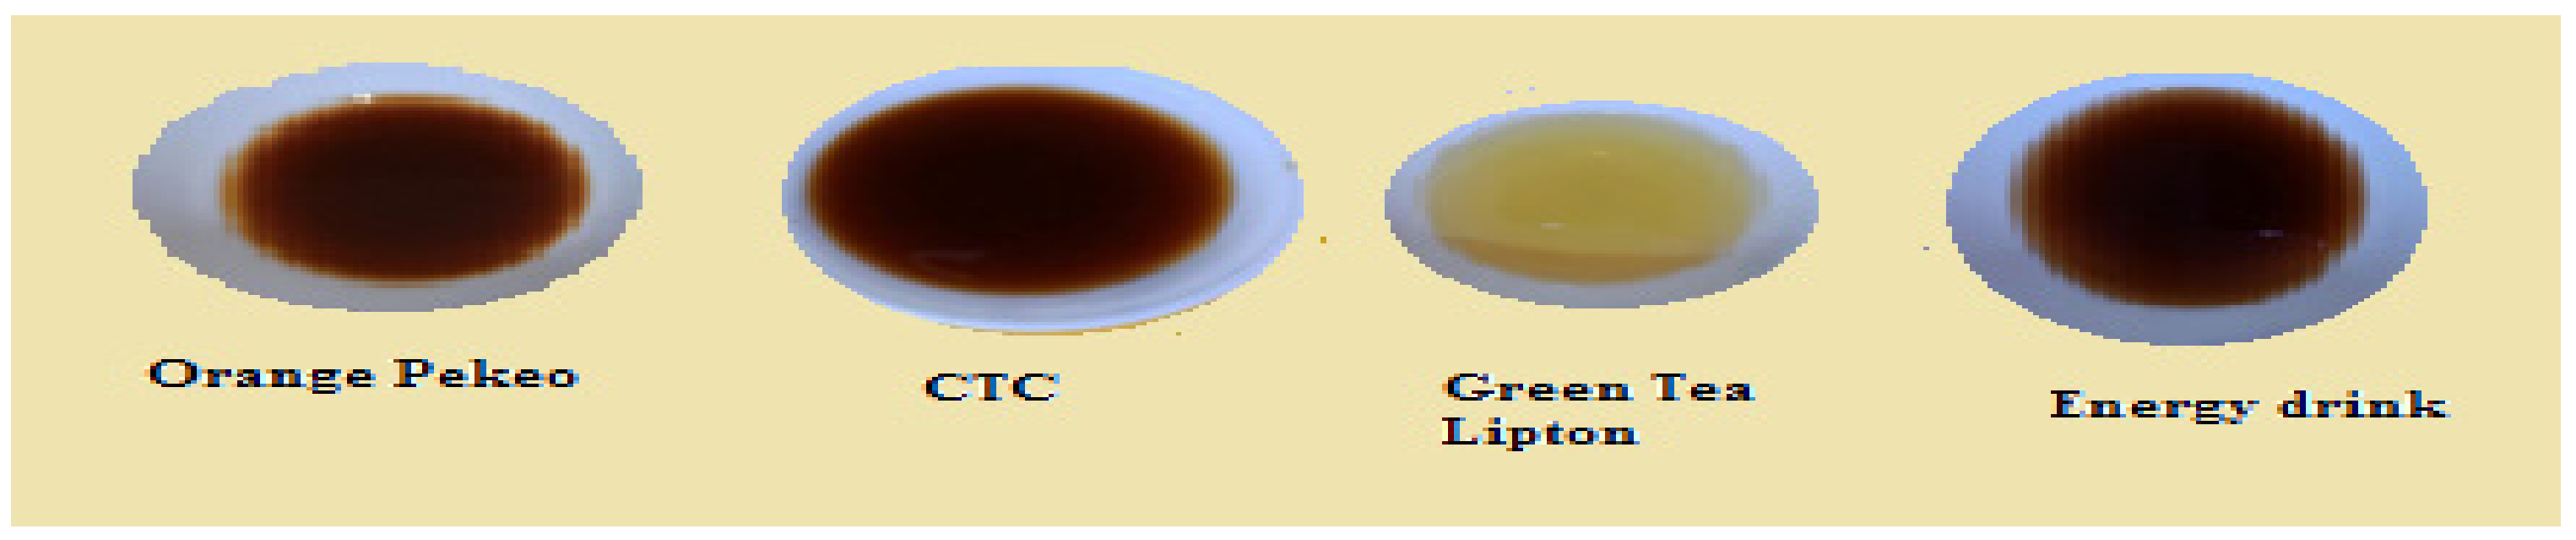
2.5. Sample Preparation
2.6. Measurements
2.6.1. Mean
2.6.2. Standard Deviation
3. Results
3.1. Research Data Description
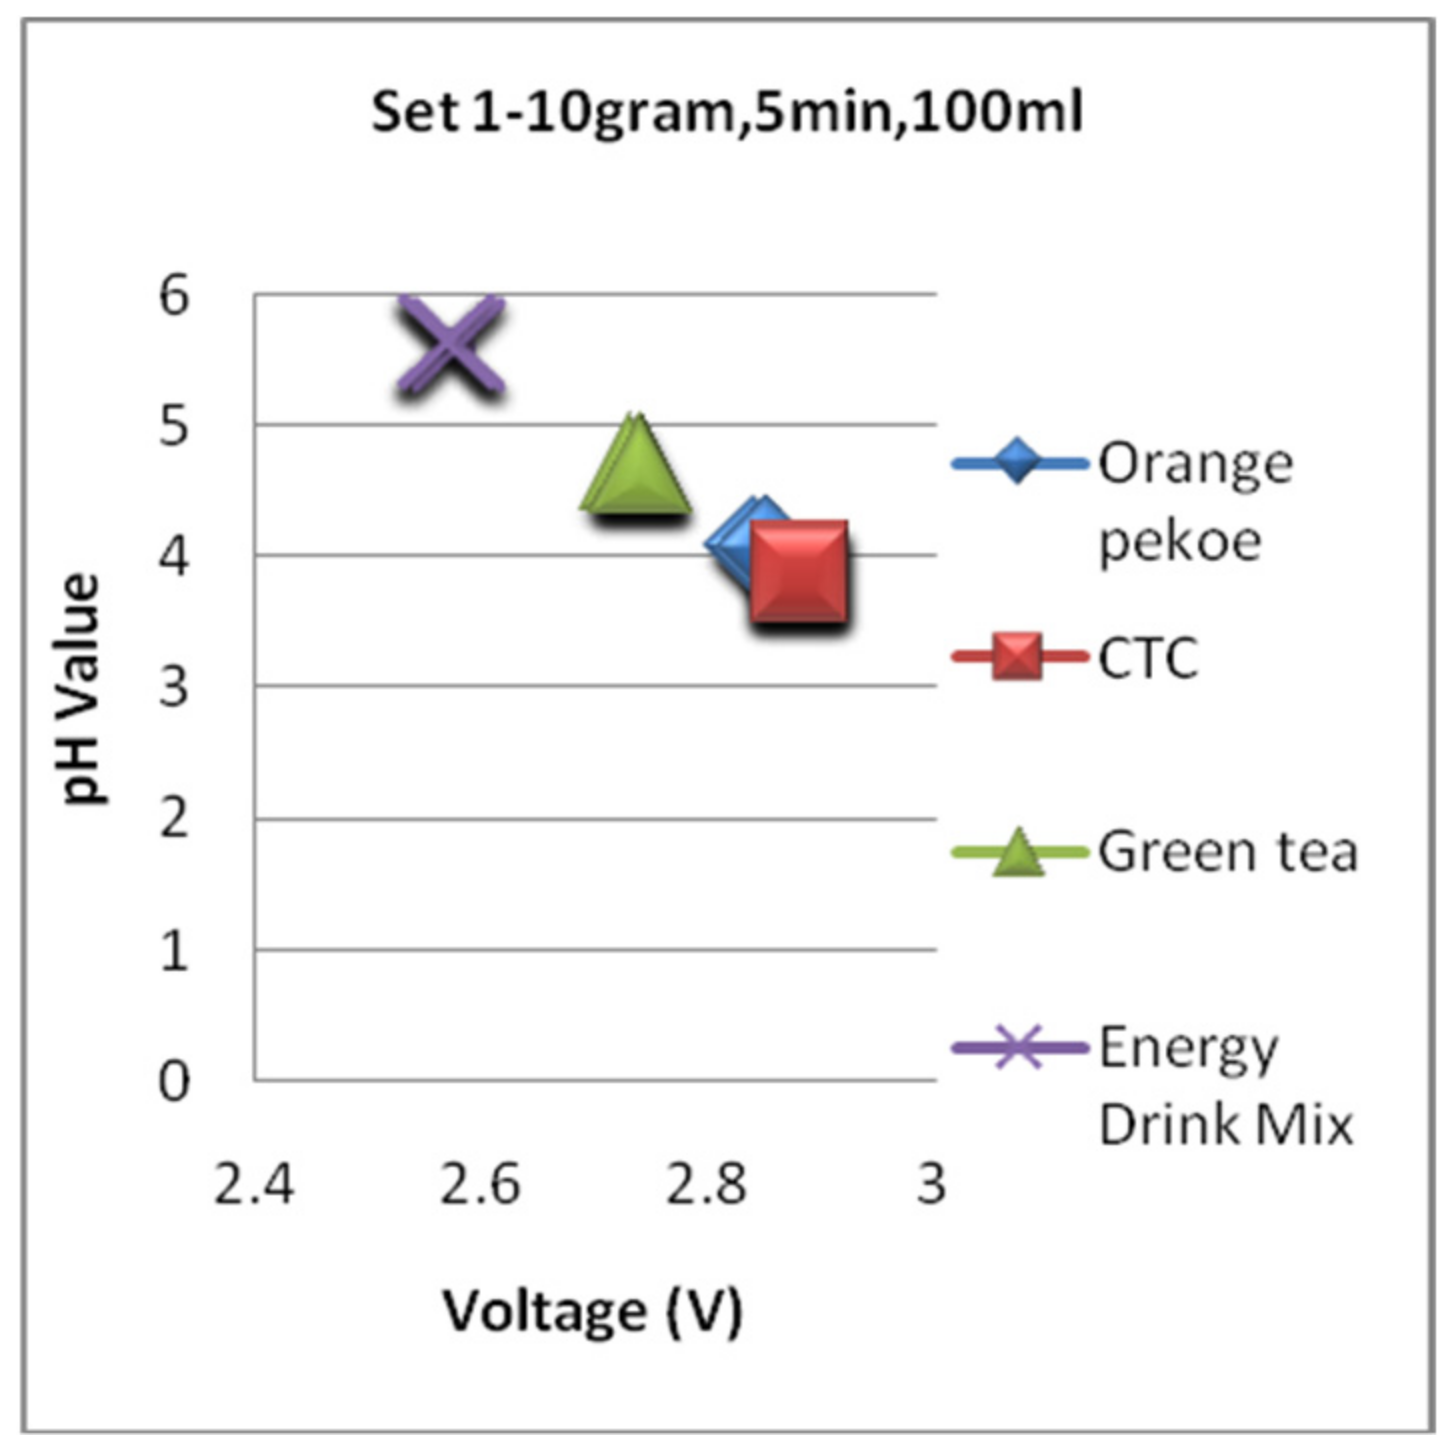
- Set 1–10 g, 5 min, 100 mL.
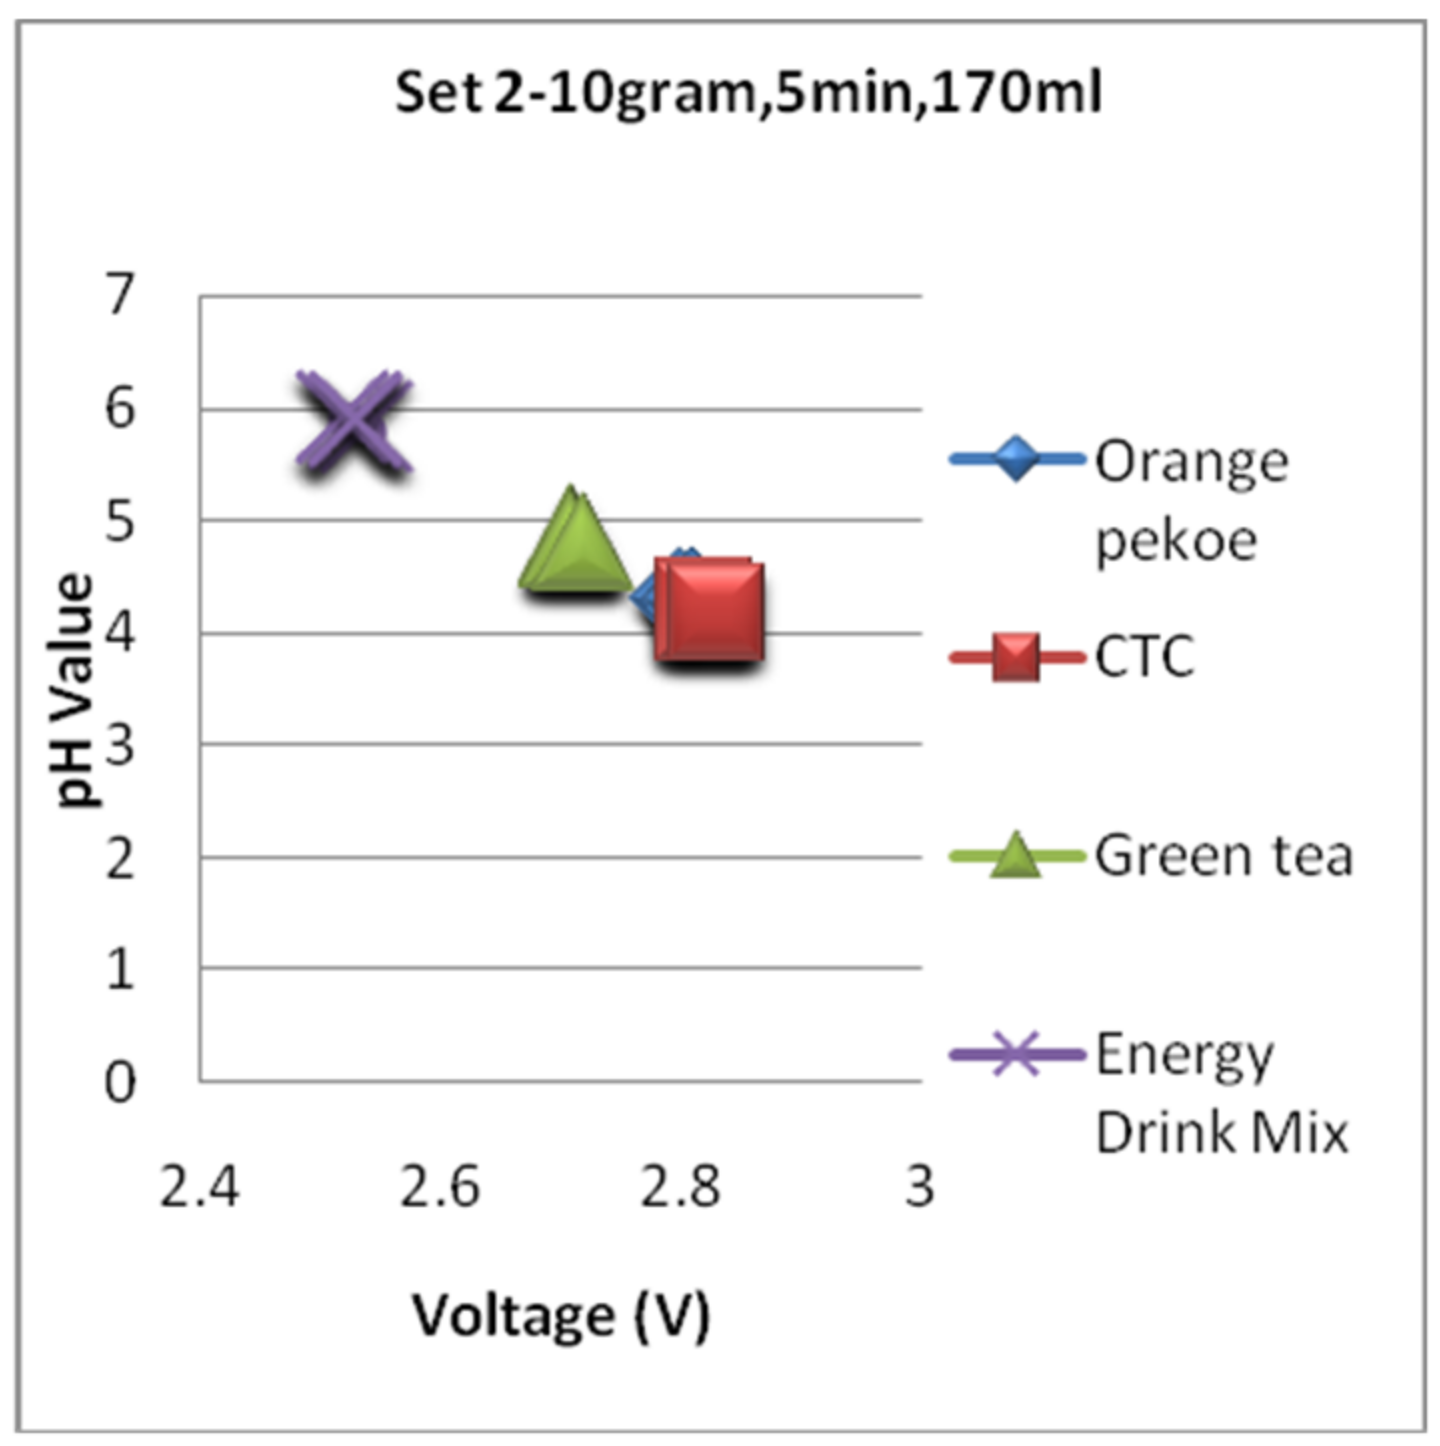
- Set 2–10 g, 5 min, 170 mL.
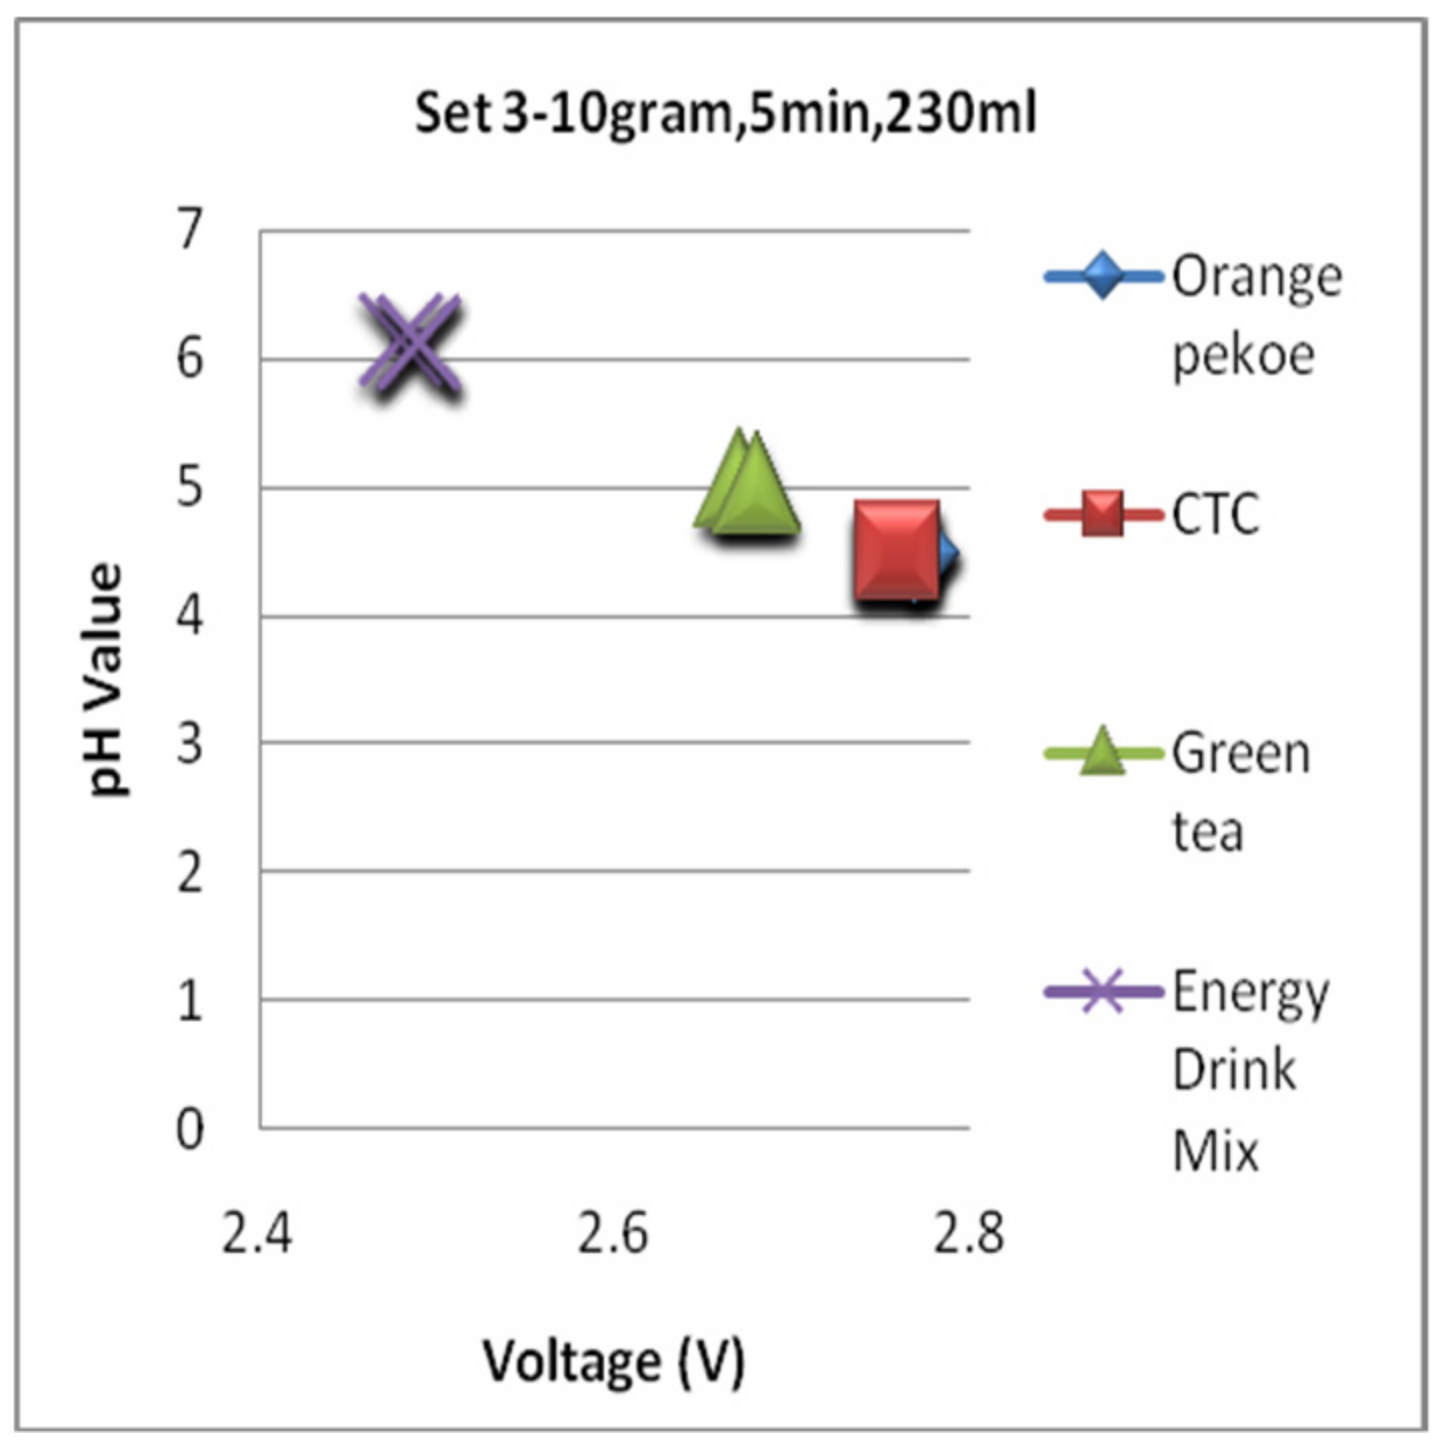
- Set 3–10 g, 5 min, 230 mL.
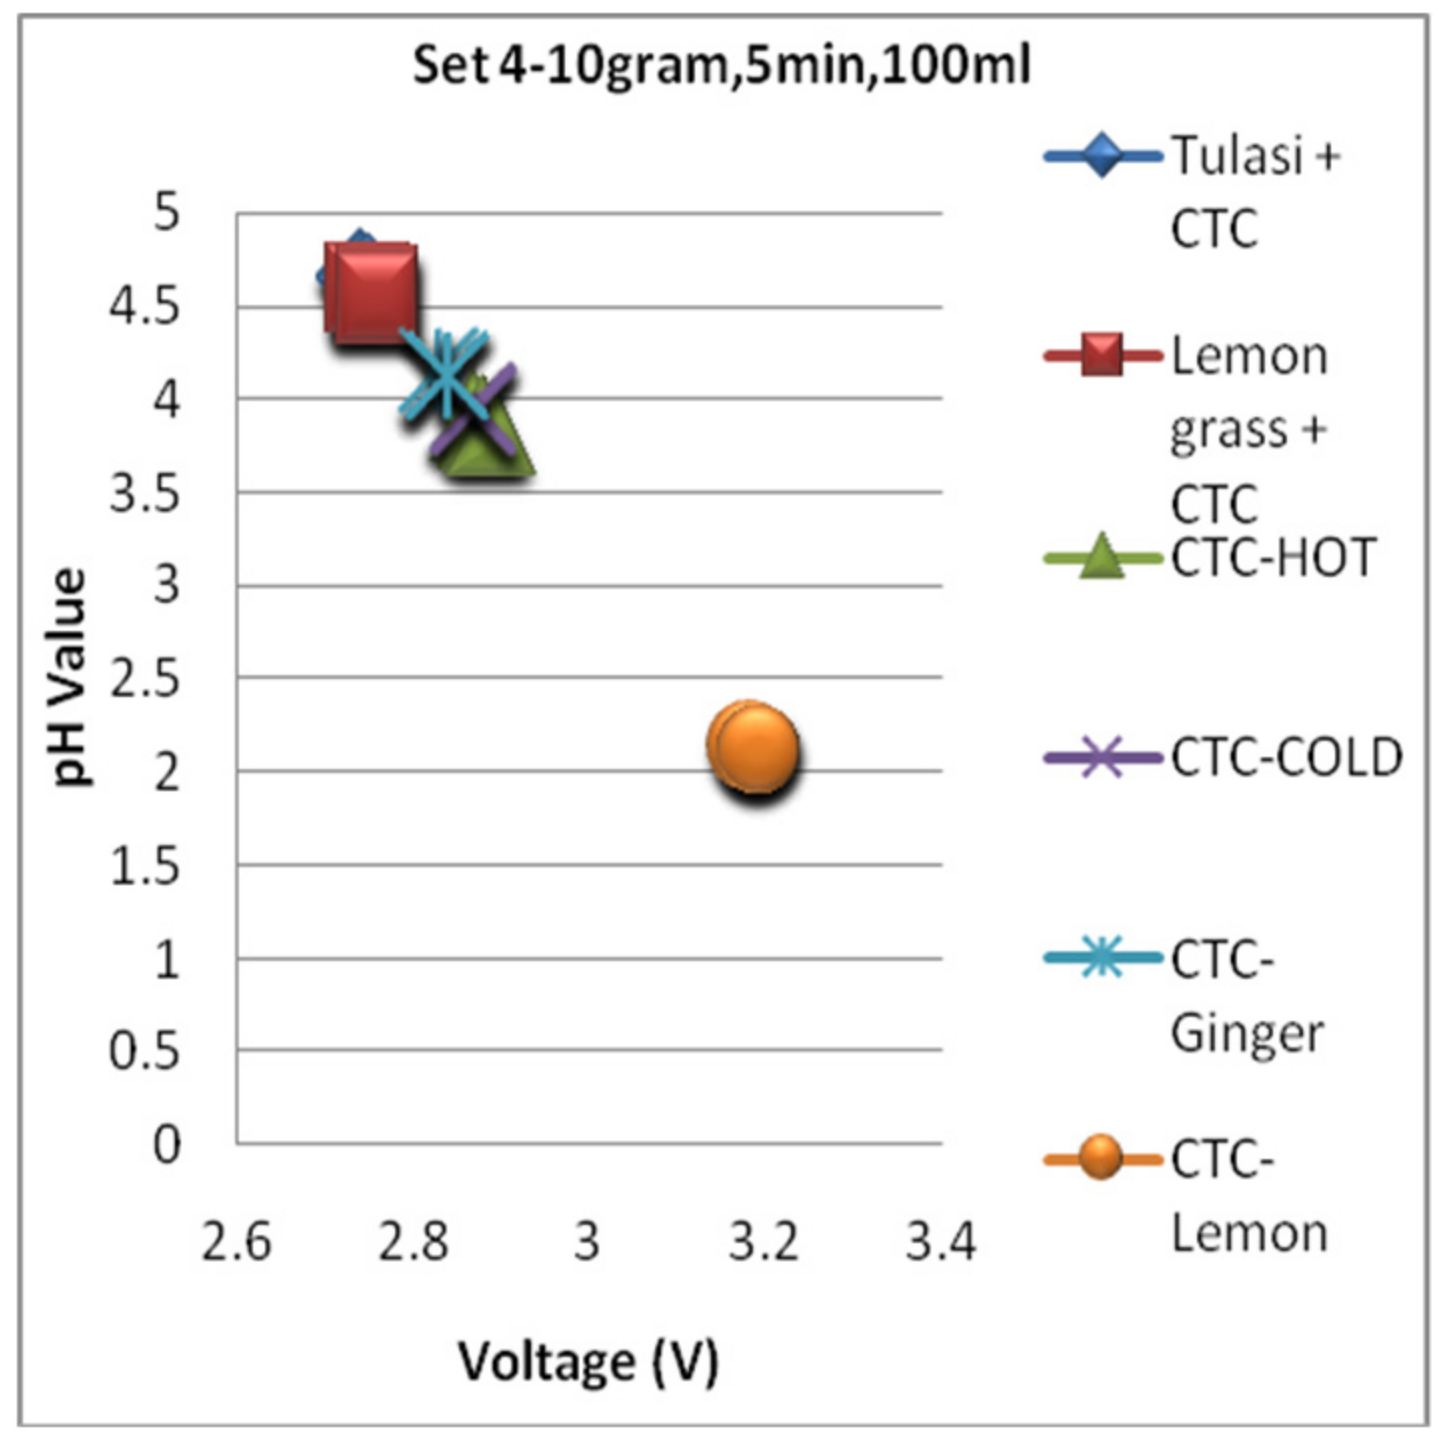
- Set 4–10 g, 5 min, 100 mL.
3.2. Research Contributions
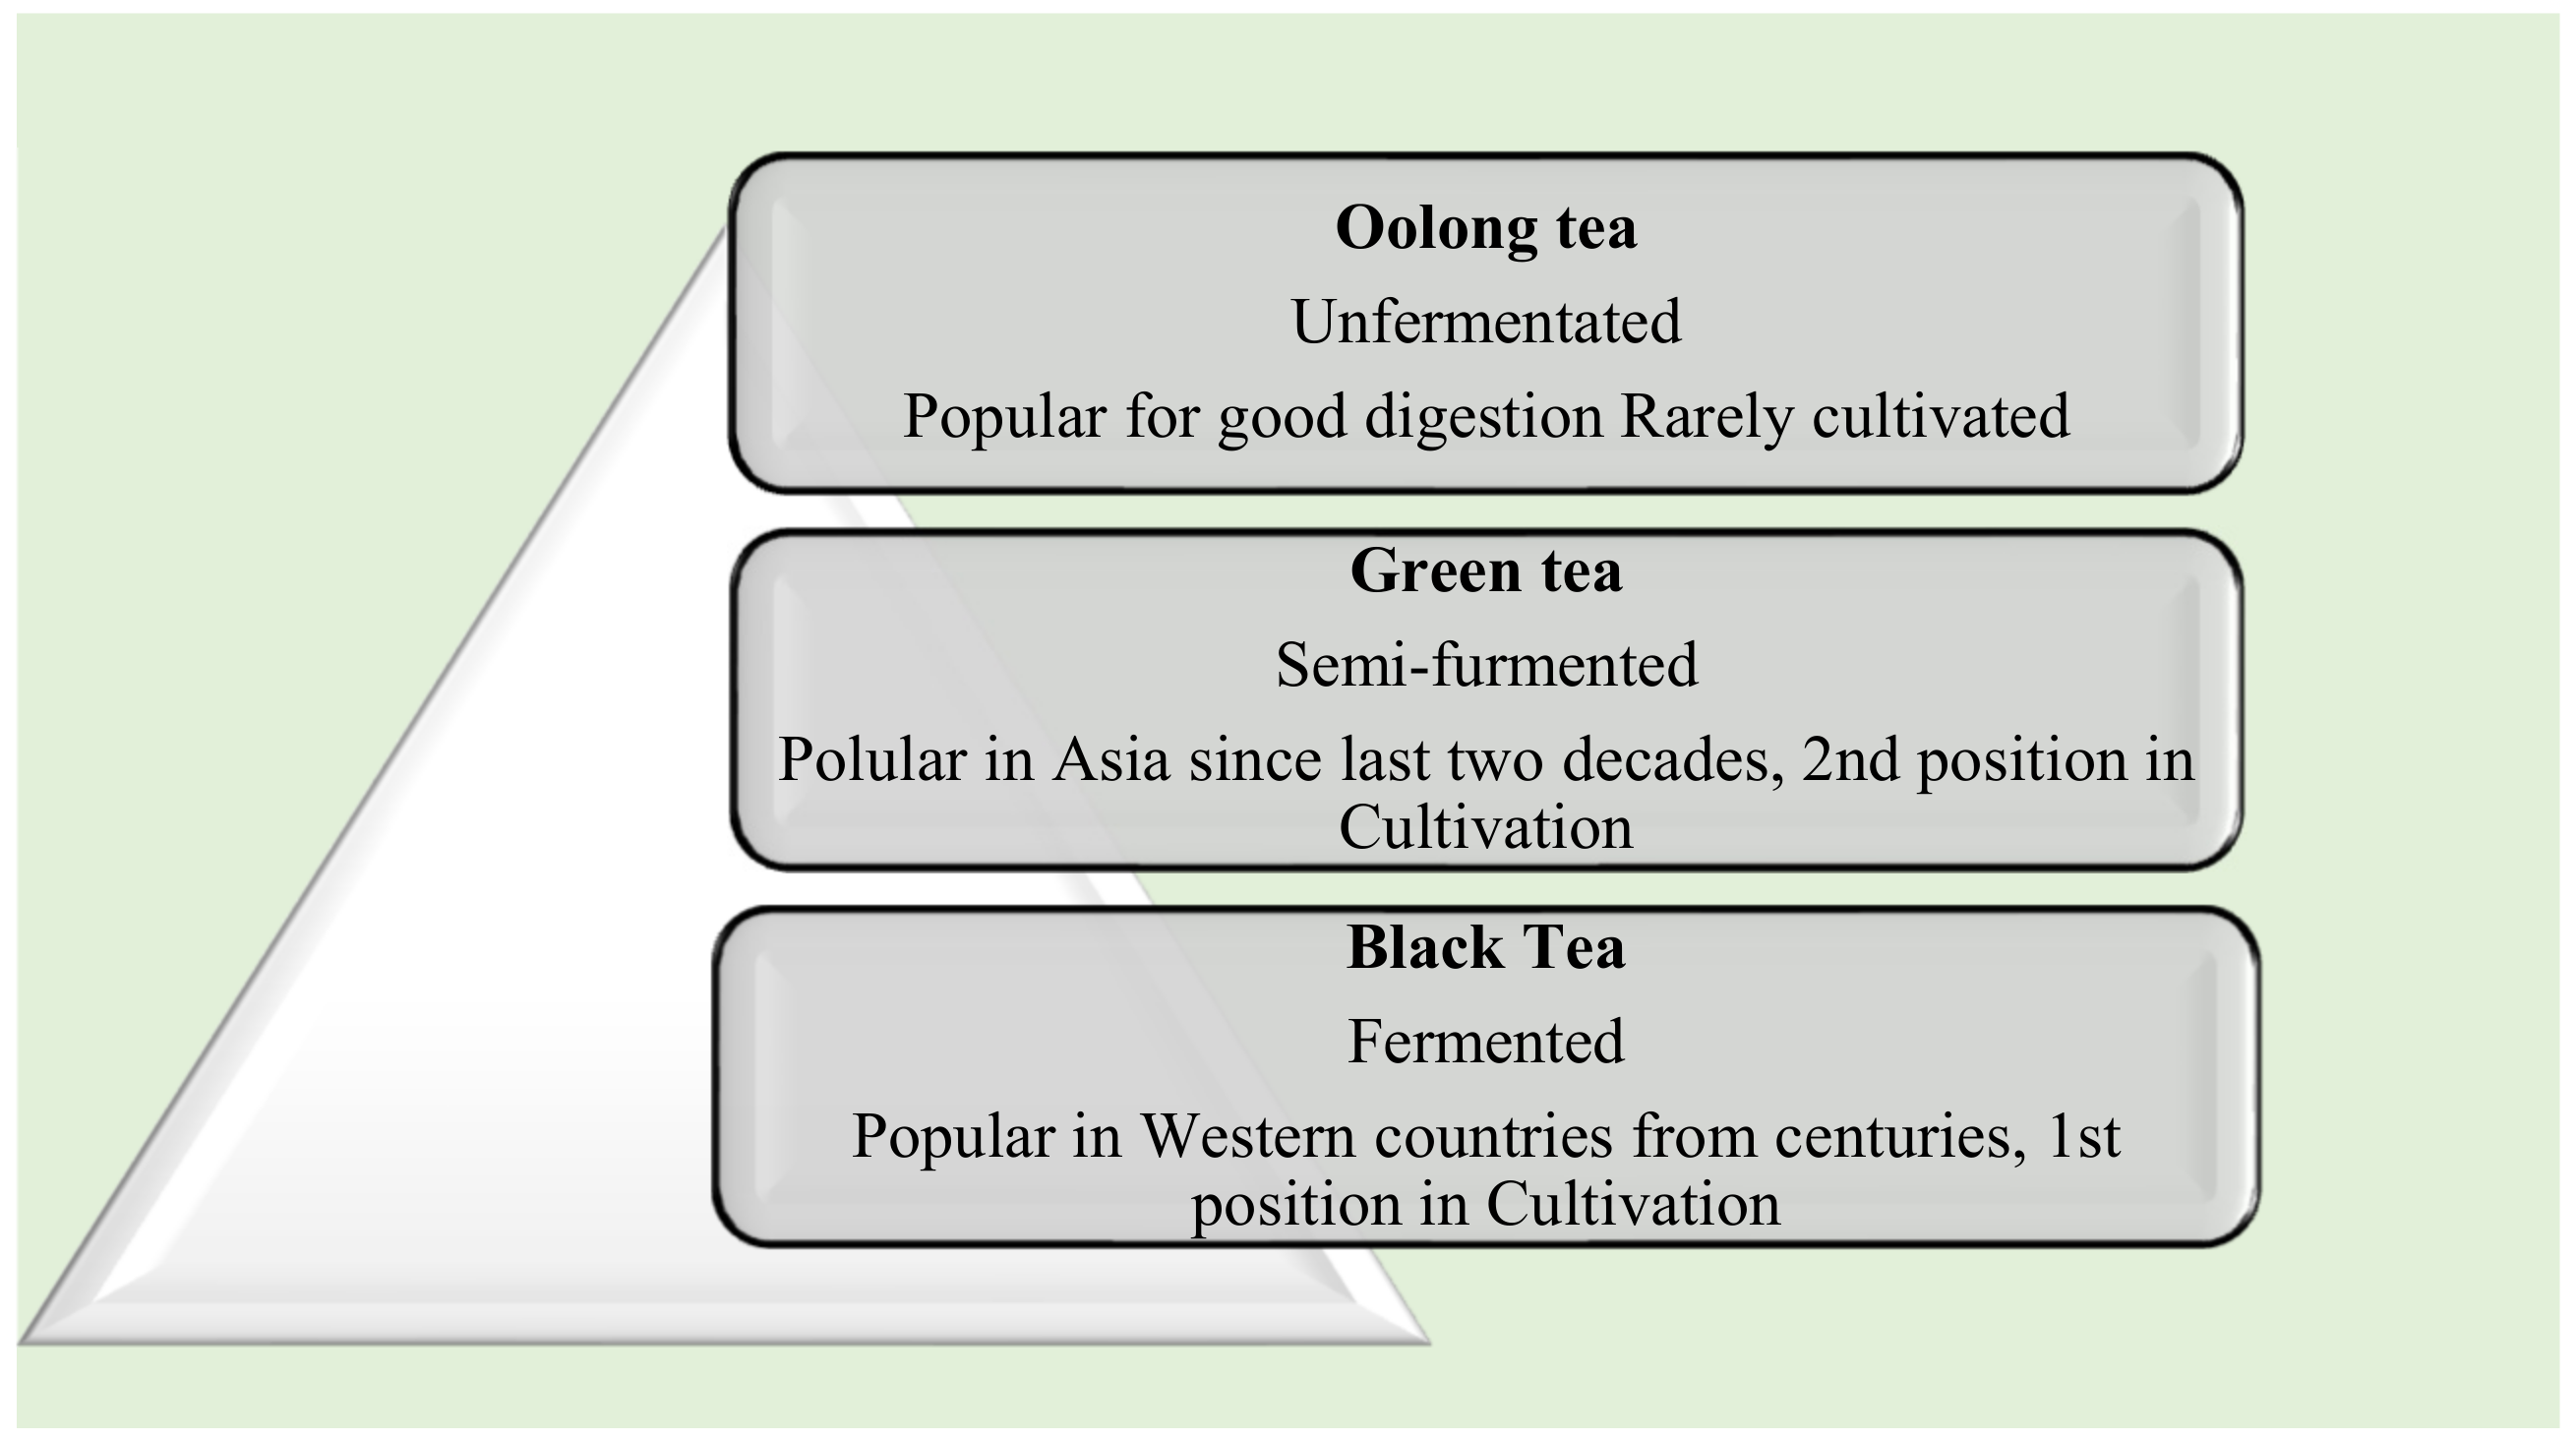
- In this paper, for the same application conditions, the standard dataset of the pH value has been prepared and explained in detail, considering the two black tea samples, one green tea sample, and one energy drink sample.
- Detailed analysis of the impact of various tea additives such asTulasi, lemongrass, ginger, and lemonon the pH value of CTC has been conducted and explained in detail. The effect of temperature on the pH value of tea liquor had been analyzed, which was not elaborated in previous literature.
4. Discussion
5. Conclusions
Author Contributions
Funding
Acknowledgments
Conflicts of Interest
References
- Rugg-Gunn, A. Is black tea better for your teeth than acidic soft drinks? Br. Dent. J. 2001, 190, 370. [Google Scholar] [CrossRef]
- Mojet, J.; Heidema, J.; Christ-Hazelhof, E. Effect of Concentration on Taste-Taste Interactions in Foods for Elderly and Young Subjects. Chem. Senses 2004, 29, 671–681. [Google Scholar] [CrossRef] [Green Version]
- Cornelis, M.C.; Tordoff, M.G.; El-Sohemy, A.; van Dam, R.M. Recalled taste intensity, liking and habitual intake of commonly consumed foods. Appetite 2017, 109, 182–189. [Google Scholar] [CrossRef] [Green Version]
- Lee, Y.; Son, J.; Jang, J.; Park, K. Coffee and metabolic syndrome: A systematic review and meta-analysis. J. Nutr. Health 2016, 49. [Google Scholar] [CrossRef]
- Bandyopadhyay, P.; Ghosh, A.K.; Ghosh, C. Recent developments on polyphenol–protein interactions: Effects on tea and coffee taste, antioxidant properties and the digestive system. Food Funct. 2012, 3, 592–605. [Google Scholar] [CrossRef] [PubMed]
- Cao, Q.-Q.; Zou, C.; Zhang, Y.-H.; Du, Q.-Z.; Yin, J.-F.; Shi, J.; Xue, S.; Xu, Y.-Q. Improving the taste of autumn green tea with tannase. Food Chem. 2019, 277, 432–437. [Google Scholar] [CrossRef] [PubMed]
- Coloring in Tea. Available online: http://www.teaboard.gov.in/pdf/Colour%20in%20Tea.pdf (accessed on 1 June 2021).
- Chandra, A.K.; De, N.; Choudhury, S.R. Effect of different doses of un-fractionated green and black tea extracts on thyroid physiology. Hum. Exp. Toxicol. 2010, 30, 884–896. [Google Scholar] [CrossRef]
- Ruan, J.; Gerendás, J.; Härdter, R.; Sattelmacher, B. Effect of root zone pH and form and concentration of nitrogen on accumulation of quality-related components in green tea. J. Sci. Food Agric. 2007, 87, 1505–1516. [Google Scholar] [CrossRef]
- Kim, S.H.; Park, J.D.; Lee, L.S.; Han, D.S. Effect of pH on green tea extraction. Korean J. Food Sci. Technol. 1999, 31, 1024–1028. [Google Scholar]
- Palit, M.; Tudu, B.; Dutta, P.K.; Dutta, A.; Jana, A.; Roy, J.K.; Bhattacharyya, N.; Bandyopadhyay, R.; Chatterjee, A. Classification of black tea taste and correlation with tea taster’s mark using a voltammetric electronic tongue. IEEE Trans. Instrum. Meas. 2009, 59, 2230–2239. [Google Scholar] [CrossRef]
- Awadalla, H.; Ragab, M.; Bassuoni, M.; Fayed, M.; Abbas, M. A pilot study of the role of green tea use on oral health. Int. J. Dent. Hyg. 2011, 9, 110–116. [Google Scholar] [CrossRef]
- Akyuz, S.; Yarat, A. The pH and neutralisable acidity of the most-consumed Turkish fruit and herbal teas. OHDMBSC 2010, 9, 75–78. [Google Scholar]
- Reddy, A.; Norris, D.F.; Momeni, S.S.; Waldo, B.; Ruby, J.D. The pH of beverages in the United States. J. Am. Dent. Assoc. 2016, 147, 255–263. [Google Scholar] [CrossRef] [PubMed] [Green Version]
- Lin, S.-D.; Yang, J.-H.; Hsieh, Y.-J.; Liu, E.-H.; Mau, J.-L. Effect of Different Brewing Methods on Quality of Green Tea. J. Food Process. Preserv. 2013, 38, 1234–1243. [Google Scholar] [CrossRef]
- Hicks, A. Review of Global Tea Production and the Impact on Industry of the Asian Economic Situation; Food and Agricultural Organization Regional Office for Asia and the Pacific: Bangkok, Thailand, 2001. [Google Scholar]
- Anderson, R.F.; Fisher, L.J.; Hara, Y.; Harris, T.; Mak, W.B.; Melton, L.D.; Packer, J.E. Green tea catechins partially protect DNA fromOH radical-induced strand breaks and base damage through fast chemical repair of DNA radicals. Carcinogenesis 2001, 22, 1189–1193. [Google Scholar] [CrossRef] [Green Version]
- Cabrera, C.; Giménez, A.R.; López, M.C. Determination of Tea Components with Antioxidant Activity. J. Agric. Food Chem. 2003, 51, 4427–4435. [Google Scholar] [CrossRef] [Green Version]
- Guo, Q.; Zhao, B.; Li, M.; Shen, S.; Xin, W. Studies on protective mechanisms of four components of green tea polyphenols against lipid peroxidation in synaptosomes. Biochim. Biophys. Acta BBA Lipids Lipid Metab. 1996, 1304, 210–222. [Google Scholar] [CrossRef]
- Wei, K.; Ruan, L.; Li, H.; Wu, L.; Wang, L.; Cheng, H. Estimation of the effects of major chemical components on the taste quality of green tea. Int. Food Res. J. 2019, 26, 869–876. [Google Scholar]
- Patil, A.B.; Bachute, M.R. A Bibliometric Analysis of the Tea Quality Evaluation using Artificial Intelligence. Libr. Philos. Pract. 2021, 4959. Available online: https://digitalcommons.unl.edu/libphilprac/4959 (accessed on 1 January 2021).
- Han, W.-Y.; Wang, D.-H.; Fu, S.-W.; Ahmed, S. Tea from organic production has higher functional quality characteristics compared with tea from conventional management systems in China. Biol. Agric. Hortic. 2018, 34, 120–131. [Google Scholar] [CrossRef]
- Ueda, Y.; Yonemitsu, M.; Tsubuku, T.; Sakaguchi, M.; Miyajima, R. Flavor Characteristics of Glutathione in Raw and Cooked Foodstuffs. Biosci. Biotechnol. Biochem. 1997, 61, 1977–1980. [Google Scholar] [CrossRef] [Green Version]
- Song, H.; Liu, J. GC-O-MS technique and its applications in food flavor analysis. Food Res. Int. 2018, 114, 187–198. [Google Scholar] [CrossRef]
- Scharbert, S.; Jezussek, M.; Hofmann, T. Evaluation of the taste contribution of theaflavins in black tea infusions using the taste activity concept. Eur. Food Res. Technol. 2004, 218, 442–447. [Google Scholar] [CrossRef]
- Nanjo, F.; Goto, K.; Seto, R.; Suzuki, M.; Sakai, M.; Hara, Y. Scavenging effects of tea catechins and their derivatives on 1,1-diphenyl-2-picrylhydrazyl radical. Free Radic. Biol. Med. 1996, 21, 895–902. [Google Scholar] [CrossRef]
- Drewnowski, A. The Science and Complexity of Bitter Taste. Nutr. Rev. 2001, 59, 163–169. [Google Scholar] [CrossRef] [PubMed]
- Gogoi, R.C. Blending of tea—The development. Two Bud 2014, 61, 53–56. [Google Scholar]
- Li, Y.; Du, Y.; Zou, C. Effects of pH on antioxidant and antimicrobial properties of tea saponins. Eur. Food Res. Technol. 2009, 228, 1023–1028. [Google Scholar] [CrossRef]
- Pallepati, A.; Yavagal, P.; Veeresh, D.J. Effect of consuming tea with Stevia on salivary ph—An in vivo randomized controlled trial. Oral Health Prev. Dent. 2017, 15, 315–319. [Google Scholar] [PubMed]
- Zeng, L.; Ma, M.; Li, C.; Luo, L. Stability of tea polyphenols solution with different pH at different temperatures. Int. J. Food Prop. 2017, 20, 1–18. [Google Scholar] [CrossRef] [Green Version]
- Rahim, Z.H.; Bakri, M.M.; Zakir, H.M.; Ahmed, I.A.; Zulkifli, N.A. High fluoride and low pH level have been detected in popular flavored beverages in Malaysia. Pak. J. Med Sci. 2014, 30, 404. [Google Scholar]
- Jankun, J.; Selman, S.H.; Swiercz, R.; Skrzypczak-Jankun, E. Why drinking green tea could prevent cancer. Nature 1997, 387, 561. [Google Scholar] [CrossRef]
- Chu, C.H.; Mei, M.L.; Lo, E.C.M. Use of fluorides in dental caries management. Gen. Dent. 2010, 58, 37–43. [Google Scholar]
- Behrendt, A.; Oberste, V.; Wetzel, W.E. Fluoride Concentration and pH of Iced Tea Products. Caries Res. 2002, 36, 405–410. [Google Scholar] [CrossRef] [PubMed]
- Kaczmarek, U. PH values and fluoride levels in some tea brands. Ann. Acad. Med. Stetin. 2004, 50, 58–61. [Google Scholar] [PubMed]
- Singh, G.; Srivastsva, S.; Gupta, G.; Patil, A.B. Arduino Uno based Smart Cane for Osteoarthritis patients. Int. J. Sci. Res. Eng. Dev. 2020, 3, 1150–1155. [Google Scholar]
- Emekli-Alturfan, E.; Yarat, A.; Akyuz, S. Fluoride levels in various black tea, herbal and fruit infusions consumed in Turkey. Food Chem. Toxicol. 2009, 47, 1495–1498. [Google Scholar] [CrossRef]
- Zhang, L.; Cao, Q.-Q.; Granato, D.; Xu, Y.-Q.; Ho, C.-T. Association between chemistry and taste of tea: A review. Trends Food Sci. Technol. 2020, 101, 139–149. [Google Scholar] [CrossRef]
- Patil, A.B.; Bachute, M.R.; Kotecha, K. Artificial Perception of the Beverages: An in-Depth Review of the Tea Sample. IEEE Access 2021, 9, 82761–82785. [Google Scholar] [CrossRef]
- Feeney, E.; O’Brien, S.; Scannell, A.; Markey, A.; Gibney, E.R. Genetic variation in taste perception: Does it have a role in healthy eating? Proc. Nutr. Soc. 2010, 70, 135–143. [Google Scholar] [CrossRef] [Green Version]
- Ong, J.-S.; Hwang, D.L.-D.; Zhong, V.W.; An, J.; Gharahkhani, P.; Breslin, P.A.S.; Wright, M.; Lawlor, D.A.; Whitfield, J.; MacGregor, S.; et al. Understanding the role of bitter taste perception in coffee, tea and alcohol consumption through Mendelian randomization. Sci. Rep. 2018, 8, 16414. [Google Scholar] [CrossRef] [Green Version]
- Tahara, Y.; Toko, K. Electronic Tongues—A Review. IEEE Sens. J. 2013, 13, 3001–3011. [Google Scholar] [CrossRef]
- Banerjee, R.R.; Modak, A.; Mondal, S.; Tudu, B.; Bandyopadhyay, R.; Bhattacharyya, N. Fusion of Electronic Nose and Tongue Response Using Fuzzy based Approach for Black Tea Classification. Procedia Technol. 2013, 10, 615–622. [Google Scholar] [CrossRef] [Green Version]
- Zou, G.; Xiao, Y.; Wang, M.; Zhang, H. Detection of bitterness and astringency of green tea with different taste by electronic nose and tongue. PLoS ONE 2018, 13, e0206517. [Google Scholar] [CrossRef] [Green Version]
- Saha, P.; Ghorai, S.; Tudu, B.; Bandyopadhyay, R.; Bhattacharyya, N. Tea Quality Prediction by Sparse Modeling of Electronic Tongue Signals. IEEE Trans. Instrum. Meas. 2018, 68, 3046–3053. [Google Scholar] [CrossRef]
- Available online: http://www.teaboard.gov.in/TEABOARDPAGE/MjlwNQ==TEABOARDINDIA (accessed on 1 June 2021).
- Nagtode, S.A.; Choudhari, D.N. Identification of Impurity level in Liquids Using Electronic Sensor–Based System. Int. J. Innov. Res. Electr. Electron. Instrum. Control. Eng. 2015, 3, 77–82. [Google Scholar]
- Azad, T.; Ahmed, S. Common milk adulteration and their detection techniques. Int. J. Food Contam. 2016, 3, 22. [Google Scholar] [CrossRef] [Green Version]
- Podrażka, M.; Bączyńska, E.; Kundys, M.; Jeleń, P.S.; Witkowska Nery, E. Electronic tongue—A tool for all tastes? Biosensors 2018, 8, 3. [Google Scholar] [CrossRef] [PubMed] [Green Version]
- Li, Y.; Lei, J.; Liang, D. Identification of Fake Green Tea by Sensory Assessment and Electronic Tongue. Food Sci. Technol. Res. 2015, 21, 207–212. [Google Scholar] [CrossRef] [Green Version]
- Singh, G.; Kamal, N. Machine vision system for tea quality determination—Tea Quality Index (TQI). IOSR J. Eng. 2013, 3, 46–50. [Google Scholar] [CrossRef]
- Karakaya, D.; Ulucan, O.; Turkan, M. Electronic Nose and Its Applications: A Survey. Int. J. Autom. Comput. 2020, 17, 179–209. [Google Scholar] [CrossRef] [Green Version]
- Tozlu, B.H.; Okumuş, H.İ. A new approach to automation of black tea fermentation process with electronic nose. Autom. Časopis Autom. Mjer. Elektron. Računarstvo Komun. 2018, 59, 373–381. [Google Scholar] [CrossRef]
- Bajec, M.R.; Pickering, G.J. Astringency: Mechanisms and Perception. Crit. Rev. Food Sci. Nutr. 2008, 48, 858–875. [Google Scholar] [CrossRef] [PubMed]
- Habara, M.; Ikezaki, H.; Toko, K. Study of sweet taste evaluation using taste sensor with lipid/polymer membranes. Biosens. Bioelectron. 2004, 19, 1559–1563. [Google Scholar] [CrossRef]
- Hayashi, N.; Chen, R.; Ikezaki, H.; Ujihara, T.; Kitajima, H.; Mizukami, Y. Evaluation of the astringency of black tea by at aste sensor system: Scope and simitation. Biosci. Biotechnol. Biochem. 2007, 71, 587–589. [Google Scholar] [CrossRef] [PubMed]
- Hayashi, N.; Chen, R.; Ikezaki, H.; Ujihara, T. Evaluation of the Umami Taste Intensity of Green Tea by a Taste Sensor. J. Agric. Food Chem. 2008, 56, 7384–7387. [Google Scholar] [CrossRef]
- Mizota, Y.; Matsui, H.; Ikeda, M.; Ichihashi, N.; Iwatsuki, K.; Toko, K. Flavor evaluation using taste sensor for UHT processed milk stored in cartons having different light permeabilities. Milchwissenschaft 2009, 64, 143–146. [Google Scholar]
- Tran, T.U.; Suzuki, K.; Okadome, H.; Homma, S.; Ohtsubo, K. Analysis of the tastes of brown rice and milled rice with different milling yields using a taste sensing system. Food Chem. 2004, 88, 557–566. [Google Scholar] [CrossRef]
- Sasaki, K.; Tani, F.; Sato, K.; Ikezaki, H.; Taniguchi, A.; Emori, T. Analysis of pork extracts by taste sensing system and the relationship between Umami substances and sensor output. Sens. Mater. 2005, 17, 397–404. [Google Scholar]
- Chen, R.; Hidekazu, I.; Toko, K. Development of sensor with high selectivity for saltiness and its application in taste evaluation of table salt. Sens. Mater. 2010, 22, 313–325. [Google Scholar]
- Cui, S.; Wang, J.; Geng, L.; Wei, Z.; Tian, X. Determination of ginseng with different ages using a taste-sensing system. Sens. Mater. 2013, 25, 241–255. [Google Scholar]
- Fukushima Prefecture. Japan. Available online: http://wwwcms.pref.fukushima.jp/download/1/nougyou.tikusan_20sanko-6.pdf (accessed on 25 February 2013).
- Ohsu, T.; Amino, Y.; Nagasaki, H.; Yamanaka, T.; Takeshita, S.; Hatanaka, T.; Maruyama, Y.; Miyamura, N.; Eto, Y. Involvement of the Calcium-sensing Receptor in Human Taste Perception. J. Biol. Chem. 2010, 285, 1016–1022. [Google Scholar] [CrossRef] [Green Version]
- Ojha, A.P.S.; Kapoor, A. Soil Moisture and Sunlight Monitoring-Controlling using Raspberry Pi for Greenhouse. Int. J. Innov. Trends Eng. 2017, 27, 1. [Google Scholar]
- Patil, A.; Khaire, R.M. Establishment of evaluation metric and quality analysis of enamel coating thickness and thermal resistivity of copper wire using arm7 processor. Int. J. Appl. Innov. Eng. Manag. 2014, 3. [Google Scholar]
- Patil, A.; Khaire, R.M. Automatic Resistance detection and Abrasion testing of copper wire used in transformer or motor windings by ARM 7 processor. Int. J. Emerg. Trends Technol. Comput. Sci. 2014, 3. [Google Scholar]
- Patil, A.B.; Ramesh, M.; Mishra, H.; Kumar, G. Automated railway track crossing and monitoring system using atmega 16 microcontroller. Int. J. Enhanc. Res. Sci. Technol. Eng. 2016, 5. [Google Scholar]


| Tea Type | pH Value |
|---|---|
| Black Tea | 4.9–5.5 |
| Green Tea | 7–10 |
| Oolong Tea | 5.9 to 8.2 |
| Lemon Tea | 3 |
| Parameter | Limiting Values |
|---|---|
| Input supply voltage | 5 V |
| Working current | 5–10 mA |
| pH detection range | 0–14 |
| Temperature detection range | 0–80 °C |
| Response time | ≤5 s |
| Stability time | ≤The 60 s |
| Output | Analog |
| Power consumption | ≤0.5 W |
| Working temperature | −10 to +50 °C |
| Working humidity | 95%RH(nominal humidity 65%RH) |
| pH Value | Output (V) |
|---|---|
| 4 | 3.071 |
| 7 | 2.535 |
| 10 | 2.066 |
| Set 1–10 g, 5 min, 100 mL | |||||||
|---|---|---|---|---|---|---|---|
| Orange Pekoe | CTC | Green Tea (Lipton) | Energy Drink Mix (Herbalife Nutrition) | ||||
| Voltage (V) | pH Value | Voltage (V) | pH Value | Voltage (V) | pH Value | Voltage (V) | pH Value |
| 2.84 | 4.08 | 2.88 | 3.89 | 2.74 | 4.69 | 2.58 | 5.60 |
| 2.85 | 4.06 | 2.88 | 3.88 | 2.74 | 4.69 | 2.57 | 5.62 |
| 2.85 | 4.06 | 2.88 | 3.87 | 2.74 | 4.69 | 2.57 | 5.64 |
| 2.85 | 4.06 | 2.88 | 3.87 | 2.74 | 4.70 | 2.57 | 5.62 |
| 2.85 | 4.06 | 2.88 | 3.87 | 2.73 | 4.70 | 2.57 | 5.63 |
| Set 2–10 g, 5 min, 170 mL | |||||||
|---|---|---|---|---|---|---|---|
| Orange Pekoe | CTC | Green Tea (Lipton) | Energy Drink Mix (Herbalife Nutrition) | ||||
| Voltage (V) | pH Value | Voltage (V) | pH Value | Voltage (V) | pH Value | Voltage (V) | pH Value |
| 2.80 | 4.31 | 2.82 | 4.23 | 2.71 | 4.87 | 2.53 | 5.86 |
| 2.80 | 4.31 | 2.82 | 4.20 | 2.71 | 4.82 | 2.54 | 5.83 |
| 2.81 | 4.30 | 2.82 | 4.20 | 2.71 | 4.85 | 2.53 | 5.86 |
| 2.81 | 4.30 | 2.82 | 4.20 | 2.71 | 4.85 | 2.52 | 5.91 |
| 2.81 | 4.29 | 2.82 | 4.20 | 2.71 | 4.84 | 2.53 | 5.85 |
| Set 3–10 g, 5 min, 230 mL | |||||||
|---|---|---|---|---|---|---|---|
| Orange Pekoe | CTC | Green Tea (Lipton) | Energy Drink Mix (Herbalife Nutrition) | ||||
| Voltage (V) | pH Value | Voltage (V) | pH Value | Voltage (V) | pH Value | Voltage (V) | pH value |
| 2.77 | 4.48 | 2.76 | 4.50 | 2.67 | 5.06 | 2.48 | 6.14 |
| 2.77 | 4.48 | 2.76 | 4.51 | 2.67 | 5.05 | 2.49 | 6.11 |
| 2.77 | 4.48 | 2.76 | 4.48 | 2.67 | 5.04 | 2.49 | 6.12 |
| 2.77 | 4.48 | 2.76 | 4.49 | 2.68 | 5.04 | 2.49 | 6.10 |
| 2.77 | 4.48 | 2.76 | 4.48 | 2.68 | 5.00 | 2.49 | 6.12 |
| Set 4–10 g, 5 min, 100 mL | |||||||||||
|---|---|---|---|---|---|---|---|---|---|---|---|
| Tulasi + CTC | Lemmon Grass + CTC | CTC-HOT | CTC-COLD | Ginger + CTC | Lemon + CTC | ||||||
| Voltage (V) | pH Value | Voltage (V) | pH Value | Voltage (V) | pH Value | Voltage (V) | pH Value | Voltage (V) | pH Value | Voltage (V) | pH Value |
| 2.74 | 4.65 | 2.75 | 4.59 | 2.87 | 3.91 | 2.87 | 3.94 | 2.83 | 4.15 | 3.18 | 2.14 |
| 2.74 | 4.66 | 2.76 | 4.58 | 2.88 | 3.88 | 2.87 | 3.95 | 2.84 | 4.12 | 3.19 | 2.12 |
| 2.75 | 4.61 | 2.76 | 4.57 | 2.88 | 3.87 | 2.87 | 3.96 | 2.84 | 4.12 | 3.19 | 2.12 |
| 2.74 | 4.65 | 2.76 | 4.58 | 2.88 | 3.87 | 2.87 | 3.92 | 2.84 | 4.12 | 3.19 | 2.12 |
| 2.74 | 4.65 | 2.76 | 4.56 | 2.89 | 3.84 | 2.87 | 3.94 | 2.84 | 4.12 | 3.19 | 2.12 |
| Tea | Sample | Mixture Concentration | Mean (X) of the pH Value | Standard Deviation (σ) of the pH Value | Remark |
|---|---|---|---|---|---|
| Black Tea | Orange Pekoe | 2% | 4.065 | 0.00671 | Medium flavor (Less acidic) |
| 6% | 4.296 | 0.00800 | Medium flavor (Less acidic) | ||
| 10% | 4.48 | 0.00000 | Mild flavor (Safe Acidic) | ||
| CTC | 2% | 3.869 | 0.01044 | Strong flavor (Acidic) | |
| 6% | 4.196 | 0.01428 | Medium flavor (Less acidic) | ||
| 10% | 4.493 | 0.01100 | Mild flavor (Safe Acidic) | ||
| Green Tea | Lipton | 2% | 4.687 | 0.00781 | Mild flavor (Safe Acidic) |
| 6% | 4.83 | 0.02191 | Mild flavor (Safe Acidic) | ||
| 10% | 5.03 | 0.01844 | Mild flavor (Safe Acidic) | ||
| Energy Drink Mix | Herbalife Nutrition | 2% | 5.621 | 0.01640 | Mild refreshing flavor (Safe Acidic) |
| 6% | 5.879 | 0.02625 | Mild refreshing flavor (Safe Acidic) | ||
| 10% | 6.118 | 0.01077 | Mild refreshing flavor (Safe Acidic) | ||
| Tulasi Tea | CTC+Tulasi | 2% | 4.633 | 0.01952 | Mild flavor (Safe Acidic) |
| Ginger Tea | CTC+Ginger | 2% | 4.123 | 0.00900 | Medium flavor (Less acidic) |
| Lemongrass Tea | CTC+Lemon grass | 2% | 4.56 | 0.01789 | Mild flavor (Safe Acidic) |
| Black tea | CTC +HOT | 2% | 3.866 | 0.02107 | Strong flavor (Acidic) |
| Black tea | CTC+COLD | 2% | 3.937 | 0.01187 | Strong flavor (Acidic) |
| Lemon Tea | CTC+Lemon | 2% | 2.122 | 0.00600 | Very strong flavor (Acidic) |
Publisher’s Note: MDPI stays neutral with regard to jurisdictional claims in published maps and institutional affiliations. |
© 2021 by the authors. Licensee MDPI, Basel, Switzerland. This article is an open access article distributed under the terms and conditions of the Creative Commons Attribution (CC BY) license (https://creativecommons.org/licenses/by/4.0/).
Share and Cite
Patil, A.; Bachute, M.; Kotecha, K. Identification and Classification of the Tea Samples by Using Sensory Mechanism and Arduino UNO. Inventions 2021, 6, 94. https://doi.org/10.3390/inventions6040094
Patil A, Bachute M, Kotecha K. Identification and Classification of the Tea Samples by Using Sensory Mechanism and Arduino UNO. Inventions. 2021; 6(4):94. https://doi.org/10.3390/inventions6040094
Chicago/Turabian StylePatil, Amruta, Mrinal Bachute, and Ketan Kotecha. 2021. "Identification and Classification of the Tea Samples by Using Sensory Mechanism and Arduino UNO" Inventions 6, no. 4: 94. https://doi.org/10.3390/inventions6040094
APA StylePatil, A., Bachute, M., & Kotecha, K. (2021). Identification and Classification of the Tea Samples by Using Sensory Mechanism and Arduino UNO. Inventions, 6(4), 94. https://doi.org/10.3390/inventions6040094