Abstract
Sensor applications for plant phenotyping can advance and strengthen crop breeding programs. One of the powerful sensing options is the automated sensor system, which can be customized and applied for plant science research. The system can provide high spatial and temporal resolution data to delineate crop interaction with weather changes in a diverse environment. Such a system can be integrated with the internet to enable the internet of things (IoT)-based sensor system development for real-time crop monitoring and management. In this study, the Raspberry Pi-based sensor (imaging) system was fabricated and integrated with a microclimate sensor to evaluate crop growth in a spring wheat breeding trial for automated phenotyping applications. Such an in-field sensor system will increase the reproducibility of measurements and improve the selection efficiency by investigating dynamic crop responses as well as identifying key growth stages (e.g., heading), assisting in the development of high-performing crop varieties. In the low-cost system developed here-in, a Raspberry Pi computer and multiple cameras (RGB and multispectral) were the main components. The system was programmed to automatically capture and manage the crop image data at user-defined time points throughout the season. The acquired images were suitable for extracting quantifiable plant traits, and the images were automatically processed through a Python script (an open-source programming language) to extract vegetation indices, representing crop growth and overall health. Ongoing efforts are conducted towards integrating the sensor system for real-time data monitoring via the internet that will allow plant breeders to monitor multiple trials for timely crop management and decision making.
1. Introduction
Plant growth and development are dynamic in nature, and phenotypes result from the cumulative effect of genetic and environmental factors’ interactions through the entire plant life cycle [1]. Plant breeders, agronomists, and farmers evaluate such crop phenotypic traits to characterize different plant genotype/variety–environment interactions, estimate key plant development stages and make crop selection/management decisions accordingly. Thus, quantifying plant phenotypes associated with different plant genetics under diverse environmental circumstances can improve the understanding of genotype-environment interactions (G × E). In general, this concept is applied for plant variety selection in standard crop breeding schemes [2,3].
Crop breeding is critical to enhance crop performance under climate change scenarios and address food security needs for the growing global population, which is expected to exceed nine billion by 2050 [4,5,6]. In the crop breeding programs, precise methods to assess plant phenotypes associated with key performance traits, such as yield potential, disease resistance, and drought tolerance, are required. Besides, accurate measurements are needed to ensure that plant varieties/cultivars with high performance are selected before distribution to farmers [7,8]. Nevertheless, traditional field phenotyping in crop breeding programs and genetics/genomics research can be laborious, time-consuming, and subjective. It is also quite often with limited access to environmental data, which is needed to integrate with phenotypic data for in-depth analysis [9,10].
Remote sensing platforms with image-based sensors for field-based high-throughput phenotyping (HTP) are practical techniques for increasing phenotype evaluation efficiency through automated or semi-automated data acquisition and analysis approaches [11,12,13]. The field-based HTP systems include phenotyping towers [14,15], field scanning platforms [16,17], autonomous ground-based systems or modified agricultural vehicles [18,19,20], systems such as unmanned aerial vehicles (UAVs), blimps and fixed-wing planes [21], and, more recently, low-orbiting satellites [22]. These platforms noticeably strengthen a crop breeding program’s capabilities to phenotype; however, these systems can be expensive and may not allow continuous crop monitoring with efficient utilization of resources (personnel, travel). Other common challenges encountered include operation skills, inadequate analysis tools, and restricted data collection frequency [23,24]. It is ideal for developing HTP tools for field-based conditions with reasonable cost and versatility, which are adaptable/expandable with third-party hardware and open-source software [24]. Such systems should closely monitor plants and allow data collection (sensor and weather) at high temporal resolution to provide high-precision phenotypic analysis to assess dynamic crop responses to the environment.
Internet of Things (IoT)-based systems are becoming more available and affordable, with automation and real-time decision-making capabilities in various fields, including agriculture and plant phenotyping [25,26,27]. Moreover, IoT systems are operated through open-source software, providing a broad range of interfacing solutions and options to adapt and extend based on diverse experimental scenarios [28]. Raspberry Pi products (https://www.raspberrypi.org (accessed on 10 January 2021) have broadened the IoT applications. Raspberry Pi camera performance has been evaluated and shown to produce high-quality imagery suitable for scientific and engineering applications [29,30,31]. For example, such a system has been applied to investigate cassava bacterial blight interactions in laboratory conditions [32], and normalized difference vegetation index (NDVI) extracted from such system could be applied to evaluate crop health and development [33].
In general, the Raspberry Pi RGB camera is used to extract plant features such as size, plant height, leaf counting, and color [34,35], as well as to detect plant phenology [36] and disease [37,38]. The applications of a multispectral camera (such as a camera with no infrared, commonly referred to as a NoIR camera) are sparse. The NoIR camera provides more information on plant health status, where the healthy plants absorb more visible light and reflect more near-infrared in general [39]. This allows the extraction of vegetation indices, such as NDVI, in addition to others, allowing better scope to extract more crop traits [40]. Moreover, this plant property also allows other benefits such as easier segmentation of the plants of interest from a background (e.g., weeds, soil, etc.). Thus, the integration of the RGB camera with the NoIR camera offers broader scope for plant science research, as explored in this study.
The overall research goal in the presented work was to develop a Raspberry Pi-based sensor system for automated in-field phenotyping and acquire high-frequency data to support crop breeding programs. Two camera systems (RGB and NoIR) were integrated to allow the extraction of vegetation indices that represent the crop vigor and health status of wheat. The imaging system was integrated with a weather station for microclimate monitoring to evaluate the dynamics of crop growth and development in a wheat breeding trial. The low-cost sensor system was developed using open-source hardware products such as Raspberry Pi. Open-source software, such as Python 3 and OpenCV, were utilized to automatically control the system’s operation and extraction of the digital plant traits (vegetation indices).
2. System Development
2.1. System Hardware
The sensor system’s main hardware was from StereoPi (Virt2real ltd., Moscow, Russia) [41], as shown in Figure 1. The StereoPi is a carrier board for a Raspberry Pi compute module 3+ lite with Cortex-A53 (ARMv8) 64-bit at 1.2 GHz processor and 1 GB RAM as a microprocessor to control the sensor system in this study (Raspberry Pi Foundation, Cambridge, England, United Kingdom). The module is flexible for developers to leverage the Raspberry Pi hardware and software stack in their customized system. The module was connected to two Raspberry Pi cameras, version 2 RGB and NoIR (no infrared filter above CMOS sensor), via camera serial interface ports on the StereoPi board. These camera sensors are based on the image sensor Sony IMX219PQ CMOS 8 megapixel (Sony Corporation, Tokyo, Japan), and the active pixel count of the camera is 3280 × 2464. The Witty Pi 3 board (UUGear, Prague, Czech Republic), connected via StereoPi general-purpose input/output (GPIO) pins, provides a real-time clock with an accuracy of ±2 ppm. In this study, the system was powered by a 4000 mAh Voltaic V15 USB battery (Voltaic Systems, Brooklyn, NY, United States), and it has an “Always On” mode. This mode will never turn off the battery while consuming only ~3 mA and supplying it to the sensor system. The battery and the Witty Pi 3 capabilities allowed the camera to automatically power ON–OFF in custom–duty cycles to control the data collection schedule and save the system’s energy consumption.
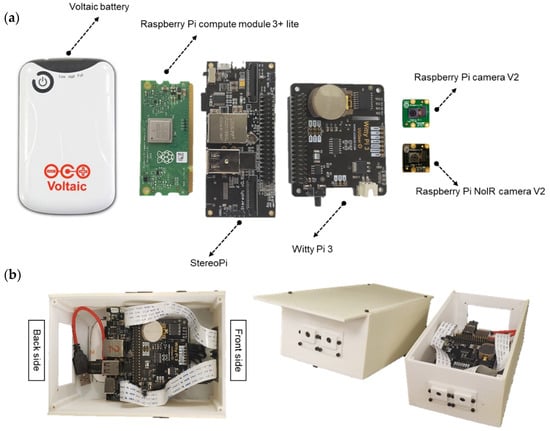
Figure 1.
Sensor system for field high-throughput phenotyping applications. (a) Individual components, and (b) the sensor system.
An enclosure for the camera was designed using the 3D Builder software (a free software operating on Windows Operating System, Microsoft Corporation, Albuquerque, NM, United States) and fabricated via a 3D printer with acrylonitrile butadiene styrene plastic filament (Ultimaker, Geldermalsen, The Netherlands). The system’s complete set-up (Figure 1b) was made up of the following four parts: main body, top, front, and back, assembled with M2 bolts.
2.2. Programming Code for System Operation
The Linux-based operating system Raspbian Buster was run on the sensor system, and the open-source Python 3 (Python Core Team 2015) was utilized as the primary programming language to command the board and the sensor system to capture images at a user-defined time point. Picamera was an essential Python library to create a time-lapse imaging algorithm to capture images in this study. Initially, the program was coded to automatically adjust white balance, image resolution, frame rate, exposure mode, and shutter speed associated with variable in-field lighting conditions. The program next controlled the camera to take a picture shot with a 30 s delay between each shot, thus capturing a total of 15 shots per time point. Therefore, from the StereoPi board function, the system could capture two images (from RGB and NoIR camera) simultaneously at a single shot, and the two images were captured on one screen. As the real-time clock of the Witty Pi 3 was synchronized with the sensor system, a timestamp for each captured image was recorded and saved as a file name on a secure digital (SD) card.
The camera system was scheduled to power ON–OFF automatically through the power management software from Witty Pi 3. Similarly, the time-lapse imaging script was run automatically once the operating system began using the Linux crontab scheduling system. In this study, the camera was controlled to capture images using the time-lapse script at the following four time points each day: 7.30, 10.30, 13.30, and 16.30 h. Therefore, for the one cycle at each time point, the sensor system was set to power ON for warming up the system before running the script for 15 min and power OFF after running the script for 15 min to assure all operations finished, as described in Figure 2. All the critical settings, such as imaging settings, the number of captured images, and the camera operation schedule, can be adjusted by the user based on their research objectives.
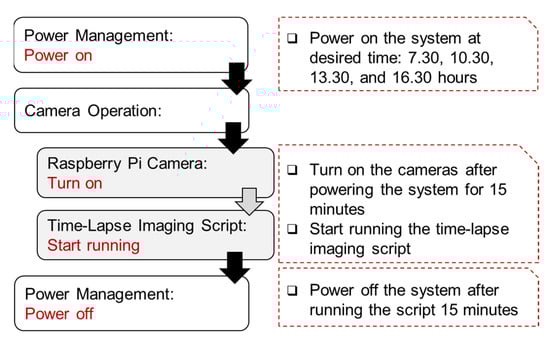
Figure 2.
System operation protocol at each time point. The user can define the operational settings, time points, and the number of images.
2.3. Weather Station and Reference Panel
The weather station ATMOS 41 (Meter Inc., Pullman, WA, USA) following ISO 22522 standards (ISO, 2007, p. 22522) and CR1000 dataloggers (Campbell Scientific, Logan, UT, USA) were utilized in the study to collect environmental data such as air temperature (resolution: 0.1 °C, accuracy: ±0.6 °C), solar radiation (resolution: 1 W/m2, accuracy: ±5%), and wind speed (resolution: 0.01 m/s, accuracy: ±3%). The weather station could operate with the power supplied from an external 12 VDC battery. In regard to the reference panel, the panel units were customized using tiles with the following three different colors: light brown, dark grey, and light grey. Spectroradiometer SVC HR-1024i, equipped with the leaf clip probe LC-RP PRO (Spectra Vista, Poughkeepsie, NY, USA) with a 350–2500 nm wavelength range, can be applied to measure the reflectance value of the panel units [42]. The reflectance data should be calculated for the wavelengths between 400 and 900 nm, covering the camera wavebands’ spectral region.
2.4. Field Installation
Five sensor systems with five reference panels, and the weather station, were installed in spring wheat field trials located near Pullman, WA (GPS: 46°41′49.9″ N, 117°08′59.1″ W) in the 2020 growing season. The field was planted in a randomized complete block design (RCBD) with 12 varieties, three replicates, and the plot size was 1.5 × 6.0 m, as shown in Figure 3a.
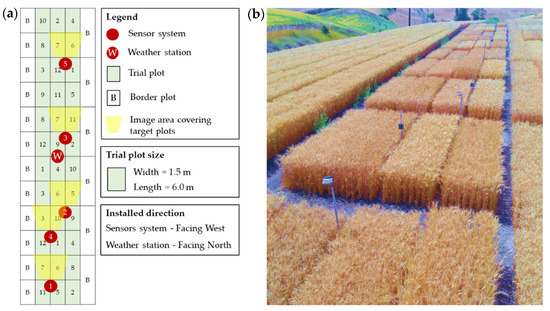
Figure 3.
Spring wheat field trials. (a) Installation map, and (b) sensor system on the field.
The sensors were installed facing toward the west side, and the cameras were set at 1.7 m above ground level (AGL) and 1.9 m away from the targeted plot boundary (Figure 4), and oriented 50–60° downward from a vertical plane to focus on the wheat plot for the growth stages from heading to maturity. In this study, the camera was adjusted to capture two targeted plots at the left and right sides of the reference panels. The distance between the reference panel stand and the camera stand was ~4.2 m (nearly the center of the two targeted plots). Additionally, the weather station was installed at 1.8 m AGL at the center of the field. The cameras, reference panels, and the weather station, were mounted on the aluminum pipes.
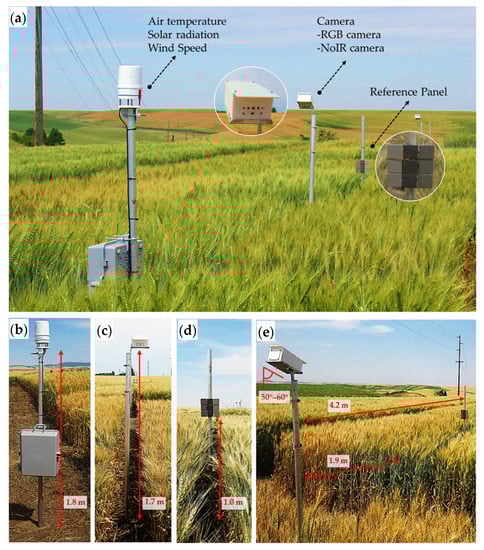
Figure 4.
Sensor system and associated components. (a) Complete sensor set-up, (b) the weather station installed at 1.8 m AGL, (c) the sensor system installed at 1.7 m AGL, (d) the reference panel installed at 1.0 m AGL, and (e) the sensor system angle (50–60° downward) installed at a distance of 4.2 m between the sensor system and the reference panel and 1.9 m between the sensor system and targeted plot boundary.
2.5. Digital Trait Extraction Programming Code
Based on the captured images, each image’s digital trait was extracted using OpenCV, the open-source computer vision library (http://opencv.org/, accessed on 10 January 2021). The image processing script was coded to create and extract the NDVI values of the targeted plant area on images from the NoIR sensor using Equation (1) [33]. The absence of the infrared filter results in each pixel’s red channel detecting both red and infrared radiation; thus, the red band can be applied as a near-infrared band to calculate NDVI.
where,
- NDVI = normalized difference vegetation index
- Blue = blue band of the image from the NoIR camera
- Red = red band of the image from the NoIR camera
In regard to the image processing steps, firstly, the code performs the separation of the RGB and NoIR images, and only the NoIR image was used to calculate the NDVI. With two camera systems, there is a possibility to extract several vegetation indices from both the RGB and NoIR camera bands, as well as plant height (stereo vision technique). Before beginning the NDVI calculation, the reflectance panel’s average pixel value was standardized (radiometric image correction was applied if necessary) on the red (near-infrared band in the NoIR camera) and blue bands. The NDVI was created following Equation (1) and, after that, plot segmentation (two targeted plots) was performed. The regions of interest (ROI) in this study were fixed. Lastly, the summary statistics of the NDVI data based on the ROI from each image were extracted, as described in Figure 5.
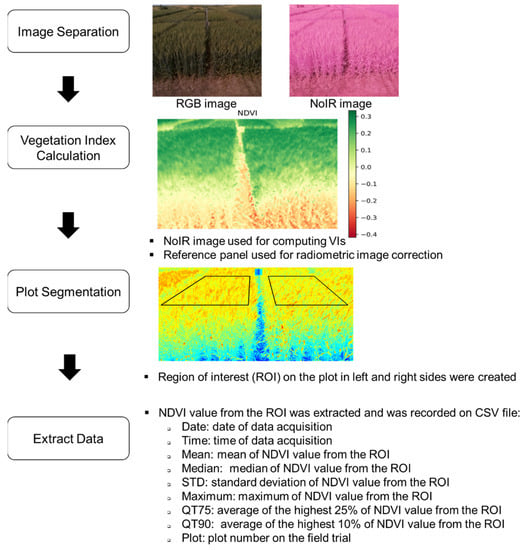
Figure 5.
Image processing pipeline prior to extracting the vegetation index.
3. System Evaluation
3.1. Camera Operations
The affordable hardware and open-source software for the sensor system in this study could successfully generate the multi-band image (RGB and NoIR image) with a high temporal resolution (targeted at four times a day for around one month of data collection). The sample raw data from two cameras are as shown in Figure 6. The resolution for a received image was 2560 × 1248 pixels; thus, each RGB or NoIR image resolution was 1280 × 1248 pixels individually. In addition, Figure 6 also presented the consistency of the sensor’s operation system and the camera efficiency in field research under different environmental conditions.
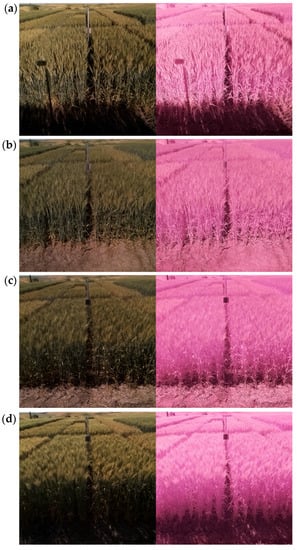
Figure 6.
Images from a sample sensor system on 18 July 2020 consisting of the images from RGB and NoIR cameras in one screen captured at (a) 7.30, (b) 10.30, (c) 13.30, and (d) 16.30 h.
The sensor system was installed in the field, starting from 7 July to 31 July 2020; however, the first week of installation was for testing the system and evaluating the factors that affected the image quality. The issues were resolved to establish the standard operating procedure to capture images using the sensor system. In this study, the challenges were the power for operating the cameras in the field, and after adjusting the automated setting for the power ON–OFF system as well as the operation of the time-lapse imaging script, the camera could operate for a maximum of five days without the need to re-charge. The system for storing images will be vital to consider as well because the data were stored on the SD card (32 GB) in the 2020 season, resulting in the operator having to manually access the data and charge the power to the system every five days. Thus, the power generating from the solar cell and cloud-based system or local database system for the 2021 season will be developed and integrated into the sensor system.
3.2. Image Analysis
The image processing algorithm analyzed the data offline using the Python 3 programming language, mainly utilizing the OpenCV library. The first step was to separate the RGB and NoIR images such that the same image resolution, as set in the time-lapse image acquisition algorithm, was used to get the individual images. Thus, the NoIR images were imported to create the NDVI images by splitting each band, and Equation (1) was used to calculate the NDVI image from the two bands. The plot segmentation process was semi-automated. Upon manual selection of four points of targeted plots (performed only on the first image), the point coordinates were applied to the remaining images from the same sensor. The statistical data, as described in Figure 5 from the targeted plot area, were extracted using the NumPy library (https://numpy.org/, accessed on 10 January 2021), and then the Pandas library (https://pandas.pydata.org/, accessed on 10 January 2021) was utilized to export the data in a comma-separated values (CSV) file format.
Figure 7 shows the sample mean NDVI data from the image processing script and the average field trial temperature at three time points within a day for a period of about one month. Overall, the trend of the NDVI data gradually declined along the period of data collection, as the sensor systems were installed starting at the mid to late heading stages of wheat and the data collection ceased at the ripening stage; thus, the trend of the NDVI curve related to the growth cycle of wheat represents maturity and senescence.
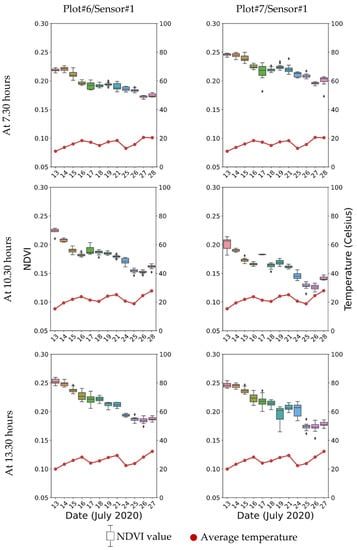
Figure 7.
Box plot of average NDVI data during the data acquisition period at different time points with temperature data from two representative plots.
Image processing for extracting digital traits was challenging as environmental factors, such as wind direction and speed, moved the sensor system position. This factor created a challenge in plot segmentation and ROI defining; thus, the process will be further automated using reference regions/objects in the future. Similarly, the different light intensity and quality of the camera sensor also impact the digital traits. Another aspect to consider is that the image viewpoint in this study was not from nadir, resulting in the wheat fields’ rectangular shape distorted within the images to a trapezoid. In the future, the geometric transformation (e.g., skew correction methods) will be applied before image processing and for a better comparison of the acquired UAV data.
The sensor system can provide multiple images, and image processing algorithms can be adapted to extract several traits. For instance, different vegetation indices can be estimated that represent canopy vigor and crop health (stress/disease). In addition, plant growth rate (plant height) and different stages of crop growth and development (emergence, heading, senescence) can also be estimated. Integrating the environmental data with the crop information (growth, development, disease, etc.) through the growing season can provide valuable data for genotype- environment studies, in order to understand the genetic variability of growth dynamics. These will assist in robust, accurate, and data-driven germplasm selection.
4. Discussion
Sensor applications for phenotyping (i.e., phenomics) continue to advance, primarily motivated by the necessity to boost genetic improvements in crops/plants for resource optimization, gains in yield, and overall quality. The development of sensors provides opportunities for researchers to assess precise phenotypes with a high temporal resolution, which can be associated with key performance and quality traits assisting in informed variety selection/development [43,44,45]. Moreover, high temporal resolution data allows scientists to define dynamic crop responses to the environment (genotype × environment interactions) to assess genotype performance.
In this study, open-source hardware and software platforms were utilized to develop an automated sensor system capable of capturing phenotypic data. The study specifically explored the utilization of the Raspberry Pi board as the main processing unit, integrated with a stereo camera board such as the StereoPi, to combine two Raspberry cameras (RGB and NoIR). There are several Arduino and Raspberry Pi options, in addition to those used in this study. For example, the Compute Module 4 IO board from Raspberry Pi can combine multiple cameras. Similarly, in this study, ATMOS 41 was selected as the main weather sensor based on the standardization and accuracy of the sensor to precisely analyze G × E interactions. Other soil sensors can also be integrated with the data loggers to capture more information. The integration of sensors to units such as Microsoft’s FarmBeats system is also an option [46]. The sensor system in this study can operate for up to 5 days without the re-charging of the battery. Integration with the solar panel would extend this capacity and potentially make the data collection process sustainable. In the current form, the capabilities can also be improved by limiting the images per time point and the number of time points, which would reduce the battery usage time.
In regard to the NDVI, the feature was extracted as it associates with crop biomass and yield [47]. It is also known to be a key trait associated with phenotyping applications in wheat breeding programs [48,49,50]. Therefore, the NDVI assessment can be used as a reference index for the dynamic monitoring of wheat growth. Researchers have used multiple sensing platforms over the growing season to capture NDVI data, including satellite [51], UAV [52], and proximal sensors [53]. In general, the NDVI value is low during the stem elongation/jointing stage, which reaches its maximum at around the booting/heading state. The NDVI values start to decrease slightly at the flowering/anthesis stage until the grain-filling and the ripening stage. Nevertheless, the NDVI estimates are influenced by many factors, such as measurement time, sensors, environmental conditions, and wheat varieties among others [54]. In this study, a similar profile of NDVI data (Figure 7) was observed with a decrease in NDVI values from the mid to late heading stages (13 July 2020), reaching flowering about one week later (20 July 2020), and finally, the NDVI values decreasing up to the grain-filling and maturity stages (27 July 2020). Besides, with two camera systems, more digital crop traits can be extracted for multivariate data analysis and understanding genotype and environment interactions.
In terms of data management in this study, an onboard data storage system was designed. There were two separate SD cards on the system; one installed with the Raspbian image and other operating systems to control the sensor system, and another with the universal serial bus (USB) card reader placed on the Stereo Pi board to store the images captured from the sensor system. With the 32 GB USB card used in this study, the estimated data size would be about 300 MB/day (~5 MB/image × 15 images/timepoint × 4 timepoints/day); therefore, the card could be used for up to approximately 100 days (that covers all critical stages of crop growth in spring wheat). However, storing the data at the site can be risky due to potential losses (e.g., sensor errors), and a backup plan is needed. This could be potentially resolved by incorporating internet capabilities. Another aspect of data management is data processing. Rapid data processing protocols are needed for the automated data processing and analysis. This could be performed over nighttime, through edge computing, with the implementation of the image processing algorithm onboard to quantify the NDVI value on the ROI. The values can be transmitted to end-users/local database/cloud system for further processing or sharing (web-based interface). Image quality is also an important aspect affecting the data quality, which can be affected by sensor specifications and environmental factors such as wind and rainfall.
For incorporating internet capabilities, Wi-Fi modem/router with a subscriber identity module (SIM) card slot will be installed in the field, which allows users to manage the sensor through virtual network computing (VNC) or secure shell (SSH) for manipulating and organizing the data remotely. Cloud computing can also be explored with such implementation. Given the functionality of the sensor system, integration with the internet to enable IoT capabilities would allow not only the dynamic sampling of crop growth and microclimate data, but also the real-time monitoring of crop growth.
5. Summary
The major capabilities of the sensor system are as described below:
- (1)
- The low-cost sensor systems with dual cameras assembled from broadly available hardware operating on open-source software enabling tasks for continuous crop monitoring, especially for in-field crop evaluation, which is essential for field phenotyping;
- (2)
- Camera operation script and automated trait analysis script integrated into the sensor system are open-source and expandable software based on community-driven numeric and scientific libraries, which are freely available and easily accessible.
Overall, the sensor system’s outputs had satisfactory performance in producing high-frequency data in field-based phenotyping environments. The system can give researchers access to an affordable option for high-throughput and accurate phenotyping in the absence of personnel, allowing the conservation of resources (time for travel and data acquisition in remote locations). Likewise, this system can improve the reproducibility of experiments and reliability of in-field phenotyping data as it can build large data sets. It also can uniquely provide the dynamic sampling of crop growth and development alongside microclimate data. Our ongoing efforts will also explore internet connection to convert the system with IoT capabilities and allow real-time monitoring and cloud computing.
Author Contributions
Conceptualization, W.S. and S.S.; methodology, W.S. and S.S.; software, W.S. and S.S.; validation, W.S., S.S., A.H.C. and M.O.P., formal analysis, W.S.; investigation, W.S., V.J., S.S., A.H.C. and M.O.P., resources, S.S., A.H.C. and M.O.P., data curation, W.S.; writing—original draft preparation, W.S.; writing—review and editing, W.S., S.S., A.H.C. and M.O.P., visualization, W.S.; supervision, S.S., A.H.C. and M.O.P., project administration, S.S., A.H.C. and M.O.P., funding acquisition, S.S., A.H.C. and M.O.P. All authors have read and agreed to the published version of the manuscript.
Funding
This research was funded by the Emerging Research Issues Internal Competitive Grant (20-04) from the College of Agricultural, Human, and Natural Resource Sciences Office of Research at Washington State University, and United States Department of Agriculture (USDA)—National Institute for Food and Agriculture (NIFA) Hatch Project (accession number 1014919).
Institutional Review Board Statement
Not applicable.
Informed Consent Statement
Not applicable.
Data Availability Statement
The data presented in this study are available on request from the corresponding author.
Conflicts of Interest
The authors declare no conflict of interest.
References
- Sidaway-Lee, K.; Josse, E.M.; Brown, A.; Gan, Y.; Halliday, K.J.; Graham, I.A.; Penfield, S. SPATULA links daytime temperature and plant growth rate. Curr. Biol. 2010, 20, 1493–1497. [Google Scholar] [CrossRef]
- Laughlin, D.C. The intrinsic dimensionality of plant traits and its relevance to community assembly. J. Ecol. 2014, 102, 186–193. [Google Scholar] [CrossRef]
- Scheres, B.; Van Der Putten, W.H. The plant perceptron connects environment to development. Nature 2017, 543, 337–345. [Google Scholar] [CrossRef]
- World Population Prospects 2019: Highlights; Department of Economic and Social Affairs, Population Division, United Nations: New York, NY, USA, 2019.
- Janssens, C.; Havlík, P.; Krisztin, T.; Baker, J.; Frank, S.; Hasegawa, T.; Leclère, D.; Ohrel, S.; Ragnauth, S.; Schmid, E.; et al. Global hunger and climate change adaptation through international trade. Nat. Clim. Chang. 2020, 10, 829–835. [Google Scholar] [CrossRef]
- Qaim, M. Role of new plant breeding technologies for food security and sustainable agricultural development. Appl. Econ. Perspect. Policy 2020, 42, 129–150. [Google Scholar] [CrossRef]
- Rouphael, Y.; Spíchal, L.; Panzarová, K.; Casa, R.; Colla, G. High-throughput plant phenotyping for developing novel biostimulants: From lab to field or from field to lab? Front. Plant Sci. 2018, 9, 1197. [Google Scholar] [CrossRef]
- Chawade, A.; van Ham, J.; Blomquist, H.; Bagge, O.; Alexandersson, E.; Ortiz, R. High-throughput field-phenotyping tools for plant breeding and precision agriculture. Agronomy 2019, 9, 258. [Google Scholar] [CrossRef]
- Furbank, R.T.; Tester, M. Phenomics—technologies to relieve the phenotyping bottleneck. Trends Plant Sci. 2011, 16, 635–644. [Google Scholar] [CrossRef]
- Cobb, J.N.; DeClerck, G.; Greenberg, A.; Clark, R.; McCouch, S. Next-generation phenotyping: Requirements and strategies for enhancing our understanding of genotype–phenotype relationships and its relevance to crop improvement. Theor. Appl. Genet. 2013, 126, 867–887. [Google Scholar] [CrossRef]
- Araus, J.L.; Cairns, J.E. Field high-throughput phenotyping: The new crop breeding frontier. Trends Plant Sci. 2014, 19, 52–61. [Google Scholar] [CrossRef]
- Shakoor, N.; Lee, S.; Mockler, T.C. High throughput phenotyping to accelerate crop breeding and monitoring of diseases in the field. Curr. Opin. Plant Biol. 2017, 38, 184–192. [Google Scholar] [CrossRef]
- Zhang, C.; Pumphrey, M.O.; Zhou, J.; Zhang, Q.; Sankaran, S. Development of an automated high-throughput phenotyping system for wheat evaluation in a controlled environment. Trans. ASABE 2019, 62, 61–74. [Google Scholar] [CrossRef]
- Naito, H.; Ogawa, S.; Valencia, M.O.; Mohri, H.; Urano, Y.; Hosoi, F.; Shimizu, Y.; Chavez, A.L.; Ishitani, M.; Selvaraj, M.G.; et al. Estimating rice yield related traits and quantitative trait loci analysis under different nitrogen treatments using a simple tower-based field phenotyping system with modified single-lens reflex cameras. ISPRS J. Photogramm. Remote Sens. 2017, 125, 50–62. [Google Scholar] [CrossRef]
- Shafiekhani, A.; Kadam, S.; Fritschi, F.B.; DeSouza, G.N. Vinobot and vinoculer: Two robotic platforms for high-throughput field phenotyping. Sensors 2017, 17, 214. [Google Scholar] [CrossRef]
- Vadez, V.; Kholová, J.; Hummel, G.; Zhokhavets, U.; Gupta, S.K.; Hash, C.T. LeasyScan: A novel concept combining 3D imaging and lysimetry for high-throughput phenotyping of traits controlling plant water budget. J. Exp. Bot. 2015, 66, 5581–5593. [Google Scholar] [CrossRef]
- Virlet, N.; Sabermanesh, K.; Sadeghi-Tehran, P.; Hawkesford, M.J. Field Scanalyzer: An automated robotic field phenotyping platform for detailed crop monitoring. Funct. Plant Biol. 2017, 44, 143–153. [Google Scholar] [CrossRef]
- Barmeier, G.; Schmidhalter, U. High-throughput phenotyping of wheat and barley plants grown in single or few rows in small plots using active and passive spectral proximal sensing. Sensors 2016, 16, 1860. [Google Scholar] [CrossRef]
- Young, S.N.; Kayacan, E.; Peschel, J.M. Design and field evaluation of a ground robot for high-throughput phenotyping of energy sorghum. Precis. Agric. 2019, 20, 697–722. [Google Scholar] [CrossRef]
- Iqbal, J.; Xu, R.; Sun, S.; Li, C. Simulation of an autonomous mobile robot for LiDAR-based in-field phenotyping and Navigation. Robotics 2020, 9, 46. [Google Scholar] [CrossRef]
- Sankaran, S.; Khot, L.R.; Espinoza, C.Z.; Jarolmasjed, S.; Sathuvalli, V.R.; Vandemark, G.J.; Miklas, P.N.; Carter, A.H.; Pumphrey, M.O.; Knowles, N.R.; et al. Low-altitude, high-resolution aerial imaging systems for row and field crop phenotyping: A review. Eur. J. Agron. 2015, 70, 112–123. [Google Scholar] [CrossRef]
- Zhang, C.; Marzougui, A.; Sankaran, S. High-resolution satellite imagery applications in crop phenotyping: An overview. Comput. Electron. Agric. 2020, 175, 105584. [Google Scholar] [CrossRef]
- Kelly, D.; Vatsa, A.; Mayham, W.; Ngô, L.; Thompson, A.; Kazic, T. An opinion on imaging challenges in phenotyping field crops. Mach. Vis. Appl. 2016, 27, 681–694. [Google Scholar] [CrossRef]
- Reynolds, D.; Baret, F.; Welcker, C.; Bostrom, A.; Ball, J.; Cellini, F.; Lorence, A.; Chawade, A.; Khafif, M.; Noshita, K.; et al. What is cost-efficient phenotyping? Optimizing costs for different scenarios. Plant Sci. 2019, 282, 14–22. [Google Scholar] [CrossRef]
- Gubbi, J.; Buyya, R.; Marusic, S.; Palaniswami, M. Internet of things (IoT): A vision, architectural elements, and future directions. Future Gener. Comput. Syst. 2013, 29, 1645–1660. [Google Scholar] [CrossRef]
- Yelamarthi, K.; Aman, M.S.; Abdelgawad, A. An application-driven modular IoT architecture. Wirel. Commun. Mob. Comput. 2017, 2017. [Google Scholar] [CrossRef]
- Roitsch, T.; Cabrera-Bosquet, L.; Fournier, A.; Ghamkhar, K.; Jiménez-Berni, J.; Pinto, F.; Ober, E.S. New sensors and data driven approaches—A path to next generation phenomics. Plant Sci. 2019, 282, 2–10. [Google Scholar] [CrossRef]
- Khanna, A.; Kaur, S. Evolution of internet of things (IoT) and its significant impact in the field of precision agriculture. Comput. Electron. Agric. 2019, 157, 218–231. [Google Scholar] [CrossRef]
- Pagnutti, M.A.; Ryan, R.E.; Gold, M.J.; Harlan, R.; Leggett, E.; Pagnutti, J.F. Laying the foundation to use Raspberry Pi 3 V2 camera module imagery for scientific and engineering purposes. J. Electron. Imaging 2017, 26, 013014. [Google Scholar] [CrossRef]
- Rehman, T.U.; Zhang, L.; Wang, L.; Ma, D.; Maki, H.; Sánchez-Gallego, J.A.; Mickelbart, M.A.; Jin, J. Automated leaf movement tracking in time-lapse imaging for plant phenotyping. Comput. Electron. Agric. 2020, 175, 105623. [Google Scholar] [CrossRef]
- Tausen, M.; Clausen, M.; Moeskjær, S.; Shihavuddin, A.S.M.; Dahl, A.B.; Janss, L.; Andersen, S.U. Greenotyper: Image-based plant phenotyping using distributed computing and deep learning. Front. Plant Sci. 2020, 11, 1181. [Google Scholar] [CrossRef]
- Mutka, A.M.; Fentress, S.J.; Sher, J.W.; Berry, J.C.; Pretz, C.; Nusinow, D.A.; Bart, R. Quantitative, image-based phenotyping methods provide insight into spatial and temporal dimensions of plant disease. Plant Physiol. 2016, 172, 650–660. [Google Scholar] [CrossRef]
- Glenn, D.M.; Tabb, A. Evaluation of five methods to measure normalized difference vegetation index (NDVI) in apple and citrus. Int. J. Fruit Sci. 2019, 19, 191–210. [Google Scholar] [CrossRef]
- Minervini, M.; Giuffrida, M.V.; Perata, P.; Tsaftaris, S.A. Phenotiki: An open software and hardware platform for affordable and easy image-based phenotyping of rosette-shaped plants. Plant J. 2017, 90, 204–216. [Google Scholar] [CrossRef]
- Tovar, J.C.; Hoyer, J.S.; Lin, A.; Tielking, A.; Callen, S.T.; Elizabeth Castillo, S.; Miller, M.; Tessman, M.; Fahlgren, N.; Carrington, J.C.; et al. Raspberry Pi–powered imaging for plant phenotyping. Appl. Plant Sci. 2018, 6, e1031. [Google Scholar] [CrossRef] [PubMed]
- Kim, T.K.; Kim, S.; Won, M.; Lim, J.H.; Yoon, S.; Jang, K.; Lee, K.H.; Park, Y.D.; Kim, H.S. Utilizing machine learning for detecting flowering in mid-range digital repeat photography. Ecol. Model. 2021, 440, 109419. [Google Scholar] [CrossRef]
- Gonzalez-Huitron, V.; León-Borges, J.A.; Rodriguez-Mata, A.E.; Amabilis-Sosa, L.E.; Ramírez-Pereda, B.; Rodriguez, H. Disease detection in tomato leaves via CNN with lightweight architectures implemented in Raspberry Pi 4. Comput. Electron. Agric. 2021, 181, 105951. [Google Scholar] [CrossRef]
- Barbacci, A.; Navaud, O.; Mbengue, M.; Barascud, M.; Godiard, L.; Khafif, M.; Lacaze, A.; Raffaele, S. Rapid identification of an Arabidopsis NLR gene as a candidate conferring susceptibility to Sclerotinia sclerotiorum using time-resolved automated phenotyping. Plant J. 2020, 103, 903–917. [Google Scholar] [CrossRef] [PubMed]
- Rodrigues, M.; Nanni, M.R.; Cezar, E.; dos Santos, G.L.A.A.; Reis, A.S.; de Oliveira, K.M.; de Oliveira, R.B. Vis–NIR spectroscopy: From leaf dry mass production estimate to the prediction of macro-and micronutrients in soybean crops. J. Appl. Remote Sens. 2020, 14, 044505. [Google Scholar] [CrossRef]
- Zhang, L.; Wang, L.; Wang, J.; Song, Z.; Rehman, T.U.; Bureetes, T.; Ma, D.; Chen, Z.; Neeno, S.; Jin, J. Leaf Scanner: A portable and low-cost multispectral corn leaf scanning device for precise phenotyping. Comput. Electron. Agric. 2019, 167, 105069. [Google Scholar] [CrossRef]
- Pomazov, E. Hands On. IEEE Spectr. 2021, 58, 14–16. [Google Scholar] [CrossRef]
- Wang, C.; Myint, S.W. A simplified empirical line method of radiometric calibration for small unmanned aircraft systems-based remote sensing. IEEE J. Sel. Top. Appl. Earth Obs. Remote. Sens. 2015, 8, 1876–1885. [Google Scholar] [CrossRef]
- Gizaw, S.A.; Garland-Campbell, K.; Carter, A.H. Evaluation of agronomic traits and spectral reflectance in Pacific Northwest winter wheat under rain-fed and irrigated conditions. Field Crop. Res. 2016, 196, 168–179. [Google Scholar] [CrossRef]
- Gizaw, S.A.; Godoy, J.G.V.; Pumphrey, M.O.; Carter, A.H. Spectral reflectance for indirect selection and genome-wide association analyses of grain yield and drought tolerance in North American spring wheat. Crop. Sci. 2018, 58, 2289–2301. [Google Scholar] [CrossRef]
- Martinez, S.A.; Godoy, J.; Huang, M.; Zhang, Z.; Carter, A.H.; Garland Campbell, K.A.; Steber, C.M. Genome-wide association mapping for tolerance to preharvest sprouting and low falling numbers in wheat. Front. Plant Sci. 2018, 9, 141. [Google Scholar] [CrossRef]
- Vasisht, D.; Kapetanovic, Z.; Won, J.; Jin, X.; Chandra, R.; Sinha, S.; Kapoor, A.; Sinha, S.N.; Sudarshan, M.; Stratman, S. Farmbeats: An IoT platform for data-driven agriculture. In Proceedings of the 14th (USENIX) Symposium on Networked Systems Design and Implementation ((NSDI) 17), Boston, MA, USA, 27–29 March 2017; pp. 515–529. [Google Scholar]
- Erdle, K.; Mistele, B.; Schmidhalter, U. Comparison of active and passive spectral sensors in discriminating biomass parameters and nitrogen status in wheat cultivars. Field Crop. Res. 2011, 124, 74–84. [Google Scholar] [CrossRef]
- Condorelli, G.E.; Maccaferri, M.; Newcomb, M.; Andrade-Sanchez, P.; White, J.W.; French, A.N.; Sciara, G.; Ward, R.; Tuberosa, R. Comparative aerial and ground based high throughput phenotyping for the genetic dissection of NDVI as a proxy for drought adaptive traits in durum wheat. Front. Plant Sci. 2018, 9, 893. [Google Scholar] [CrossRef]
- Krause, M.R.; Mondal, S.; Crossa, J.; Singh, R.P.; Pinto, F.; Haghighattalab, A.; Shrestha, S.; Rutkoski, J.; Gore, M.A.; Sorrells, M.E.; et al. Aerial high-throughput phenotyping enables indirect selection for grain yield at the early generation, seed-limited stages in breeding programs. Crop. Sci. 2020, 60, 3096–3114. [Google Scholar] [CrossRef]
- Kyratzis, A.C.; Skarlatos, D.P.; Menexes, G.C.; Vamvakousis, V.F.; Katsiotis, A. Assessment of vegetation indices derived by UAV imagery for durum wheat phenotyping under a water limited and heat stressed mediterranean environment. Front. Plant Sci. 2017, 8, 1114. [Google Scholar] [CrossRef]
- Moriondo, M.; Maselli, F.; Bindi, M. A simple model of regional wheat yield based on NDVI data. Eur. J. Agron. 2007, 26, 266–274. [Google Scholar] [CrossRef]
- Duan, T.; Chapman, S.C.; Guo, Y.; Zheng, B. Dynamic monitoring of NDVI in wheat agronomy and breeding trials using an unmanned aerial vehicle. Field Crop. Res. 2017, 210, 71–80. [Google Scholar] [CrossRef]
- Magney, T.S.; Eitel, J.U.; Huggins, D.R.; Vierling, L.A. Proximal NDVI derived phenology improves in-season predictions of wheat quantity and quality. Agric. For. Meteorol. 2016, 217, 46–60. [Google Scholar] [CrossRef]
- Crusiol, L.G.T.; Carvalho, J.D.F.C.; Sibaldelli, R.N.R.; Neiverth, W.; do Rio, A.; Ferreira, L.C.; Procopio, S.D.O.; Mertz-Henning, L.M.; Nepomuceno, A.L.; Neumaier, N.; et al. NDVI variation according to the time of measurement, sampling size, positioning of sensor and water regime in different soybean cultivars. Precis. Agric. 2017, 18, 470–490. [Google Scholar] [CrossRef]
Publisher’s Note: MDPI stays neutral with regard to jurisdictional claims in published maps and institutional affiliations. |
© 2021 by the authors. Licensee MDPI, Basel, Switzerland. This article is an open access article distributed under the terms and conditions of the Creative Commons Attribution (CC BY) license (https://creativecommons.org/licenses/by/4.0/).