1. Introduction
Apart from bids in generation and demand, an integral part of energy markets, the maintenance of frequency, and voltage in a grid within pre-determined limits of grid codes require the provision of ancillary services (AS) to support the transmission of electricity from generation to consumption with safety and security [
1,
2]. The distribution system operators (DSOs), transmission system operators (TSOs) and market operators (MOs) are responsible for the management of the AS. AS are not particularly defined to be applicable in each power system, because the need for these services is system dependent. The most representative example is the different AS requirements between the isolated and interconnected power systems or the different value of each AS, depending on the power system. More specifically, isolated insular power systems and interconnected power systems have significant differences, which include lower values of minimum to maximum demand ratio and increased stability problems, as smaller production or demand changes can lead to larger frequency or voltage deviations [
3]. Furthermore, higher uncertainties in load and RES (Renewable Energy Sources) power lead to increased reserve requirements.
The simplest and the most common classification of resource-based AS is to group them into
Frequency Control Services (like regulation, load following, operating reserves),
Voltage Control Services (through reactive power support) and
Emergency Services (by black-start services) [
4]. From the frequency control services perspective, the overall task of regulation is sometimes organized into a three-level hierarchy to maintain a continuous balance between supply and demand on a real-time basis. Primary, secondary and tertiary frequency control are the basic three methods that are used to accomplish frequency regulation. The inertial response of the synchronously connected generators correlates with primary control. Secondary control is responsible to refill the primary control reserves by the automatic generation control (AGC), while tertiary control refers to manual changes in dispatching and commitment of generating units [
5]. A similar hierarchy is also met with voltage control services. Local automatic control such as automatic voltage regulators (AVRs) (for generating units) is used to maintain the voltage at a given bus at its set point. Secondary voltage control manages the injection of reactive power within a regional voltage zone with the assist of local regulators while tertiary voltage control refers to the manual optimization of the reactive power flow across the power system [
6].
Due to the high installation share of renewable energy sources (RES) in last years, the need for AS becomes more crucial as these are mainly provided by the existing conventional units of a power system [
7,
8]. Extensive research has been made according to the international literature, proposing alternatives methods for AS provision. As an example, in [
9], an overview of key requirements for the provision of AS by distributed generation is provided. The ability of energy storage systems to provide AS, supporting the large scale RES integration in power systems has been evaluated [
10,
11]. An optimal scheduling model for microgrid resources is developed in [
12] to demonstrate the microgrid’s capability in offering AS to the utility grid. In addition, the combination of energy storage systems with distributed generation in microgrids have been examined to provide AS, such as frequency control and voltage regulation in the grid-connected mode [
13] or in isolated mode/islanded mode [
14,
15].
Besides the AS provision from generation, there is a variety of AS strategies from the demand-side perspective. According to the fast response of load demand curtailment, demand response (DR) can be utilized as a superior technique of AS. DR, during periods of system stress, can be an important resource to enhance the flexibility of power systems balancing the uncertainties of intermittent RES generation [
16]. Such an approach has also higher social welfare value compared to the massive activation of under-frequency protection schemes, which is the typical solution under such circumstances to avoid massive brown or even black-outs of the power system. It is worth mentioning that the consumers with the highest competition in DR programs and the most interest through the literature are the industrial ones. The strong economic incentive due to the intense power consumption and the existing advanced monitoring and control infrastructure gives an important role to Industrial loads in AS provision via DR [
17,
18]. In [
19] the potential of DR to provide AS, in terms of economic value and implementation challenges is assessed. Furthermore, there is a different approach to DR which relates to small prosumers. More specifically, the prosumer, that is a consumer and a producer of energy in the same entity can participate in DR programs [
20,
21].
This paper proposes a new concept of AS suppliers from the demand-side perspective. This concept relates to the utilization of demand-side generating assets (DSGA). These are small, existing diesel generators such as Gensets, serving the critical loads of infrastructures in unexpected consumer’s interruptions. However, the basic reason for proposing this approach is the fact that considering DSGA as an AS provider has two distinct benefits: (A) Short time of implementation as the assets are already available and, (B) rather limited required capital resources, which have been in detail described and evaluated in this paper. Hence, the basic comparison regarding the proposed AS providers, are focused on other similar existing techniques of AS. In this respect, their impact on local reliability is examined by evaluating their contribution to substation overloading limitation and its copper losses reduction. For this purpose, the substation of Stalida on the eastern side of the island power system of Crete is used as a case study. In this way, the effect of local distributed guaranteed power which enhances the microgrid operation at the distribution level (LV and MV), in such a crucial issue of local reliability improvement is assessed. According to this analysis, the local contribution of DSGA in a typical overloaded substation such as the Stalida substation during the summer period, is remarkable. More specifically, the existence of DSGA in the voltage level of MV and LV can considerably reduce, even to eliminate the overloading and the copper losses of substation transformers (HV/MV), enhancing their reliability.
The objective of this paper is to provide an indicative cost analysis for the investigation of the DSGA operating framework within the contemporary energy markets. Therefore, their necessary configurations or adaptations are proposed to offer AS to the electrical grid. A detailed techno-economic analysis is provided, proposing the costs for the required configurations in terms of DSGA access to the electrical grid. The corresponding costs are classified into the different sizes of DSGA taking into account the cost for their necessary configurations as well as their fuel consumption cost, which is compared with that of the oldest and most expensive gas turbines of the Cretan power system. The results of these calculations show that the fuel consumption cost of DSGAs are not only comparable to that of the gas turbines, but is proven to be lower than the most expensive gas turbines of the Cretan power system. Their capital and operating costs are then taken into account to make an initial proposal of their remuneration compared with the actual remuneration of Genset rentals on the island of Crete. Regarding this comparison, the proposed DSGA’s remuneration prices are significantly lower than the prices that arise from the existing remuneration framework of Genset rentals in the Cretan power system.
The paper is organized as follows:
Section 2 contains the DSGA impact assessment in terms of AS provision in distribution systems, by examining their contribution to the reduction of overloading and copper losses on substation level.
Section 3 contains the cost-analysis for DSGA including the costs for the required configurations as well as the corresponding research for their fuel consumption.
Section 4 contains an initial proposal for DSGA remuneration prices.
Section 5 concludes the paper.
2. DSGA Impact on Overloading and Copper Losses of Substation Transformers
This section evaluates the impact of DSGA at the substation level of a power system enhancing the concept of microgrids operation. It focuses on the contribution of DSGA to the overloading limitation in case of emergency or maintenance and copper losses reduction at the substation level. For this purpose, a critical substation of the island power system of Crete is used as a case study.
Crete is the largest Greek island and the fifth-largest island in the Mediterranean Sea with 623,065 people [
22]. The population is significantly increased during the summer period due to tourists influencing the peak demand. Its power system is the largest isolated island power system in Greece with an instantaneous peak demand that has reached 707 MW and annual energy demand of 3.2 TWh [
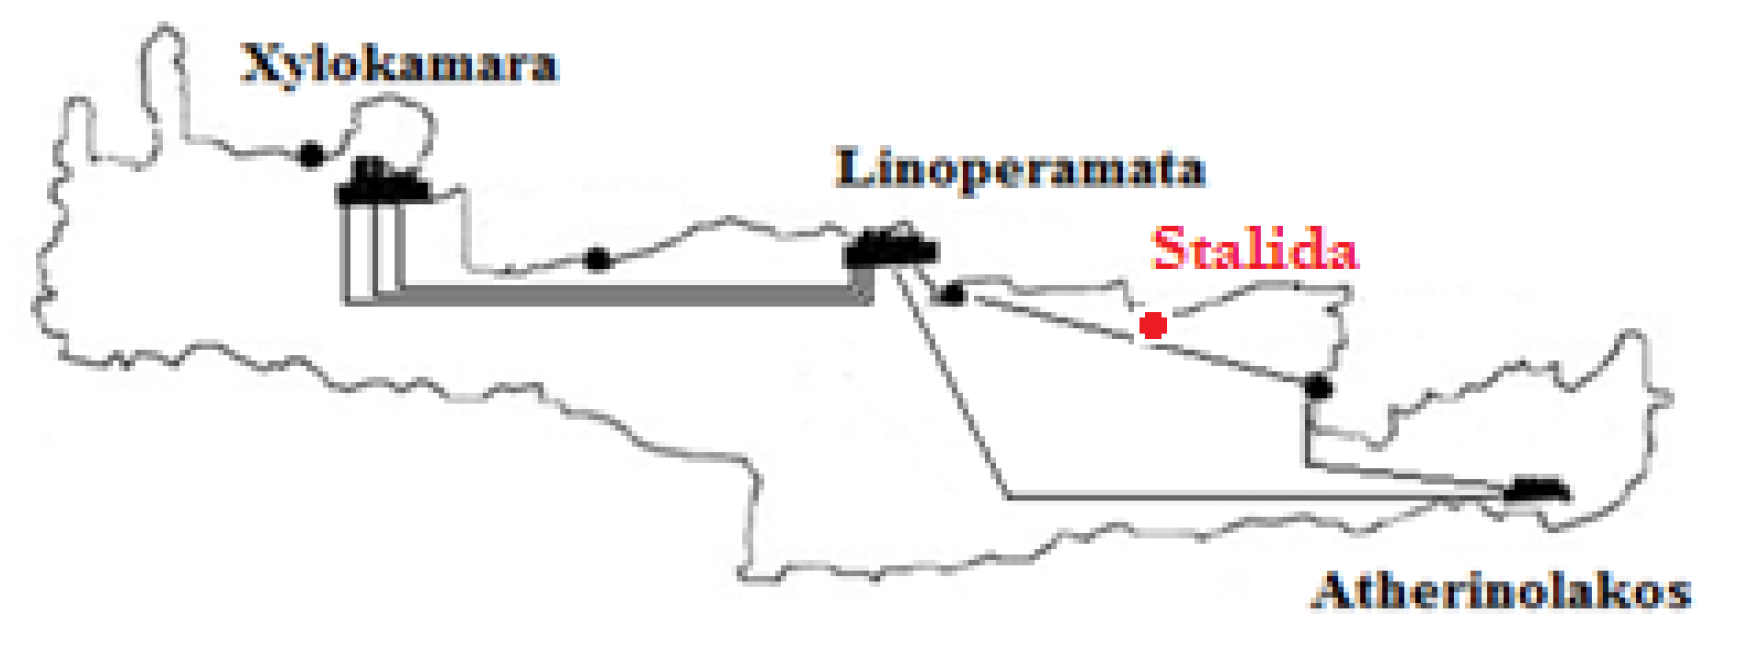
23]. The total capacity of installed conventional units (steam turbines, internal combustion engines (ICE), open cycle gas turbines (OCGT), and one combined cycle (CC) unit) reaches in total the 824.8 MW which have been installed in three power stations, namely Xylokamara, Linoperamata and Atherinolakos [
24] (
Figure 1). There are also 38 wind parks with a total installed capacity of about 200 MW and about 96 MW of more than 1000 small PV parks (mainly of 80 kW each) and 1800 roof PVs.
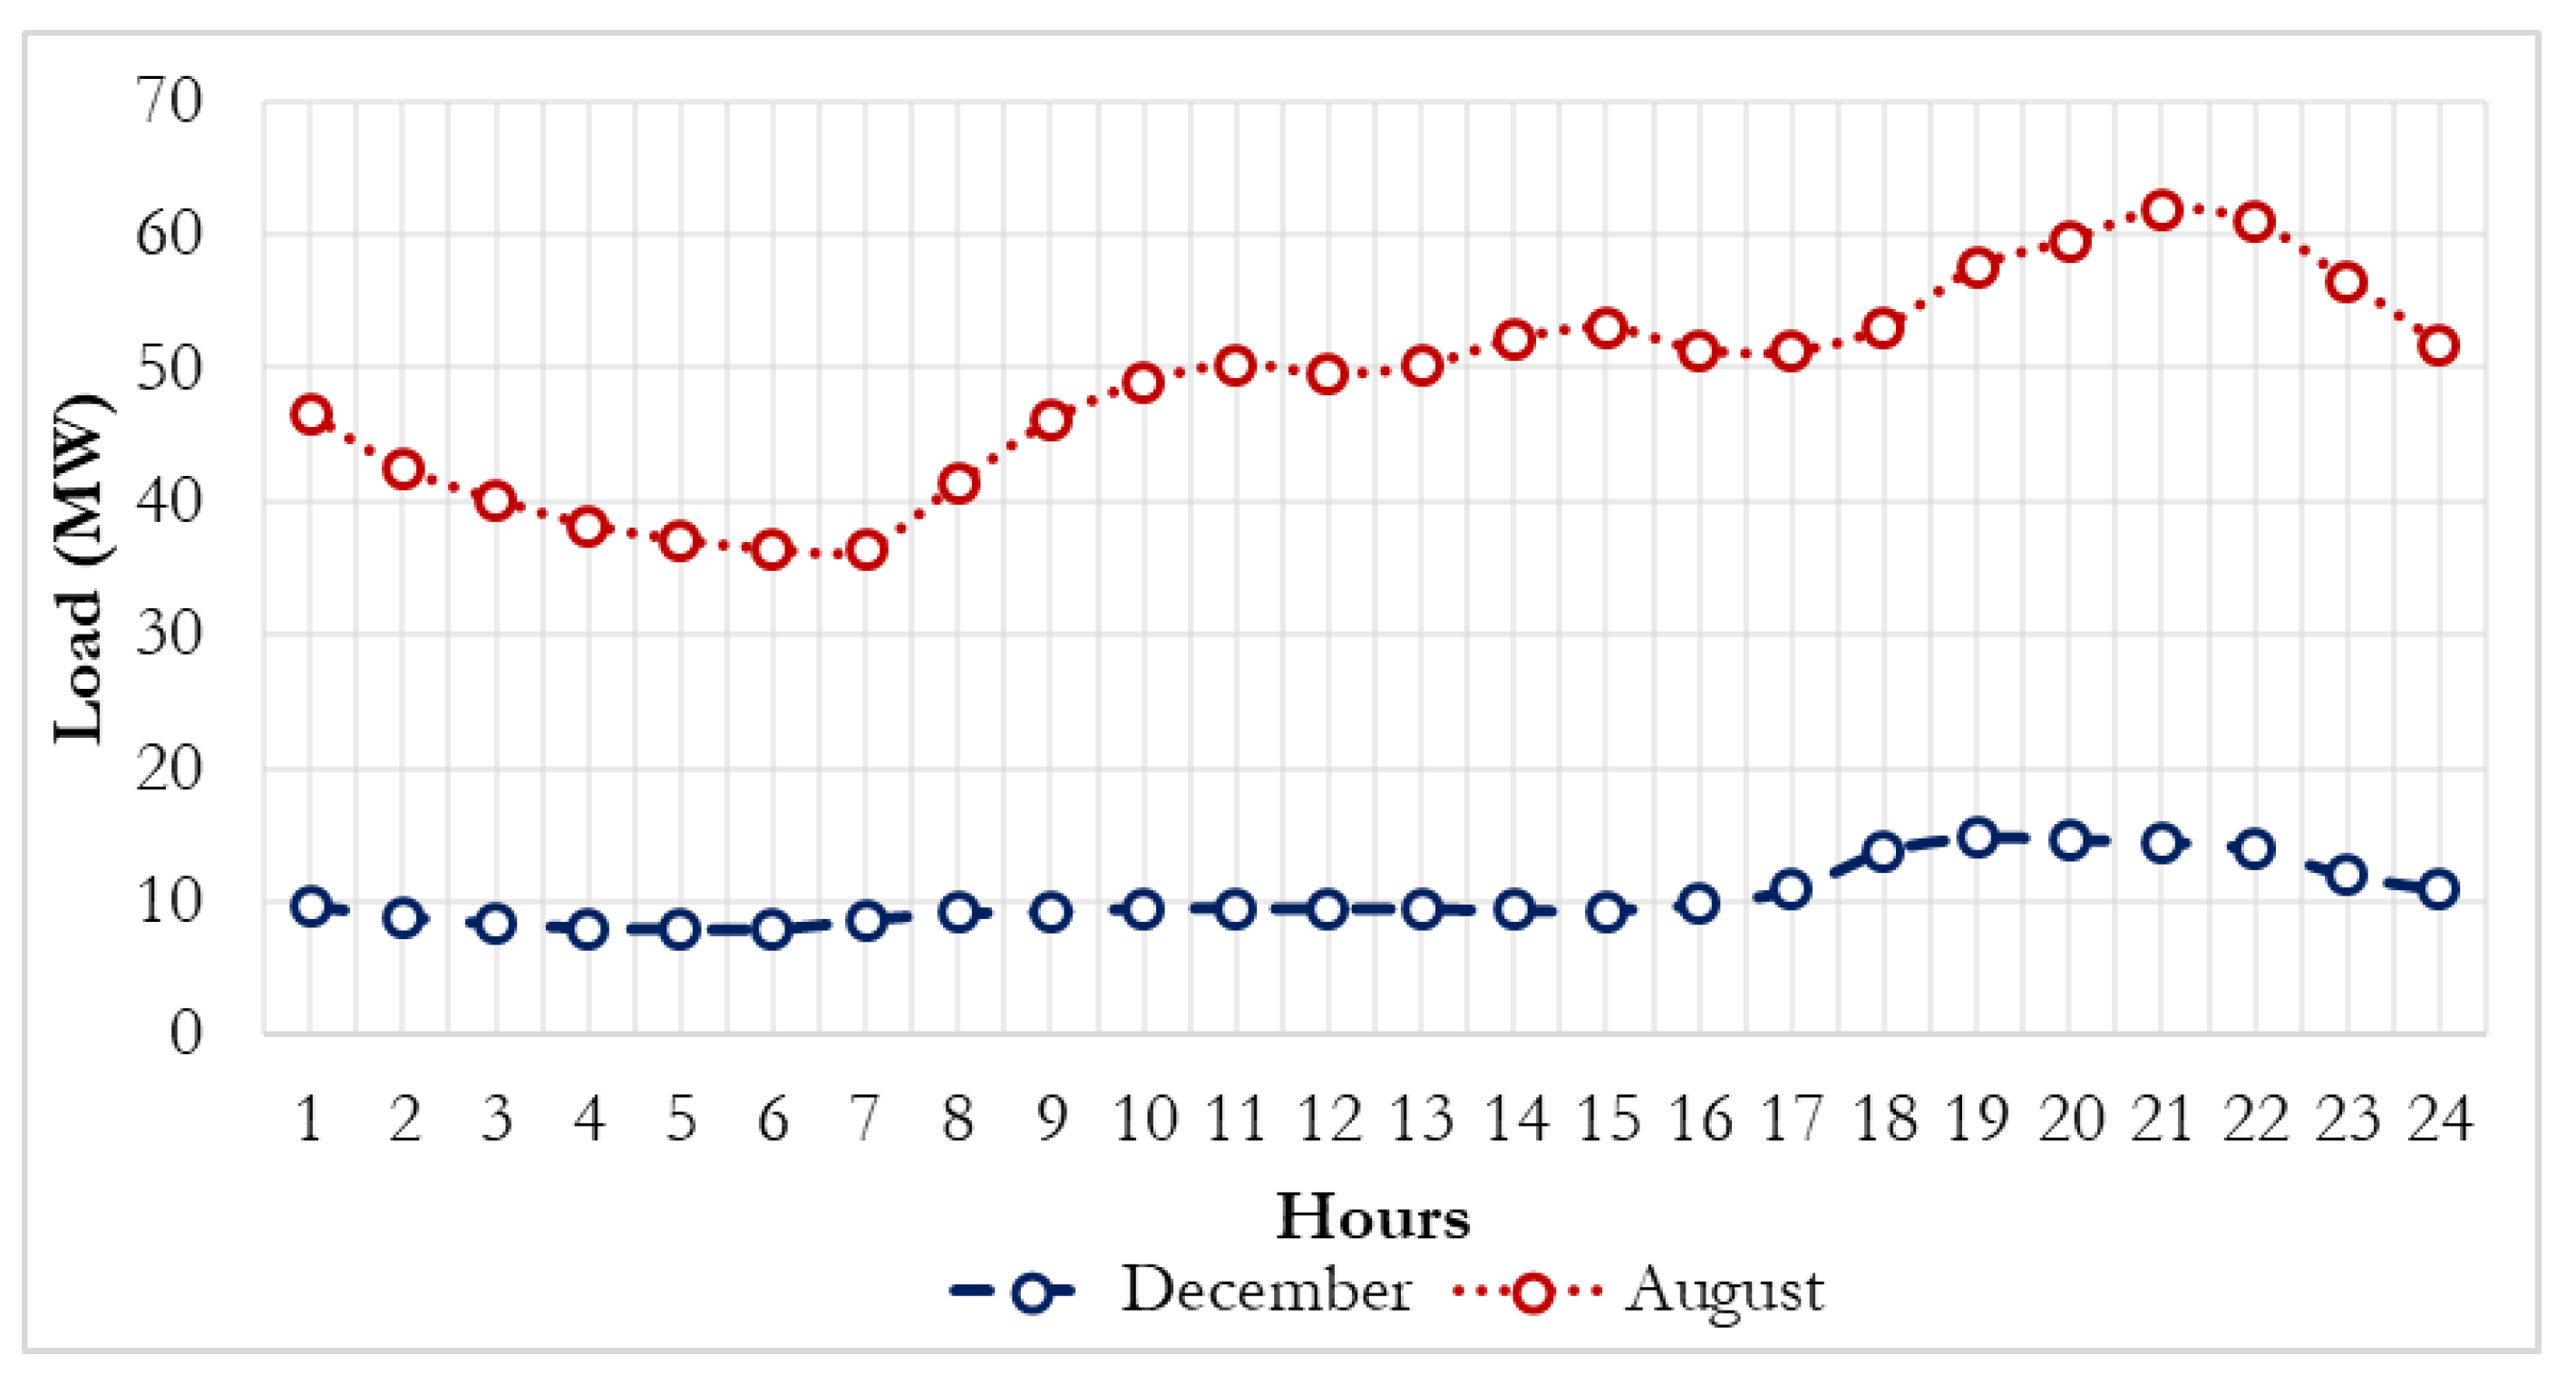
The substation with the major issue regarding its HV/MV (150 kV/20 kV) transformers overloading is the substation of Stalida in eastern Crete. It consists of two HV/MV transformers, 2 × 50 MVA, serving an area with a summer load profile (
Figure 2). Thus, the overloading issues as well as the high copper losses are exclusively observed during the summer period.
2.1. Substation’s Overloading
The rule that is used to determine the “overloading” is the “N-1 criterion” [
25,
26] regarding the load that served by the substation and the number of its transformers. More extensively, in this case, the “N-1 criterion” states that the substation is able to withstand at an unexpected outage of a single transformer or bay. Therefore, the remaining in operation transformers should have the ability to serve the load demand otherwise, the substation is considered as overloaded. To have a comprehensive view, how often the “N-1 criterion” is not satisfied for the substation of Stalida for each hour of these five representative months was estimated. To identify this issue, the following consideration was made. Since the examined substation has 2 × 50 MVA transformers, the load that served has to be less than the value of the rated power of the remaining transformer. Therefore, setting a power factor cos φ = 0.95, the highest desired load was set at P
maxLoad =50 MVA * 0.95= 47.5 MW. Having its hourly load demand, the number of hours that the load exceeded the power of 47.5 MW were calculated.
At this point, it should be mentioned that through extensive research and according to specific data for Gensets installed capacity in various infrastructures of Crete island, it is estimated that their potential in Stalida substation is approximately 20MW. A considerable amount of DSGA capacity arises mainly from accommodation infrastructures due to the high tourist activity of the area served—about 100,000 beds. Subsequently, their utilization leads to a significant amount of local power generation. In this respect, a substation shall be treated as a microgrid providing a significant amount of local distributed guaranteed power. Such a microgrid can offer AS to the electrical grid via the DSGA, but also could support the islanding operation in extreme events, especially during off summer season when the low demand is low.
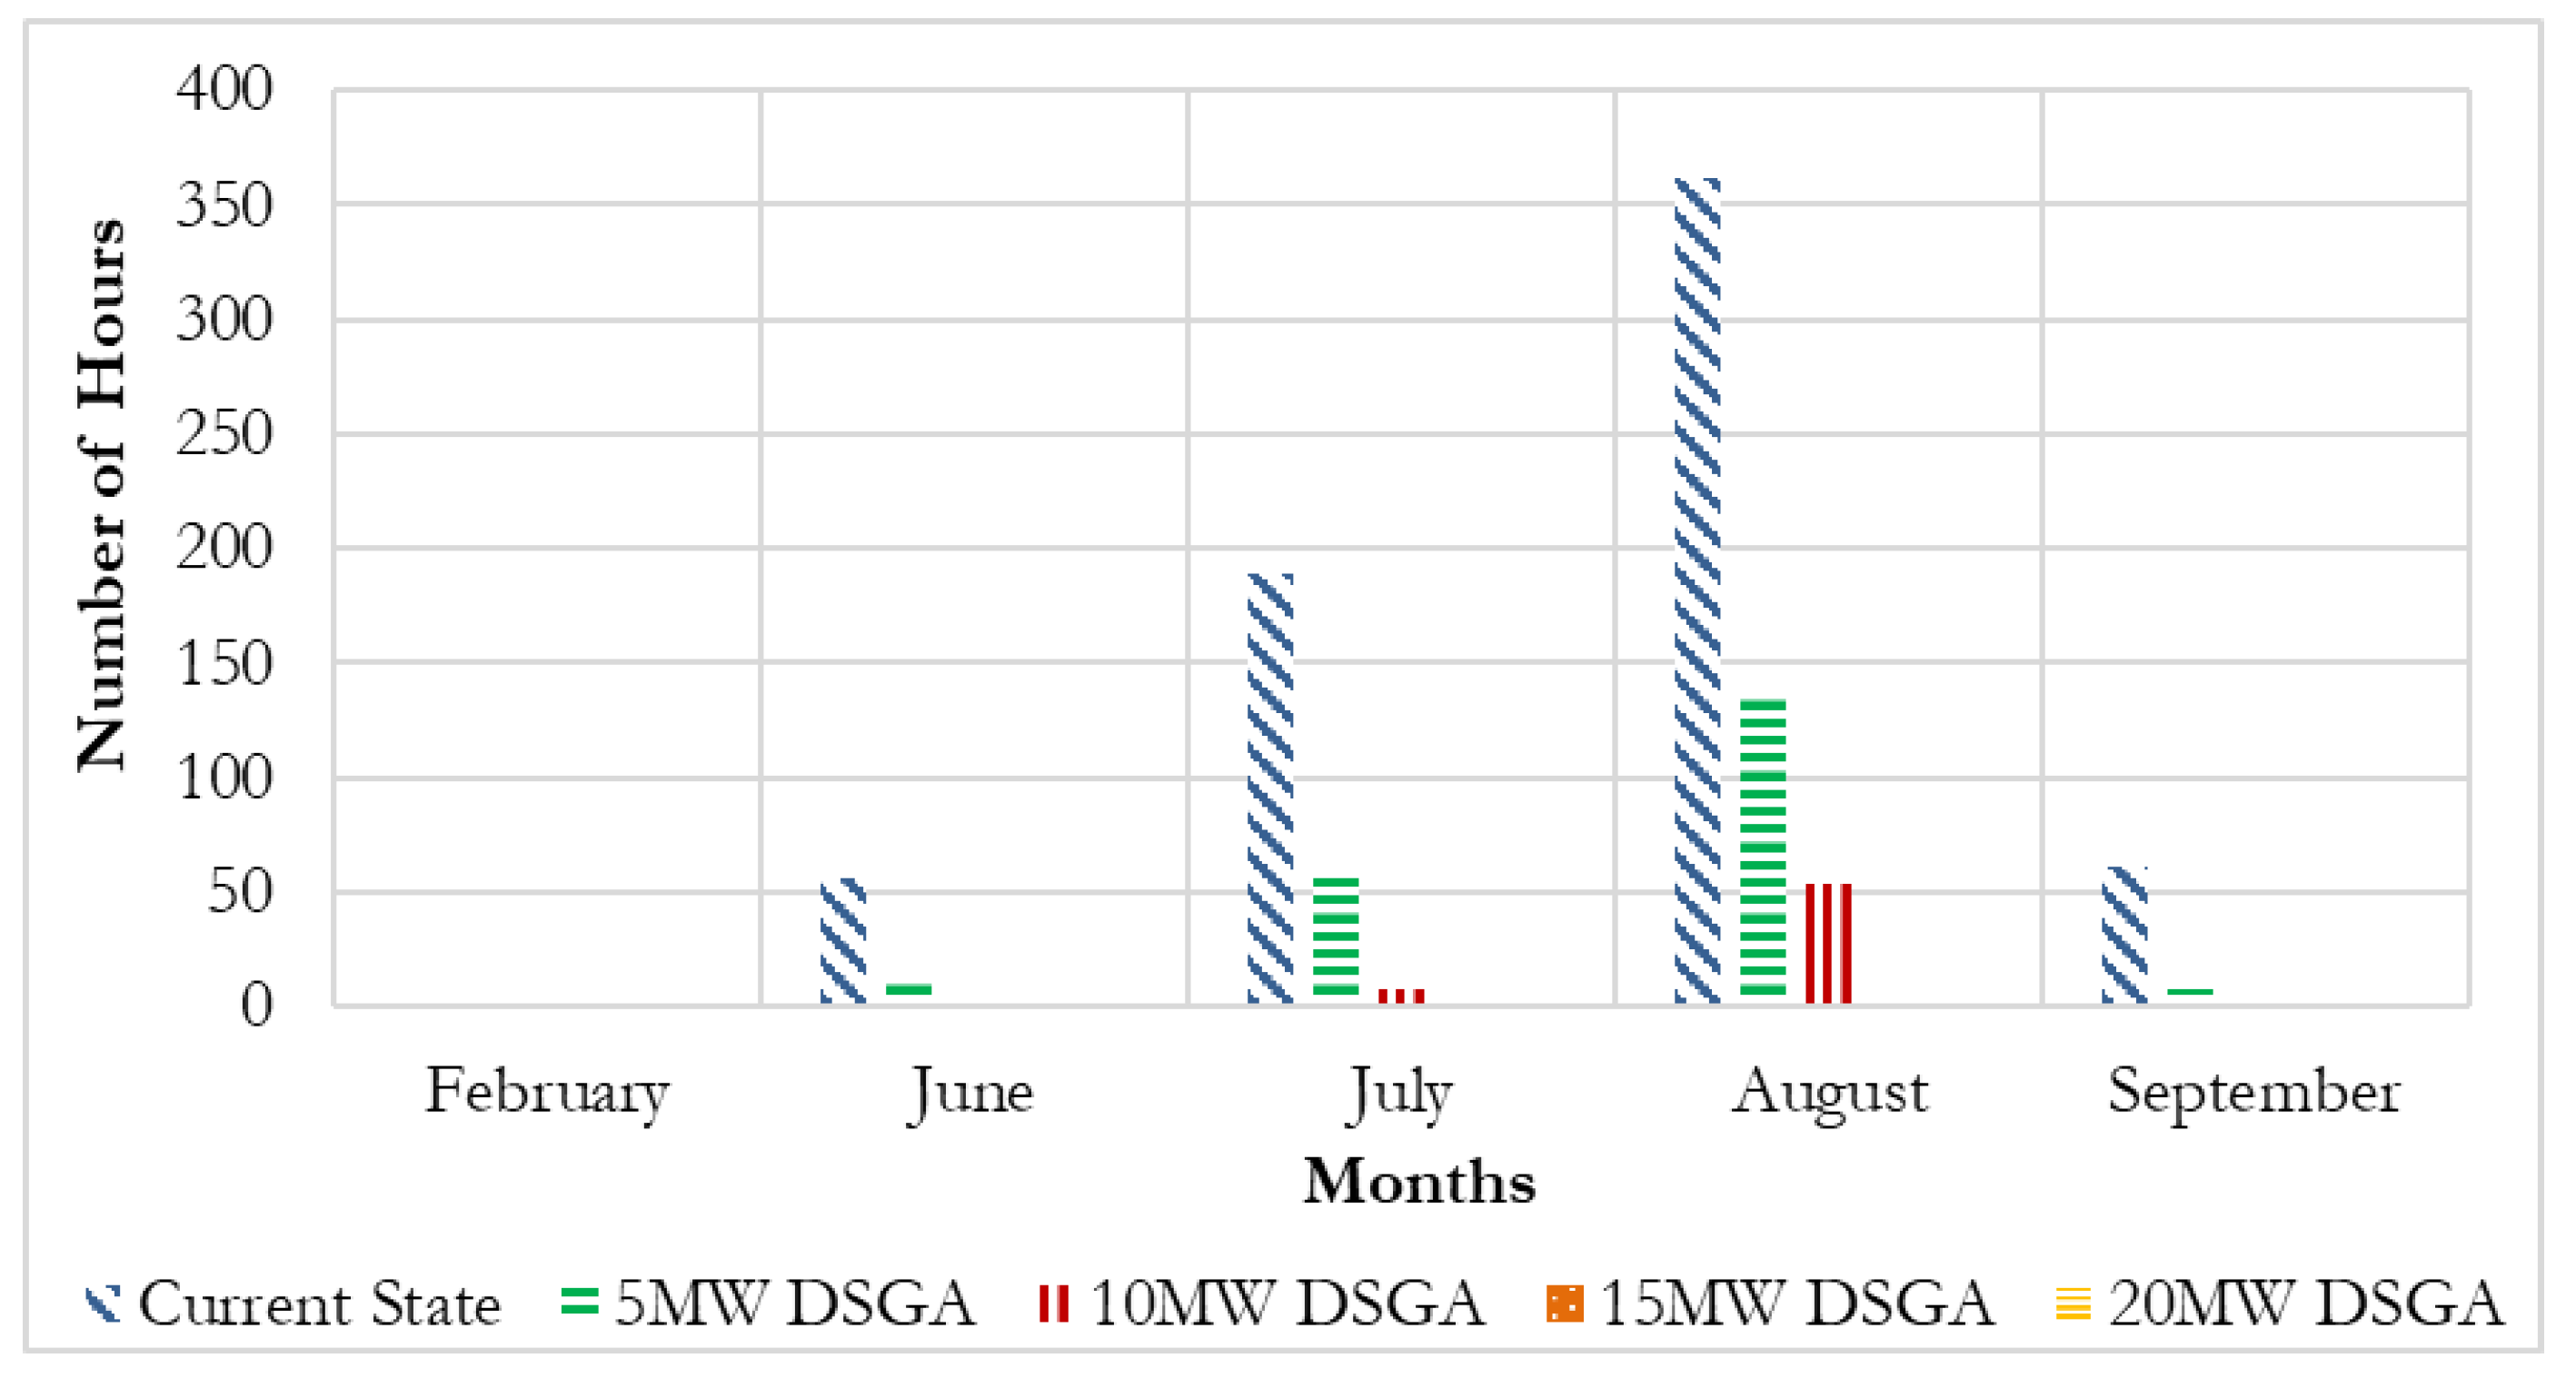
In this section, the effect of DSGA at the local/microgrid level is analyzed by investigating their contribution to the reduction of substation transformers overloading. According to
Figure 3, this issue is particularly critical only during the summer months as the substation loading in almost half of the hours in August was higher than 47.5 MW. This proves that during these hours, the “N-1 criterion” was not being satisfied and as a result, the substation was overloaded. With the utilization of 5-MW and 10-MW DSGA, reduction of 61.9% and 85.4% is achieved, respectively, regarding the number of hours that the loading is higher than 47.5 MW in August. Furthermore, the maximum hourly load during summer and therefore during the whole year was 61.9 MW in 2018. Consequently, the required DSGA power to ensure that the “N-1 criterion” is satisfied is 61.9 MW − 47.5 MW = 14.4 MW.
Figure 3 shows that for 15-MW DSGA installed capacity and above, there is not an hour with a substation loading over 47.5 ΜW.
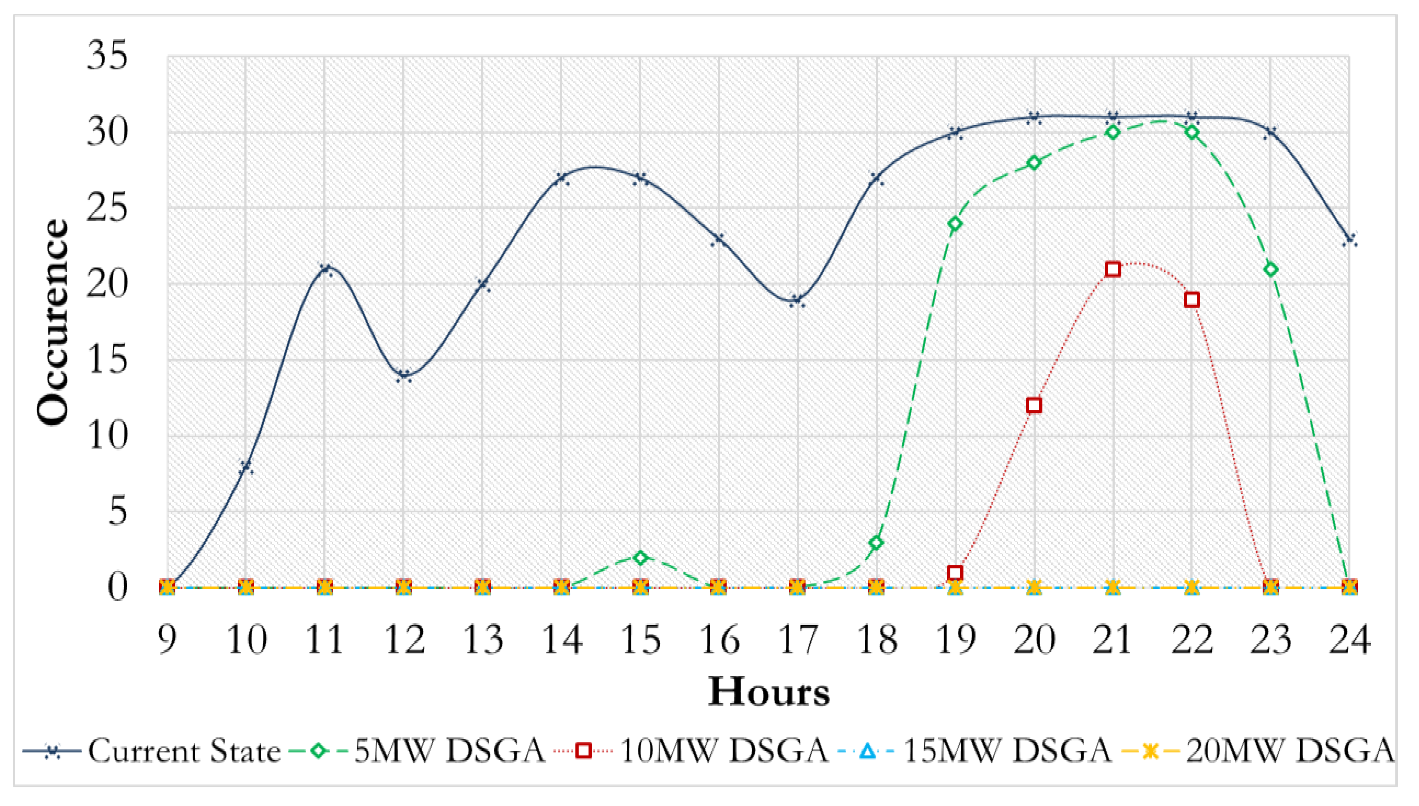
Respectively, in terms of hourly analysis, the examined issue is observed mainly during the hours of 19:00–00:00, according to
Figure 4. It is worth mentioning that during all days of August, the substation was overloaded in hours 20:00–23:00, as the load demand exceeded the value of 47.5 MW. The utilization of 5-MW DSGA does not significantly contribute to the loading reduction of substation during the peak hours of 21:00–23:00 while in contrast, the installed capacity of 10-MW DSGA gives a 32.3% reduction (−10 h) from 21:00–22:00. As was mentioned before, from 15 MW and above, the overloading issue is solved for all the hours of the year in view of the “N-1 criterion”.
2.2. Substation’s Copper Losses
A side benefit that arises from DSGA integration at the MV level is the reduction of copper losses. To quantify these benefits, the transformers’ copper losses at full load (128.445 kW), as well as the hourly load of Stalida substation were provided by [
23]. Therefore, it was feasible to calculate the hourly copper losses of 2 × 50 MVA HV/MV Stalida transformers in the current state and after the integration of DSGA.
Table 1 presents the average hourly copper losses of Stalida substation in its current state compared with four different scenarios of Gensets’ installed capacity. The examined time period was 20:00–23:00 for August when the load demand and subsequently the copper losses reach their highest values. In 21:00–22:00 with 5-MW and 10-MW DSGA, the reduction exceeds the 16% and 31%, respectively, while with the integration of 20-MW DSGA the reduction almost reaches the 60% in comparison with the current state. This is another evidence, in combination with the substation loading reduction, that the DSGA could be used as AS techniques alleviating the adverse effects of substation elements malfunction in the reliability indices [
27], which are examined in this paper. By exploiting the local generation ability of DSGA the power flow from Transmission to Distribution system through the HV/MV transformers is decreased, reducing their loading and their corresponding copper losses. In this regard, the reliability of the substation and its elements should be enhanced by utilizing the DSGA of the electrical grid.
3. Techno-Economic Analysis
In terms of the investigation of the existing DSGA contribution in the operation of the Cretan power system, the techno-economic analysis for their examined integration is evaluated. The typical operating cost (techno-economic characteristics) of Gensets is estimated so that it is capable to calculate the potential compensation for the provision of AS in the electrical grid. In addition, the cost of the required automation systems to support their operation for AS provision to the electrical grid will be estimated, considering the existing switching infrastructure as given. More specifically, in the case of Gensets participation in AS markets, requiring connection to the grid, the following necessary fixed and operating costs should be determined when designing remuneration practices:
Synchronization and Protection Cost (initial capital/fixed)
Monitoring and Control Equipment Cost (initial capital/fixed)
Telecommunication Cost (initial capital and operating cost)
Maintenance Cost (operating cost)
Fuel Consumption Cost (operating cost)
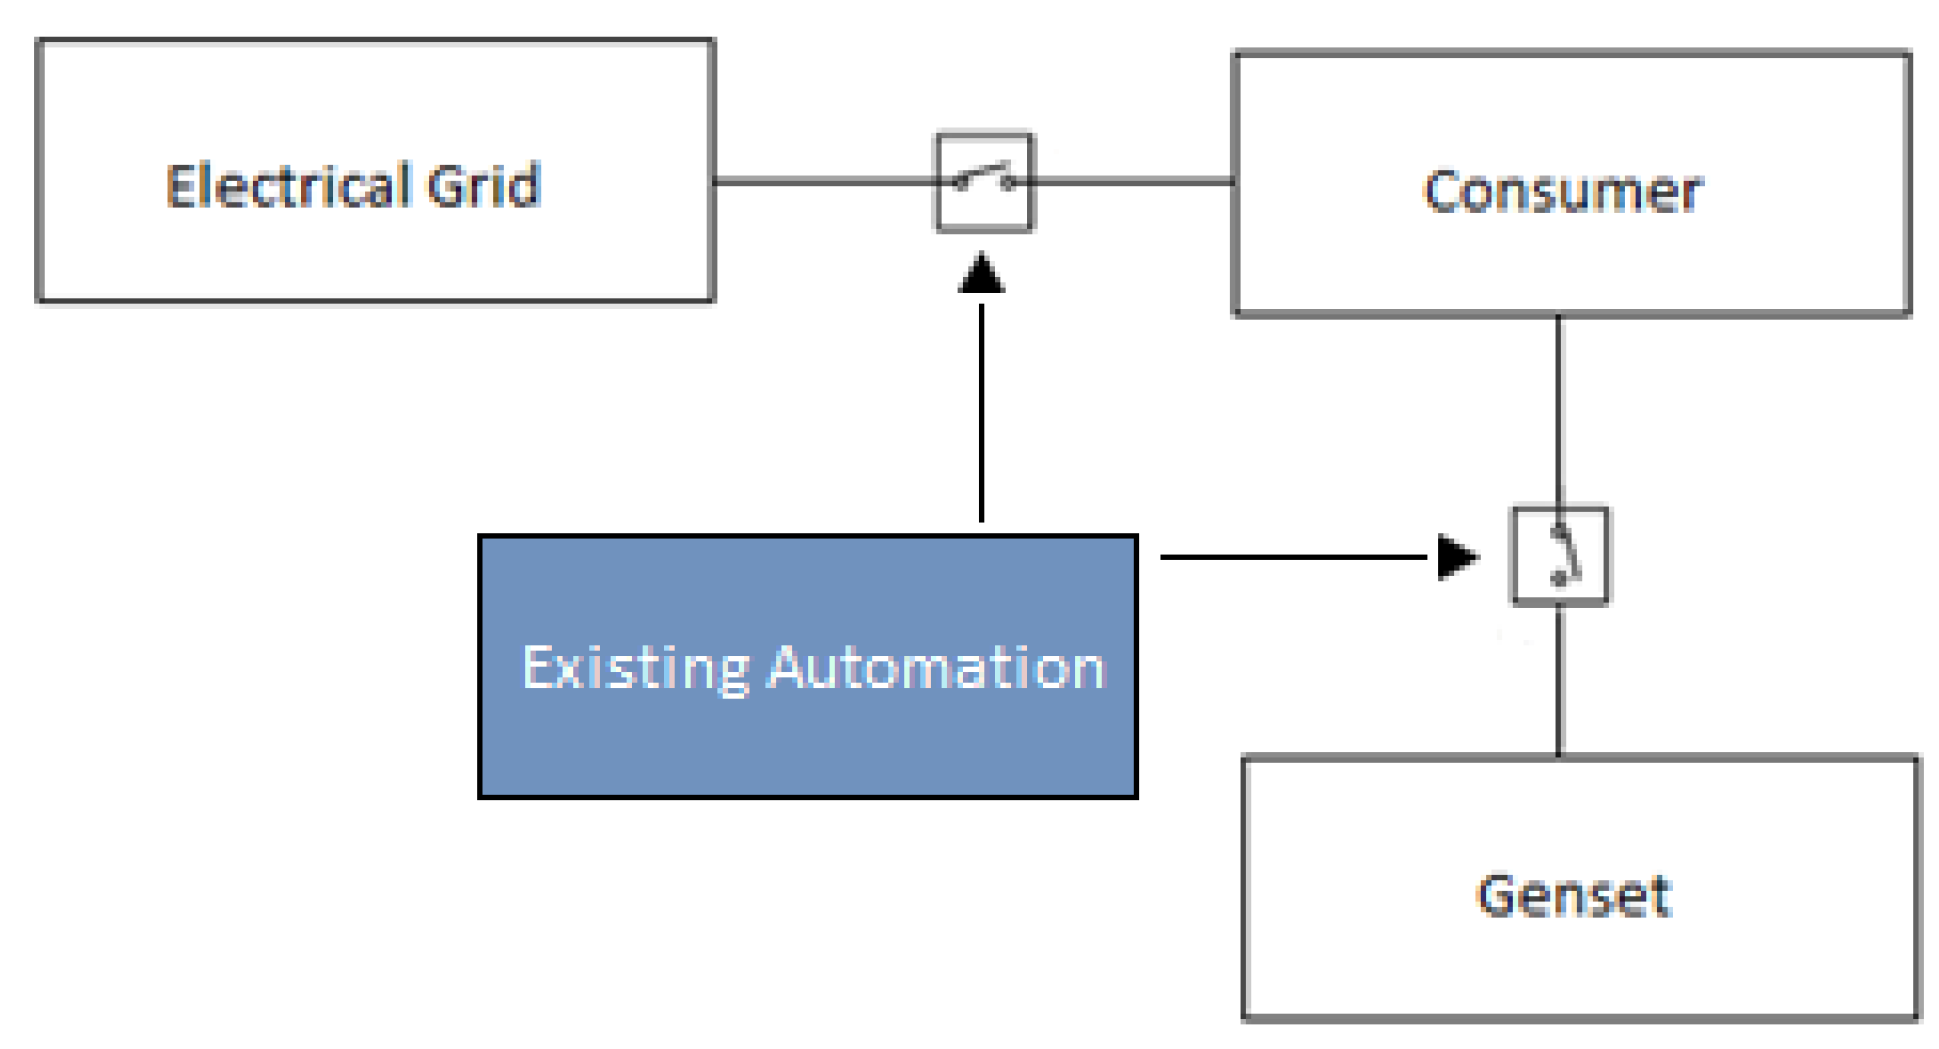
It is worth mentioning that the existing Gensets are activated to supply selected loads, only in case of electrical network interruption (
Figure 5). Subsequently, the appropriate electrical switchboard(s) are utilized, so that there is no possibility of parallel load-serving from the network and Gensets.
3.1. Proposed Topologies
The proposed topologies should be able to support six (6) operating states, which are listed in
Table 2. Three indicators have been used to represent the operating condition for each element of gensets’ topology. The normal operation is indicated with “ON” while “OFF” is used to show that the generation sources are not operating under normal conditions. Finally, the “ALARM” indicator represents any malfunction, especially due to faults. In state 1, the Genset remains in a standby mode, waiting for a command to connect to the grid; this is the typical operational mode. State 2 appears when there is a fault in the Genset side, sending an update for “Unavailability” to the central dispatch center. In state 3, the Genset supplies the network, just like the net metering of PVs while in state 4, the load is served by the Genset due to the unavailability of the electrical network which is also a typical situation for an owner of a DSGA. In state 5, the load remains unserved due to the unavailability of both the electrical network and the Genset. Finally, in state 6 the whole infrastructure can operate only as a prosumer in case of a fault in the load side of the infrastructure and such an operation resembles an Independent Power Producer (IPP).
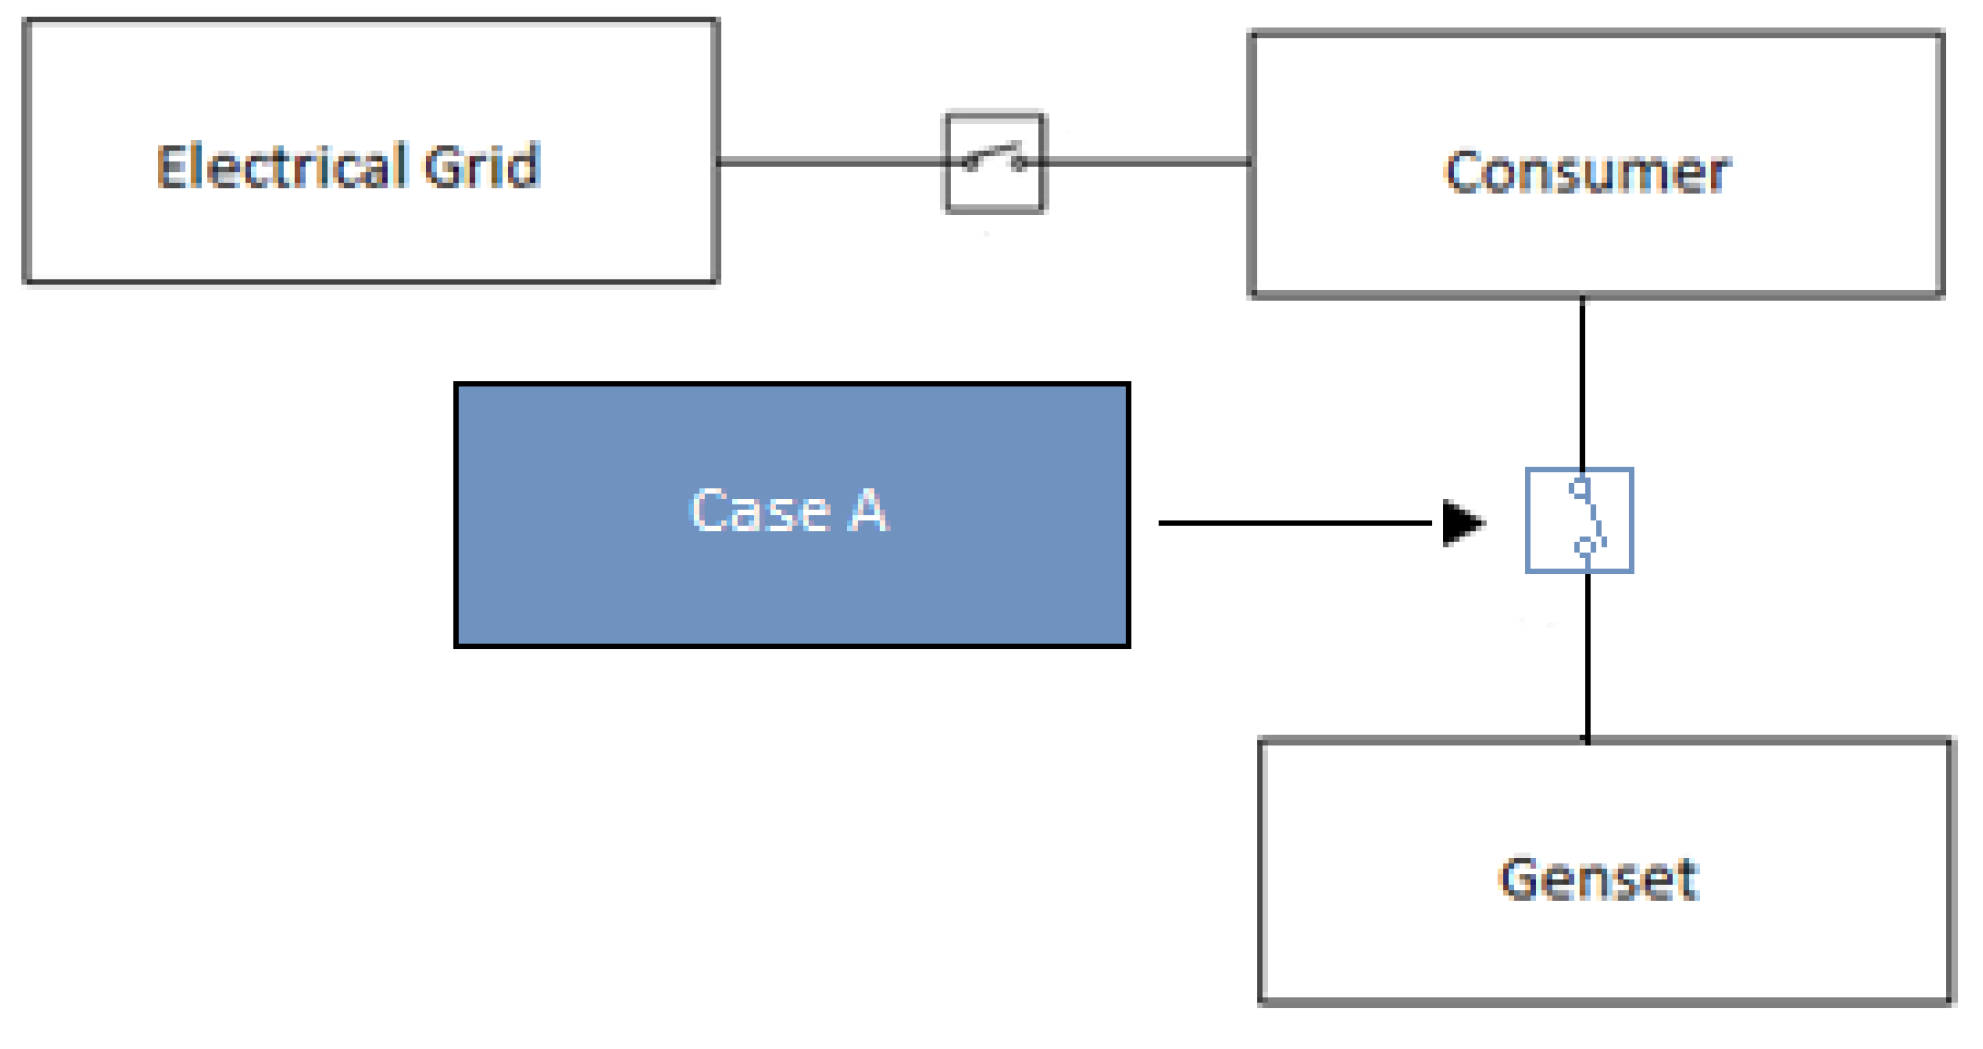
Therefore, there are two cases of study (A and B), in terms of the changes into the existing system configuration:
Case A: Modification of the existing equipment, so that the simultaneous (parallel) operation of Gensets (connected to the grid) and network (supply the load) is possible, including the appropriate monitoring control, remote control and telemetry system (
Figure 6).
- ⚬
If there is a system with classic automation (voltage and overcurrent protection relay), this should be replaced with a digital system, allowing for the parallel operation of Genset and electrical network.
- ⚬
If there is already a digital control system (such PLC type), it should be configured to allow the parallel operation of Genset with the network or should be replaced with a new suitable system or little programming.
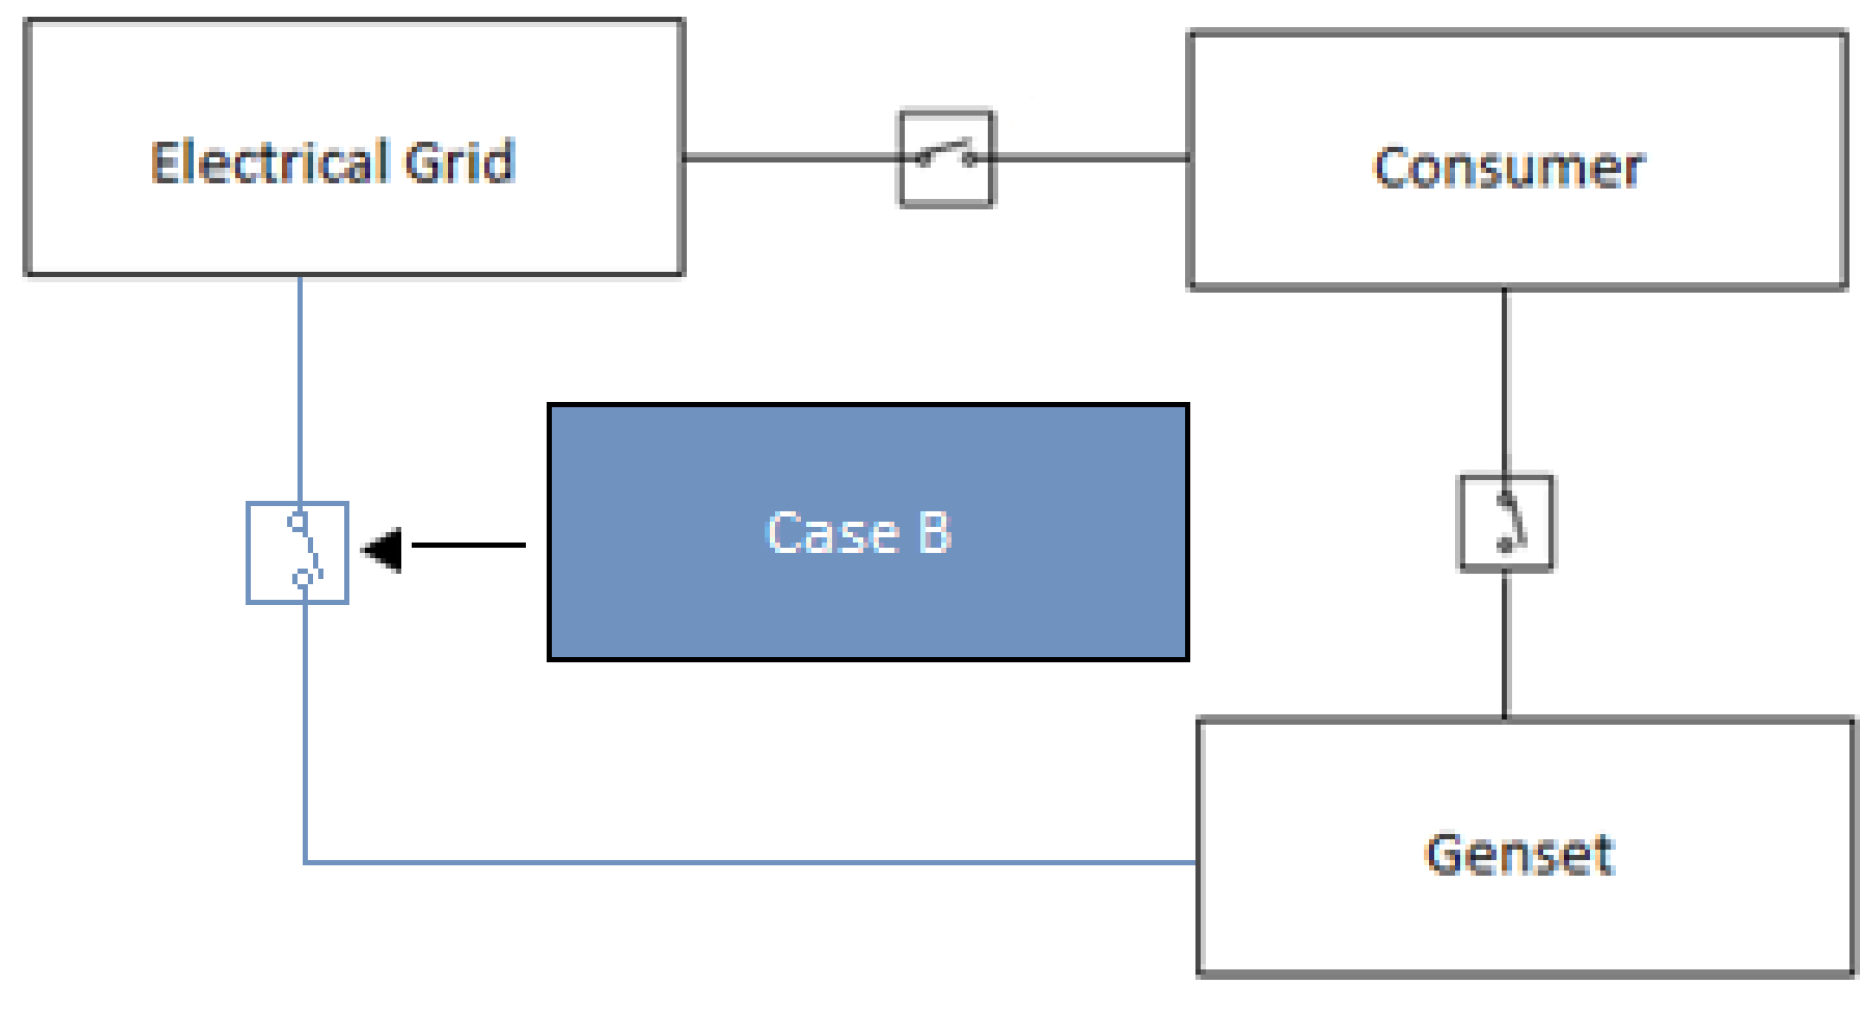
Case B: Installation of an additional switchboard panel that will electrically connect the Genset to the network, in parallel connection with the existing network that serves the load. In this case, the existing infrastructure remains intact in its current state, as a parallel, independent control system will be installed (
Figure 7).
The structural elements of the installation for the different configurations (switching material, voltage transformers, etc.) will be selected through their following classification that depends on the size/capacity of the Genset:
Small LV Gensets: ≤ 55 kVA (≤80 A)
Large LV Gensets: 55–250 kVA (80–360 A)
MV Gensets: 250–1000 kVA (360–1500 A)
3.2. Protection Schemes for the Gensets Ttopologies
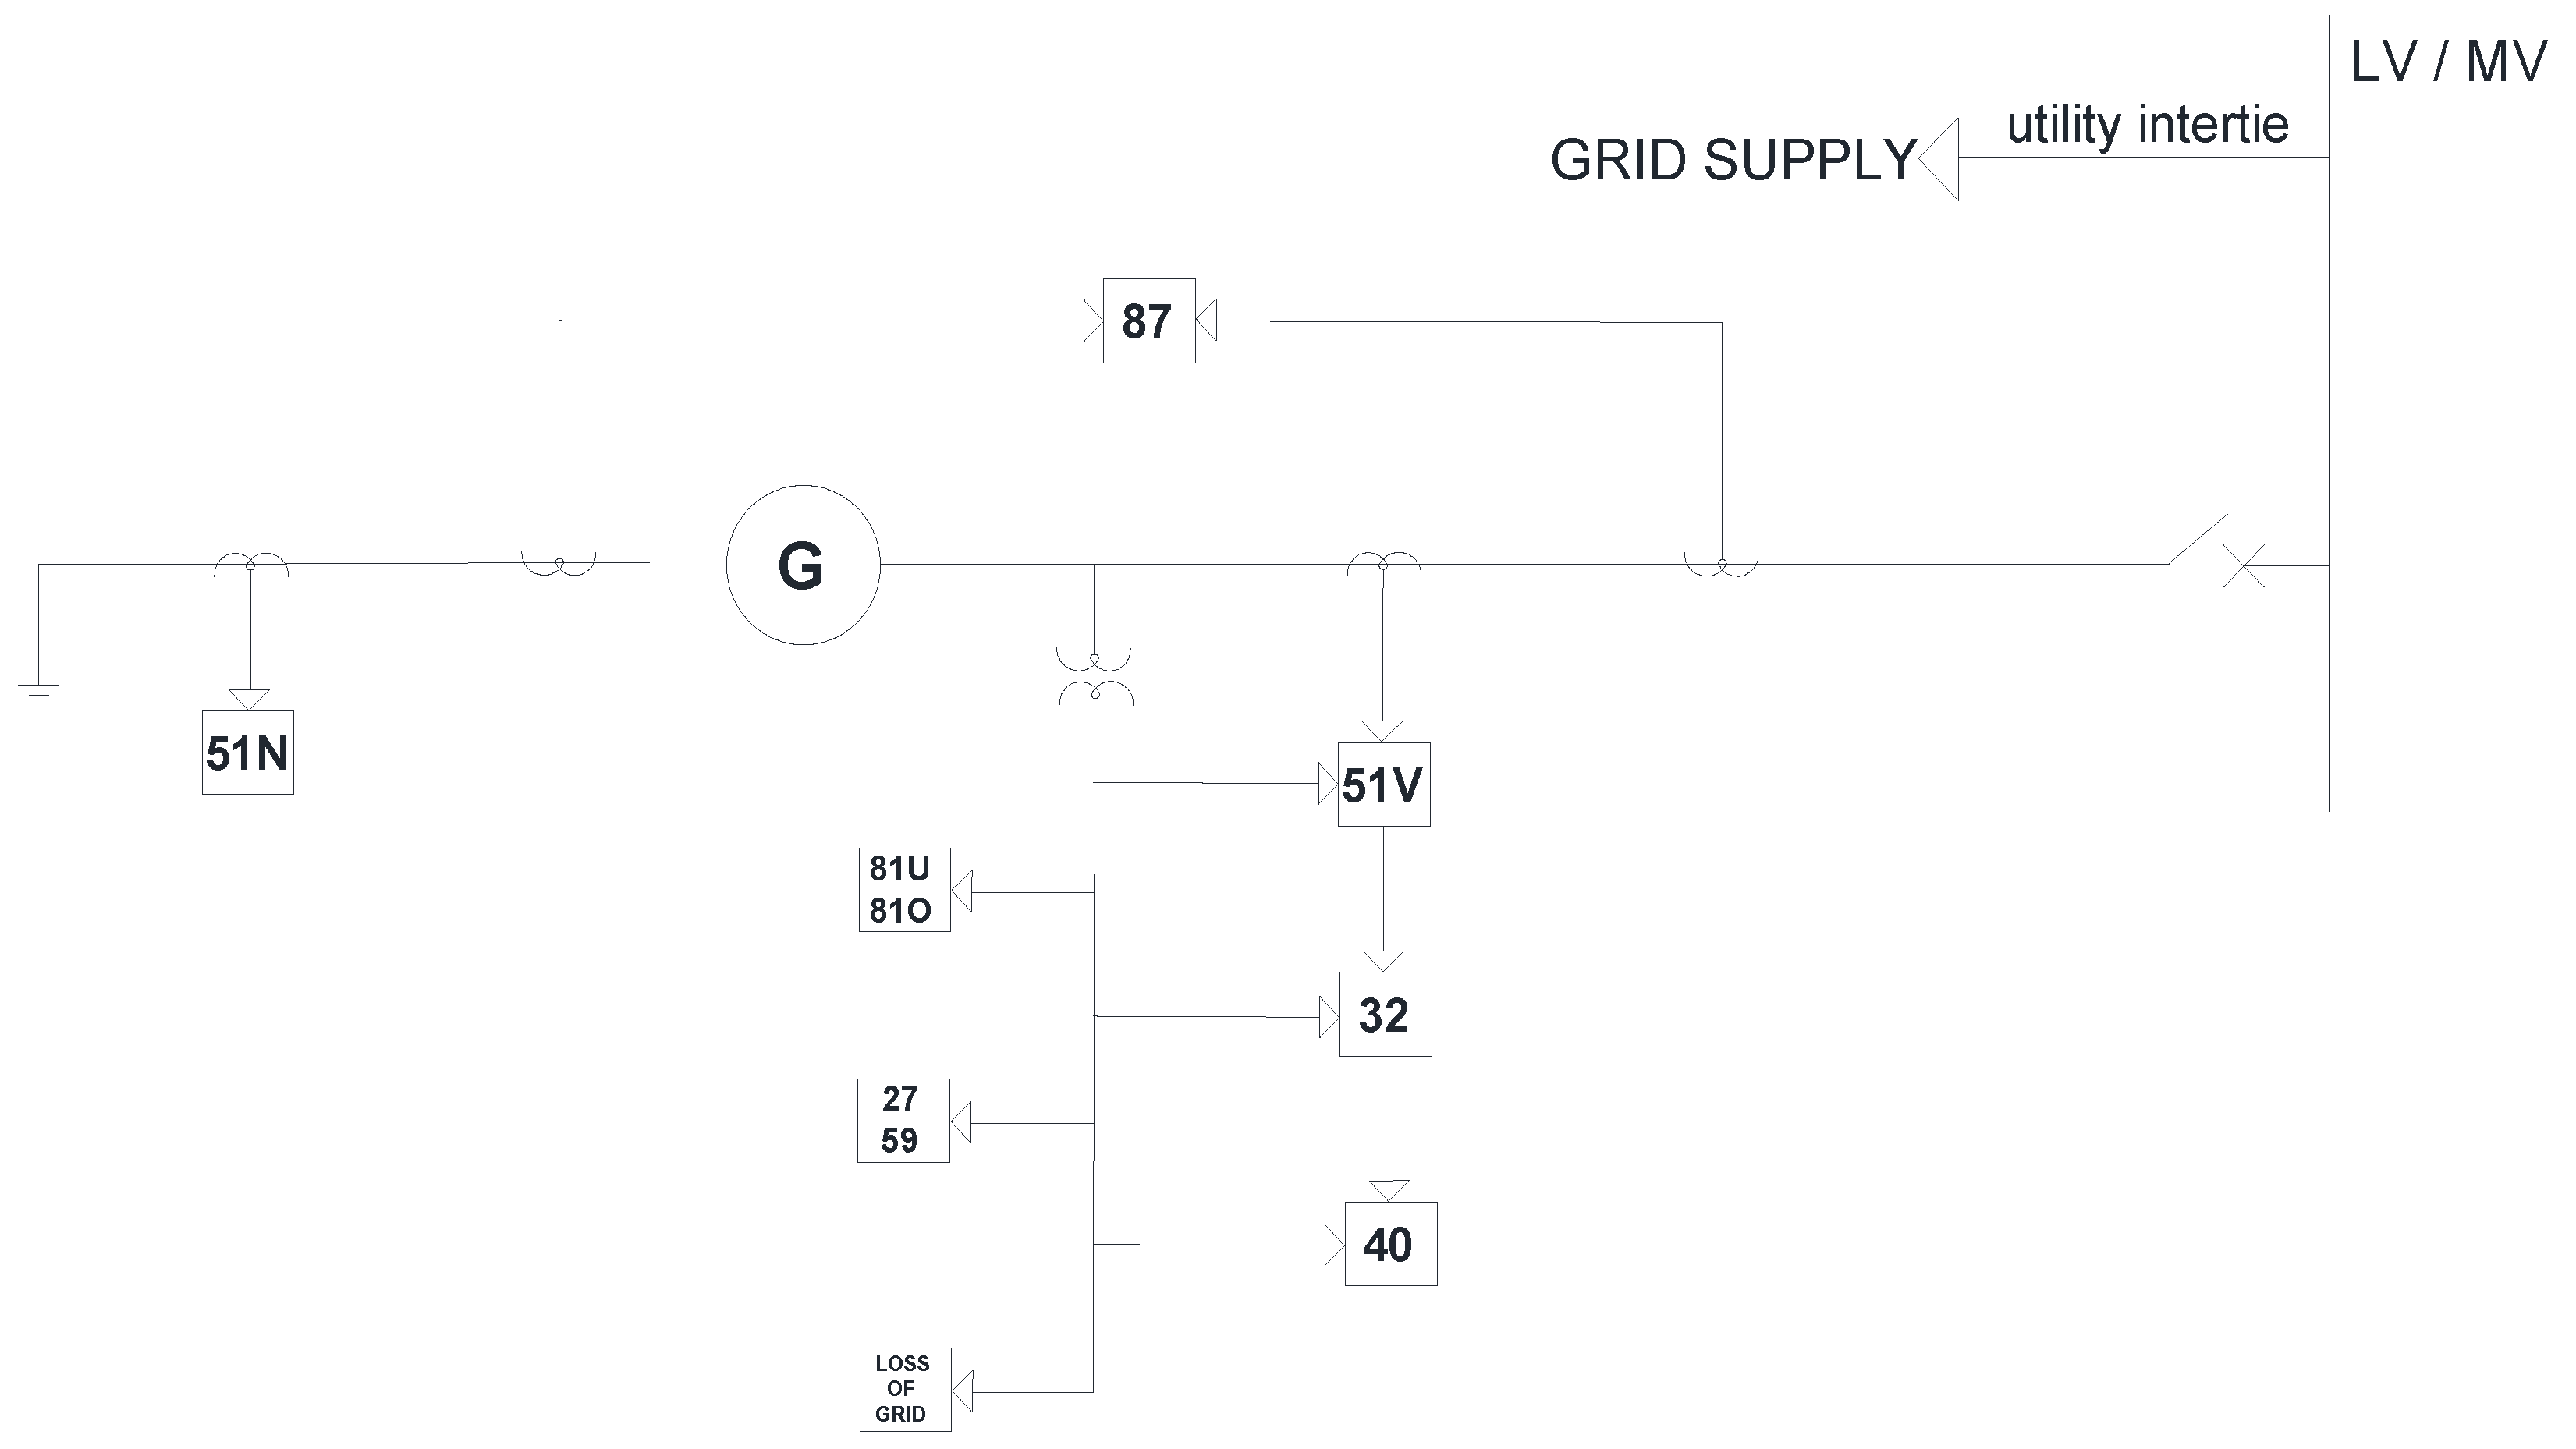
Figure 8 shows the basic protection schemes that have to be provided for implementing one of the six operating scenarios. The state of each protection scheme will be collected through appropriate signals to the controller, from where the respective commands will be given.
More specifically, each label of
Figure 8 corresponds to the following protection relays [
28]:
51V: Three-phase voltage-controlled time-delayed overcurrent
51N: Earth fault time-delayed overcurrent
32: Reverse power protection
40: Loss of excitation (LOE)
87: Differential protection
81U/81O: Under- and over-frequency
27/59: Under- and over-voltage
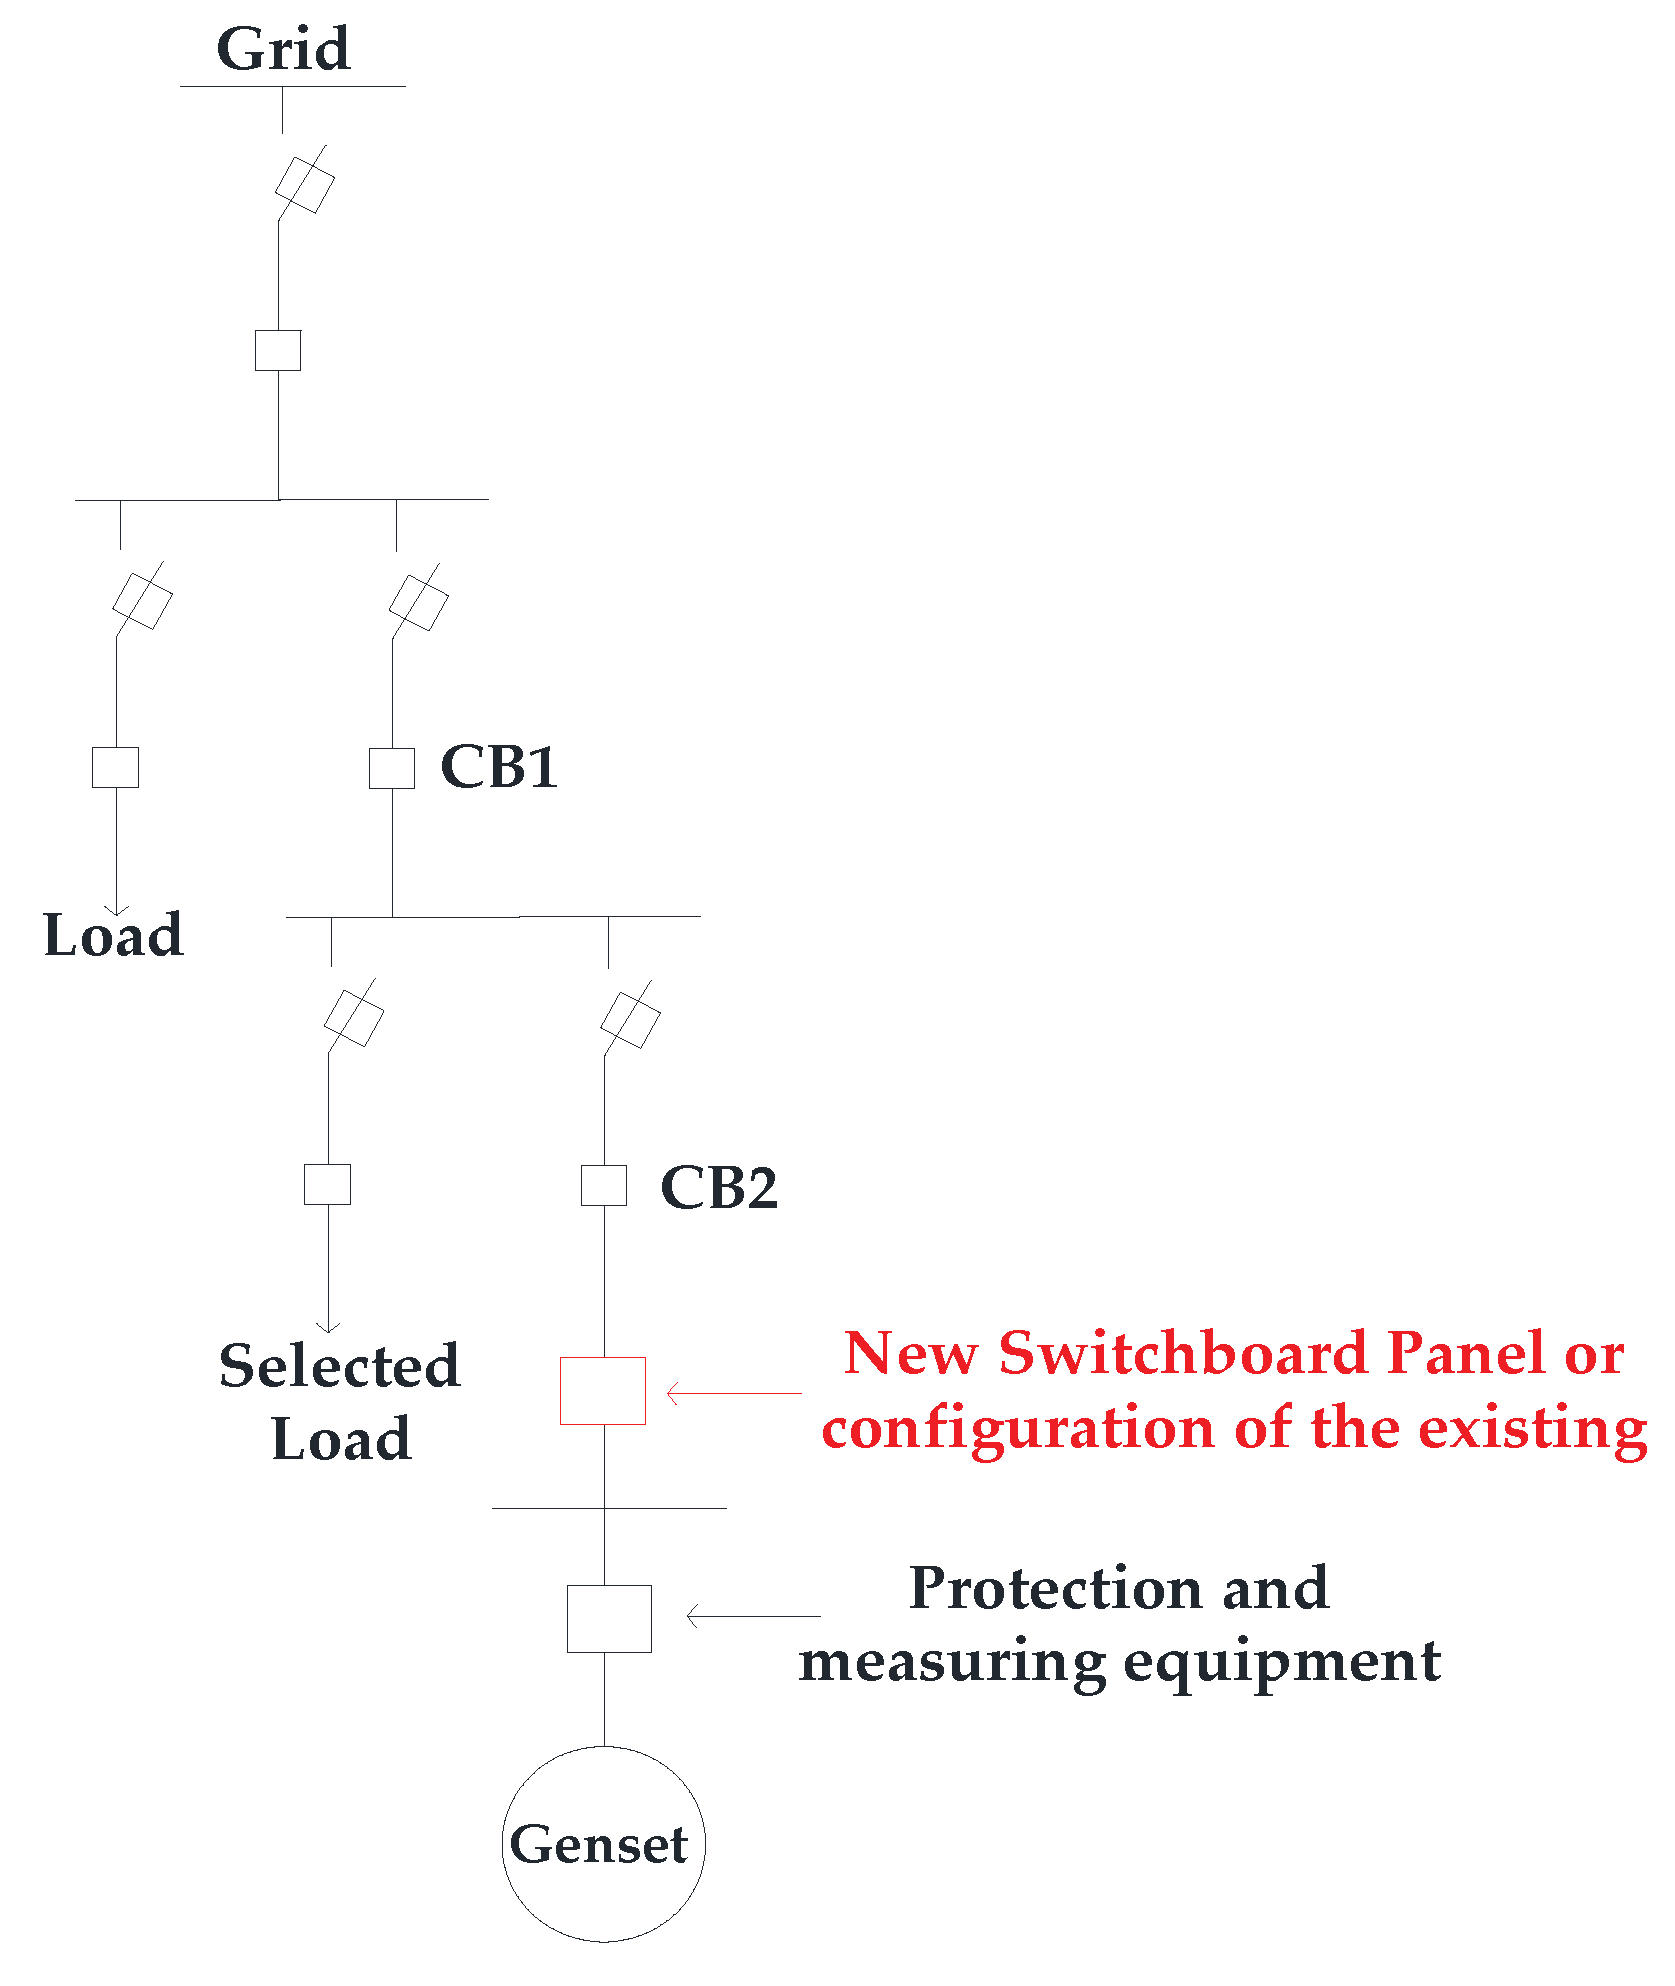
Figure 9 shows the interconnection topology between the electrical grid and Genset in case A. According to
Figure 9, the Genset supplies the network through the CB1 and CB2 circuit breakers, which are connected in series remaining closed as long as the Genset provides power injection to the grid. In case of network loss, the CB1 will open and the CB2 will continue to operate to supply the selected loads.
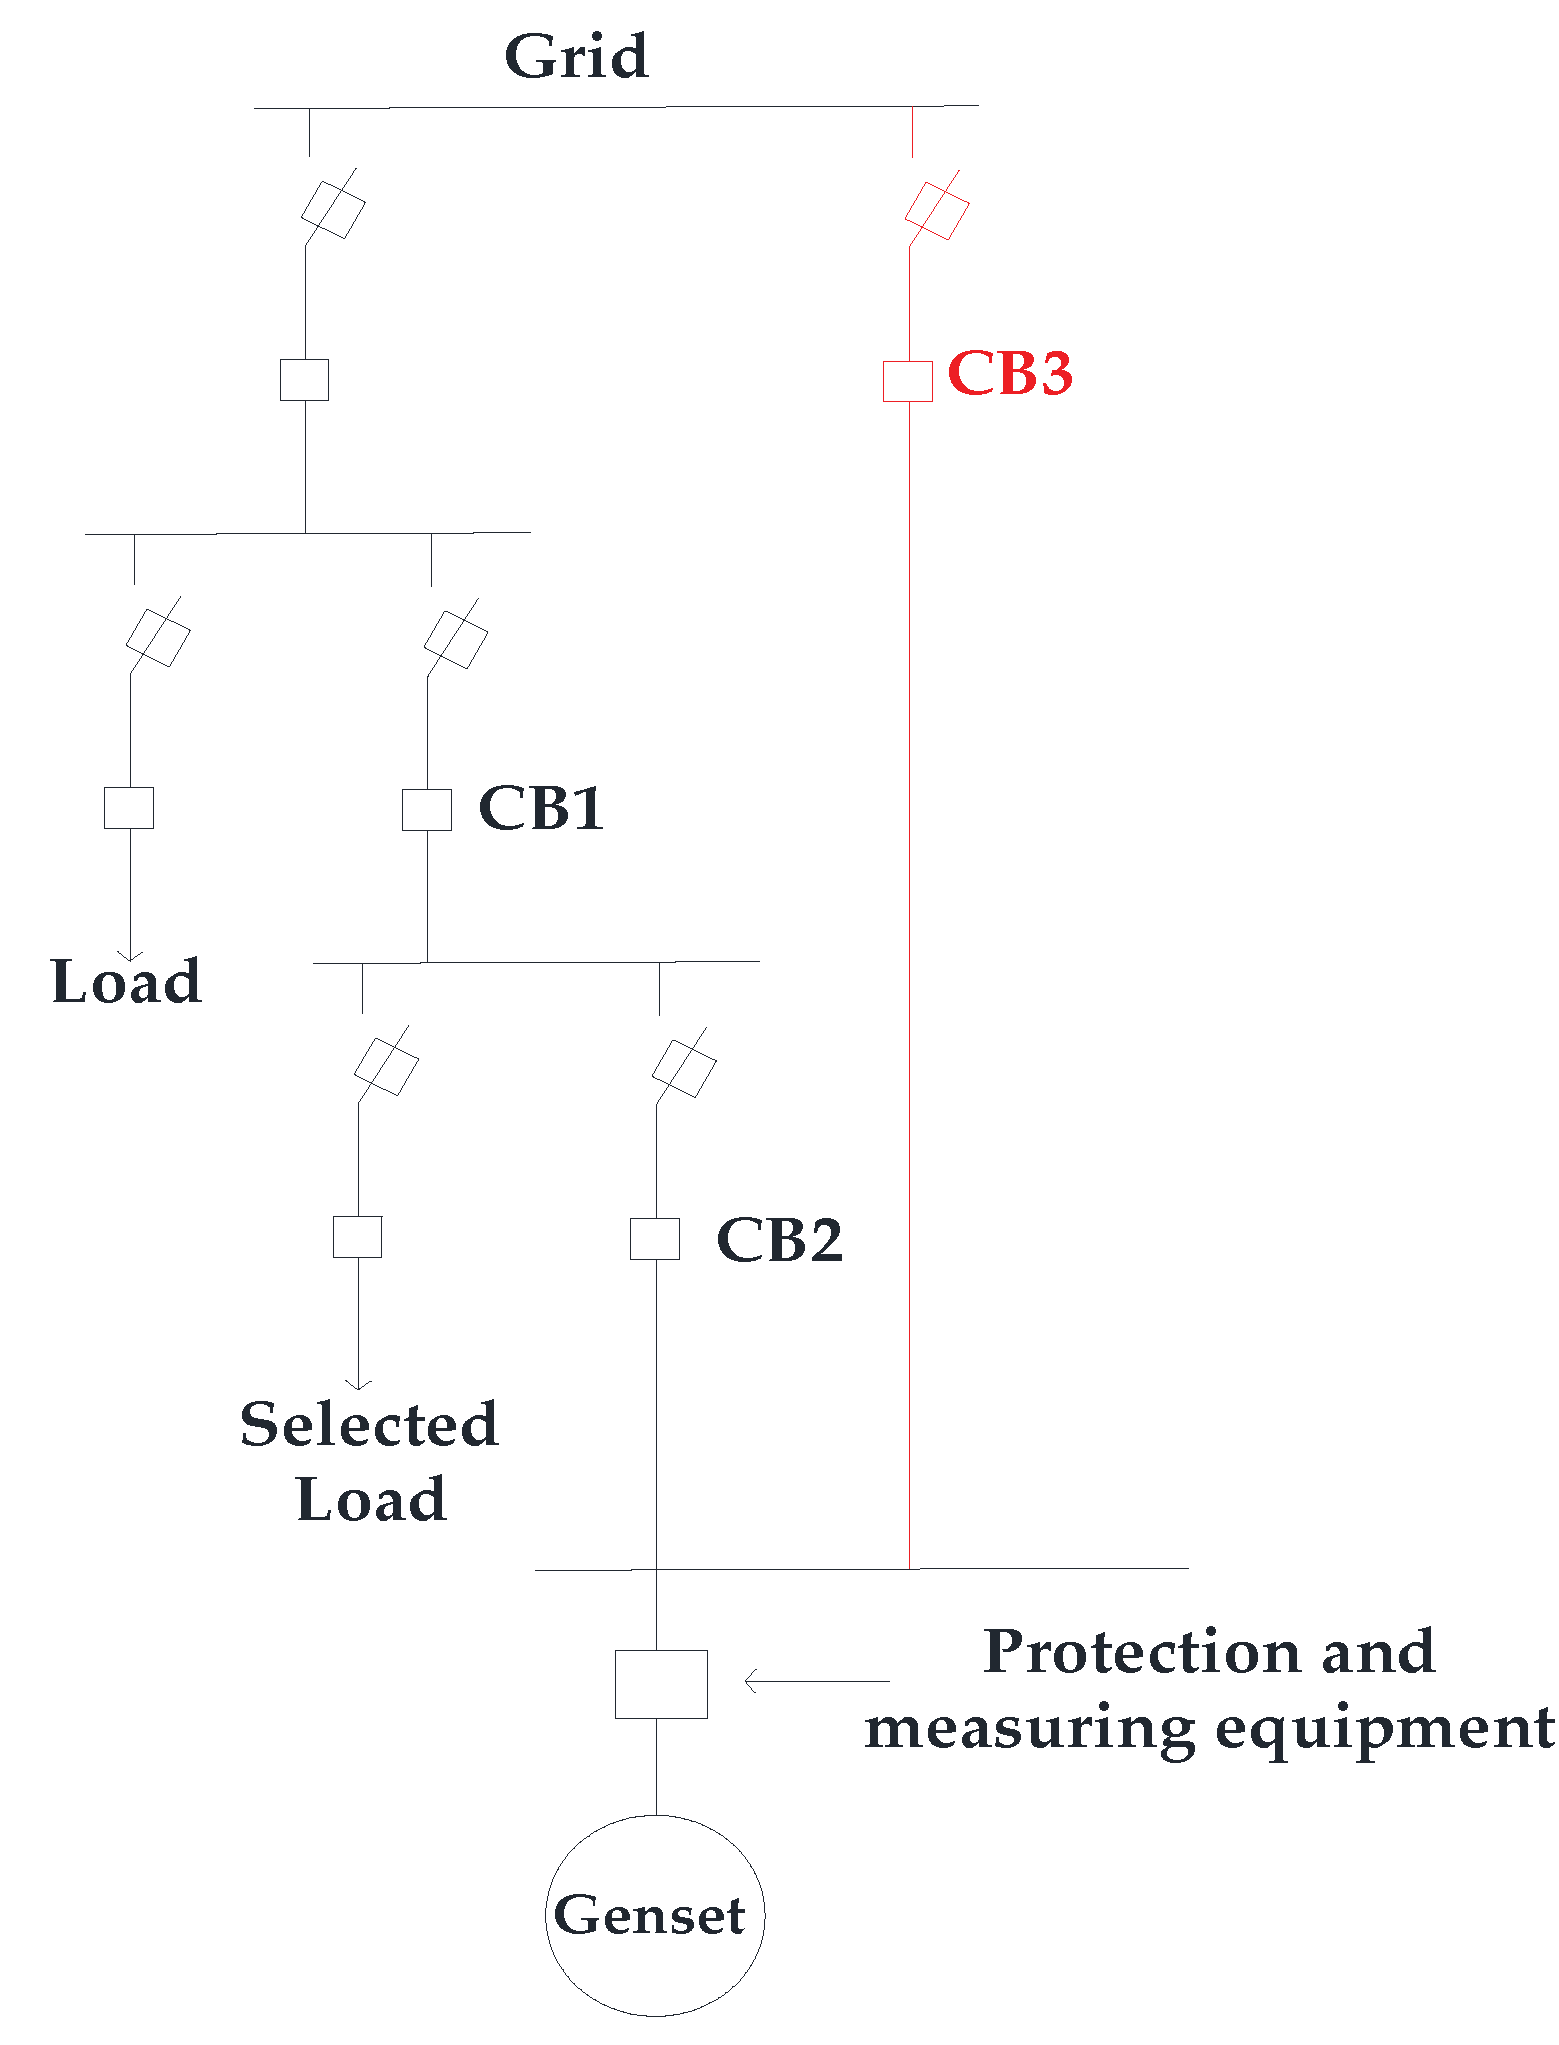
Figure 10 shows the topology in case B, where a new (independent) connection between the Genset and the network should be established. When the Genset provides power injection to the grid via CB3, CB2 will be opened. In case of network loss, the switching of Genset will take place through the opening of CB1 and CB3, respectively, while CB2 will be closed to serve the selected loads.
3.3. Cost Analysis for Required Configurations
In this part, the equipment required for the necessary configurations of Gensets is described making an indicative cost analysis for each case (A and B).
3.3.1. Case A
As mentioned, a new switchboard panel will be installed, or the existing will be modified, which will include:
A central controller with electronic automation, telecommunication and monitoring capabilities.
Metering infrastructure for voltage, current, and mostly power injection. A manually operated mechanism for isolated Genset operation in case of emergency.
External switchboard signaling to inform the user about:
- ⚬
Simultaneous/Parallel operation of Genset and Network
- ⚬
Standby operation of Genset, to be ready for its access to the electrical grid
- ⚬
Unavailability of Genset.
3.3.2. Case B
In case B, a new independent switchboard panel will be installed, which should include:
A switch for serving the switching between electrical network and Genset including overcurrent protection (Molded Case Circuit Breaker).
A controller with electronic automation including telecommunication and monitoring capabilities.
Smart meters measuring voltage, current, and power injection.
A manually operated mechanism for isolated Genset operation in case of emergency.
Specified automation switching to exclude simultaneously activation of CB2 (Genset supply the load) and CB3 (Genset supply the network).
External switchboard signaling to inform the user for:
- ⚬
Simultaneous/Parallel operation of Genset and Network
- ⚬
Standby operation of Genset, to be ready for its access to the electrical grid
- ⚬
Unavailability of Genset.
The indicative equipment costs of cases A and B are summarized in
Table 3. It is worth mentioning that in both cases, a communication protocol via the required telecommunication equipment has to be set for the Genset’s status update to the central dispatching center of the electrical grid, which is included in the total equipment cost. In case B, the equipment cost analysis is separated into three categories (size classification: Small LV, Large LV, MV) due to the different purchase prices in switches and circuit breakers needed because of the cutting current.
3.4. Maintenance Costs
According to the current situation, the owners of DSGA use specific facilities to serve part or all of their load requirements in case of network outages. Therefore, Gensets have to be maintained and tested at regular intervals to sustain their readiness. Subsequently, the maintenance costs will be borne by the owners, whether they supply power/energy to the grid providing AS or not.
3.5. Fuel Consumption Costs
The most important factor that should be taken into account to determine the remuneration of Gensets is the fuel consumption cost, both for the provision of AS and the energy produced. Thus, the assessment and the evaluation of the specific cost analysis require the investigation of the fuel consumption curve of each Genset unit. However, such an analysis would extremely increase the complexity not only for the whole study but also of any associated legislation that may arise from it. The analysis focuses on the cost parameter analysis of a specific size of Gensets through which the classification has been made (Small LV, Large LV, MV), that provides representative estimations for each Genset fuel consumption curve. It is worth mentioning that this analysis is crucial to determine the economic and technical characteristics of Gensets, which are necessary for their participation as independent power plants (conventional units) producers in power systems.
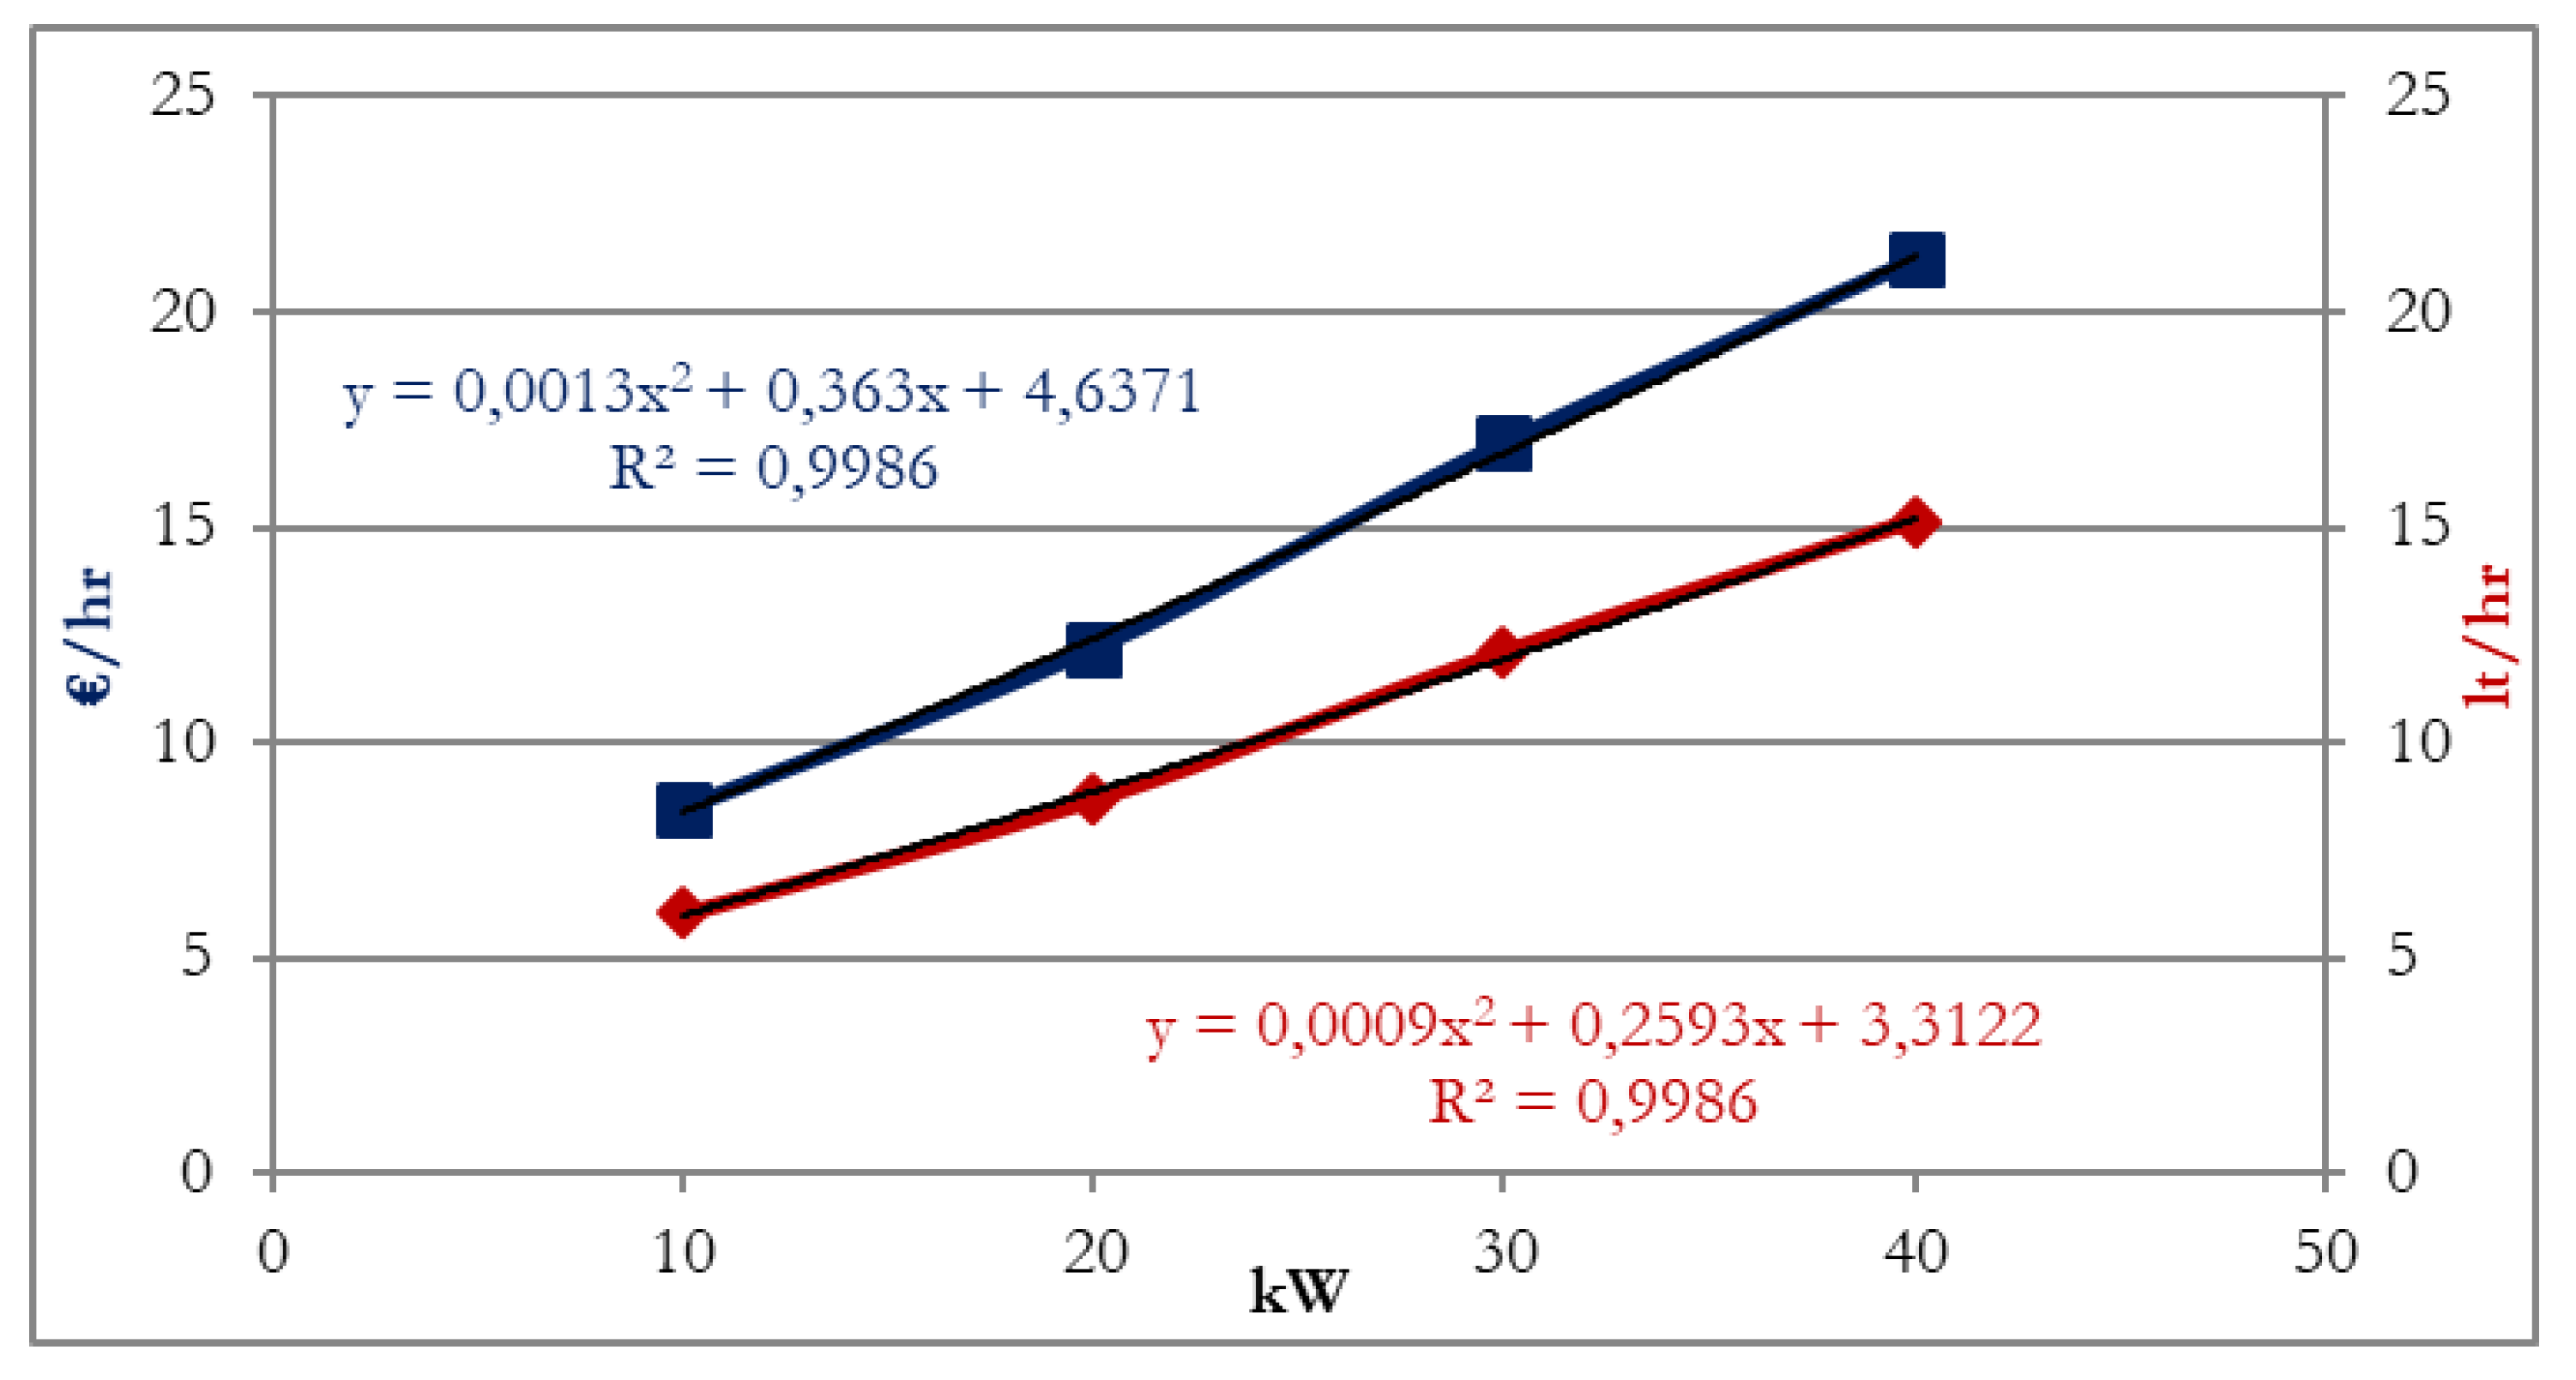
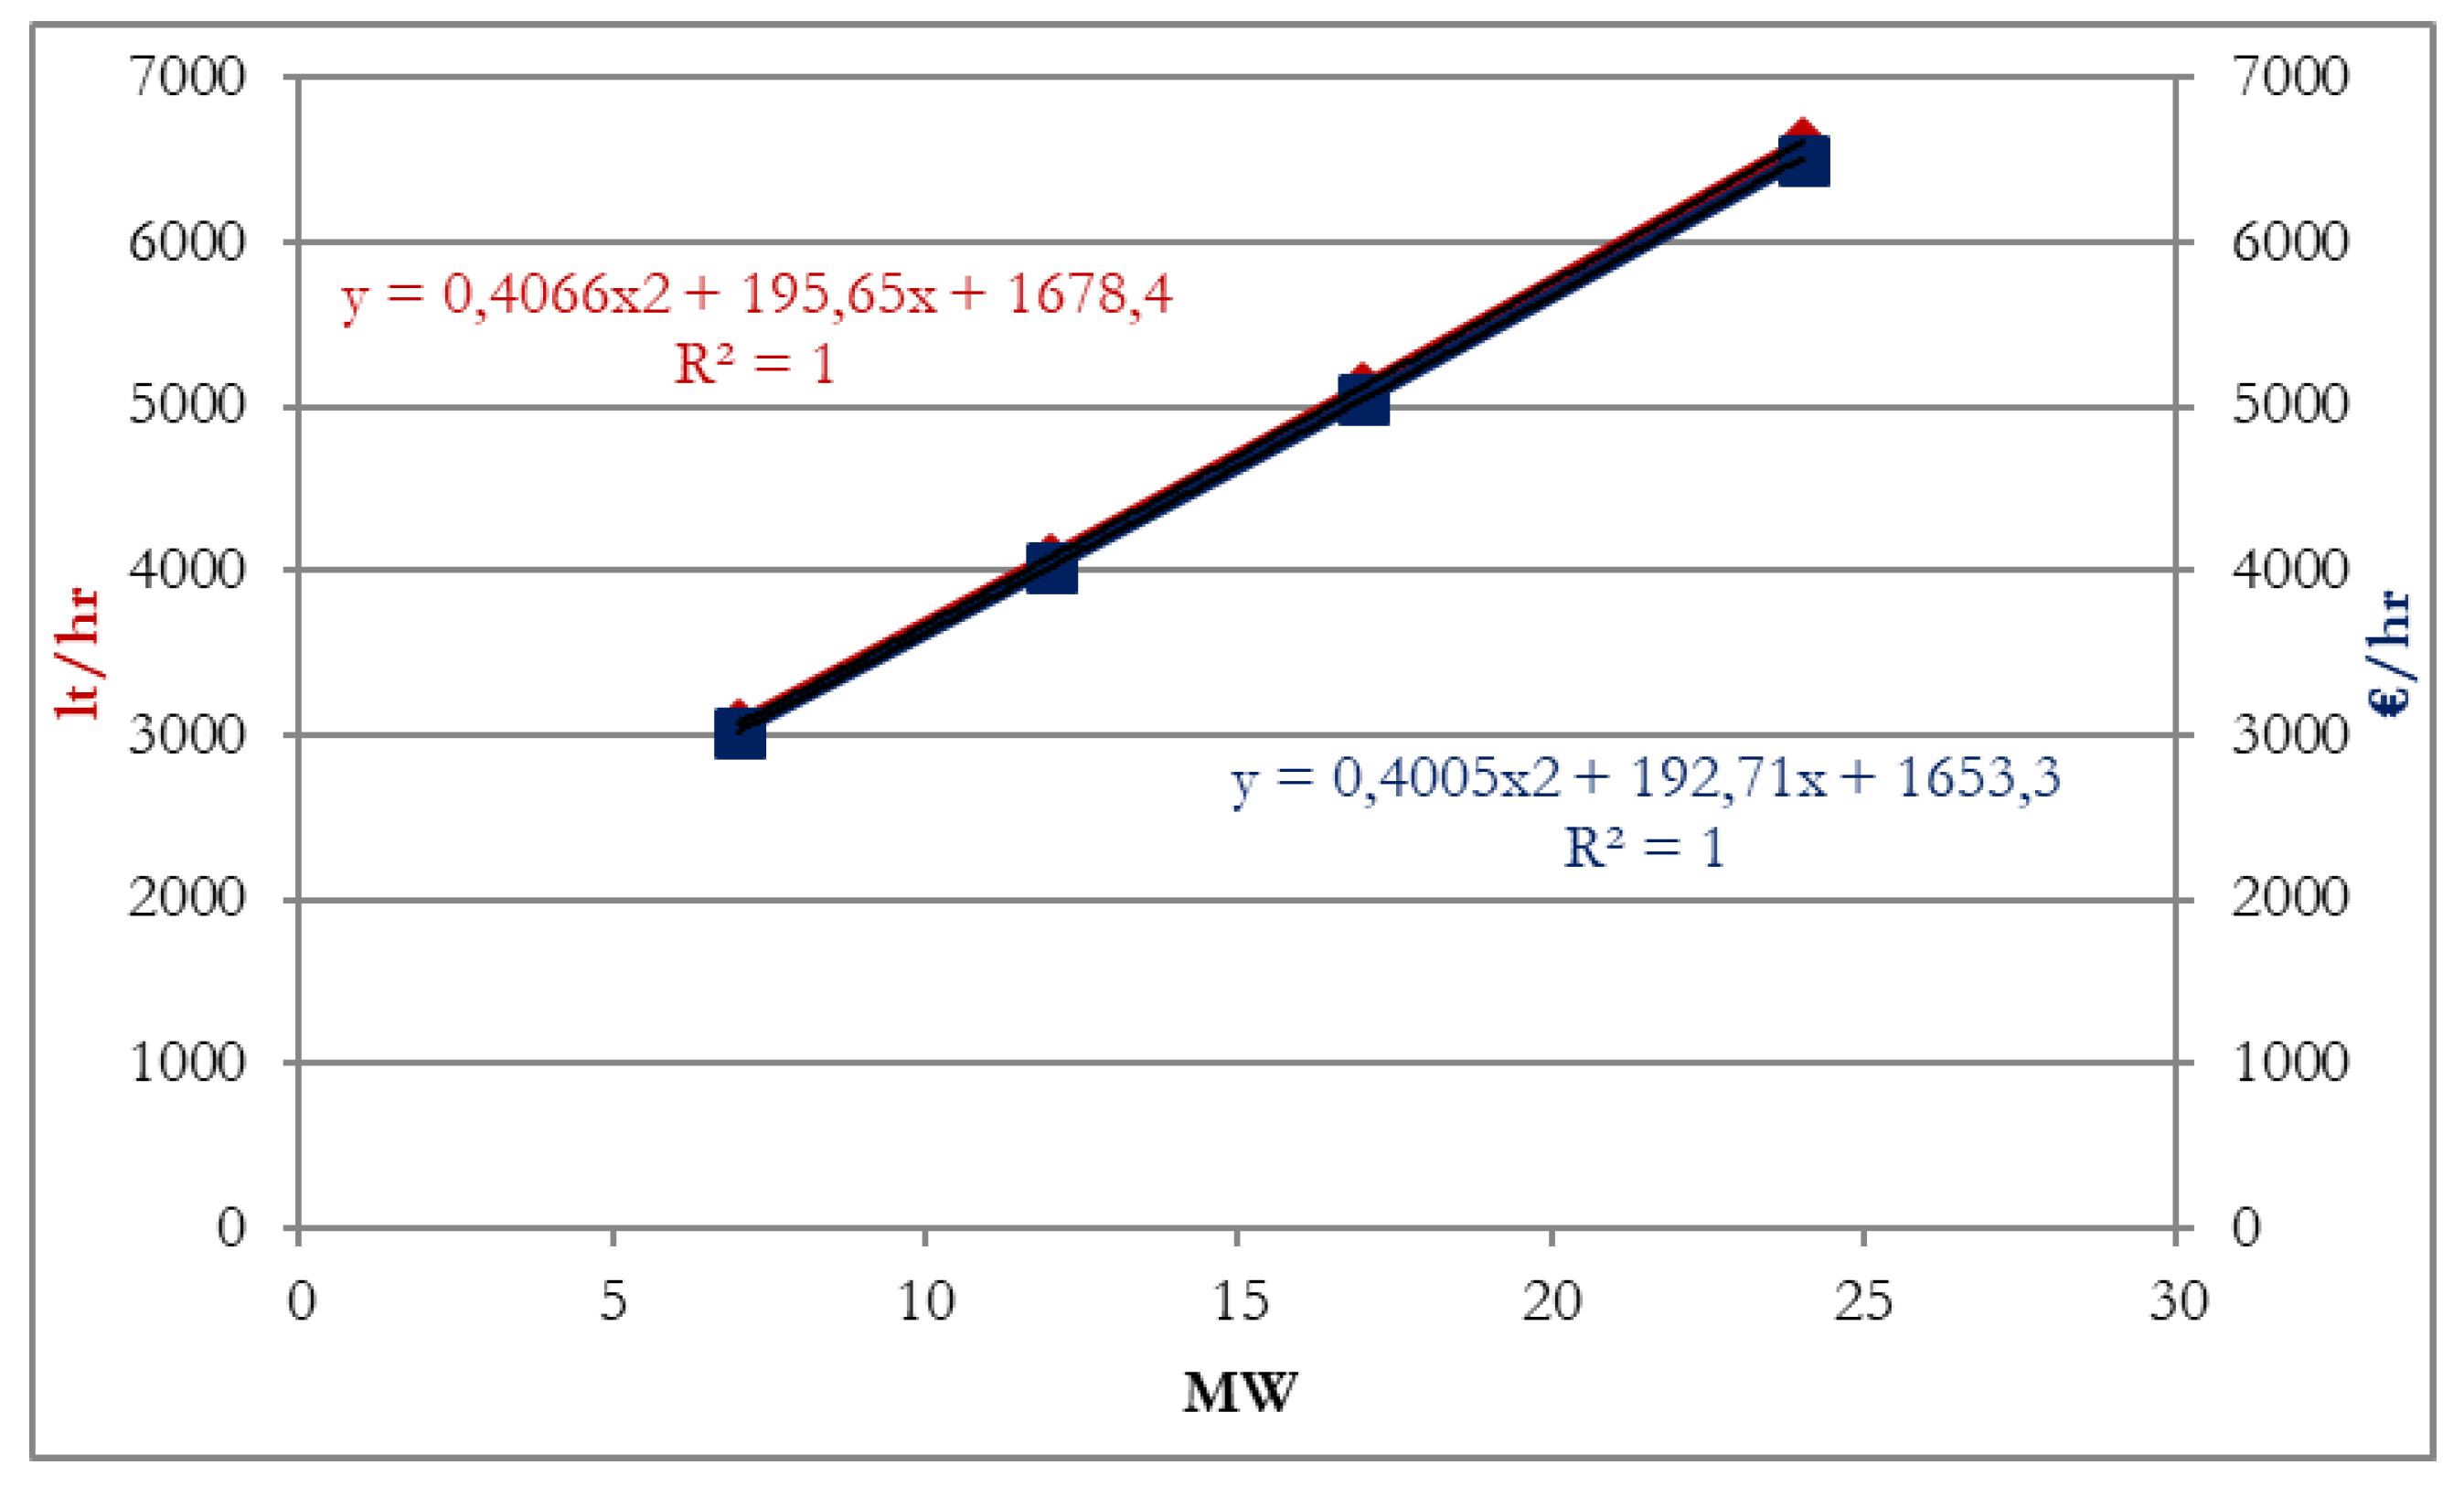
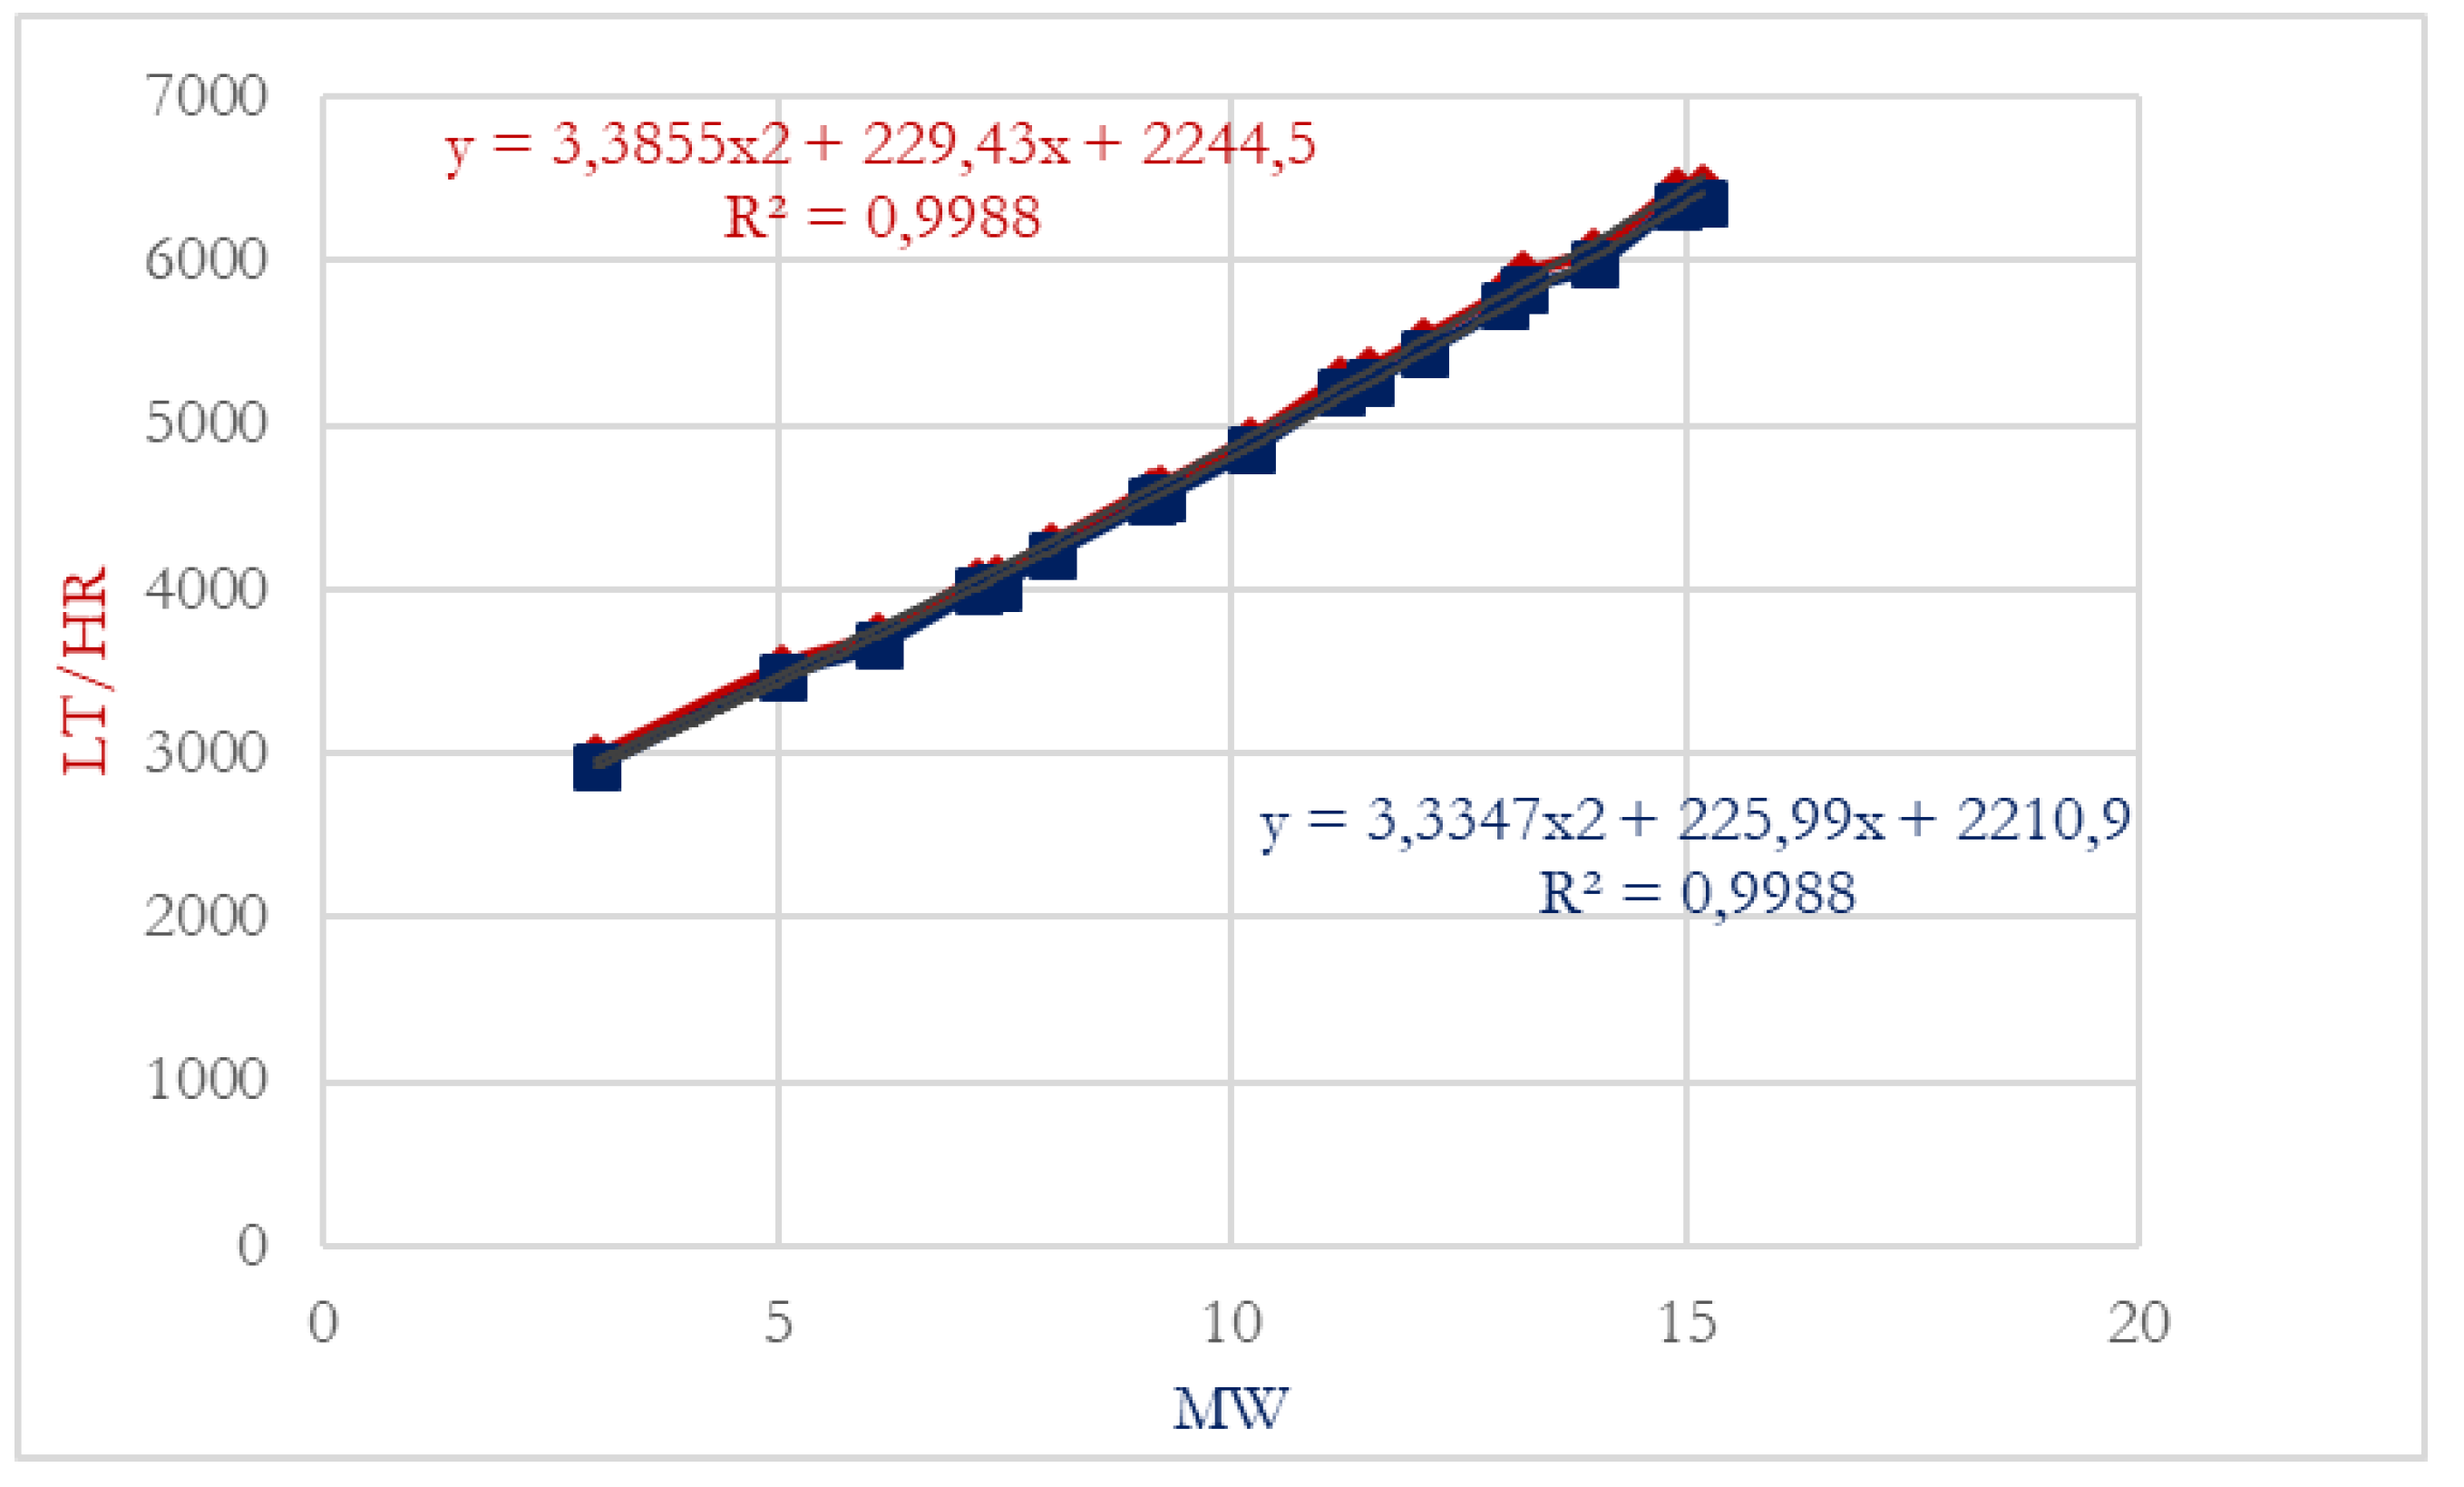
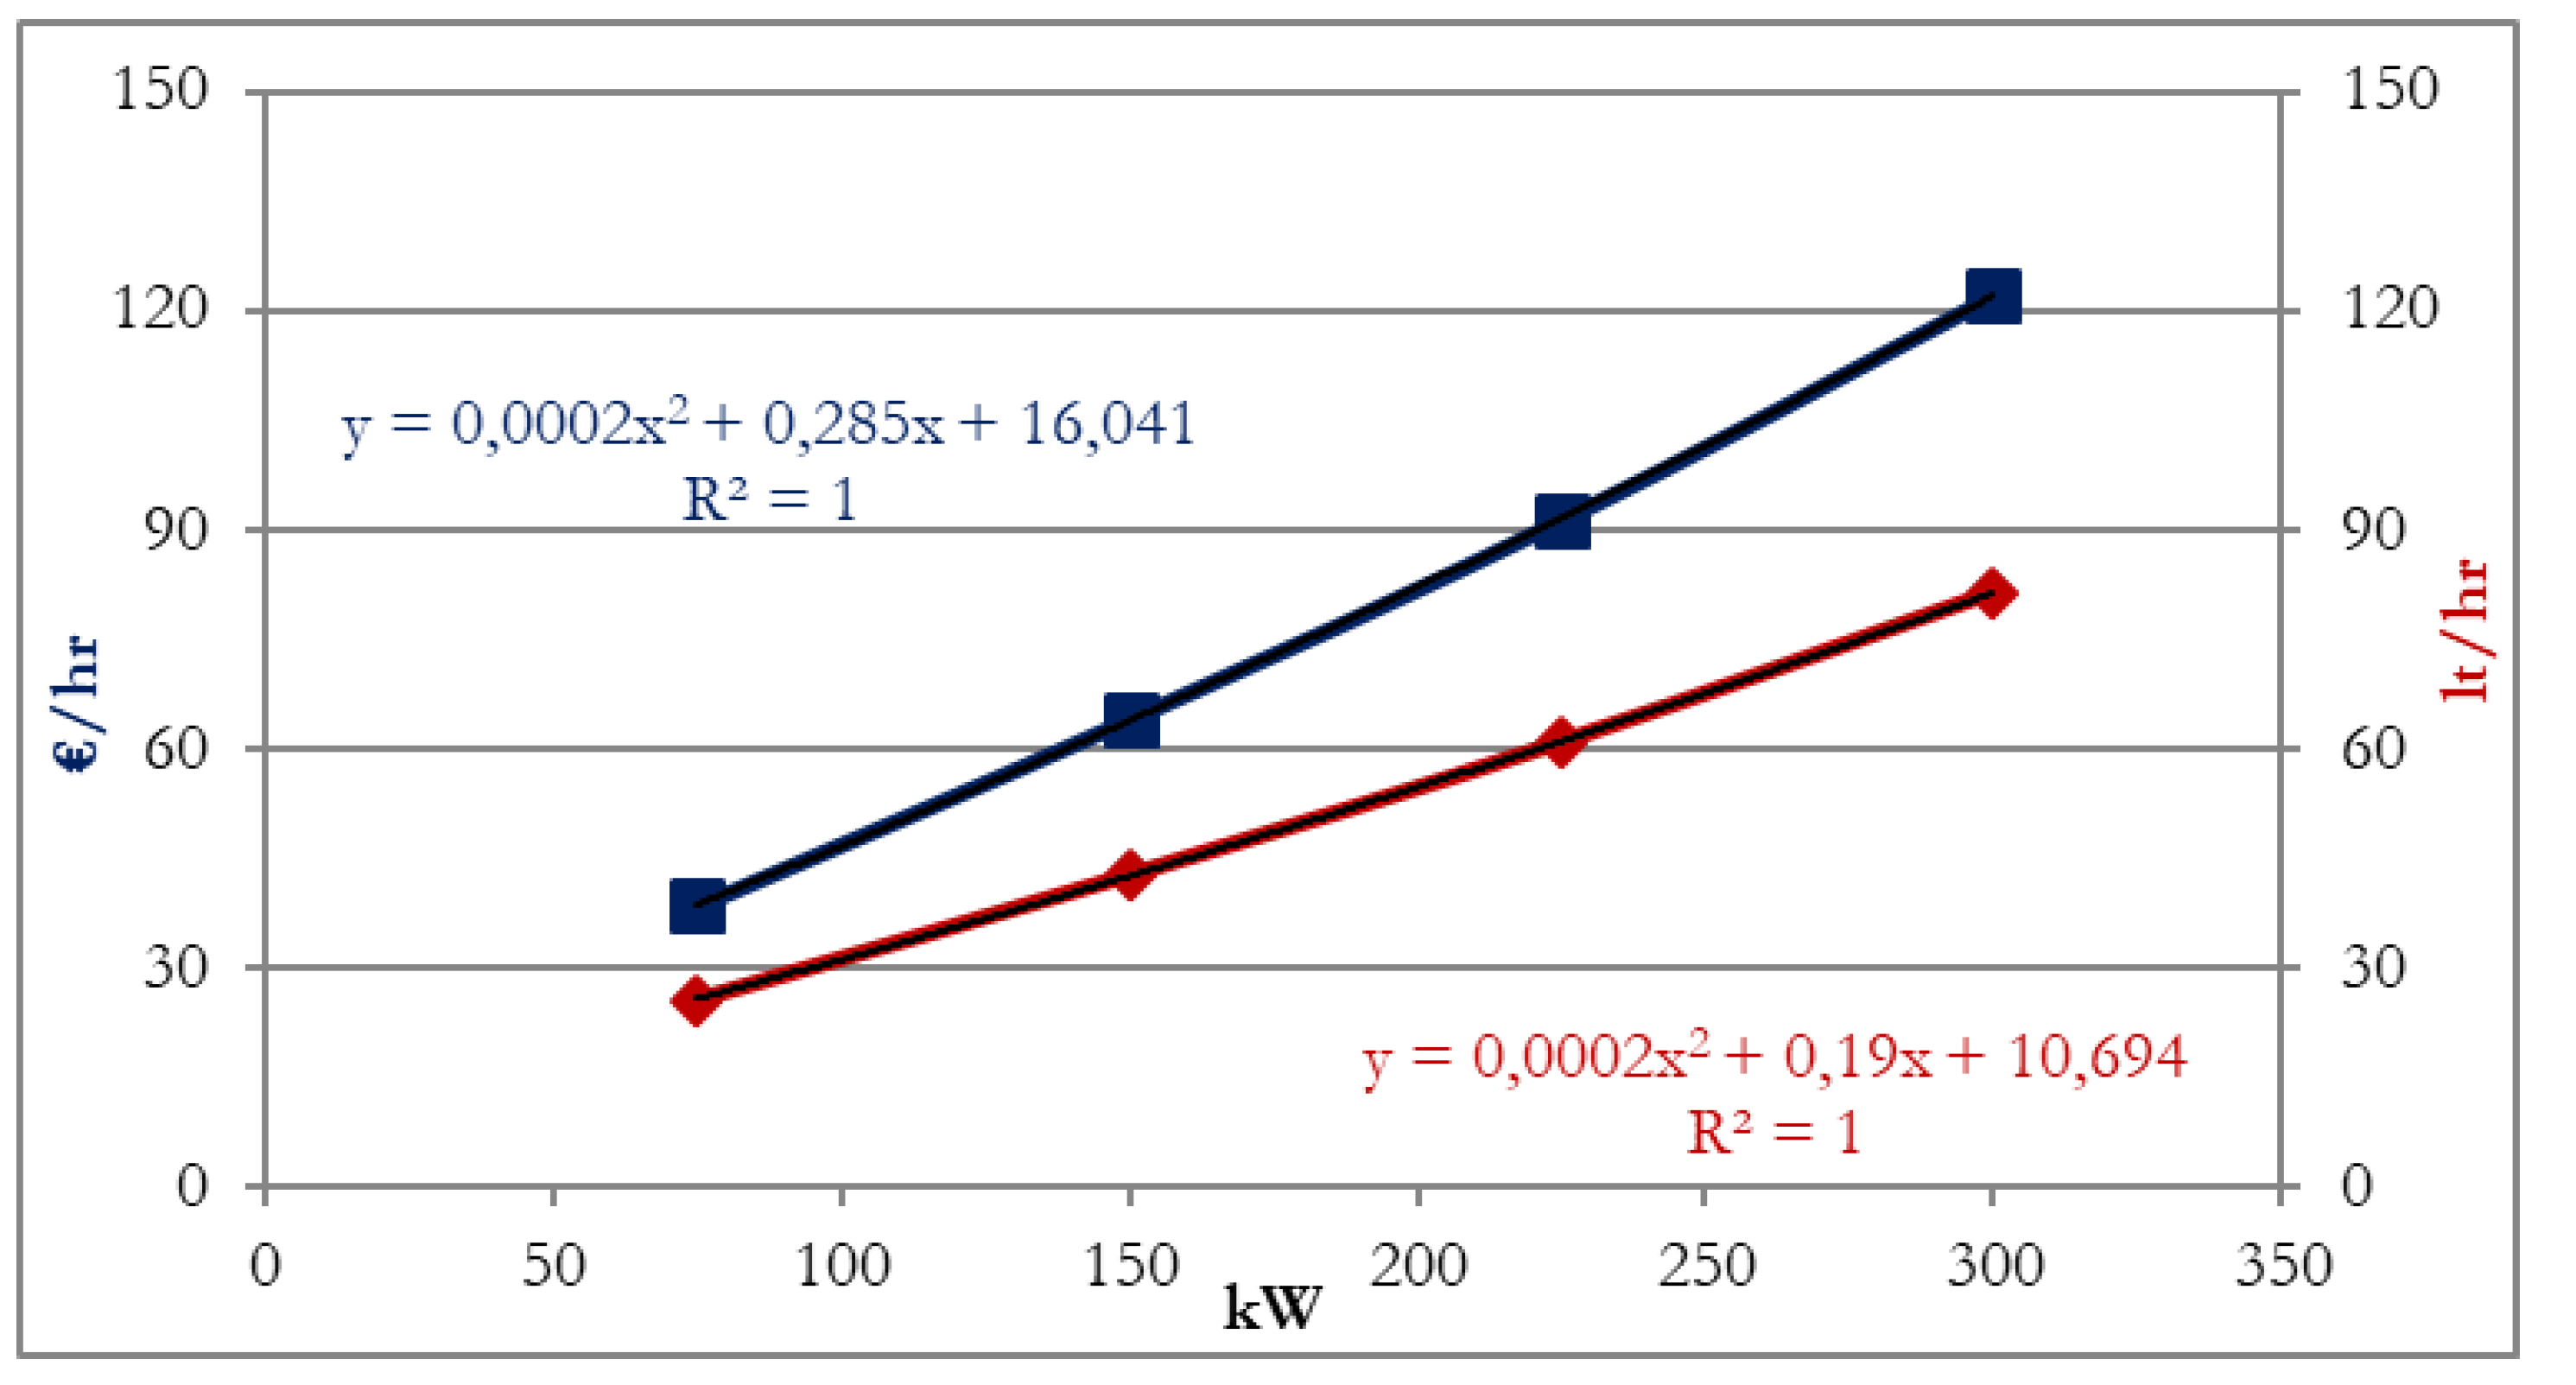
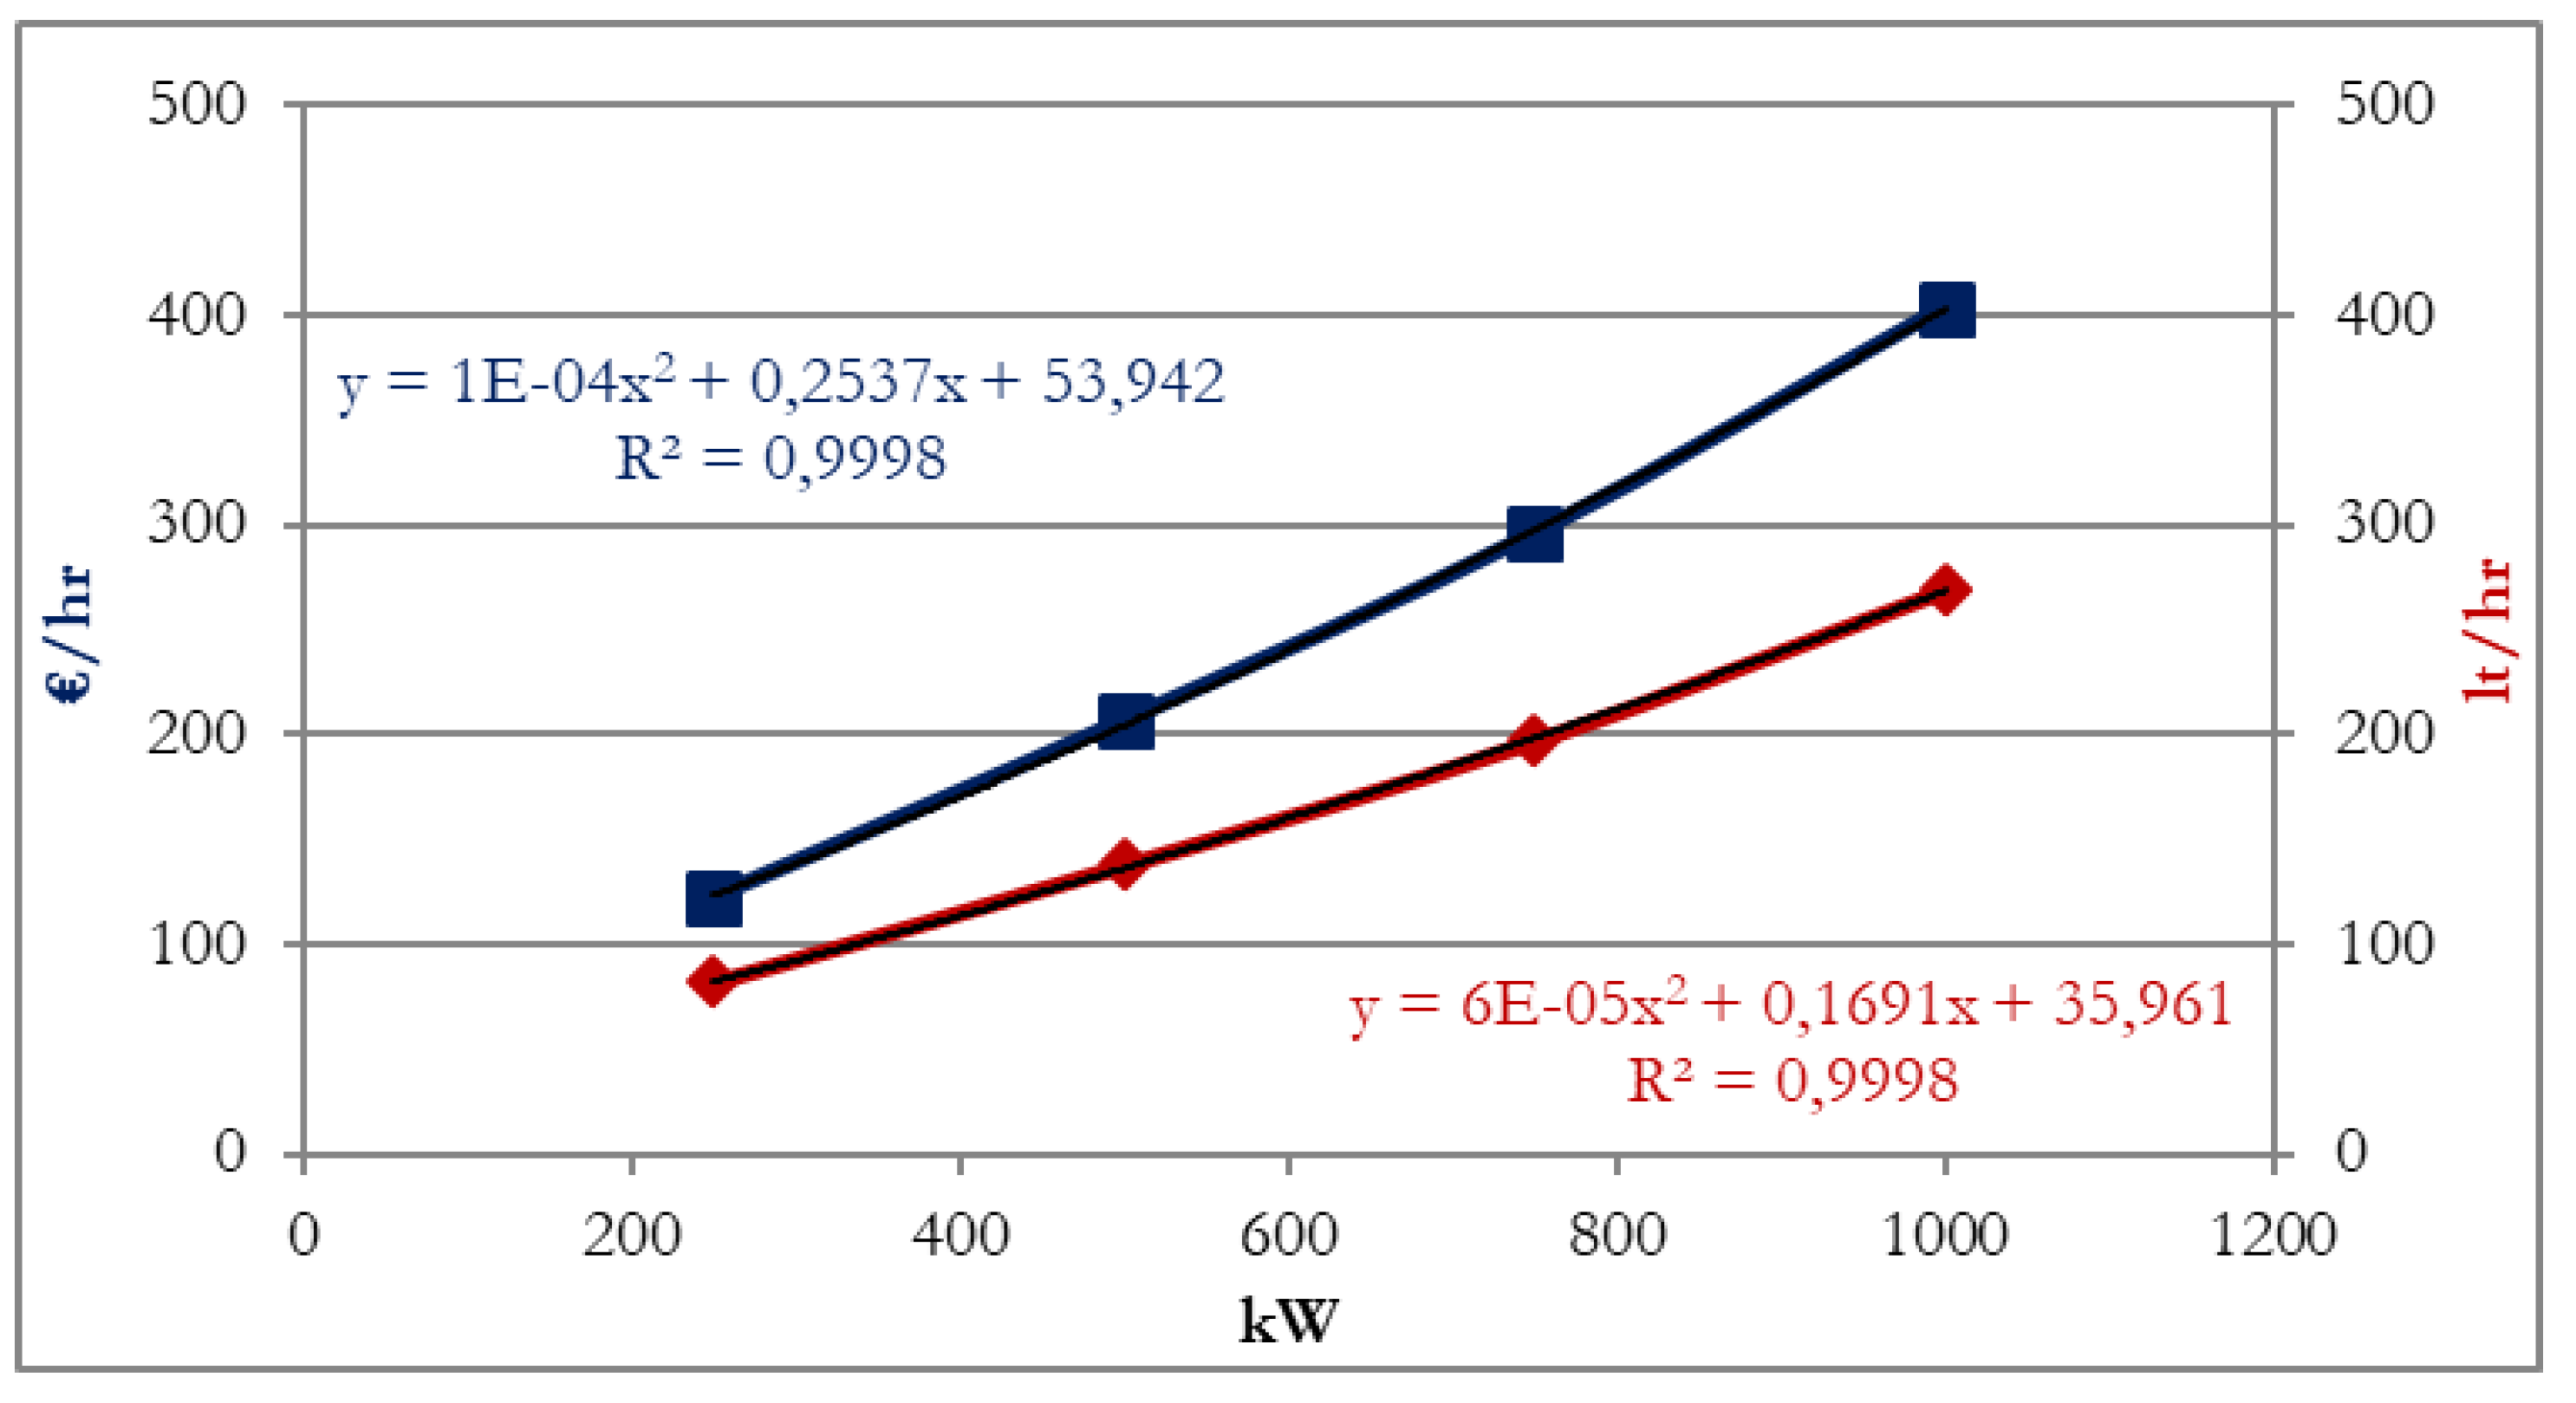
To carry out such an analysis, it was initially necessary to find the typical fuel consumption for different sizes of diesel generators. Many Genset vendors provide three to four operating points for the fuel consumption of their models. The following three figures (
Figure 11,
Figure 12 and
Figure 13) show the fuel consumption curves for three (3) representative Genset sizes of 40 kW, 300 kW and 1000 kW, ref. [
29] assuming the cost of diesel fuel at the minimum price of 1.4 €/lt [
30].
The equations resulting from the fuel consumption curves (
Figure 11,
Figure 12 and
Figure 13) are second-degree equations with a very good approach for the specific cases (R
2 > 0.998). The analysis makes a step forward calculating the specific fuel consumption and the optimal operating point of each unit from the fuel consumption perspective (optimal fuel consumption point). Consequently, the optimal operating point (kW) is calculated for seven (7) sizes of diesel Gensets, with the corresponding consumption (lt/kWh) and fuel consumption cost, as it is shown in
Table 4.
It is observed that large units (>300 kW) have lower fuel consumption costs when operating at their optimal point compared to the ones of smaller size. In the case of the 1-MW Genset, the optimal operating point is at 70% of its rated power with 0.262 lt/kWh fuel consumption. For that of 750 kW, the fuel consumption is equal to 0.256 lt/kWh at the optimal point that corresponds to 91.4% of its maximum power.
In conclusion, the maximum variable cost of the examined Gensets of
Table 4 at their optimal operating point is equal to 392 €/MWh, with the corresponding average variable cost being equal to 374 €/MWh. It should be mentioned that under the regime of preferential fuel supply, which would reduce the corresponding price of fuel to 1 €/lit, the variable costs of Gensets’ fuel consumption would have been reduced to 308 €/MWh and 295 €/MWh, respectively.
Genset Comparison with Older Open Cycle Gas Turbines of Cretan Power System
Open Cycle Gas Turbines are rather inefficient, with the older ones being even more inefficient than more modern units. However, especially in autonomous power systems, such units are used to maintain energy balance at very high peak demand values. The purpose of this comparison is to identify whether AS provided by the DSGA could be competent to the central units. These are the gas turbine units of the Cretan power system, which according to the way of their commitment and operation, can be used as an indicative type of generators to determine the corresponding (legislative) framework for Gensets. More specifically, they are fast response units, with the capability of immediate start-up, which makes them units that are used to regulate peak load.
Their characteristics are similar to Gensets, as the specific study examines their role as an extra technique of AS provision. However, there are differences, the most important of which are:
Fuel Price: The type of fuel used may be diesel, but at a different price it is supplied to a power station in comparison with the owner of a Genset. More specifically, the purchased price for a power station according to [
23], ranges between 0.8–1 €/lt, while in contrast, Genset owners purchase diesel fuel at the current retail price of the market.
Efficiency: The efficiency of gas turbines is lower than that of Gensets.
Units’ Size: The size of the Gensets (capacity) is significantly smaller than that of gas turbines, while they are many in total and distributed in different areas and substations.
Personnel: As these units are part of a power station with dedicated operators to work on them.
Figure 14 shows the fuel consumption curve of the gas turbine “GT 5 LIN” of Linoperamata power station, a LM 2500 Gas Turbine [
31]. The optimal operating point of this unit was calculated at 24MW with the specific fuel consumption being equal to 0.275lt/kWh. Therefore, it was observed that in comparing it with the corresponding prices in
Table 4, the specific fuel consumption costs of the “GT 5 LIN” gas turbine are higher than that of “MV Gensets” (>250kW). However, taking into account the diesel fuel cost of the gas turbine which equals 0.985 €/lt (price in 2013: the highest of the decade), there is a fuel consumption cost at the optimal operating point equal to 0.271€/kWh. That leads to lower fuel consumption cost compare to all Gensets, which is solely due to its cheaper purchase price.
Figure 15 shows the fuel consumption curve of the gas turbine “GT 1 LIN” of Linoperamata power station which is one of the most “expensive” and oldest gas turbines of the power system. The installed capacity of the “GT 1 LIN” is approximately 15MW, which makes it a more easily comparable unit with Gensets.
The corresponding calculations for “GT 1 LIN” unit provide:
- ▪
Optimal operating point: 13.5MW
- ▪
Fuel consumption at the optimal operating point: 442.77lt/MWh
- ▪
Fuel consumption cost at the optimal operating point minimum: 436.13 €/MWh.
It is observed that the fuel consumption of “GT 1 LIN” at its optimal operating point is almost 450 lt/MWh, and as a result, the fuel consumption cost exceeds that of Gensets.
Subsequently, it should be noted that additional available capacity added to the system, from fast response units whose fuel consumption cost does not exceed that of the most expensive units of the Cretan power system. Therefore, the operator has the ability to utilize Gensets, replacing the most expensive units such as “GT 1 LIN” with an equivalent group of Gensets whenever required.
Table 5 shows the synopsis of the analyzed calculation results for the 750-kW Genset, the “GT 1 LIN” and the “GT 5 LIN”. It is noted that the 750-kW Genset has a fuel consumption cost of 358 €/MWh, lower than the one of “GT 1 LIN”.
At this point, the critical issue of whether it is preferable to start Genset units or to increase the power injection of the gas turbines is examined, if feasible—
Table 6 answers this question. Studying the change of specific consumption of each unit to 50–75% and 75–100% of their maximum power, it can be concluded that increasing the production of gas turbines, even that of “GT 1 LIN” is preferable than the startup of Gensets. More specifically, the increase in the power generation of “GT 1 LIN” at the rate of 75–100% of its installed capacity leads to 0.311€/kWh of fuel consumption cost (0.316lt/kWh). For the same rate (75–100%), the Genset of 750 kW has production costs of 0.358€/kWh (0.256lt/kWh) at its optimal operating point. However, as has already mentioned, this is due to the difference in fuel costs for each case.
5. Conclusions
In this paper, the exploitation of existing power generation from the demand side is proposed as a supplier of AS. This new technique refers to DSGAs, which represent the Gensets installed in consumer infrastructures to serve the load in electrical network interruptions. Their impact on the level of the substations’ reliability enhancement was evaluated, examining the improvement that can be achieved in terms of its overloading and copper losses. For the needs of this investigation, the substation of Stalida in the eastern part of the island power system of Crete was used as a case study. Due to the high load demand that is observed in the wider area during the summer period, the 2 × 50 MVA HV/MV transformers are overloaded for most of the peak evening hours, when photovoltaics cannot actually help. However, it is estimated that as a tourist region, the specific substation could be enhanced with 20MW of DSGA, which are mostly installed in accommodation infrastructures of the area. The calculations showed that 5MW of DSGA could offer a reduction of 61.9% regarding the number of hours that the substation cannot operate at the N-1 criterion. If the DSGA capacity exceeds 15 MW, the substation overloading is eliminated. Similar results arose for the copper losses investigation, where for the peak hour of 21:00–22:00 the 5-MW DSGA gave a reduction of 16% while for 20MW the reduction almost reached 60%.
Furthermore, the required configurations of the DSGA to be integrated as an extra source of AS provision in the power system of Crete and their associated costs were investigated including their fuel consumption cost. The proposed configurations or adaptations examined the needs for synchronization, protection, monitoring, control and telecommunication which represent the initial capital cost of the investment. More specifically the reference cost for the required configurations was classified by the size of Gensets and was estimated on average as 136 €/kVA. Also, the fuel consumption which was calculated through indicative fuel consumption curves of diesel generators was estimated as 0.267lt/kWh on average. With the assumption of 1.4 €/lit diesel price, the fuel consumption cost was calculated as 0.373 €/kWh. Τhe comparative fuel consumption analysis between the Genset and the existing gas turbines of the Cretan power system led to the conclusion that the integration of Gensets in the electrical grid adds significant additional available power, from fast response units. Their fuel consumption costs (373.8 €/MWh) is comparable with the most expensive gas turbines (436 €/MWh) of the Cretan power system, even without the regulation of the preferential diesel fuel supply for the owners of Gensets.
Finally, a proposal for the remuneration of DSGA was made which was compared with the actual remuneration of Genset rentals for the case of the Cretan power system. The analysis has shown that in the worst case of DSGA capacity availability remuneration and energy production remuneration that suggested in this paper, the prices are respectively 38.1% and 61.6% lower than the corresponding prices for Genset rentals. These prices make DSGA a beneficial AS technique for the operators of island power systems in combination with the fact that they are existing units, are dispersed in the level of the distribution system in contrast with Gensets, which are rented and usually installed in central power stations.
As an overall conclusion, the utilization of existing DSGA can significantly assist the AS in power systems and actually with lower remuneration prices than other similar techniques., Additionally, due to their high dispersion, their contribution to local reliability is also considerable as it was proven in the examined analysis for a typical substation. Therefore, the operators of island power systems should be encouraged to utilize them mainly as distributed guaranteed power units to provide AS at the local level. The next objective of this research team is to assess and the framework for the access of Gensets in the electrical grid, especially in isolated or weak interconnected power systems. Thus, the remuneration and legislation framework of the participation of DSGA in current or future markets will be determined.


