Article

An Electroporation Device with Microbead-Enhanced Electric Field for Bacterial Inactivation

1
School of Mechanical and Aerospace Engineering, Nanyang Technological University, 50 Nanyang Avenue, Singapore 639798, Singapore
2
Interdisciplinary Graduate School, Nanyang Technological University, 50 Nanyang Avenue, Singapore 639798, Singapore
3
Singapore Institute of Manufacturing Technology (SIMTech), 2 Fusionopolis Way, Singapore 138634, Singapore
*
Author to whom correspondence should be addressed.
Inventions 2020, 5(1), 2; https://doi.org/10.3390/inventions5010002
Submission received: 26 October 2019 / Revised: 15 December 2019 / Accepted: 21 December 2019 / Published: 27 December 2019
(This article belongs to the Special Issue Microfluidic Devices)

Abstract

:
This paper presents an electroporation device with high bacterial inactivation performance (~4.75 log removal). Inside the device, insulating silica microbeads are densely packed between two mesh electrodes that enable enhancement of the local electric field strength, allowing improved electroporation of bacterial cells. The inactivation performance of the device is evaluated using two model bacteria, including one Gram-positive bacterium (Enterococcus faecalis) and one Gram-negative bacterium (Escherichia coli) under various applied voltages. More than 4.5 log removal of bacteria is obtained for the applied electric field strength of 2 kV/cm at a flowrate of 4 mL/min. The effect of microbeads on the inactivation performance is assessed by comparing the performance of the microbead device with that of the device having no microbeads under same operating conditions. The comparison results show that only 0.57 log removal is achieved for the device having no microbeads—eightfold lower than for the device with microbeads.

1. Introduction

Electroporation is a widely used nonviral technology for transfection of genes and drugs [1,2,3,4]. Under the application of a strong electric field, supraphysiological membrane potential is induced across the cell membrane to cause the formation of nanopores and thus change cell permeability [5]. When the applied field strength is sufficiently high, cell membranes are permanently perforated, leading to cell inactivation. The electroporation technique has numerous applications, such as the delivery of exogenous reagents like genes, drugs, and nanoparticles or the extraction of intracellular components like proteins, nucleic acids, etc. [6,7]. It also plays an important role in recent breakthroughs such as gene editing (CRISPR-Cas9) [8,9] and cell reprogramming (induced neurons) [10]. Moreover, this method is used in the beverage, wine, and dairy industries for disinfecting liquid products [11,12,13,14] and shows great potential in the field of water treatment as well [15,16,17]. However, to maintain the high electric field strength required for electroporation, electric voltages up to 105 volts are usually employed, which increases the issues concerning operational safety.
Recently, various kinds of microfluidics devices have been reported in the study of electroporation under controlled experimental conditions [6,7]. Early devices implemented 2D electrodes, including rectangular [18], interdigitated [19], and saw tooth electrodes [20] and other shapes [21,22,23] for generating high electric field strength. However, the electric field distribution is nonuniform because of the decay of field strength away from the electrode surface. To resolve this issue, devices involving 3D electrodes were developed, and the electroporation efficiency was significantly improved [24,25]. Although local high field strength can be developed using different electrode designs and configurations, problems such as electrolysis and corrosion of electrodes were unavoidable. As a consequence, insulator-based microfluidic devices were developed where insulating structures (e.g., micropillars) with geometric variations are used [26,27,28,29,30,31]. The use of insulating structures not only enhances local electric field strength but also minimizes the adverse effects observed in conducting electrode-based devices. Insulator-based dielectrophoresis (iDEP) devices have been demonstrated manipulating cells, particles, and proteins [32,33,34]. In our previously reported work, an iDEP device involving insulating PDMS micropillars was developed to inactivate microorganisms under various electric field and flow conditions [35].
In this paper, we present electroporation-based bacterial inactivation operating on an enhanced electric field induced by insulating microbeads. Electric voltage was applied to a pair of mesh electrodes inside a chamber that consists of densely packed microbeads. The use of microbeads can enhance local electric field strength at lower applied voltages that are sufficient to electroporate bacteria. The inactivation performance is tested for two types of bacteria: Escherichia coli (E. coli) and Enterococcus faecalis (E. faecalis) under various electric field conditions. Both of the bacteria are abundantly found in raw water and are widely used as indicator organisms in the water treatment process [36,37]. Figure 1a shows a schematic of our proposed device, with its working principle illustrated in Figure 1b.

Fundamentals

In the device shown in Figure 1a, the motion of the fluid is governed by the continuity equation · u = 0 and the steady-state momentum equation p + μ 2 u + ρ e E = 0 , where p is the pressure and μ is the dynamic viscosity of the liquid. ρ e E denotes the electrical body force with ρe being the net charge density and E the strength of the applied electric field. However, the electrical body force terms can be ignored based on an assumption of a thin electric double layer (EDL); hence, a slip boundary condition can be imposed [38], and such slip velocity can be expressed as [39]
u e o = μ e o E
where ueo is the electroosmotic mobility of the fluid and is dependent on the surface potential ζs and permittivity εm and viscosity μ of the liquid [40]. This mobility is given by the Smoluchowski equation as
μ e o = ε m ζ s μ .
Similarly, the electric potential distribution outside the EDL region is governed by the Laplace equation 2 ϕ = 0 , and the electric field strength can be obtained as E = ϕ . In the presence of electric field, cells experience electrophoresis due to their electrostatic charges. In addition, the formation of nonuniform electric field generated inside the region of the packed beads results in the cell dielectrophoresis effect. Therefore, considering the combined effect of electroosmotic flow, electrophoresis, and dielectrophoresis, the cell velocity can be estimated as [41]
u p = u u p E c ε m r 2 3 μ ( E . ) E
where u is the velocity of the fluid, up is the electrophoretic mobility of the cell of radius r, and c is a correction factor. Since the conductivity of the working fluid is much lower than that of cells, cells experience a negative DEP effect (refer to Supplementary Information S1). In most iDEP devices, the Joule heating effect can play a significant role as Q = σ | E | 2 , where Q is the volumetric Joule heating related to the electrical conductivity of the medium (σ) and the electric field strength (E).
Additionally, cells undergo the electroporation effect due to the charges induced across the cell membrane. These induced charges give rise to a voltage, termed the transmembrane potential (TMP), which is given by Schwan’s equation as [42]
Δ ϕ = f r | E | c o s θ
where f is the shape factor and θ is the angle between the line of electric field and the line joining the center of the cell to the point of interest. Further, the shape factor is given by [43]
f = l l 0.67 r
where r is the radius and l is the length of the cell. For rod-shaped cells such as E. coli, l >> 2r. Thus, f = 1. According to the theory of electroporation, when the transmembrane potential reaches the critical value of 0.2–1 V [7], nanopores are formed within the cell membrane, thereby allowing exchanges of ions, drugs, molecules, genes, etc. If the applied field strength is very high, the pores do not reseal, and the cell membrane is damaged permanently. Two major theories can be found in the literature, and they are the theory of electromechanical compression [44] and the pore energy model [45]. Schwan’s equation remains valid as long as the conductivity of the cell membrane is several orders higher than the conductivity of the suspending medium [46]. Successful electroporations have been demonstrated with various buffer conductivities ranging from deionized (DI) water to saline solution (i.e., 1.6 S/m) without affecting the viability of the cell [17,47]. However, the use of a highly conductive buffer can generate a significant amount of heat, which can affect the electroporation process.

2. Materials and Methods

2.1. Device Design and Fabrication

The device consists of two acrylic blocks, one acrylic plate, and a pair of mesh electrodes. A 15 mm hole was created at the center of a 2 mm plate using laser cutting. Two stainless steel mesh wires, with a thickness of 0.5 mm and sufficiently large aperture (~50 μm), were cut into the desired shape (20 mm × 50 mm). These electrodes were sputtered with 25/400 nm Cr/Au to make them chemically inert. Rectangular grooves were manufactured in the acrylic blocks to fit in the mesh electrodes. Figure S2 shows the assembled device with densely packed beads. Mesh electrodes were hooked up into the rectangular grooves of both acrylic blocks. On the top of one block, the plate was attached, and the beads were packed. Silica beads (~100 μm) were mixed with deionized (DI) water to facilitate the packing process. A syringe was used to suck the water from the bottom to speed up the process. Upon completion, another block was mounted from the top and was fixed with screws.

2.2. Cell Preparation

E. coli and E. faecalis were chosen as the modal organisms for the experiment. E. coli ATCC 25922 and E. faecalis ATCC 19433 were separately cultured overnight at 37 °C in a shaking incubator at 100 rpm. The next morning, 10 μL of cell culture was added to 50 mL of fresh medium and was grown to exponential phase (OD600 ~ 0.5). E. coli was cultured in Luria broth (LB) medium (Sigmaaldrich, Singapore), whereas E. faecalis was grown in a tryptic soy broth (Sigmaaldrich, Singapore). Cell concentration was adjusted to ~106 cfu/mL by dilution. Cells were washed three times with sterile DI water and finally suspended in 50 mL of DI water with 0.1% Tween 20 (Sigmaaldrich, Singapore). Cell samples of 2 mL were collected before and after the treatment process. The concentrations of the samples were obtained using the standard spread plate counting method. After spread plating, samples are incubated overnight at 37 °C. Results from treated samples and controlled samples were compared to obtain the inactivation performance of the device. The concentrations of live bacteria were measured by counting the number of colonies, and log removal efficiencies were obtained as
Log   removal   efficiency =   log 10 ( C / C 0 )
where C is the concentration of live bacteria after electroporation treatment and C0 is the initial concentration of bacteria before treatment.

2.3. Experimental Setup

Direct current (DC) voltages were supplied to the electrodes using an HVS448 high-voltage power supply (LabSmith, Livermore, CA, USA), whereas alternating current (AC) voltages were applied using a signal from a function generator (Tektronix, AFG-3022, USA) and amplified by a high-voltage amplifier (OPT3, Singapore). Experiments were conducted with different electric field strengths ranging from 0 kV/cm to 2 kV/cm. A peristaltic pump (Cole-Parmer, 77301-21, USA) was used for generating the flow of cell suspension at a constant rate of 4 mL/min. For all voltage conditions, a constant flowrate was used. A magnetic stirrer (LMS, HTS-2003, Japan) was used at 100 rpm to make the suspension homogenous throughout the experiments. Before conducting any experiment, the device was flushed using ethanol and DI water. Further, to prevent the cells from adhering, Pluronic F127 (Invitrogen, USA) was used for coating channel walls and the packed bead region.

2.4. Numerical Simulation

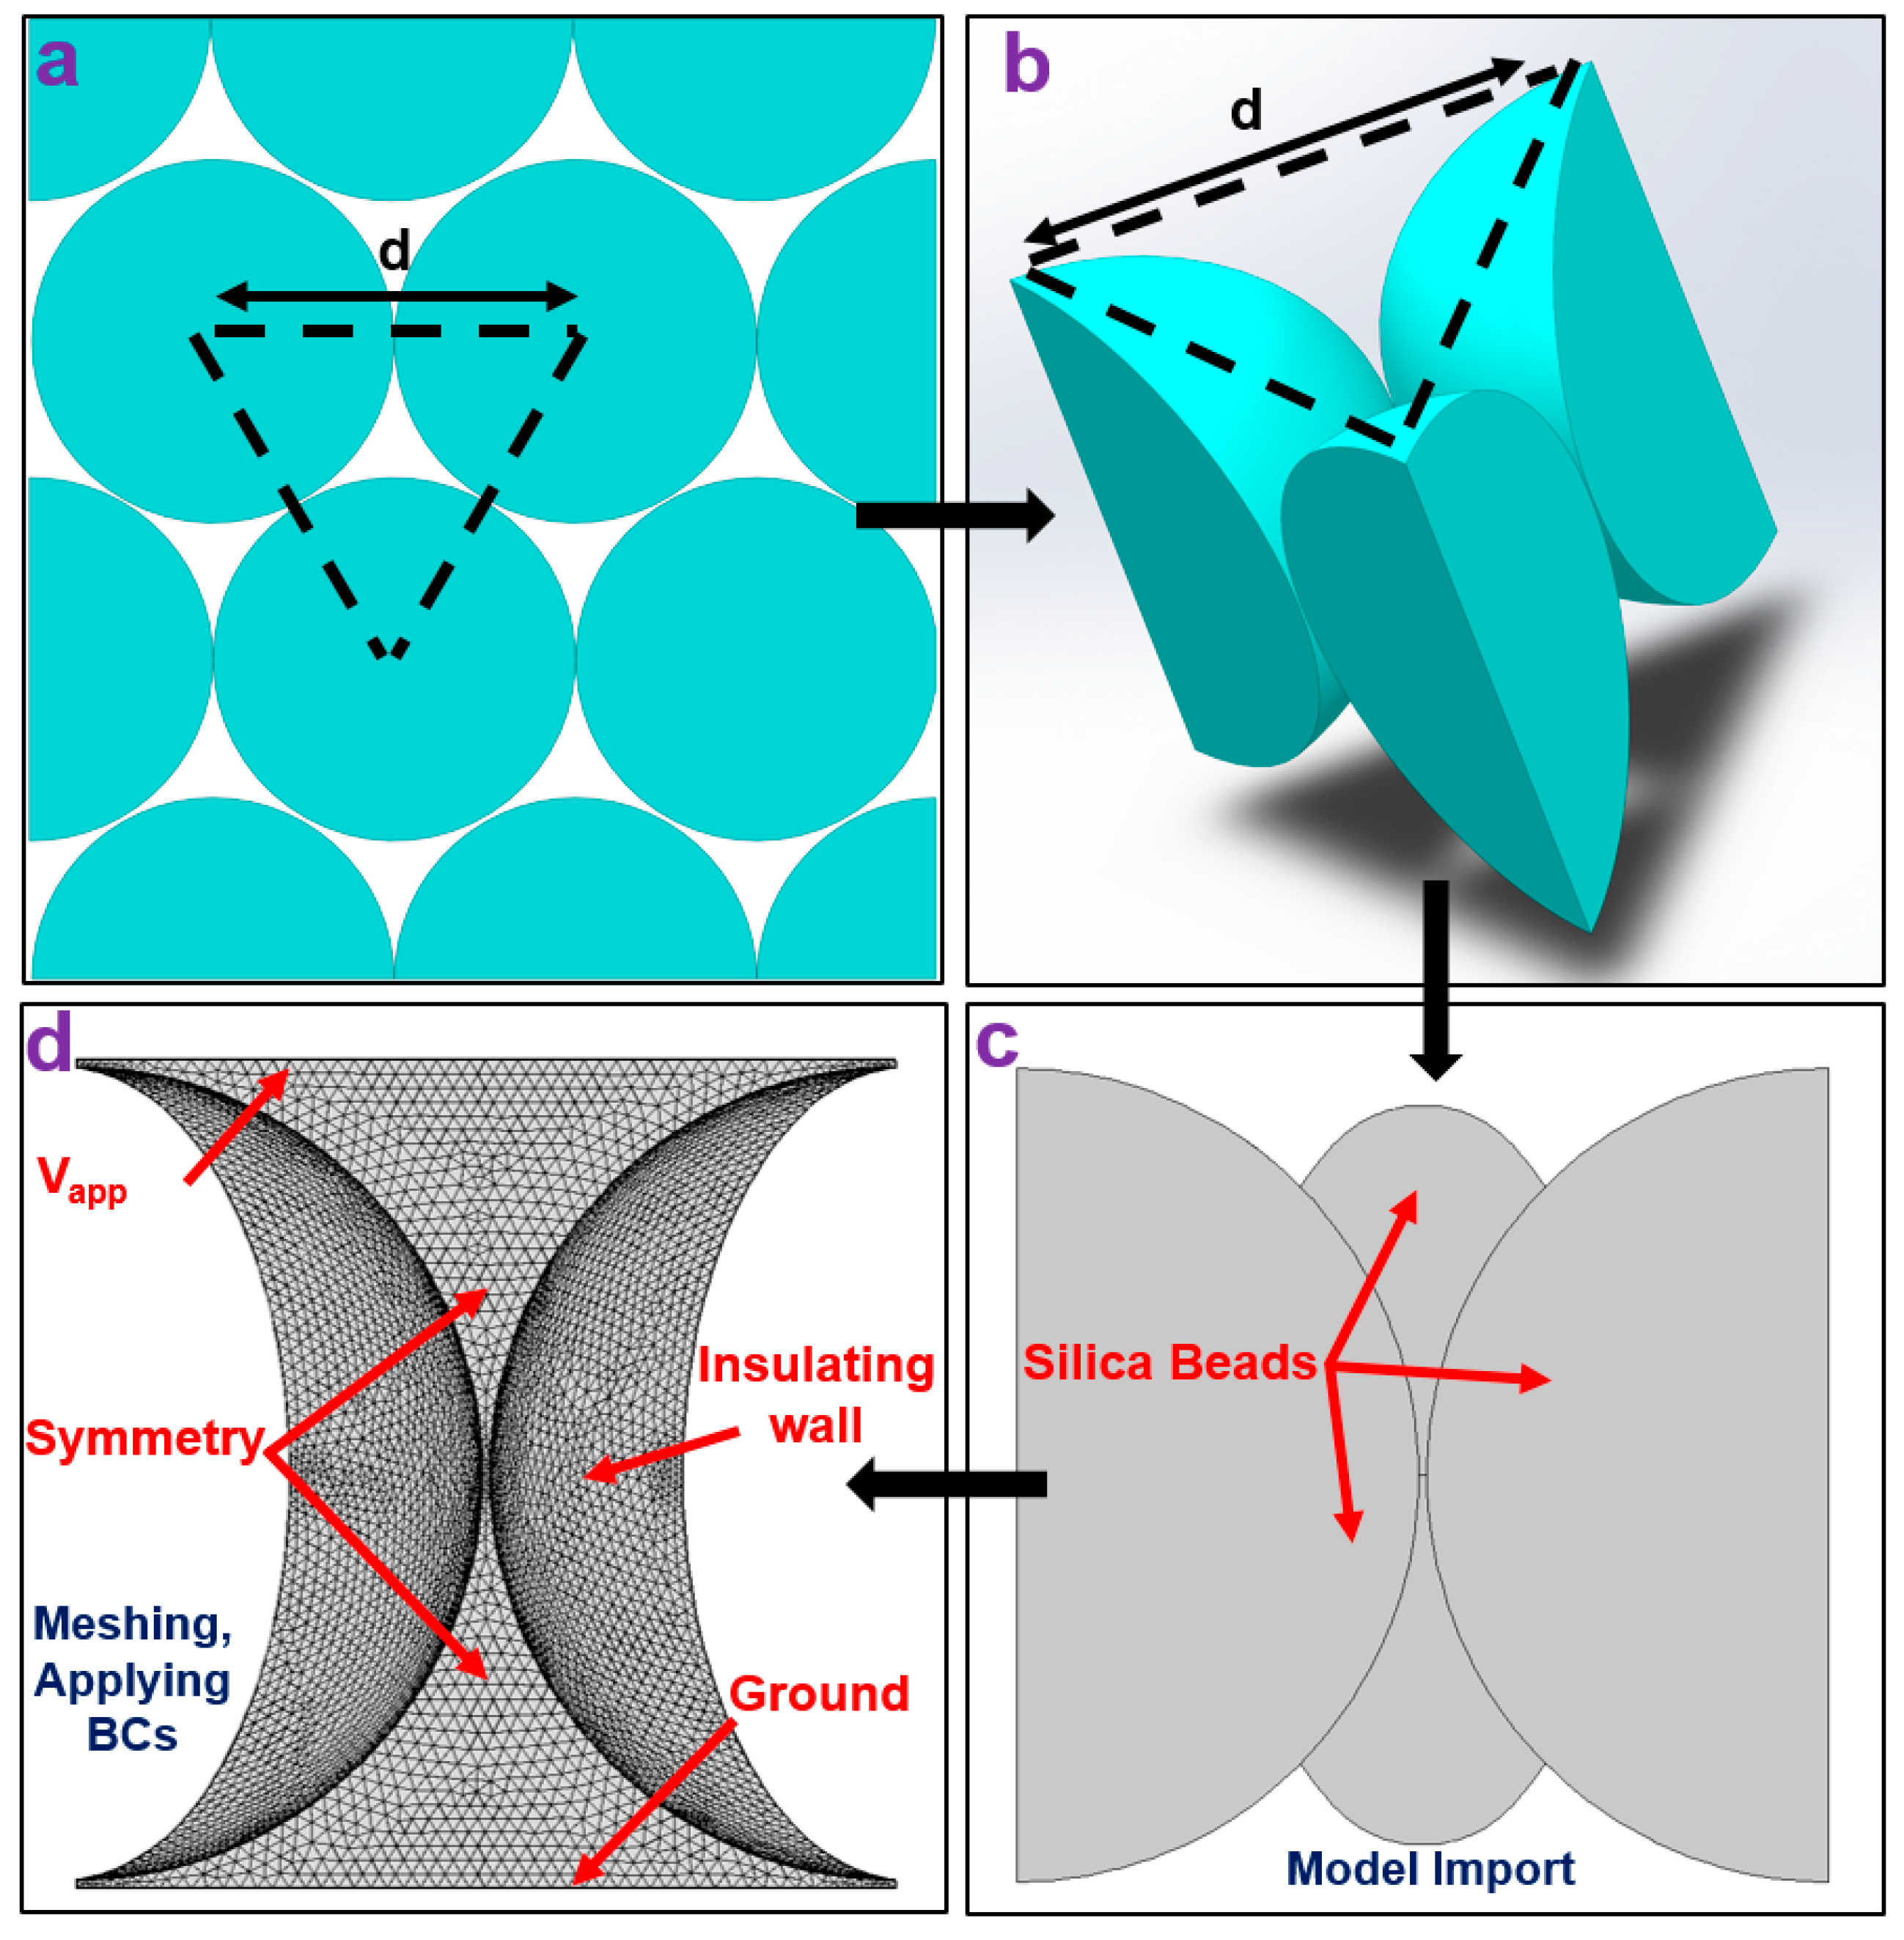
COMSOL Multiphysics software (Comsol, Burlington, MA, USA) was used to simulate the electric field distribution inside packed bead structures. Due to complexity in the geometry, a unit cell rhombohedral structure was considered for the numerical simulation. Figure 2 shows the workflow of our simulation. At first, the packed bead structure was developed (Figure 2a), and the unit cell was created using three microbeads (Figure 2b). This unit cell was imported into COMSOL to obtain the simulation domain (Figure 2c). The domain was meshed using automatic features, and the following boundary conditions were applied (Figure 2d): (a) electric voltages on the anode and the cathode, (b) electrical insulation at the surfaces of microbeads, and (c) symmetrical boundary conditions for remaining boundaries. The values for the dielectric constant and conductivity of the medium were 78 and 5 μS/cm, respectively. An electric voltage of 40 V was applied to the anode, whereas the cathode was grounded. The distance between the electrodes was 100 μm, i.e., the diameter of the beads. (The above conditions for the unit cell are equivalent to our working device with an electrode gap of 2 mm.)

3. Results and Discussion

3.1. Numerical Simulation Results

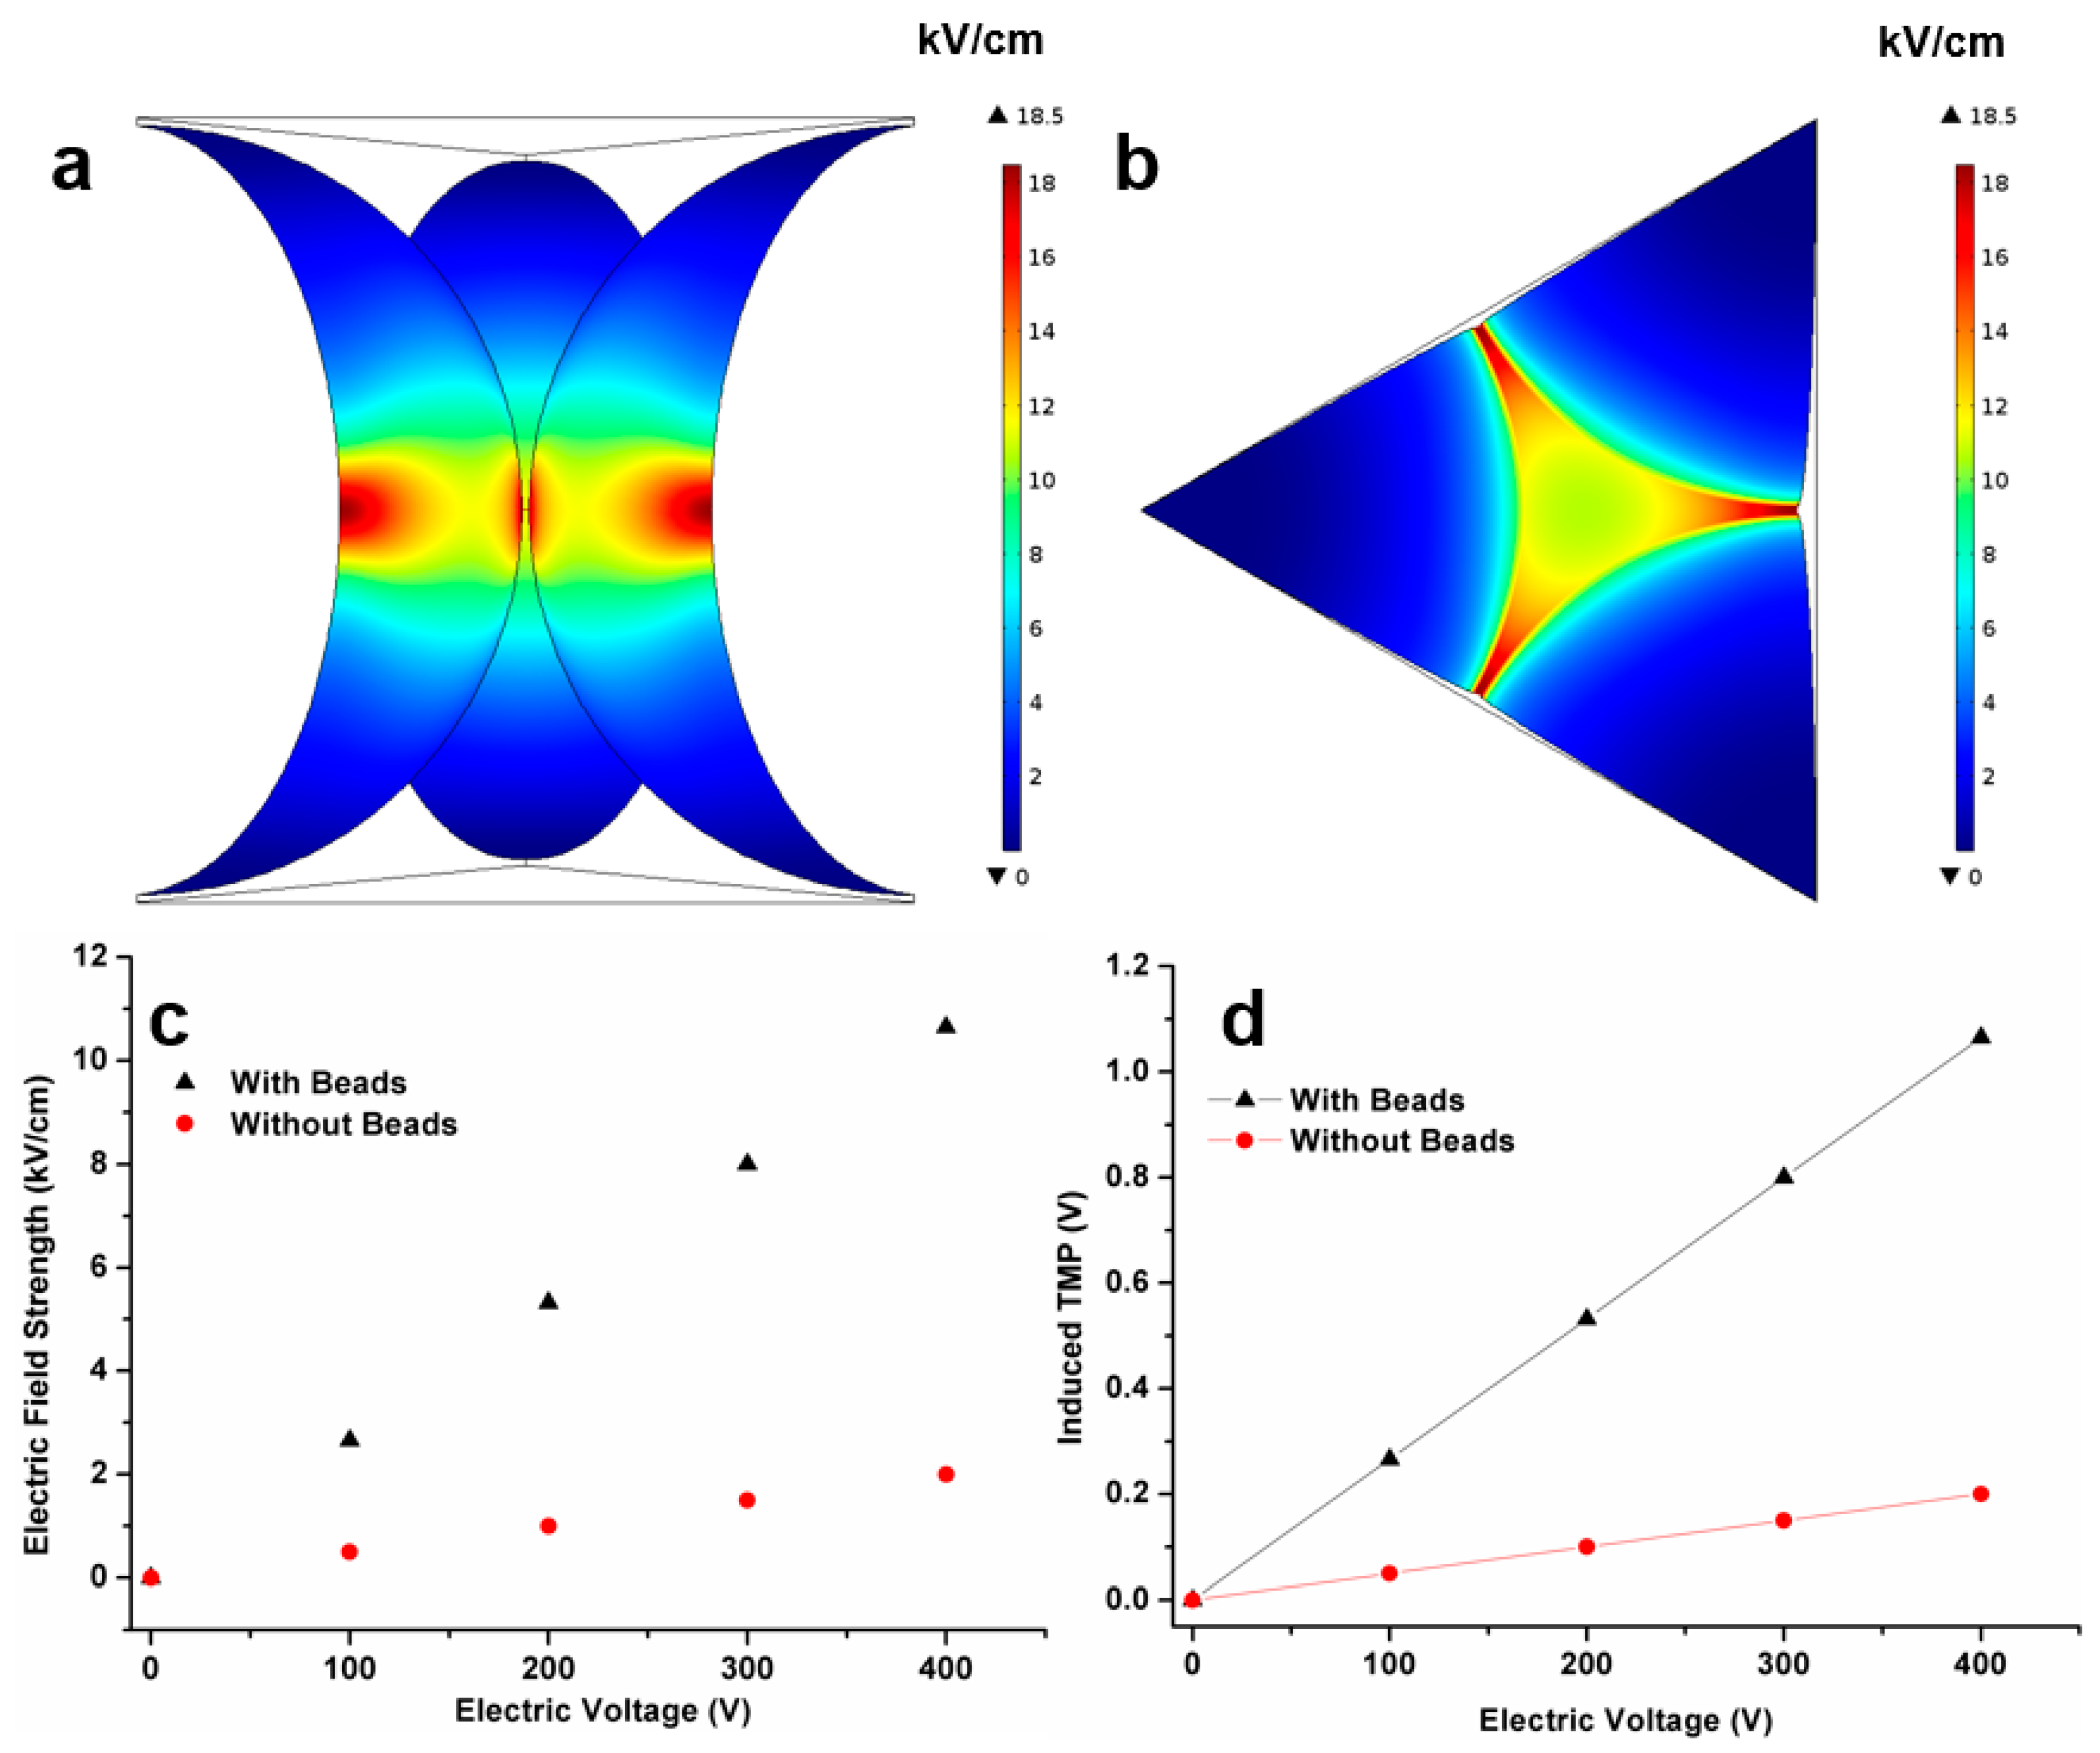
Our simulation results show that the use of microbeads results in nonuniform distributions of the electric field with local enhancement in its field strength. Particularly, the results presented in Figure 3a,b show that the electric field strength reaches up to 18.5 kV/cm (near the corners of the cut plane). Additionally, the minimum electric field strength in the same cut plane is approximately 10 kV/cm, which suggests at least fivefold enhancement of electric field strength is achieved when beads are used. Numerical simulations were also performed to compare the electric field strength when no beads are used where the electric field distribution is uniform with a field strength of 2 kV/cm. Figure 3c compares the electric field strengths for both devices (with and without beads), under various applied voltages. By using these electric field strengths, the induced TMP can be obtained using Equation (4). Figure 3d shows the induced TMPs for all operating conditions for both devices. For the device with beads, the induced TMP is greater than 0.2 V for all voltages higher than 100 V.

3.2. Inactivation Performance of the Device

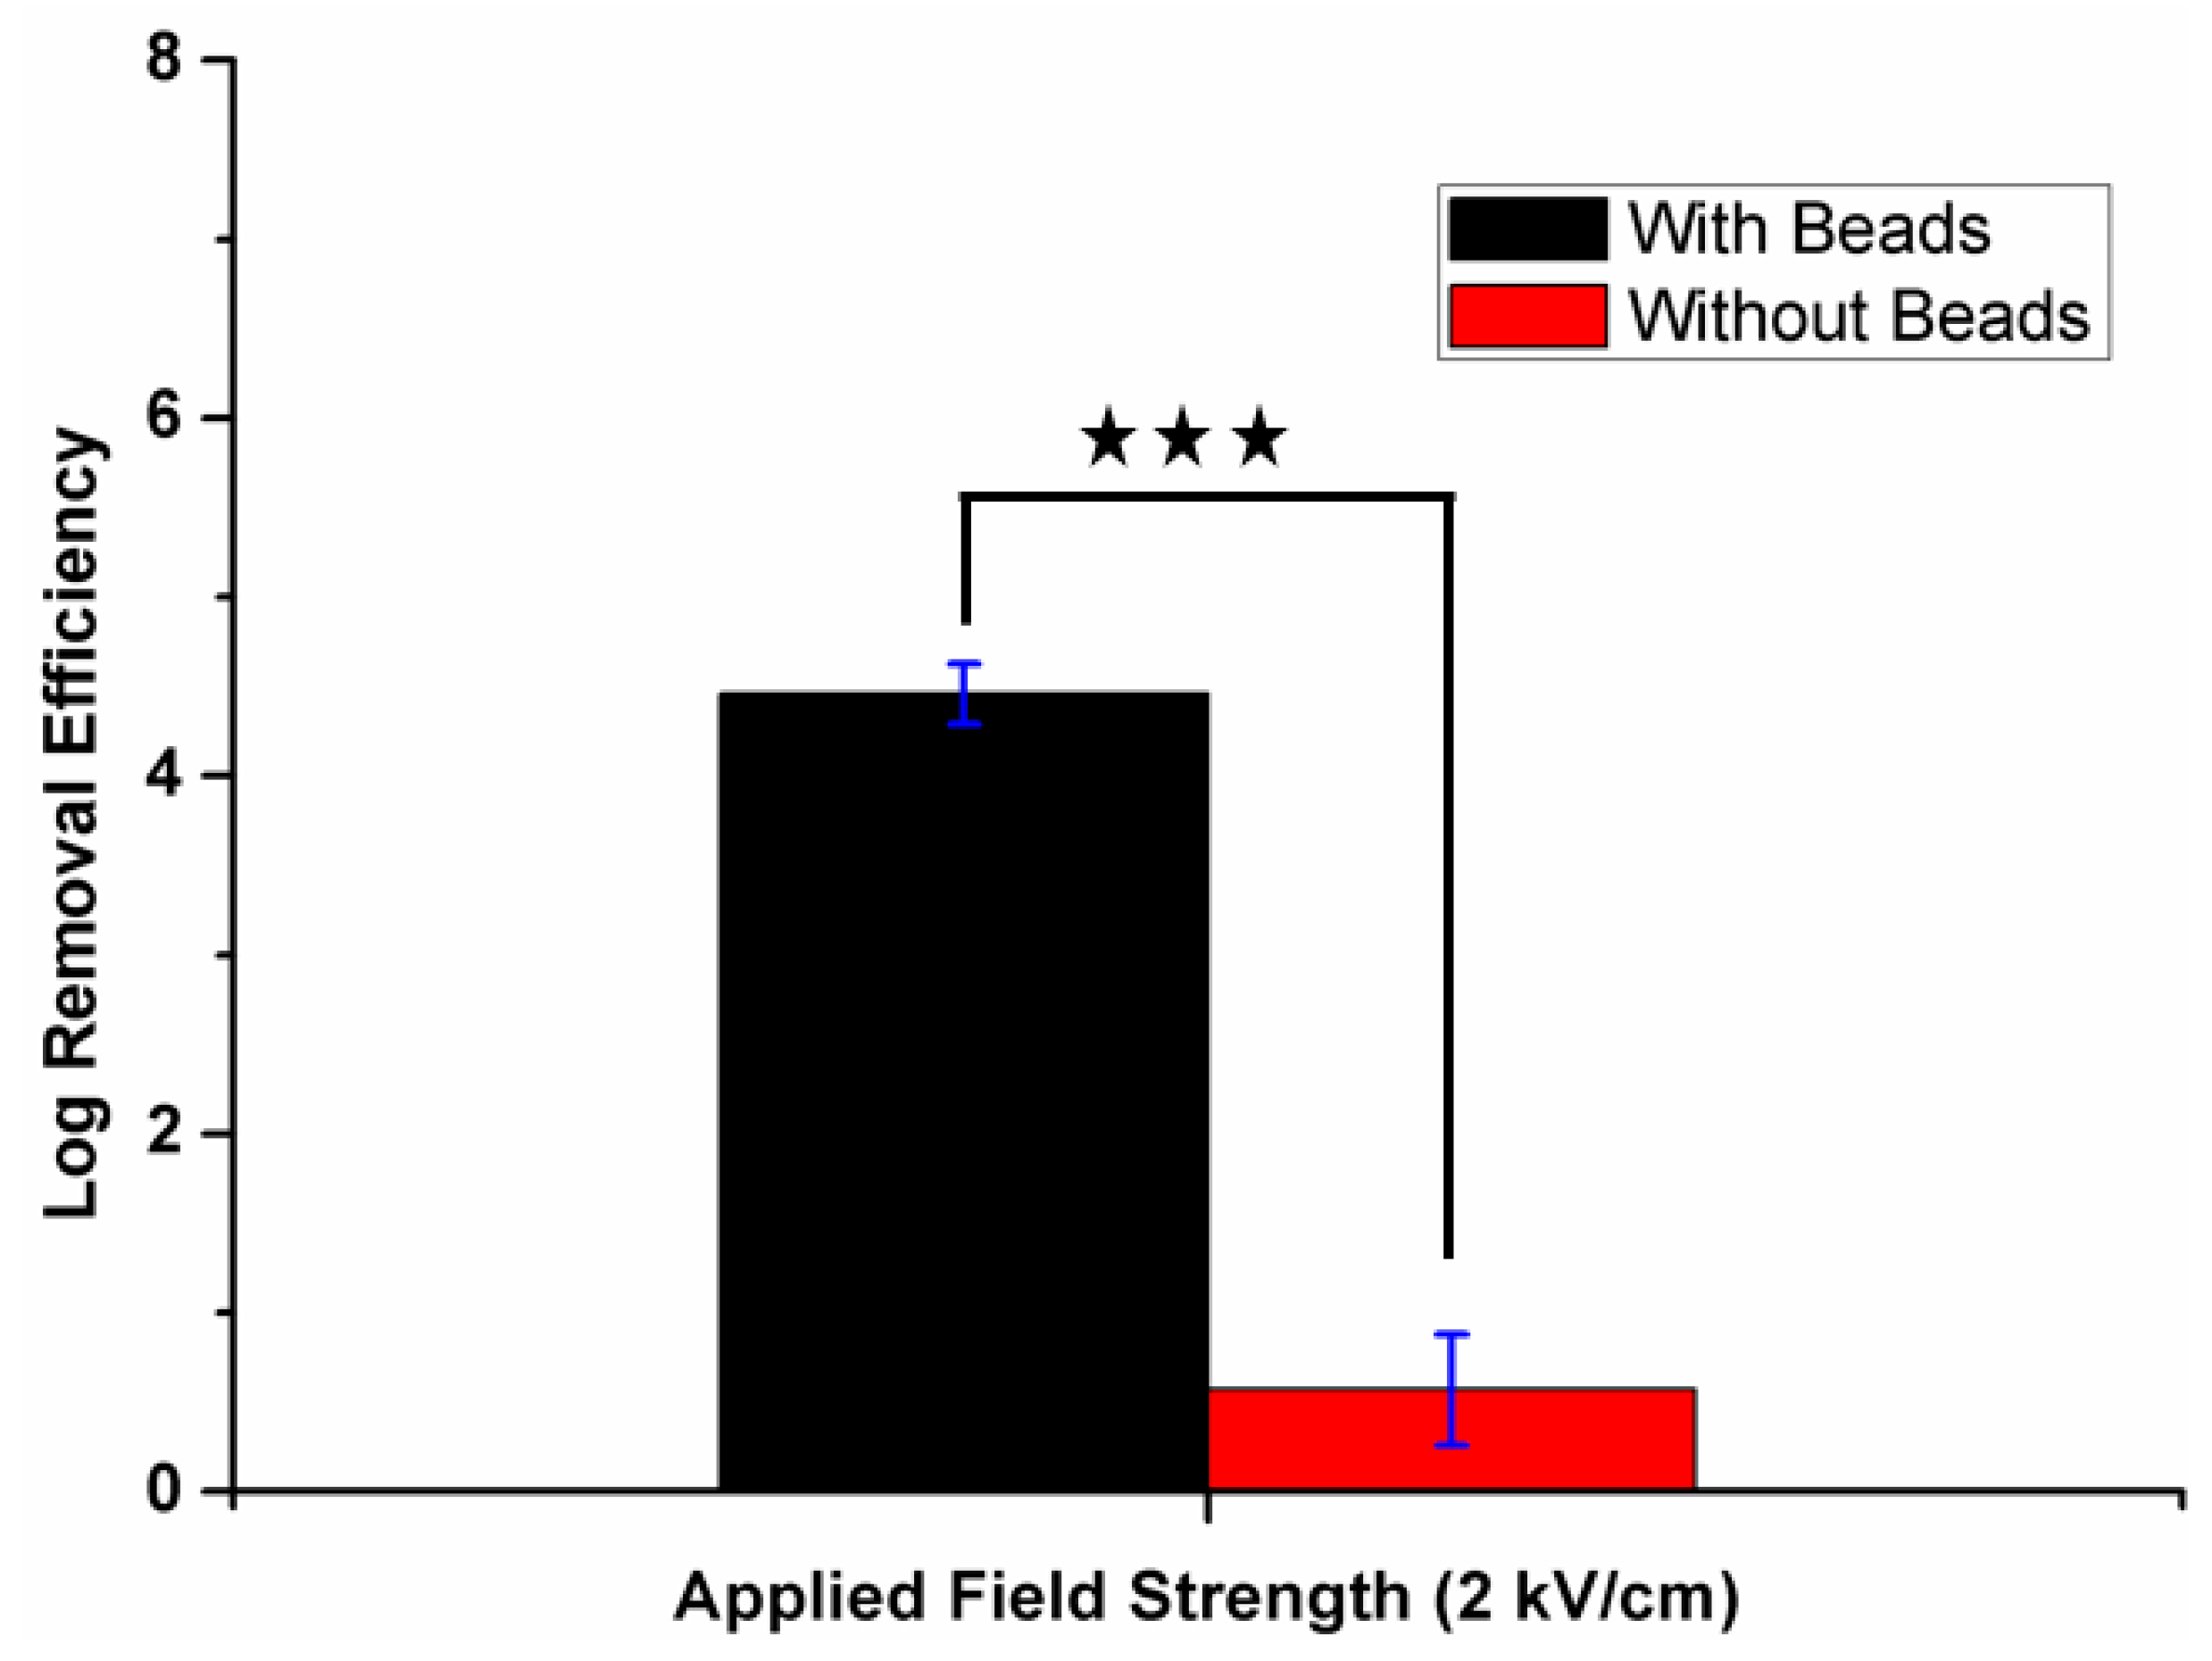
The performance of our inactivation device was compared with the device with no beads. Experiments were conducted using E. coli for an applied field strength of 2 kV/cm with a flowrate of 4 mL/min. Figure 4 compares the log removal efficiency for both devices, where a significant difference can be observed. More than 4.5 log removal (~4.75) is obtained when beads are used, while the log removal efficiency is less than 1 (~0.57) when no beads are used. Under this electric field condition, the induced TMP for the device with beads is nearly 1 V (refer Figure 3d), which favors electroporation. However, for the device without beads, the induced TMP is ~0.2 V (refer Figure 3d), under which minimum inactivation is achieved. This result suggests that the electric field can be enhanced significantly by using insulating beads to induce strong local electric field strength that can much enhance the electroporation of cells.
The energy consumption of the device was also obtained and was compared to the UV treatment method. For a flow rate of 4 mL/min and an applied potential of 400 V, the electrical current in our device is only 2.15 mA. This corresponds to energy consumption of 12.90 kJ/L, which is significantly lower than the power consumption by UV disinfection methods (up to 933.6 kJ/L) for disinfecting bacteria [48]. A detailed calculation is provided in Supplementary Information S3. By considering a porosity of 0.36 for well-packed spherical beads [49], the volume of the treatment chamber was obtained as 0.636 cm3. Therefore, 6 sec hydraulic retention time (HRT) was obtained for the flowrate of 4 mL/min. Usually, the treatment time for the UV method is around 30–100 s, which is much longer compared to that for our method (~6 sec) [50]. The effectiveness of the UV method is also dependent on the biomass concentration, as well as the turbidity of the liquid. Similarly, the requirement for periodic maintenance of the lamp increases the cost of the treatment process. Our method also shows benefits over chemical methods of treatment as our method does not involve the use of any chemicals and the formation of by-products is also negligible [17,47,51].

3.3. Effect of Applied Electric Field

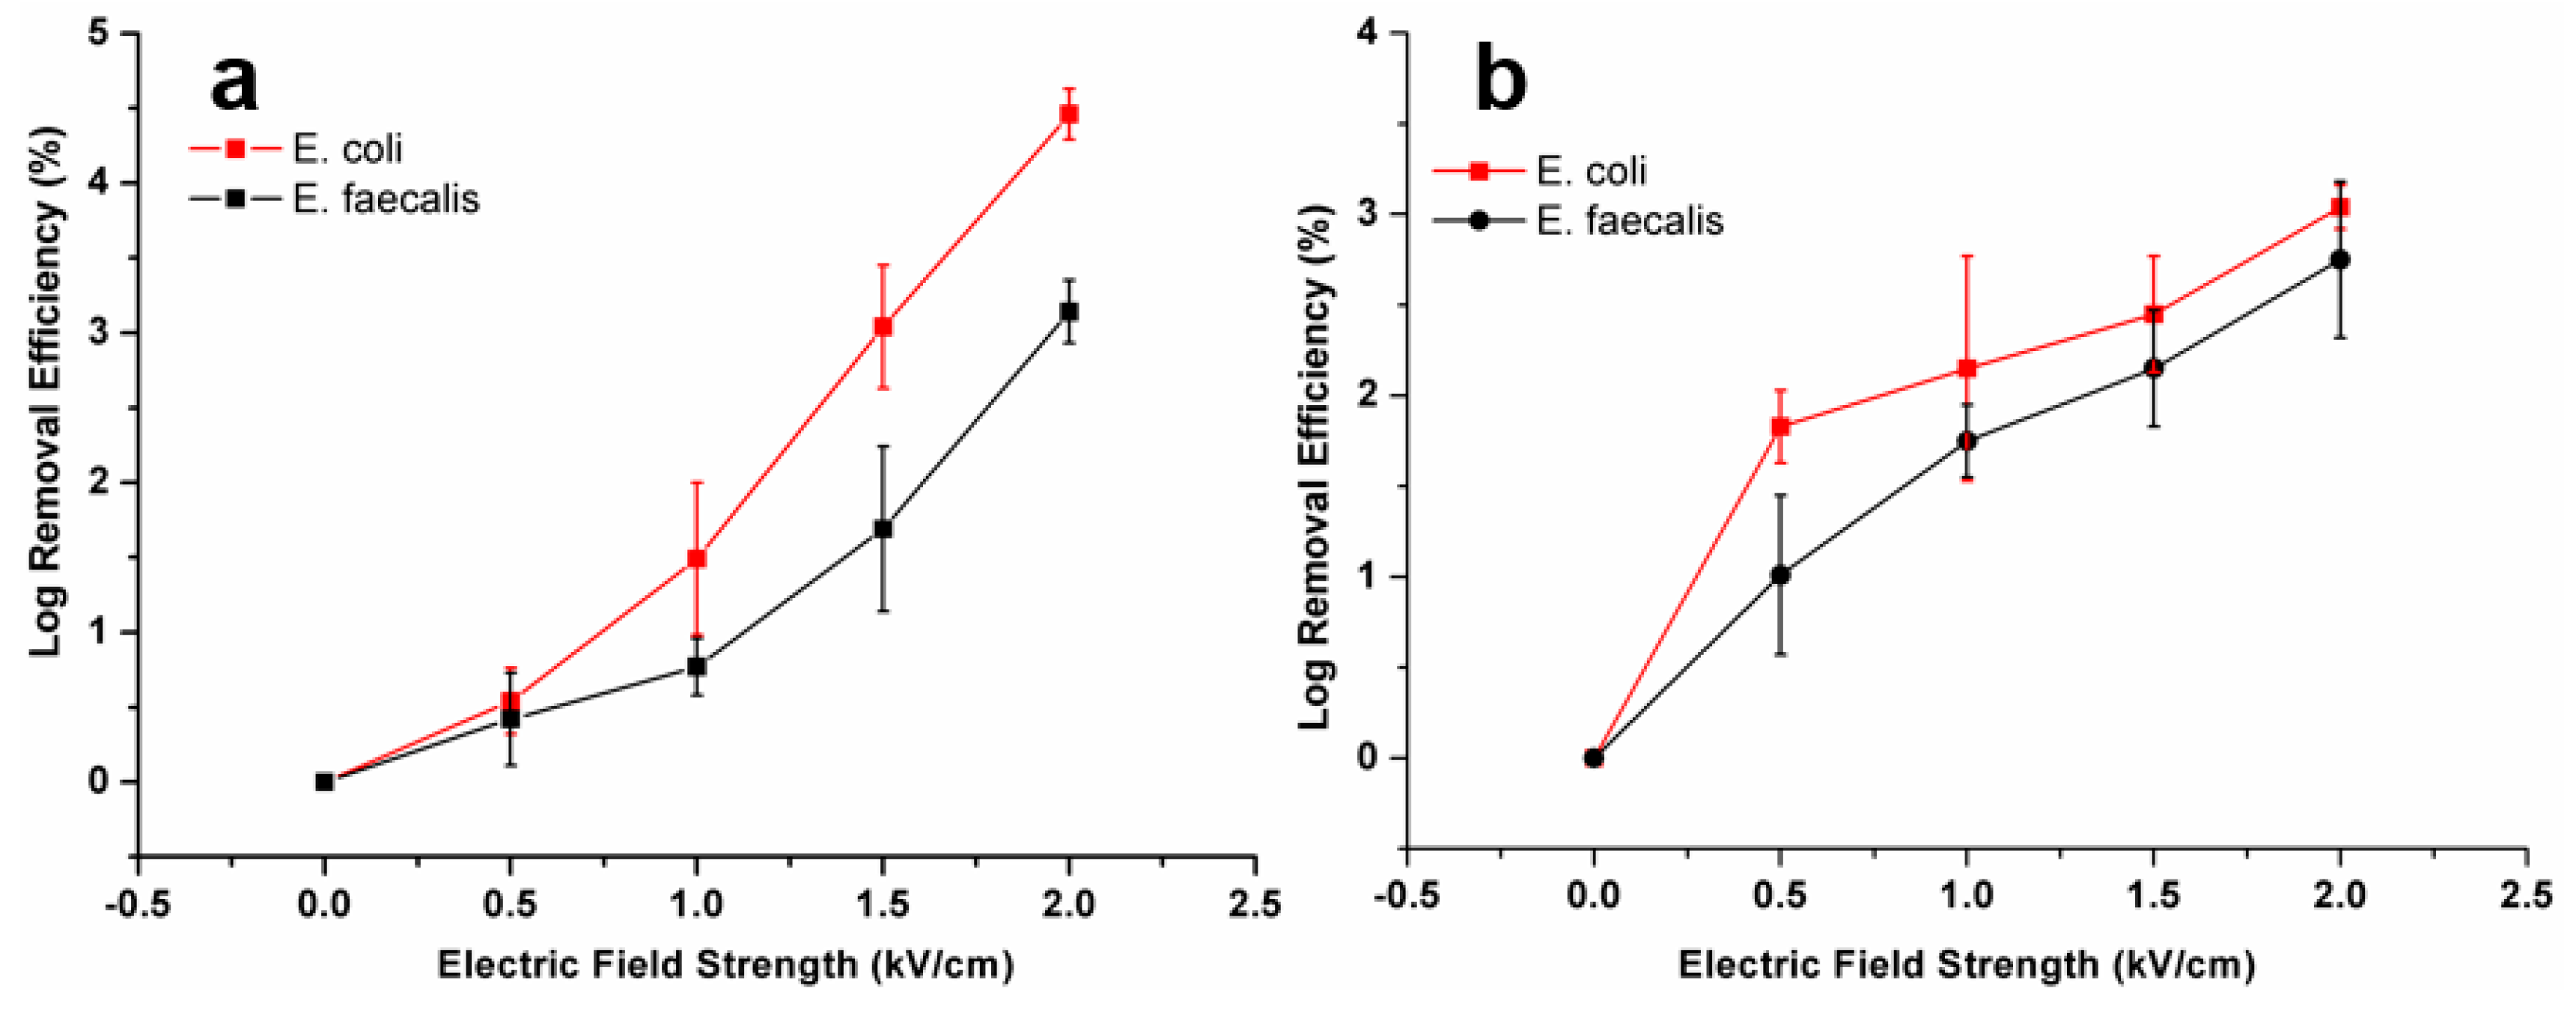
The inactivation performance of the device was evaluated under various electric field conditions with a flowrate of 4 mL/min. Experiments were performed with applied electric voltages of 0.5 kV/cm, 1 kV/cm, 1.5 kV/cm, and 2 kV/cm. Control samples were collected for the 0 V condition and used to compute log removal of the bacterial concentration. After the treatment, all the samples were cultured for 18 h in agar plates at 30 °C. As shown in Figure 5a, more than 4.5 log removal of E. coli was achieved for the applied field strength of 2 kV/cm. No viable cells were observed after 18 h of culture. In the figure, it can be observed that the number of viable cells decreases for higher voltages due to the increase of the TMP for higher voltages. It is also seen that the log removal of E. faecalis is lower than that of E. coli under same electric voltage, which is due to the presence of a thicker cell wall layer for Gram-positive bacteria [51].
Similarly, experiments were performed for various AC field strengths ranging from 0.5 kV/cm to 2 kV/cm for both bacterium types. It was observed that the log removal for both bacteria was lower compared to the results from DC (Figure 5a,b). For DC, voltage always remains at the same value, while for AC, voltage changes with time, and the duration of the electric field becomes too short to charge the transmembrane potential to a level that induces electroporation. However, with the use of AC, the total current is lower than that with DC. In addition, at lower voltages, compared to DC, the log removal efficiency is higher for AC fields, which might be due to the DEP trapping effect resulting from nonuniformity in the electric field strength (refer to Figure S1).

3.4. Effect of AC Frequency

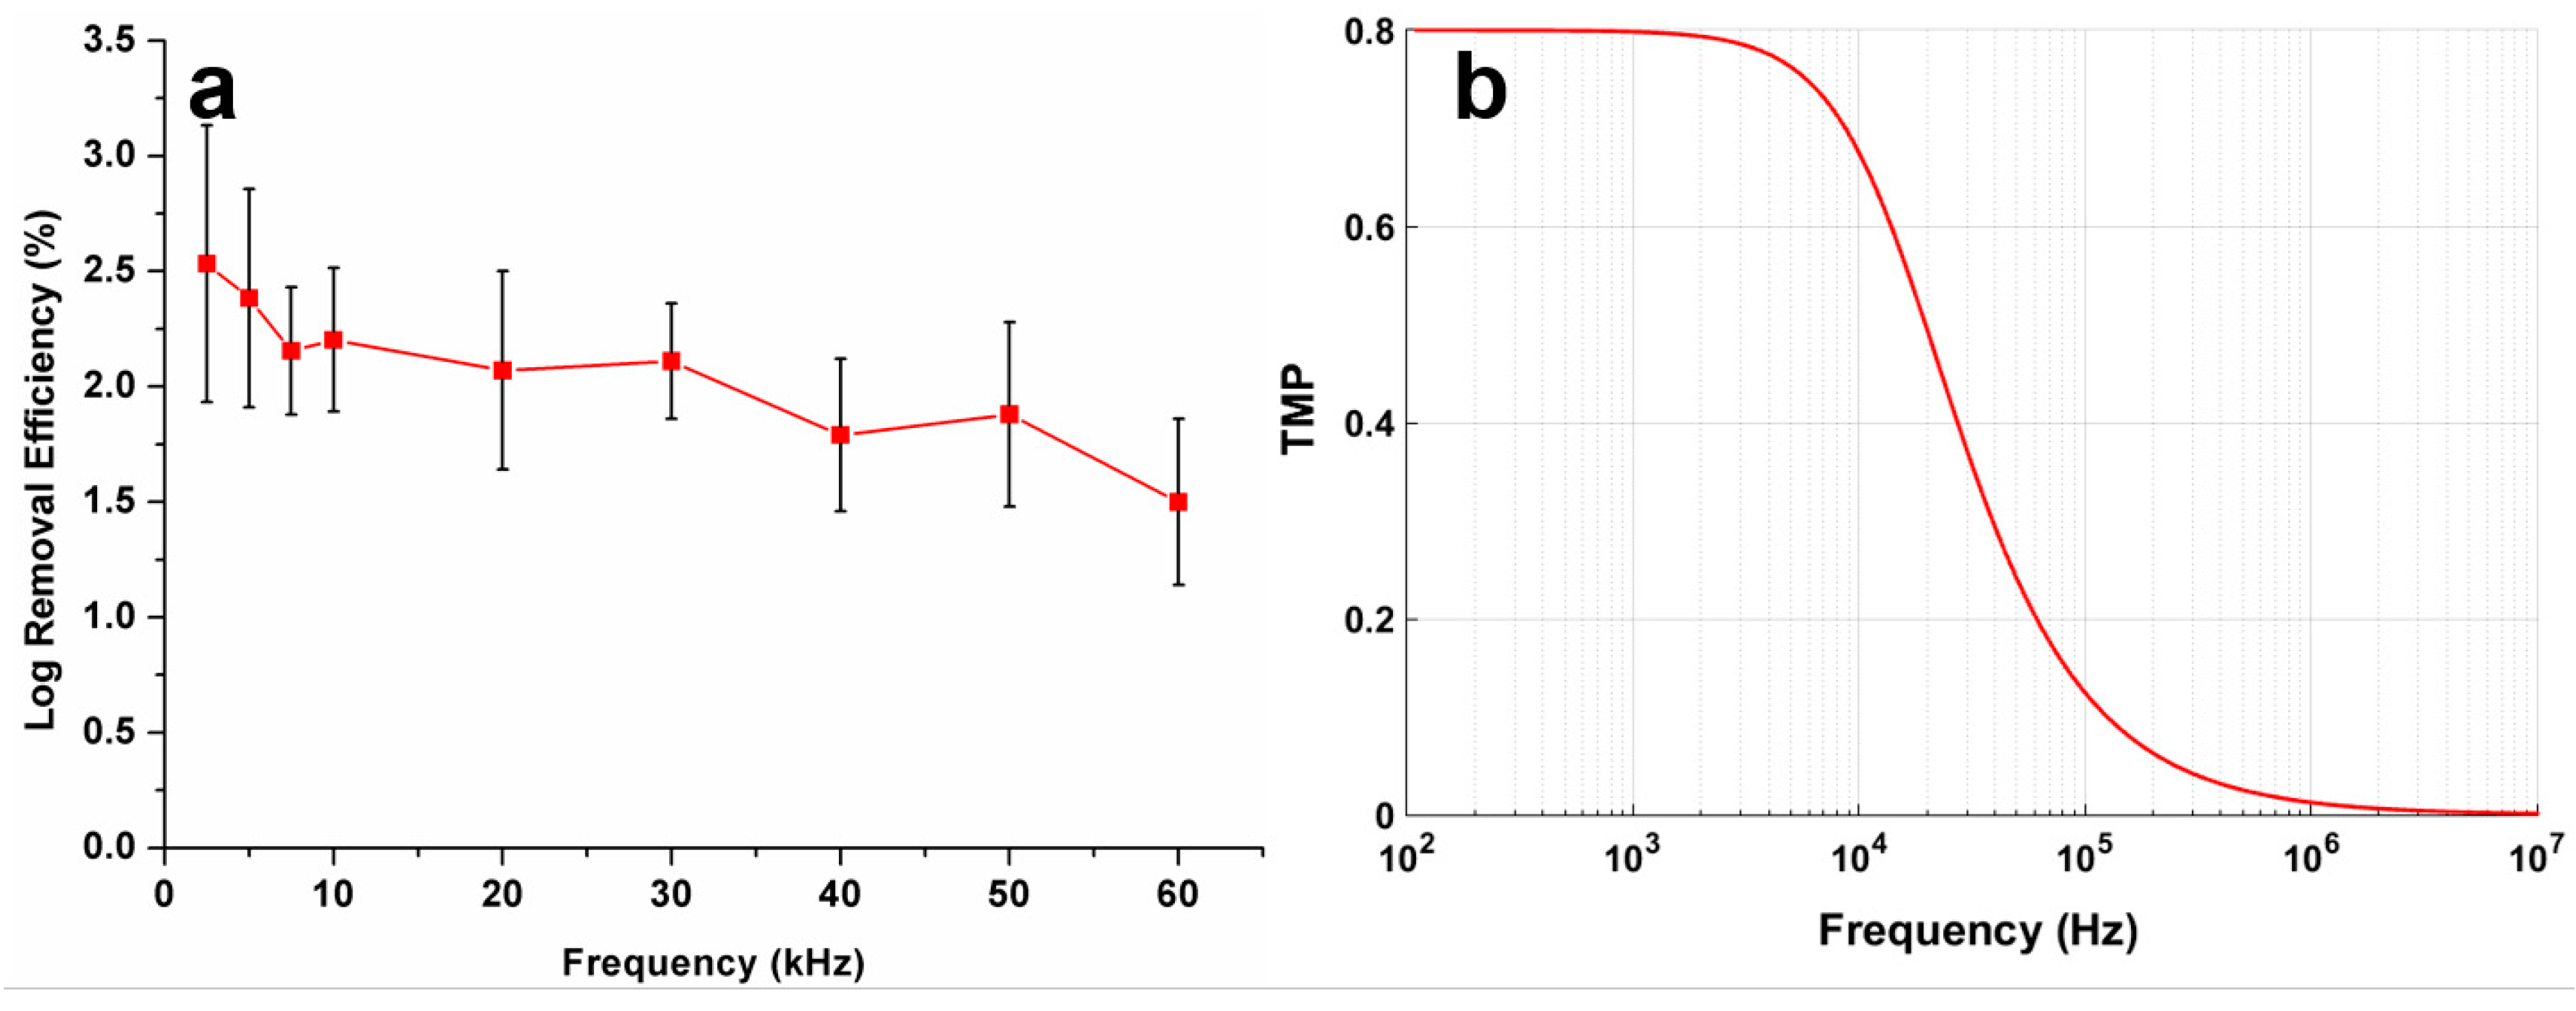
To investigate the effect of AC frequency on bacterial inactivation, experiments were conducted with different frequencies at a fixed applied field strength of 1.5 kV/cm and flowrate of 4 mL/h. Figure 6a presents the device performance for frequency varying from 2.5 kHz to 60 kHz for E. coli. The results suggest a small change in the inactivation for this frequency range. However, the log removal efficiency drops from 2.5 to 1.5 with increasing frequency from 2.5 kHz to 60 kHz. This is because the transmembrane potential does not change significantly in this range, as represented in Figure 6b. In the presence of an AC field, the TMP changes with applied frequency according to Δ ϕ = 1.5 r | E | c o s θ / ( 1 + ( ω τ ) 2 ) 1 / 2 [52], where τ is the time constant and ω is the angular frequency. In this expression, the time constant τ is given by τ = r C m ( ρ i n t + ρ e x t / 2 ) , where Cm is the membrane capacitance and ρint and ρext are the resistivities of the cytoplasm and external medium, respectively. It is observed that if the frequency is high (>104 Hz), the TMP is reduced and the duration of the electric field becomes too short to charge the membrane, thereby causing a reduction in electroporation [16,53]. At higher frequencies, the log removal may be due to the cell DEP effect resulting from insulating beads inducing a nonuniform electric field.

4. Concluding Remarks

We developed a new bacterial inactivation device using packed silica beads that can generate high local electric field strength. The device provides an efficient method of enhancing the local electric field to achieve effective electroporation. The device shows better cell inactivation performance over a reference device without microbeads. This device can continuously inactivate microorganisms at much lower voltage compared to conventional electroporation systems. The reported method can potentially be used in different applications such as fresh, waste, or ballast water treatment or disinfecting food products such as juice, milk, and wines.

Supplementary Materials

The following are available online at https://www.mdpi.com/2411-5134/5/1/2/s1, Figure S1: The Clausius–Mossotti (CM) factor calculated for live E. coli suspended in DI water for various frequencies, Figure S2: Actual setup with an enlarged view showing the electroporation device with electrical connections and fluidic access; Information S1: DEP Response, Information S2: Our Electroporation Device and Setup, Information S3: Energy Consumption Estimation.

Author Contributions

Conceptualization, C.Y.; Data curation, S.P., A.T.K.P. and Y.B.C.; Formal analysis, S.S.U.A.; Funding acquisition, S.H.N. and C.Y.; Investigation, S.P. and A.T.K.P.; Supervision, S.H.N. and C.Y. All authors have read and agreed to the published version of the manuscript.

Funding

This research was supported by the Singapore Institute of Manufacturing Technology (SIMTech) under the Agency for Science, Technology, and Research (A*STAR), Singapore and the Ministry of Education of Singapore under Tier 2 Grant No. MOE2016-T2-1-114.

Conflicts of Interest

The authors declare no conflict of interest.

References

  1. Chang, D. Guide to Electroporation and Electrofusion; Academic Press: Cambridge, MA, USA, 1991. [Google Scholar]
  2. Chu, G.; Hayakawa, H.; Berg, P. Electroporation for the efficient transfection of mammalian cells with DNA. Nucleic Acids Res. 1987, 15, 1311–1326. [Google Scholar] [CrossRef] [PubMed] [Green Version]
  3. Jordan, C.A.; Neumann, E.; Sowers, A.E. Electroporation and Electrofusion in Cell Biology; Springer Science & Business Media: Berlin/Heidelberg, Germany, 2013. [Google Scholar]
  4. Geng, T.; Lu, C. Microfluidic electroporation for cellular analysis and delivery. Lab Chip 2013, 13, 3803–3821. [Google Scholar] [CrossRef] [PubMed]
  5. Weaver, J.C.; Chizmadzhev, Y.A. Theory of electroporation: A review. Bioelectrochem. Bioenerg. 1996, 41, 135–160. [Google Scholar] [CrossRef]
  6. Chang, L.; Li, L.; Shi, J.; Sheng, Y.; Lu, W.; Gallego-Perez, D.; Lee, L.J. Micro-/nanoscale electroporation. Lab Chip 2016, 16, 4047–4062. [Google Scholar] [CrossRef] [PubMed]
  7. Santra, T.; Tseng, F. Recent trends on micro/nanofluidic single cell electroporation. Micromachines 2013, 4, 333–356. [Google Scholar] [CrossRef] [Green Version]
  8. Hsu, P.D.; Lander, E.S.; Zhang, F. Development and applications of crispr-cas9 for genome engineering. Cell 2014, 157, 1262–1278. [Google Scholar] [CrossRef] [PubMed] [Green Version]
  9. Doudna, J.A.; Charpentier, E. The new frontier of genome engineering with crispr-cas9. Science 2014, 346, 1258096. [Google Scholar] [CrossRef]
  10. Buganim, Y.; Faddah, D.A.; Jaenisch, R. Mechanisms and models of somatic cell reprogramming. Nat. Rev. Genet. 2013, 14, 427–439. [Google Scholar] [CrossRef] [Green Version]
  11. Golberg, A.; Fischer, J.; Rubinsky, B. The use of irreversible electroporation in food preservation. In Irreversible Electroporation; Springer: Berlin/Heidelberg, Germany, 2010; pp. 273–312. [Google Scholar]
  12. Griffiths, M.; Walkling-Ribeiro, M. Microbial decontamination of milk and dairy products. In Microbial Decontamination in the Food Industry; Elsevier: Amsterdam, The Netherlands, 2012; pp. 190–238. [Google Scholar]
  13. Puértolas, E.; López, N.; Condón, S.; Raso, J.; Álvarez, I. Pulsed electric fields inactivation of wine spoilage yeast and bacteria. Int. J. Food Microbiol. 2009, 130, 49–55. [Google Scholar] [CrossRef]
  14. Mahnič-Kalamiza, S.; Vorobiev, E.; Miklavčič, D. Electroporation in food processing and biorefinery. J. Membr. Biol. 2014, 247, 1279–1304. [Google Scholar] [CrossRef]
  15. Huo, Z.-Y.; Xie, X.; Yu, T.; Lu, Y.; Feng, C.; Hu, H.-Y. Nanowire-modified three-dimensional electrode enabling low-voltage electroporation for water disinfection. Environ. Sci. Technol. 2016, 50, 7641–7649. [Google Scholar] [CrossRef] [PubMed] [Green Version]
  16. Huo, Z.-Y.; Zhou, J.-F.; Wu, Y.; Wu, Y.-H.; Liu, H.; Liu, N.; Hu, H.-Y.; Xie, X. A cu 3 p nanowire enabling high-efficiency, reliable, and energy-efficient low-voltage electroporation-inactivation of pathogens in water. J. Mater. Chem. A 2018, 6, 18813–18820. [Google Scholar] [CrossRef]
  17. Liu, C.; Xie, X.; Zhao, W.; Liu, N.; Maraccini, P.A.; Sassoubre, L.M.; Boehm, A.B.; Cui, Y. Conducting nanosponge electroporation for affordable and high-efficiency disinfection of bacteria and viruses in water. Nano Lett. 2013, 13, 4288–4293. [Google Scholar] [CrossRef] [PubMed]
  18. Lin, Y.-C.; Huang, M.-Y. Electroporation microchips for in vitro gene transfection. J. Micromech. Microeng. 2001, 11, 542. [Google Scholar] [CrossRef]
  19. Lin, Y.-C.; Li, M.; Fan, C.-S.; Wu, L.-W. A microchip for electroporation of primary endothelial cells. Sens. Actuators A Phys. 2003, 108, 12–19. [Google Scholar] [CrossRef]
  20. Lu, H.; Schmidt, M.A.; Jensen, K.F. A microfluidic electroporation device for cell lysis. Lab Chip 2005, 5, 23–29. [Google Scholar] [CrossRef]
  21. De la Rosa, C.; Tilley, P.A.; Fox, J.D.; Kaler, K.V. Microfluidic device for dielectrophoresis manipulation and electrodisruption of respiratory pathogen bordetella pertussis. IEEE Trans. Biomed. Eng. 2008, 55, 2426–2432. [Google Scholar] [CrossRef]
  22. Huang, H.; Wei, Z.; Huang, Y.; Zhao, D.; Zheng, L.; Cai, T.; Wu, M.; Wang, W.; Ding, X.; Zhou, Z. An efficient and high-throughput electroporation microchip applicable for sirna delivery. Lab Chip 2011, 11, 163–172. [Google Scholar] [CrossRef]
  23. Wang, T.; Chen, H.; Yu, C.; Xie, X. Rapid determination of the electroporation threshold for bacteria inactivation using a lab-on-a-chip platform. Environ. Int. 2019, 132, 105040. [Google Scholar] [CrossRef]
  24. Lu, K.-Y.; Wo, A.M.; Lo, Y.-J.; Chen, K.-C.; Lin, C.-M.; Yang, C.-R. Three dimensional electrode array for cell lysis via electroporation. Biosens. Bioelectron. 2006, 22, 568–574. [Google Scholar] [CrossRef]
  25. Huang, D.; Zhao, D.; Li, J.; Wu, Y.; Zhou, W.; Wang, W.; Liang, Z.; Li, Z. High cell viability microfluidic electroporation in a curved channel. Sens. Actuators B Chem. 2017, 250, 703–711. [Google Scholar] [CrossRef]
  26. Wang, H.-Y.; Lu, C. Electroporation of mammalian cells in a microfluidic channel with geometric variation. Anal. Chem. 2006, 78, 5158–5164. [Google Scholar] [CrossRef] [PubMed]
  27. Kim, M.-J.; Kim, T.; Cho, Y.-H. Cell electroporation chip using multiple electric field zones in a single channel. Appl. Phys. Lett. 2012, 101, 223705. [Google Scholar] [CrossRef] [Green Version]
  28. Kim, M.-J.; Kim, T.; Doh, I.; Cho, Y.-H. A cell electroporation characterization chip using a single tapered channel for continuous electric field variation. BioChip J. 2014, 8, 269–274. [Google Scholar] [CrossRef]
  29. Garcia, P.A.; Ge, Z.; Kelley, L.E.; Holcomb, S.J.; Buie, C.R. High efficiency hydrodynamic bacterial electrotransformation. Lab Chip 2017, 17, 490–500. [Google Scholar] [CrossRef]
  30. Garcia, P.A.; Ge, Z.; Moran, J.L.; Buie, C.R. Microfluidic screening of electric fields for electroporation. Sci. Rep. 2016, 6, 21238. [Google Scholar] [CrossRef] [Green Version]
  31. Church, C.; Zhu, J.; Huang, G.; Tzeng, T.-R.; Xuan, X. Integrated electrical concentration and lysis of cells in a microfluidic chip. Biomicrofluidics 2010, 4, 044101. [Google Scholar] [CrossRef] [Green Version]
  32. Gallo-Villanueva, R.C.; Jesús-Pérez, N.M.; Martínez-López, J.I.; Pacheco, A.; Lapizco-Encinas, B.H. Assessment of microalgae viability employing insulator-based dielectrophoresis. Microfluid. Nanofluid. 2011, 10, 1305–1315. [Google Scholar] [CrossRef]
  33. Gallo-Villanueva, R.C.; Perez-Gonzalez, V.H.; Cardenas-Benitez, B.; Jind, B.; Martinez-Chapa, S.O.; Lapizco-Encinas, B.H. Joule heating effects in optimized insulator-based dielectrophoretic devices: An interplay between post geometry and temperature rise. Electrophoresis 2019, 40, 1408–1416. [Google Scholar] [CrossRef]
  34. Sano, M.B.; Gallo-Villanueva, R.C.; Lapizco-Encinas, B.H.; Davalos, R.V. Simultaneous electrokinetic flow and dielectrophoretic trapping using perpendicular static and dynamic electric fields. Microfluid. Nanofluid. 2013, 15, 599–609. [Google Scholar] [CrossRef]
  35. Pudasaini, S.; Perera, A.; Das, D.; Ng, S.H.; Yang, C. Continuous flow microfluidic cell inactivation with use of insulating micropillars for multiple electroporation zones. Electrophoresis 2019, 40, 2522–2529. [Google Scholar] [CrossRef] [PubMed]
  36. Kissinga, H.D.; Mwombeki, F.; Said, K.; Katakweba, A.A.; Nonga, H.E.; Muhairwa, A.P. Antibiotic susceptibilities of indicator bacteria escherichia coli and enterococci spp. Isolated from ducks in morogoro municipality, tanzania. BMC Res. Notes 2018, 11, 87. [Google Scholar] [CrossRef] [PubMed] [Green Version]
  37. Worley-Morse, T.; Mann, M.; Khunjar, W.; Olabode, L.; Gonzalez, R. Evaluating the fate of bacterial indicators, viral indicators, and viruses in water resource recovery facilities. Water Environ. Res. 2019, 91, 830–842. [Google Scholar] [CrossRef] [PubMed]
  38. Xuan, X.; Xu, B.; Sinton, D.; Li, D. Electroosmotic flow with joule heating effects. Lab Chip 2004, 4, 230–236. [Google Scholar] [CrossRef]
  39. Barz, D.P.; Ehrhard, P. Model and verification of electrokinetic flow and transport in a micro-electrophoresis device. Lab Chip 2005, 5, 949–958. [Google Scholar] [CrossRef]
  40. Tandon, V.; Bhagavatula, S.K.; Nelson, W.C.; Kirby, B.J. Zeta potential and electroosmotic mobility in microfluidic devices fabricated from hydrophobic polymers: 1. The origins of charge. Electrophoresis 2008, 29, 1092–1101. [Google Scholar] [CrossRef]
  41. Hyoung Kang, K.; Xuan, X.; Kang, Y.; Li, D. Effects of dc-dielectrophoretic force on particle trajectories in microchannels. J. Appl. Phys. 2006, 99, 064702. [Google Scholar] [CrossRef] [Green Version]
  42. Tsong, T.Y. Electroporation of cell membranes. Biophys. J. 1991, 60, 297–306. [Google Scholar] [CrossRef] [Green Version]
  43. Grahl, T.; Märkl, H. Killing of microorganisms by pulsed electric fields. Appl. Microbiol. Biotechnol. 1996, 45, 148–157. [Google Scholar] [CrossRef]
  44. Zimmermann, U.; Pilwat, G.; Riemann, F. Dielectric breakdown of cell membranes. Biophys. J. 1974, 14, 881–899. [Google Scholar] [CrossRef] [Green Version]
  45. Movahed, S.; Li, D. Microfluidics cell electroporation. Microfluid. Nanofluid. 2011, 10, 703–734. [Google Scholar] [CrossRef]
  46. Pucihar, G.; Kotnik, T.; Kandušer, M.; Miklavčič, D. The influence of medium conductivity on electropermeabilization and survival of cells in vitro. Bioelectrochemistry 2001, 54, 107–115. [Google Scholar] [CrossRef]
  47. Liu, C.; Xie, X.; Zhao, W.; Yao, J.; Kong, D.; Boehm, A.B.; Cui, Y. Static electricity powered copper oxide nanowire microbicidal electroporation for water disinfection. Nano Lett. 2014, 14, 5603–5608. [Google Scholar] [CrossRef] [PubMed]
  48. Keyser, M.; Műller, I.A.; Cilliers, F.P.; Nel, W.; Gouws, P.A. Ultraviolet radiation as a non-thermal treatment for the inactivation of microorganisms in fruit juice. Innov. Food Sci. Emerg. Technol. 2008, 9, 348–354. [Google Scholar] [CrossRef]
  49. Rhodes, M.J. Introduction to Particle Technology; John Wiley & Sons: Hobken, NJ, USA, 2008. [Google Scholar]
  50. Bai, M.; Zhang, Z.; Zhang, N.; Tian, Y.; Chen, C.; Meng, X. Treatment of 250 t/h ballast water in oceanic ships using·oh radicals based on strong electric-field discharge. Plasma Chem. Plasma Process. 2012, 32, 693–702. [Google Scholar] [CrossRef]
  51. Huo, Z.-Y.; Luo, Y.; Xie, X.; Feng, C.; Jiang, K.; Wang, J.; Hu, H.-Y. Carbon-nanotube sponges enabling highly efficient and reliable cell inactivation by low-voltage electroporation. Environ. Sci. Nano 2017, 4, 2010–2017. [Google Scholar] [CrossRef]
  52. Tsong, T.Y. Electroporation of cell membranes. In Electroporation and Electrofusion in Cell Biology; Springer: Berlin/Heidelberg, Germany, 1989; pp. 149–163. [Google Scholar]
  53. Mernier, G.; Piacentini, N.; Braschler, T.; Demierre, N.; Renaud, P. Continuous-flow electrical lysis device with integrated control by dielectrophoretic cell sorting. Lab Chip 2010, 10, 2077–2082. [Google Scholar] [CrossRef] [Green Version]
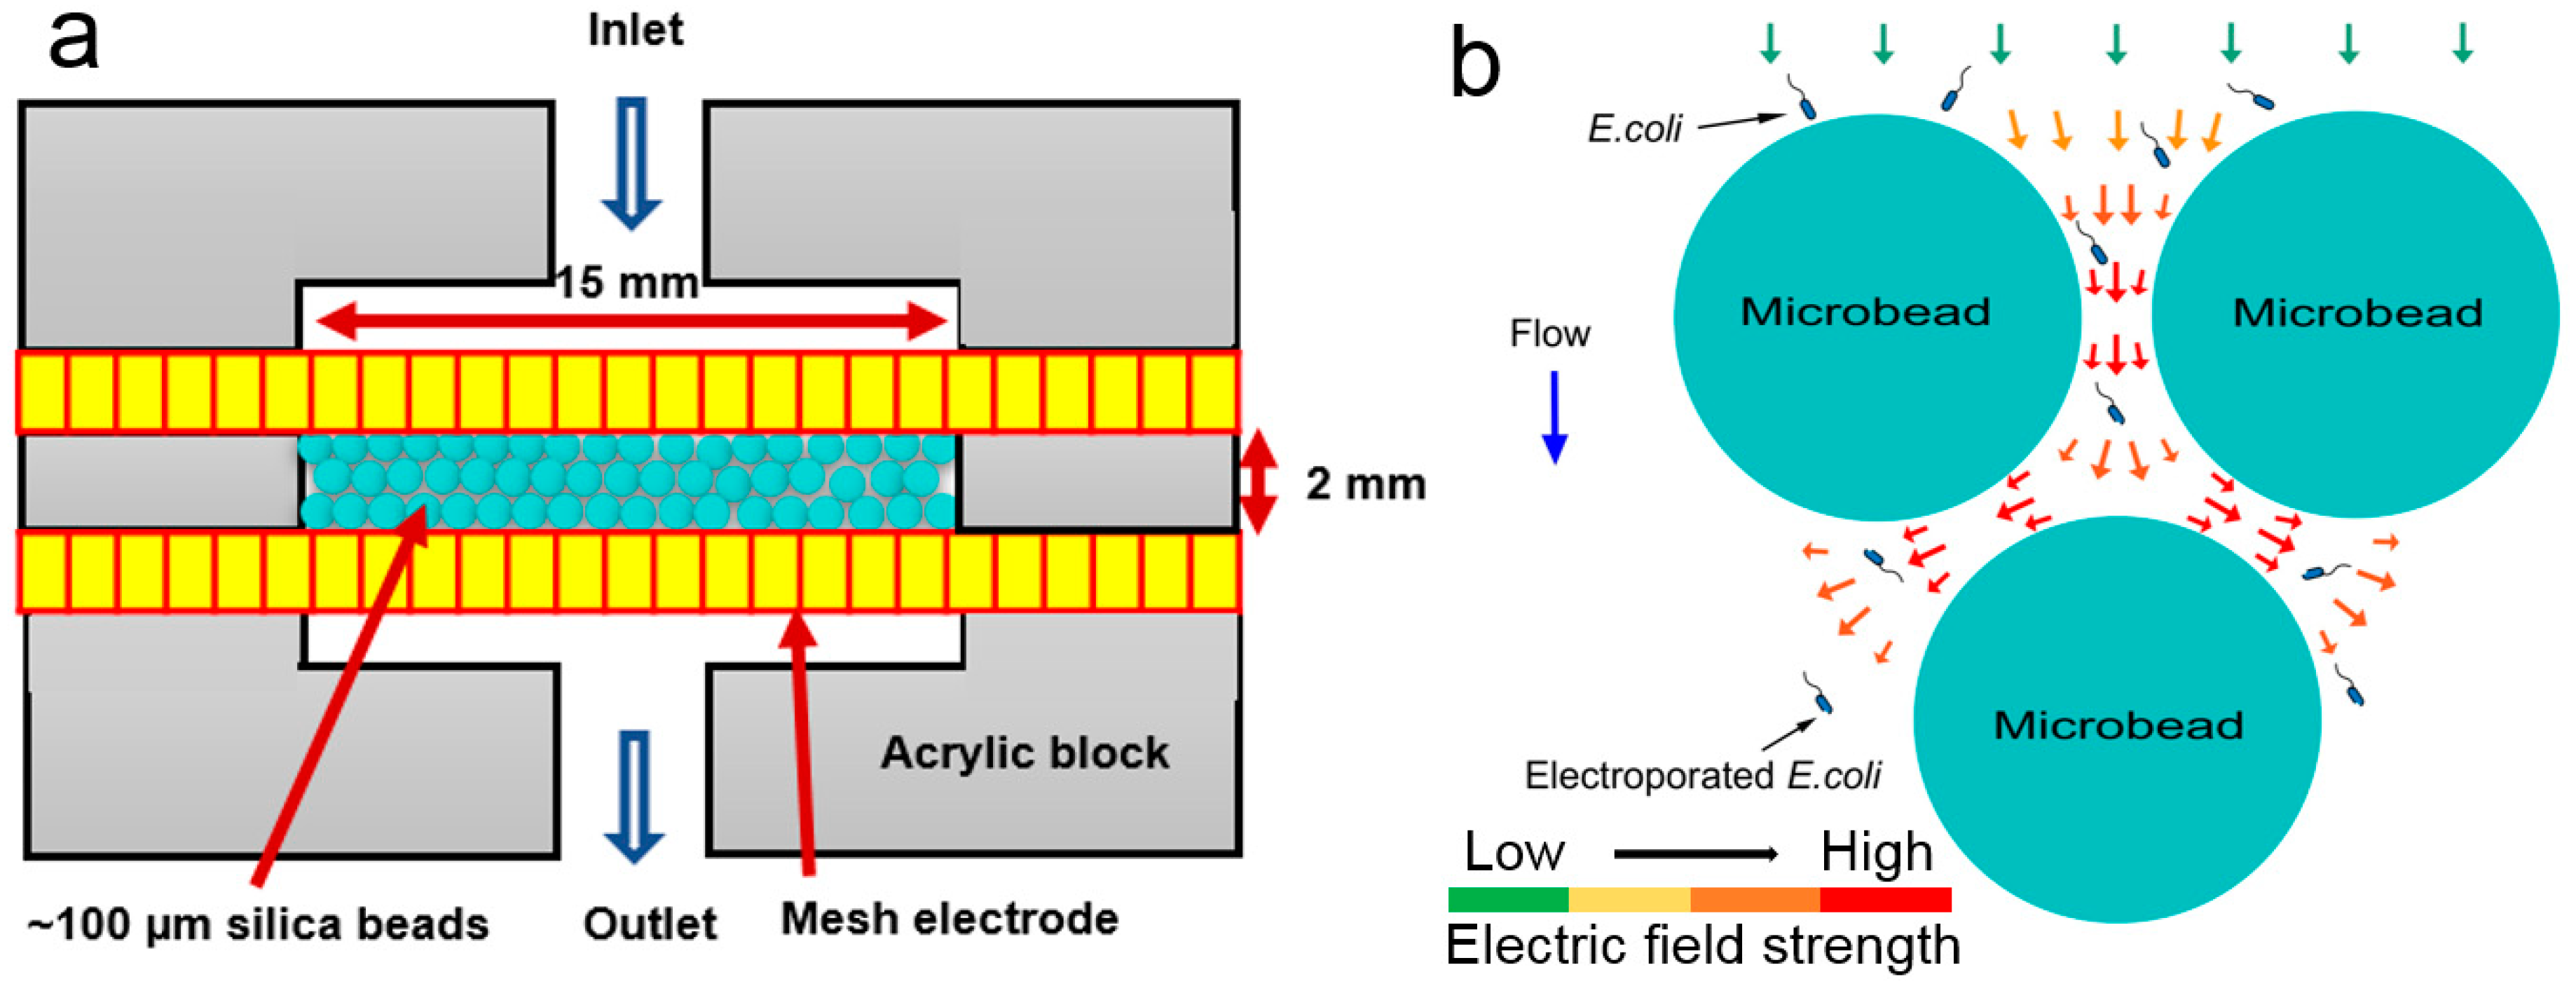
Figure 1. Design of a packed bead structure device for bacterial inactivation: (a) Schematic of the electroporation-based treatment device wherein 100 μm silica beads are packed inside a 2 mm hole in between two mesh electrodes (aperture = 50 μm). These mesh electrodes are sputtered with 25/400 nm Cr/Au; (b) Schematic illustration of the working principle of our device.
Inventions 05 00002 g001
Figure 2. Numerical simulation workflow: (a) Computer-aided design (CAD) design of the packed bead structure; (b) Development of a unit cell model using three beads; (c) Creation of the simulation domain in COMSOL; (d) Meshing and boundary conditions (BCs).
Inventions 05 00002 g002
Figure 3. Distributions of electric field strength using COMSOL simulation for the device with beads under an applied voltage of 40 V (equivalent to an applied field strength of 2 kV/cm). Nonuniform distribution of electric field is achieved by using insulating beads. (a) Side and (b) top view are presented. Surface plots representing the distributions of electric field under various DC voltages. (c) Comparison of the induced electric field strength and (d) comparison of the induced transmembrane potential (TMP) for two devices: one with beads and the other without beads.
Inventions 05 00002 g003
Figure 4. Comparison of bacterial inactivation performance with beads and no beads for an applied field strength of 2 kV/cm at a flowrate of 4 mL/min. Quantification of colony-forming units (CFU) was carried out using a standard spread plate counting method. p = 0.0002, using Student’s t-test. Three asterisks represent p ≤ 0.001.
Inventions 05 00002 g004
Figure 5. Bacterial inactivation performance: Log removal of E. coli and E. faecalis concentration obtained for various applied electric field strengths at a flowrate of 4 mL/min; (a) for DC electric field and (b) for AC electric field.
Inventions 05 00002 g005
Figure 6. (a) Inactivation performance of E.coli versus frequency with an applied AC field strength of 1.5 kV/cm; (b) Transmembrane potential caused by electric field strength of 1.5 kV/cm at various frequencies.
Inventions 05 00002 g006