Article

Determining Information Security Threats for an IoT-Based Energy Internet by Adopting Software Engineering and Risk Management Approaches

Department of Information Management, National United University, Miaoli 36003, Taiwan
*
Author to whom correspondence should be addressed.
Inventions 2019, 4(3), 53; https://doi.org/10.3390/inventions4030053
Submission received: 5 July 2019 / Revised: 25 August 2019 / Accepted: 3 September 2019 / Published: 11 September 2019
(This article belongs to the Special Issue IoT and Energy Internet)

Abstract

:
This paper introduces an information security threat modeling (ISTM) scheme, which leverages the strengths of software engineering and risk management approaches, called I-SERM. The proposed I-SERM scheme effectively and efficiently prioritizes information security threats for IT systems that utilize a large number of sensors, such as Internet of Things (IoT)-based energy systems. I-SERM operations include determining functional components, identifying associated threat types, analyzing threat items, and prioritizing key threats with the use of software engineering tools such as product flow diagrams, use case diagrams, and data flow diagrams. By simultaneously referring to a proposed STRIDE+p matrix and a defined threat breakdown structure with reference score (TBS+r) scheme, the I-SERM approach enables systematic ISTM. To demonstrate the usability of I-SERM, this study presents a practical case aimed at electricity load balancing on a smart grid. In brief, this study indicates a substantive research direction that combines the advantages of software engineering and risk management into a systematic ISTM process. In addition, the demonstration of I-SERM in practice provides a valuable and practical reference for I-SERM application, and contributes to research in the field of information security designs for IoT-based Energy Internet systems.

1. Introduction

With the development of information and communications technology (ICT), ICT-enabled applications significantly impact not only our daily lives, but also business profits. However, if an ICT application is attacked due to vulnerability, the consequences can be significant, which directly affect associated human activities and cause accompanying harm. As the saying goes, prevention is better than cure, and the total cost of preventive disposal or innate improvement is usually less than that of problem elimination. Thus, determining information security threats (ISTs) in advance, such as, in the system analysis phase of the system development life cycle (SDLC), will be more helpful than carrying out remedial mechanisms to protect against attacks in real-time.
Identifying, enumerating, and prioritizing potential threats or structural vulnerabilities is commonly referred to as information security threat modeling (ISTM). An attack is an event that is happening, whereas a threat is a risk that is associated with an attack which has not yet occurred. The success of ISTM depends on how effectively it can identify ISTs, assess the risk level of ISTs, and confirm key ISTs that should be managed for prevention or recovery-ready actions. In cases like large-scale Energy Internet systems, for example, an Internet of Things (IoT)-based smart grid, ISTM becomes very complicated due to the large number of devices, components, and sensors involved. Accordingly, systematically assessing the risk of possible ISTs, understanding the relationships between ISTs, and taking the considerable remedial actions required are important steps that should be taken based on both theoretical and pragmatic consideration.
The IoT has become a mainstream of ICT-based technology enabling smarter applications in the fields of facility monitoring and process management (i.e., Industry 4.0), medical areas, etc. IoT technology also makes possible the construction of smart power systems with intelligent energy management applications. Pan et al. [1] designed and implemented an IoT framework for smart energy functions in buildings. Marinakis and Doukas [2] also emphasized the enhancement of IoT-enabled intelligent energy management in buildings. In addition, Ejaz et al. [3] discussed the issue of how to adopt IoT technology to provide efficient energy management in smart cities. Noor-A-Rahim et al. [4] proposed an IoT-based framework to provide reliable communications between renewable energy facilities, remote IoT components, and control centers. These articles indicate that complex IoT-supported systems like smart buildings or cities, with many factors affecting the total energy consumption in different energy application scenarios, have been the focus of much Energy Internet research.
Electricity is undoubtedly an indispensable form of energy for modern society. With the trend of rapid urbanization, people have become highly dependent on their use of electricity. As a result, the stability and reliability of the power supply plays a critical role in the operation of modern power systems. In addition to relying on the effective operation of power equipment, an ICT-supported infrastructure platform capable of supervisory control and data acquisition (SCADA) for power system operations, as well as data exchange and information access for power management, is required. When such infrastructure is extended to an Internet platform, it is referred to as the Energy Internet. The Energy Internet is a new energy platform that transforms legacy power systems into Internet-based innovative systems that change the way people generate, distribute, and consume electrical energy. While the Energy Internet has the potential to transform electrical grid infrastructure, it also faces the challenge of ISTM concerns.
In recent decades, the maturity of software engineering (SE) has brought about rapid growth in the quantity and quality of software systems. SE methods provide stable, effective, yet elastic benefits for system analysis, design, and even implementation and testing. If the strength of SE can be applied in ISTM, i.e., if ISTM is considered as partially an SE process, through a systematic stepwise process, it may contribute to academic research and practical applications in the field of ISTM engineering. In addition to the maturity of SE implementation, the consideration of risk issues for system development is receiving more emphasis in software project management. Risk assessment and management approaches are applied to provide useful clues in response to inspecting and prioritizing security threats, and therefore enhance ISTM operations.
According to Zhou et al. [5], the Energy Internet is an extended energy ecosystem based on the smart grid (SG) platform. The promotion of SGs has been global, and tries to use the advantages of ICT to provide smarter power management applications in traditional power systems [6]. A novel SG deployment involving advanced metering infrastructure (AMI) and a SCADA system has been designed to efficiently manage the information associated with power generation and electricity consumption by delivering advanced functions of electricity utilization and energy management. Based on this concept, SG operations must cover real-time data collection between the electricity producer and the consumer [6] and can, therefore, offer immediate access to information and deliver better availability of information analysis than traditional power systems. Unfortunately, such availability of open access data gives rise to numerous ISTs that may limit the performance and reliability of SG operations.
ISTs from open networking environments have the ability to crash entire systems [7]. In 2015 and 2017, the Ukrainian power grid was damaged by malicious software, resulting in a large-scale blackout [8,9]. In 2016, the Israel Public Utility Authority for Electricity was hacked by cyber-attacks and was forced to shut down infected power facilities [10]. The above events demonstrate that even a small IST in a SG has potential to cause huge losses. Therefore, establishing ISTM for SG applications will help identify software and hardware assets that need to be protected [11]. Moreover, a useful ISTM method can also help determine key ISTs during the SDLC analysis and design phases and provide an opportunity to pre-establish corresponding security precautions against possible attacks to ensure the information security of the SG. In practice, the information security problems that an IoT-based system, for example an SG, has to face include attacks from the Internet [7]. Identifying potential threats which could damage the valuable software and hardware assets of a system (or an organization) is a challenging issue in the process of designing an IoT-based system.
Based on the above, finding a way to systematically carry out ISTM for large-scale Energy Internet systems is an essential issue worthy of investigation. This study proposes an approach which can effectively and efficiently perform ISTM for complex systems, such as an SG with many kinds of components on a traditional power system, AMI, and SCADA. To this end, this study combines the mature technology of software engineering and a risk assessment mechanism to develop a novel ISTM method, I-SERM. In the next section, published literature associated with the design of the proposed I-SERM is reviewed. Section 3 introduces the details of the I-SERM process, a STRIDE+p matrix, a threat breakdown structure with reference score (TBS+r) scheme, and a risk management mechanism for assessing and prioritizing ISTs. In order to evaluate the operational feasibility of the I-SERM, an SG application for load balancing of electricity is demonstrated in Section 4. Finally, this paper concludes with remarks regarding future study in the last section.

2. Literature Review

2.1. Threat Model

According to Olivoa et al. [12], a threat model is a feature set of the attacker’s strategy. In theory, a threat model should describe the capabilities of the attacker as well as identify the threats, based on the anticipated security requirements [13]. In practice, a threat model can be formed in different ways. For example, Opdahl and Sindre [14] compared two threat analysis methods, the misuse case diagram and the attack tree, and indicated that the attack tree model was able to describe more details of the threats than the misuse case diagram. In brief, an attack tree represents attacks in the form of a tree structure [15]. The root of the tree indicates the main event of potential attacks, and it then downlinks to leaf nodes which represent extended attacks (events) [16].
It is useful to describe ISTs in a well-formulated form such as an attack tree, but care must also be taken with how the contents of ISTs are determined. In practice, most ISTM operations, including constructing an attack tree, should rely significantly on the expertise of domain experts who are skilled in the target system and information security theories. This implies a question as to whether systematic/modular modeling methods will benefit ISTM modeling. And, if the answer is yes, how should a comprehensive ISTM process for the modeling methods be formulated? Wuyts et al. [17] proposed a privacy-centric threat modeling approach that leverages the traditional data flow diagram (DFD), as well as a new threat classification mechanism LINDDUN, which can help analysts to identify seven high-level threat types: Linkability, Identifiability, Non-repudiation, Detectability, information Disclosure, content Unawareness, and policy and consent Non-compliance through a six-step process.
Similarly, the STRIDE [18,19] method based on its STRIDE security threat classification mechanism categorizes threats into six types: Spoofing [20], Tampering, Repudiation [21], Information disclosure, Denial of service [22], and Elevation of privilege [23]. The stepwise process of STRIDE was designed in accordance with the Secure Development Lifecycle (SDL) [24], and it also uses DFD and a threat classification mapping scheme as tools to perform ISTM operations.
Although LINDDUN and STRIDE have demonstrated their ISTM capabilities, whether these approaches are able to derive DFD for a wide variety of functional components from a large and complex information system such as an SG remains to be seen. In addition, if there is a need to determine which key threats are priorities for attention, due to concerns around available resources, it is important that a more objective and effective ISTM threat assessment be developed.

2.2. Smart Grid (SG)

Nafi at al. [25] define an SG as an electric network able to intelligently access data related to actions from power generation to electricity consumption. As Rahman et al. [26] noted, an SG has the potential to provide innovative and efficient energy management with high reliability. In addition, according to [6,27], an SG is a type of modern grid infrastructure that may introduce renewable energy sources, and combine automation and communication technologies to improve the efficiency, reliability, and safety of a power system. Furthermore, Gharavi and Ghafurian [28], as well as Delgado-Gomes et al. [29], stress that the primary feature of an SG is to apply ICT and computational intelligence to gather, record, and analyze electricity-related information from power generation, transmission and distribution, to consumption.
In addition to providing efficient data access, an SG must consider innovative energy management with high reliability. Therefore, some new SG frameworks have introduced SCADA to carry out the functions of effective monitoring and status assessment by using various types of equipment and sensors [30]. The advantage of SCADA is its supervisory control and data collection for commonly used livelihood infrastructure and industrial systems such as hydraulic systems, power generation systems. The trend of SCADA development is to integrate ICT-enabled operations into an industrialized control system. As to the ICT-enabled operations for SCADA, they are commonly allocated to such functions as monitoring [31], managing power generation, and transmission and distribution of information [32]. SCADA can be structurally organized for better deployment; Keith et al. [33] suggest that SCADA be divided into a control center, a wide area network, and a field site. A control center is mainly composed of a human machine interface (HMI), engineering workstations, control servers, data historians, and communication routers. Its functions involve supervising the status of equipment, controlling execution procedures, and extracting information from monitored devices. The supervised equipment and the monitored devices include a remote terminal unit (RTU), a programmable logic controller (PLC), and intelligent electronic devices (IED). The wide area network is responsible for the data communications among the cross-regional networks in SCADA. The primary task of the field site is to collect and transfer the on-site data to the control center. Most traditional SCADA systems rely on concealed security; however, nowadays, due to its combination with the Internet, the information security of SCADA is facing great challenges [15,32,34,35,36].
In addition to the operations of traditional power systems and SCADA-enabled functions, the new SG should cover the provision of data access and management directly for end-users. To this end, an AMI system capable of improving the data management for the demand side [37] plays an essential role. As defined by Rahman et al. [26], an AMI is an advanced solid–state electronic instrument that can collect time-based electricity data for further information analysis and power management. In addition to enabling end-users to query the Meter Data Management System (MDMS) for power usage data through the network, the AMI can also perform demand-side power management, which helps to intelligently monitor peak power consumption, adjust the power transmission and distribution plan, and avoid abnormal loads [37,38,39]. The AMI-supported data can be stored in the MDMS and analyzed to serve electricity-related management services such as pricing plans, automatic meter recording, demand response, and power quality management [40]. It may also contribute to incorporating renewable energy options from the single home side to improve the overall reliability of an SG’s power source management.

2.3. SG Information Security Threats

In recent years, the industrial trend of SG development and promotion has meant that analysis of SG IST has received increasing research attention. Li et al. [41] listed four possible types of security attacks that an SG may encounter: device attacks, data attacks, privacy attacks, and network availability attacks. In addition, Skopik and Ma [42] categorized SG ISTs into a three-tiered attack zone hierarchy. The first tier contains seven potential attack actions around the smart meter; Tier 2 threats include six possible attacks against the neighborhood area network and utility; the ISTs in the third tier include six kinds of security attack that may come from outside the backend center through web applications. Their IST analysis approach provides a valuable reference in the field of zone-based ISTM for SGs.
In addition to the research listed above, some articles, such as [43], present comprehensive viewpoints on ISTM research and provide interesting survey results, however, few of them have determined specific SG threats or attacks. To date, studies considering SG-specific ISTs have gradually increased in number. Suleiman et al. [44] proposed an SG Systems Security Threat Model (SSTM) based on a SCADA and AMI-involved SG. Their SSTM for application to a Security Quality Requirements Engineering (SQUARE) method [45] identified 76 ISTs. Unfortunately, the construction of such a large-scale ISTM and whether it is necessary to confirm the priorities of these ISTs are not detailed. In practice, these questions are critical and must be further investigated. Furthermore, Langer et al. [46] discussed the information security issues of an SG that involves SCADA and AMI. The study particularly considered a risk assessment model from both conceptual and implementation perspectives. Although this process model attempts to establish an SG security model through systematic steps, it only points out the functional requirements of SG security, and lacks the necessary assessment for those security threats.

2.4. Risk Management

According to Olivoa et al. [12], a threat should be estimated by its likelihood and consequent impact, and therefore, a risk management approach capable of estimating the impact and likelihood of risk items [47] may worth including in ISTM development. According to Hubbard [48], risk management is a process of risk identification, evaluation, and prioritization in order to minimize, monitor, and control the probability or impact of unfortunate events. Clearly, the first step involved in managing risks is to discover what they are [47]. Various methods have been proposed for identifying risks, or at least for prompting questions that will help to identify risks [49,50]. Among them, the risk breakdown structure (RBS), which is a hierarchically organized depiction of identified risks arranged by category, is a frequently used risk identification tool. In practice, the RBS can significantly help almost any stakeholder to understand, and therefore be able to identify and further assess, risk.
Broadly speaking, a risk assessment is the combined effort of not only identifying and analyzing potential events which may negatively impact individuals, assets, and/or the environment but also involves making judgments on the tolerability of the risks while considering influencing factors. In brief, a risk assessment analyzes what can go wrong, how likely it is to happen, what the potential consequences are, and how tolerable the identified risk is. The resulting determination of risks according to their impact and likelihood [47] can be expressed in a quantitative or qualitative fashion. The benefit of making risk assessments is to focus management attention on those risks with the greatest probability of occurring, and those that will most damage the target if they do occur.

2.5. Review Findings

  • Constructing an ISTM through systematic steps (e.g., [17,18,19,46]) will help to improve the reliability and validity, as well as operational stability, of the ISTM process.
  • Although the DFD is a commonly used design tool, and is good at describing processes, data, and their interrelationships, the implementation of DFD should consider other supporting tools for analyzing large-scale information systems because the number of external entities and processes will increase the quantity of data flows, making the whole DFD implementation more complex. In other words, if there is no necessary confirmation or screening support, the subsequent ISTM process will be too divergent, and not easily focused.
  • The well-known categorization schemes for threat types, whether LINDDUN or STRIDE, are useful tools capable of listing threat types through accessing DFDs. However, different schemes cover different threat types—whether it is possible combine their advantages into a single scheme is an interesting issue.
  • Tools such as STRIDE can be used to analyze the DFD component in order to map the corresponding threat type but are incapable of determining more detailed IST items. In addition to introducing expert opinions (mostly using the Delphi method which is a well-known communication technique widely used for forecasting through an iterative process with a panel of experts [51,52,53] and is also a useful means of determining key factors, especially those with uncertainty [54]), the ISTM operation should consider referring to a topic-related RBS as an objective basis for discussion and corresponding ISTs.
  • When assessing ISTs for a system that contains a large number of functional components, as well as a variety of applications, it can be assumed that the number of ISTM outputs, i.e., ISTs, will be large. On the other hand, if the available resources are not sufficient to respond to all the ISTs, the way in which key ISTs are evaluated and screened for subsequent disposal is a practical problem that must be attended to. Moreover, the question of how to make a suitable arrangement between subjective expert opinions and objective information to avoid the bias of expert opinions is also an essential problem that should be solved.

3. Proposed I-SERM ISTM Approach

Based on the review findings, this study proposes a novel ISTM method leveraging the strength of the mature technology of software engineering methodology and risk management, called I-SERM. This section presents the details of the proposed I-SERM approach, including its working process, as well as the supporting approaches including a STRIDE+p matrix, a threat breakdown structure with reference score (TBS+r) scheme, and a threat assessment mechanism.

3.1. I-SERM Process

The processing steps of the I-SERM (as shown in Figure 1) and the key operating instructions are described as follows.
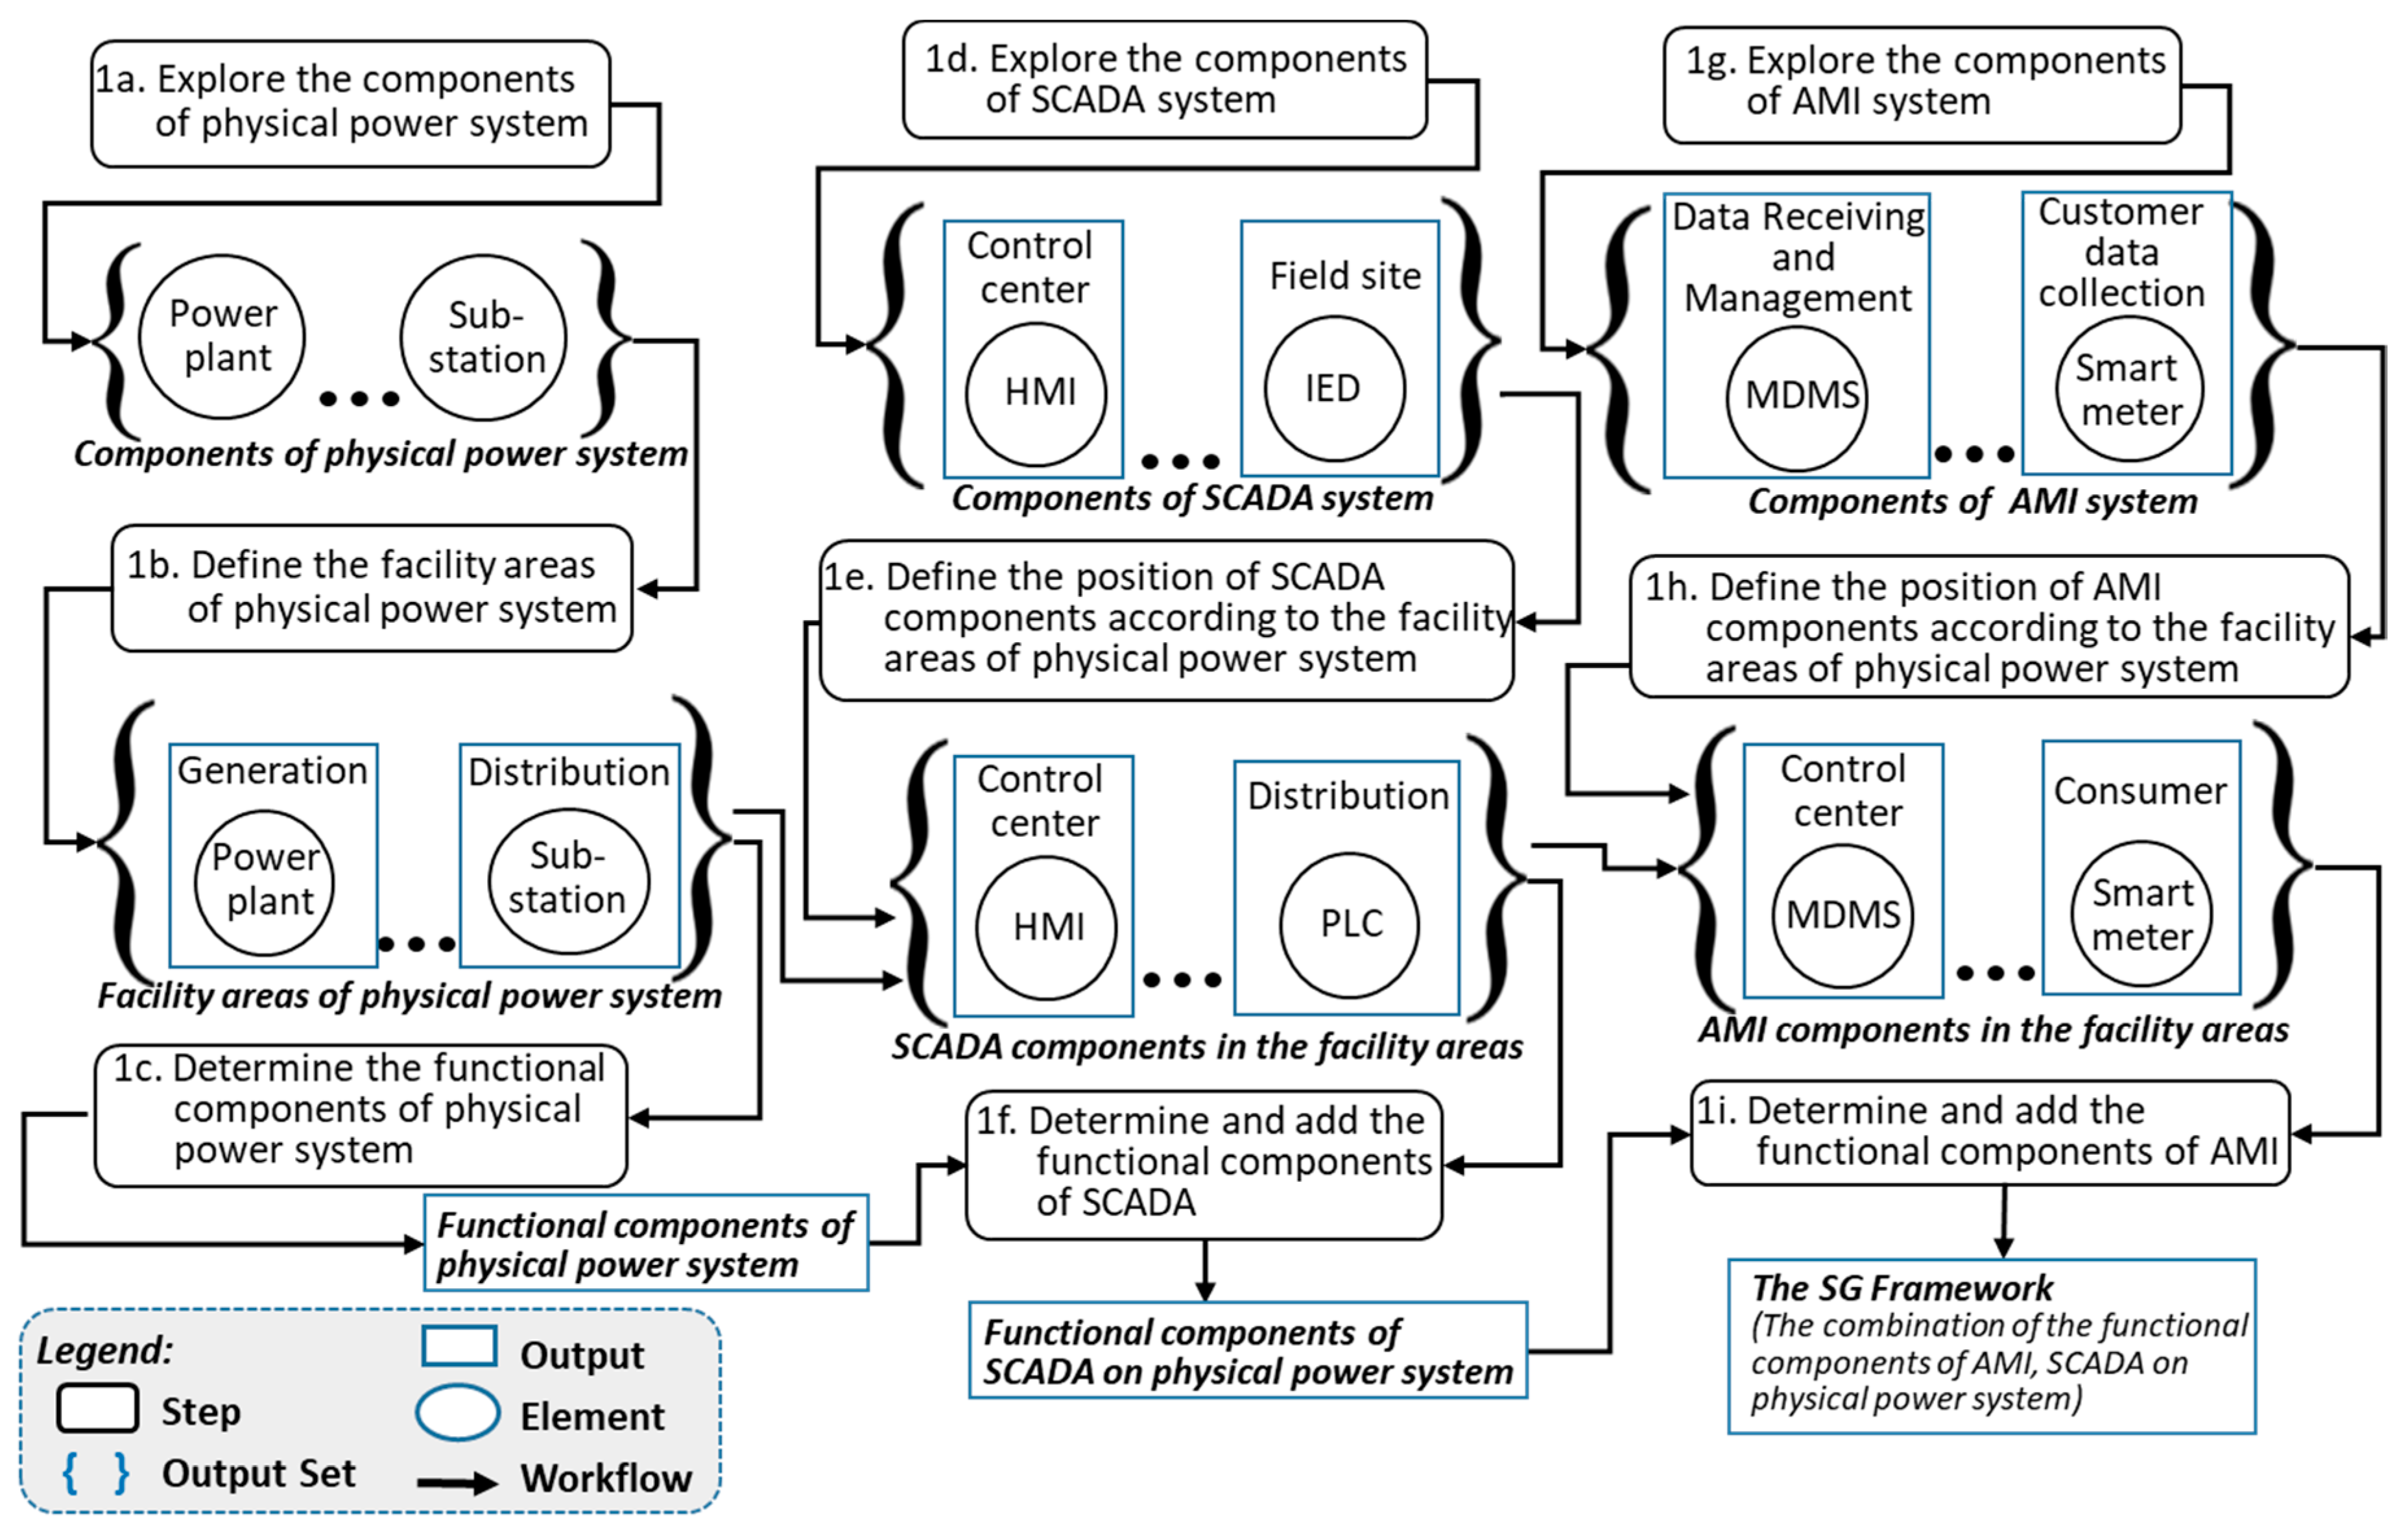
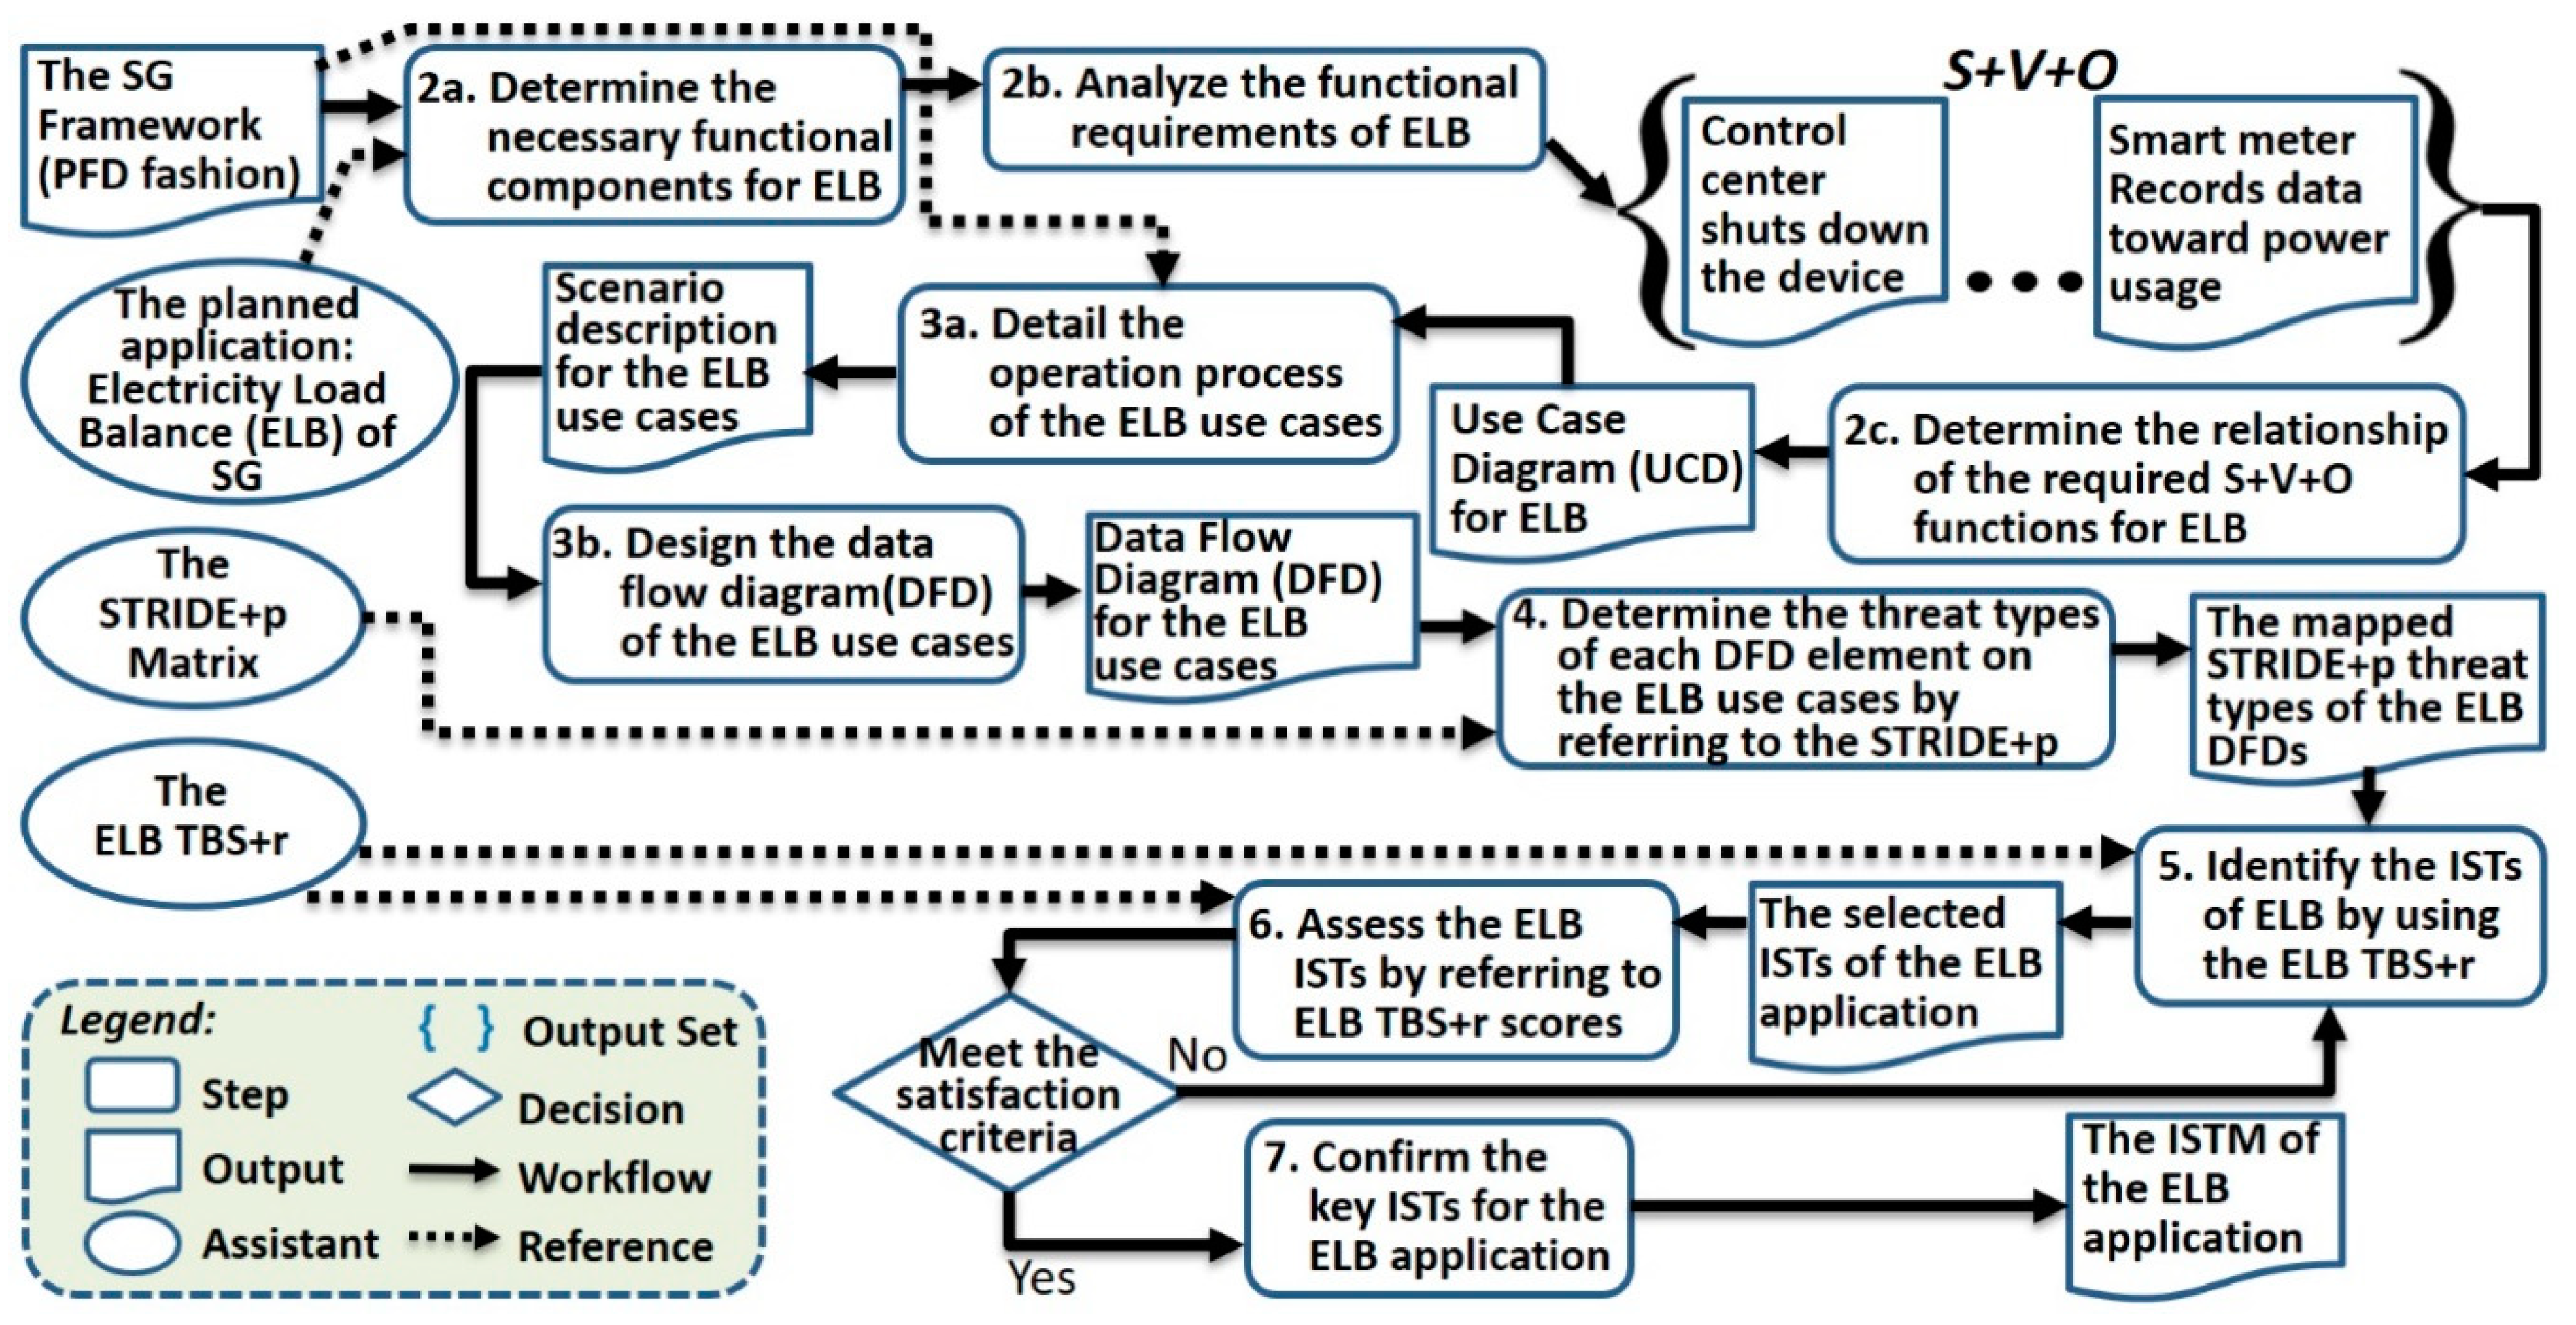
  • Identify the functional components of the target sensor system: This step performs a literature search to retrieve functional components of the target system. The result of the literature search is presented in the form of a product flow diagram (PFD), which is useful for describing the relative positions of the components and the production flows of the outputs. If required for further discussion, the definition of the involved components should be noted.
  • Analyze use cases of applications and their relationships: This step analyzes application cases and their relationships according to application requirements by referring to the associated functional components denoted in the PFD. Then, it transforms the selected application cases into a Subject, Verb, Object (S+V+O) pattern to clearly present the application cases. Next, it depicts a use case diagram (UCD).
  • Functional decomposition on the use cases: The purpose of this step is to detail the operation paths, including the exception path for each case. The methods for detailing the operation paths are scenario description and interface design by blueprint. The above functional decompositions with detailed descriptions are the essential basis for generating further DFDs.
  • Determine the threat types of each DFD element: This step determines threat types by analyzing the DFD components (including external entities, data flow, data storage, and processes) corresponding to STRIDE+p (introduced in the next sub-section).
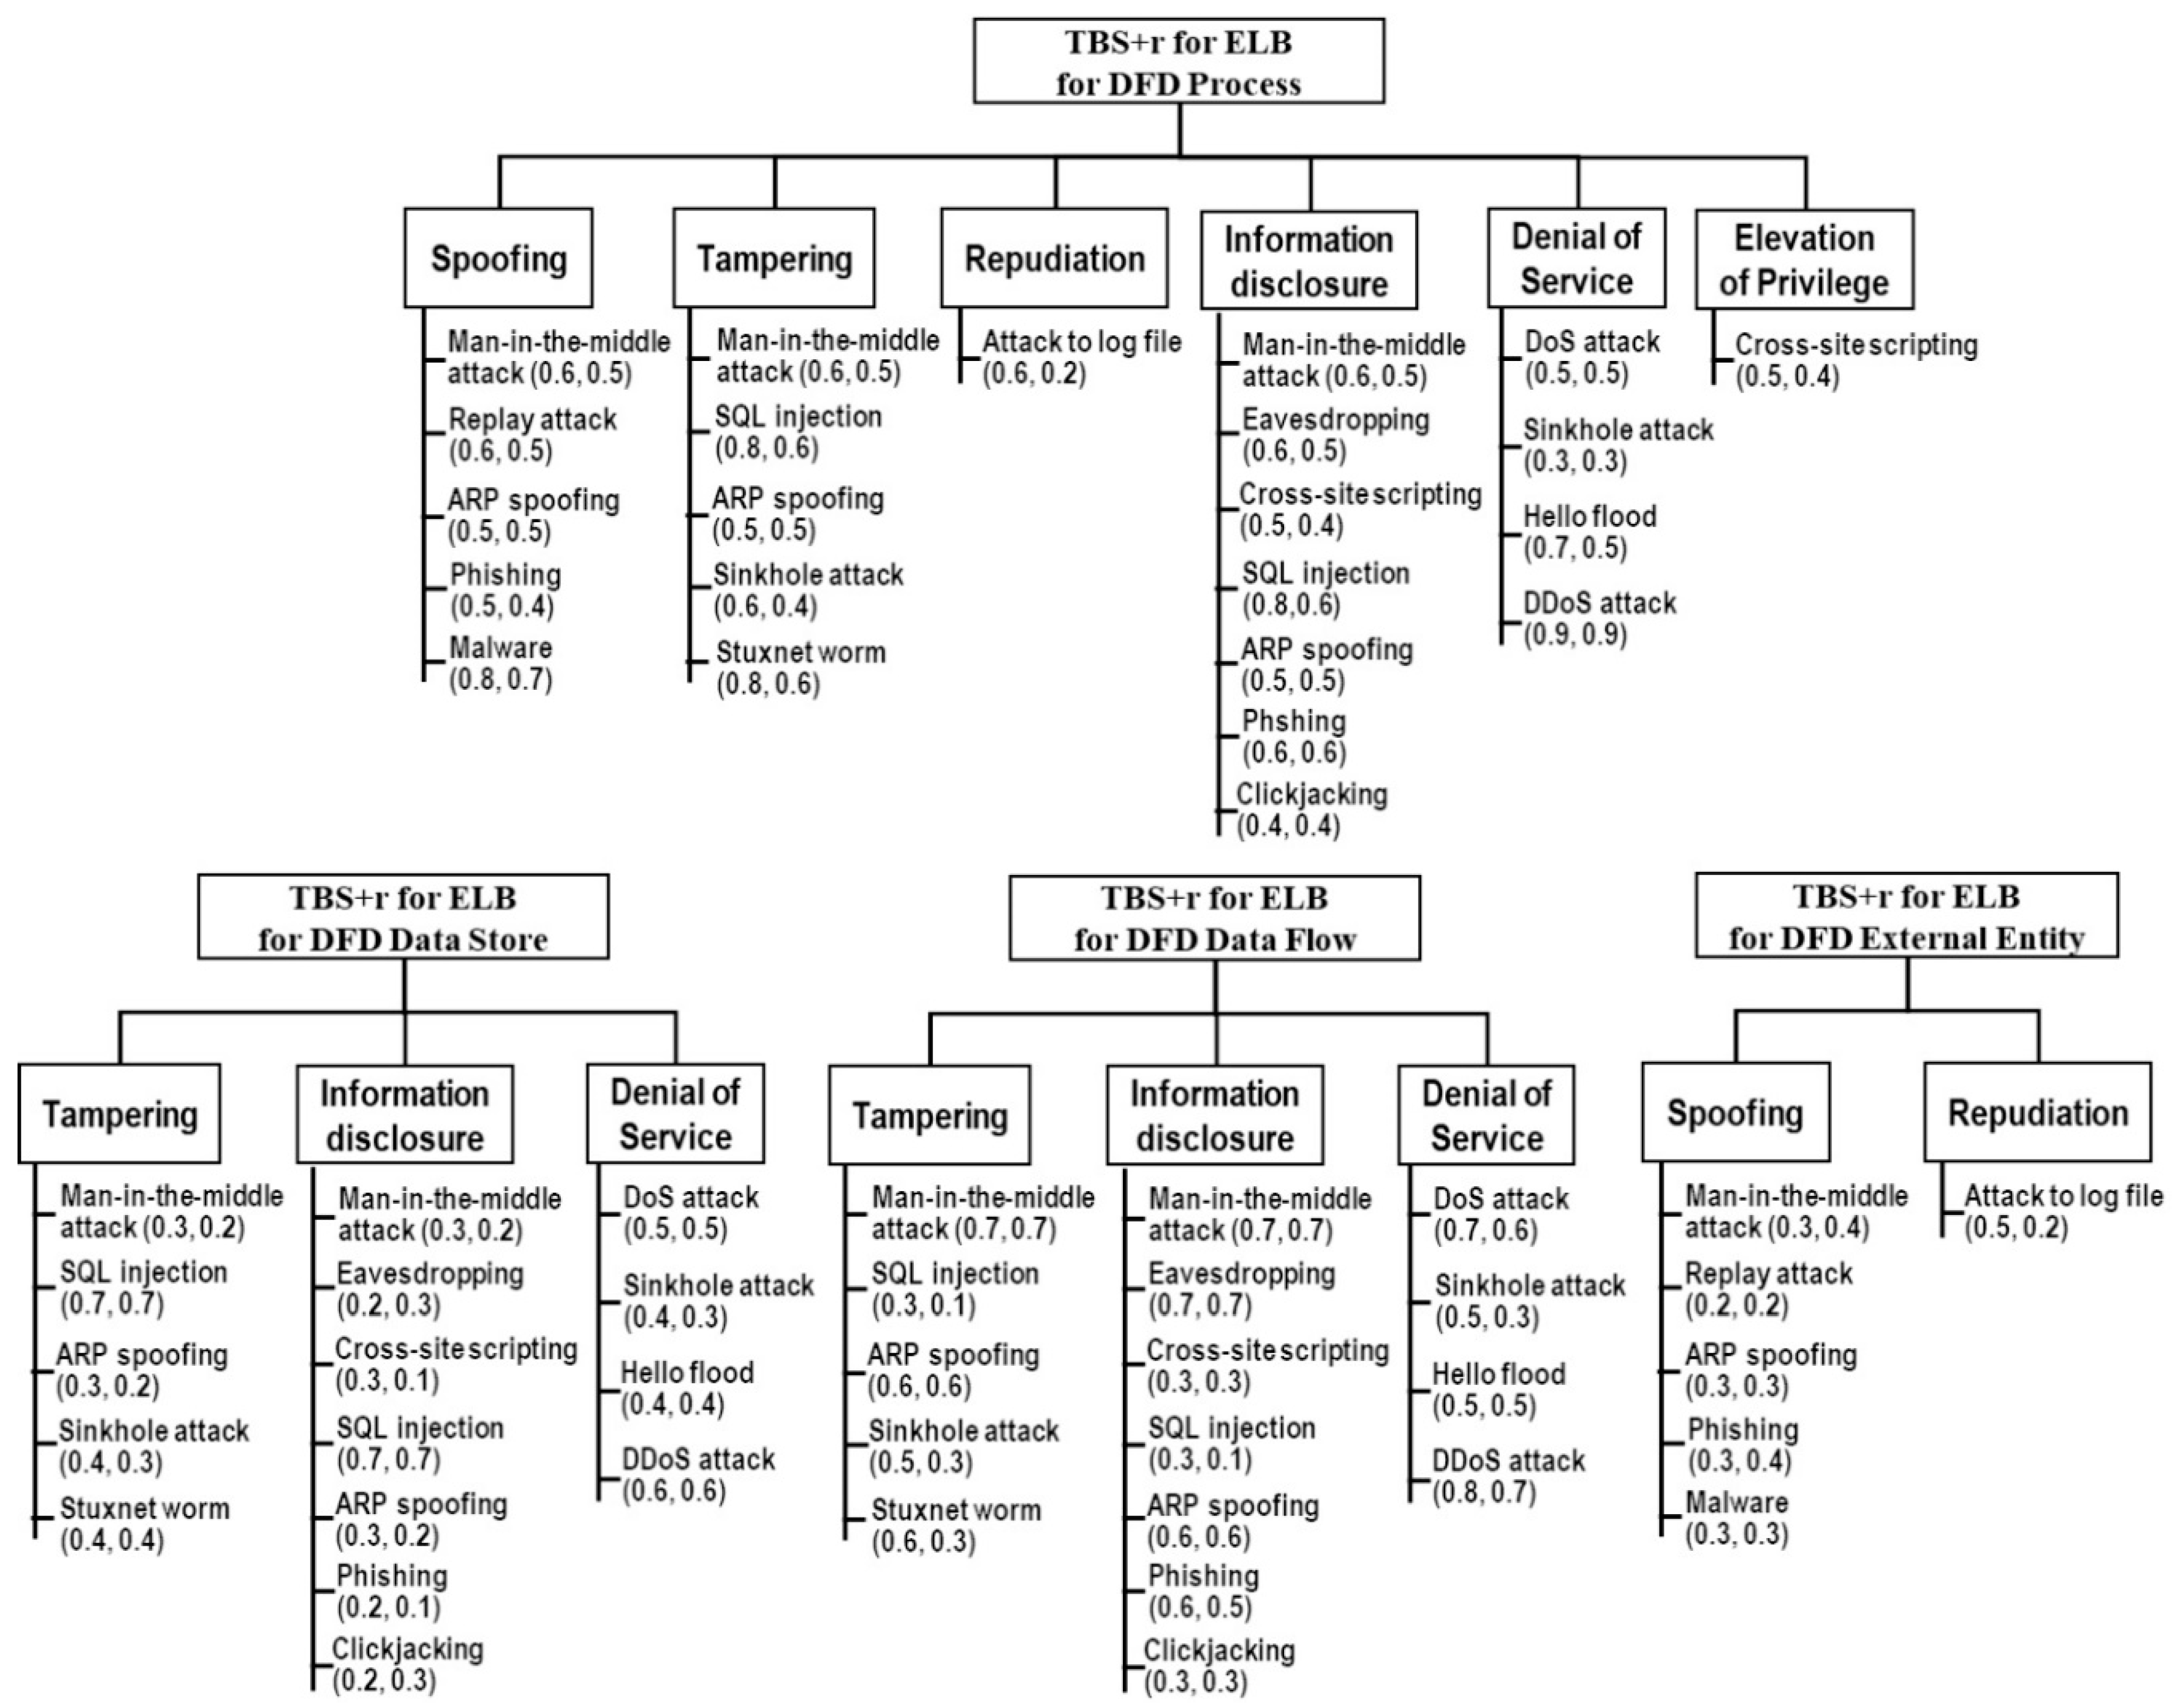
  • Identify ISTs by using TBS+r: A TBS+r is a pre-defined threat breakdown structure for use as a reference when listing the possible ISTs for each DFD element.
  • Assess ISTs by referring to TBS+r scores: In this step, experts in the field of the target system or information security theories are invited to help confirm key ISTs. The well-known Delphi method is suggested for the process of prioritizing ISTs by assessing their impact and likelihood. By using an iterative Delphi process with anonymous scoring, open discussion, and result confirmation, this step can be completed when the pre-defined criteria are met, and the process can proceed to the next step. Otherwise, the process should go back to Step 5 to recheck the ISTs, or even identify further possible ISTs that merit concern.
  • Confirm key ISTs for the planned application: This step confirms the key ISTs, and creates the final ISTM in a proper form, for example, a threat tree.

3.2. STRIDE+p Matrix

Since STRIDE and LINDDUN each have their specific strengths, weaknesses, and application coverage, this study proposes a new STRIDE+p matrix. The new matrix is based on STRIDE, combined with the privacy concerns of LINDDUN, and is therefore named STRIDE+p.
STRIDE+p refers to a combination of the features of the threat types defined in STRIDE and LINDDUN. The combined perspectives include: (1) Both the Linkability and Identifiability of LINDDUN can be categorized with the Spoofing of STRIDE, but they should not occur when accessing the data flow; (2) The Non-repudiation of LINDDUN is synonymous with the Repudiation of STRIDE; (3) The Detectability of LINDDUN is related to the Denial of service of STRIDE; (4) The information Disclosure of LINDDUN is synonymous with the information Disclosure of STRIDE; (5) The content Unawareness of LINDDUN means that a user is unaware the potential attack events, therefore it can be omitted; (6) The policy and consent Non-compliance of LINDDUN is related to the Elevation of privilege of STRIDE, but it should not happen on the data flow. STRIDE+p was thus built based on the above adjustments. The threat types of STRIDE, LINDDUN, and STRIDE+p are compared in Table 1.

3.3. TBS+r Scheme

STRIDE+p can only help correspond DFD elements to their associated threat types. Detailed ISTs should be carefully identified; however, in practice, the ISTs concerned usually vary depending on the application scenario. As a result, this study considered the concept of risk breakdown structure [47] and suggests the use of threat breakdown structure with reference scores (TBS+r). The purpose of using TBS+r is twofold: (1) to help to identify the ISTs, and (2) to serve as a reference for assisting IST assessments, i.e., using the reference score. According to studies [22,55,56,57,58], and with reference to Wikipedia, this study conducted four TBS+r for different DFD elements, as shown in Figure 2, Figure 3 and Figure 4. Each TBS+r consists of several threat types, and each threat type contains several ISTs with their respective Impact reference score Ir and Probability reference score Pr, in the form of (Ir, Pr). The values of Ir and Pr range from 0 to 1. For example, in Figure 2, the TBS+r for DFD Process has six threat types. Of these types, the Spoofing type contains five ISTs. the man-in-the-middle is one of these Spoofing ISTs; its Ir is 0.6, and Pr is 0.5.

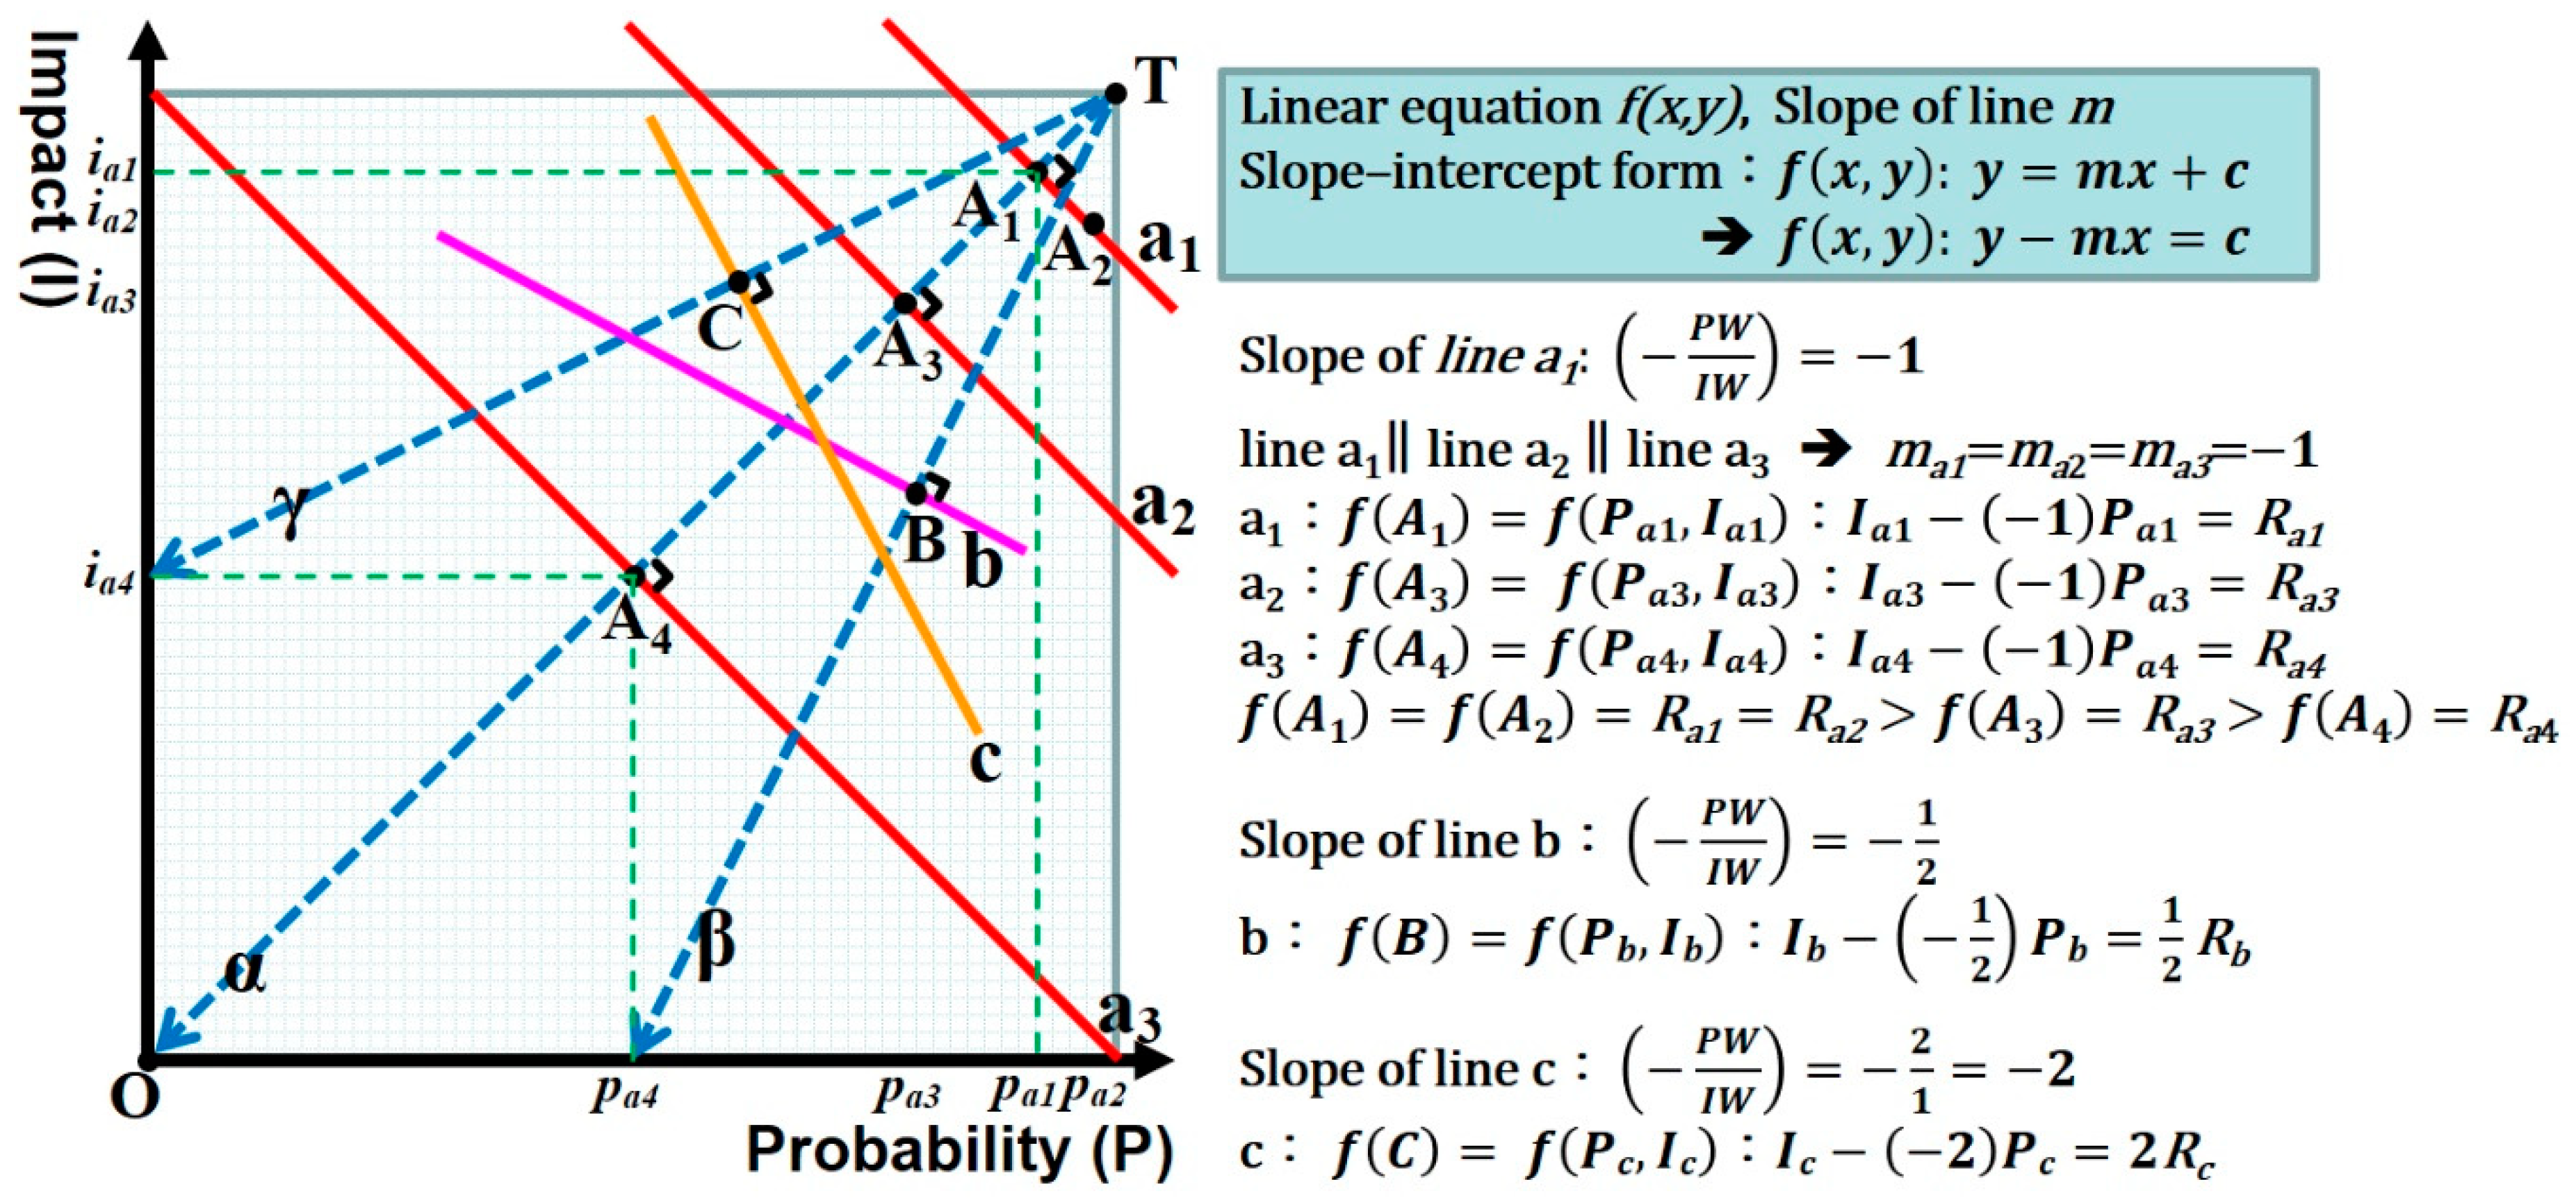
3.4. Threat Assessment Mechanism

As soon as the ISTs are identified using the TBS+r operation, the next step is to assess the ISTs and determine the key ISTs, especially when the considered resources will not be sufficient to deal with all possible ISTs. Experts in the IST field commonly play a critical role in expertise interchange, experience sharing, issue discussion, and factor analysis in the overall threat assessment process. The expertise is introduced to analyze and discuss the contents of possible ISTs. However, in order to increase the efficiency of the IST assessment, and make the content discussions objective, the TBS+r reference score plays an assisting role, as a good source of historical records and comparable experience.
The process of assessing ISTs and prioritizing key ISTs is facilitated by the Delphi method, which refers to the iterative process of anonymous participation (scoring), open discussion, and confirmation of the result until a predetermined stop condition is satisfied [52,53]. The IST assessment uses Impact and likelihood (Probability) as the assessed factors. Impact refers to the degree of influence once the target risk occurs. In order to evaluate the Impact grade of each IST, the calculation of a weighted average, as expressed in Equation (1), is adopted. In the case of m items to be evaluated by n experts, Ii represents the Impact grade of the ith item, while ISij represents the Impact score of the ith item given by the jth expert, and IEij is the score of expertise regarding ISij. The scoring value of the above variables is set from 0 to 10
I i = j = 1 n I S i j × I E i j j = 1 n I E i j ,   i = 1 , 2 , , m ;   j = 1 , 2 , , n .
In addition, any risk has its occurrence likelihood (probability); the Probability of each IST must also be rated. Pi represents the evaluated Probability grade of the ith item, which can be calculated by Equation (2). PSij represents the Probability score of the ith item given by the jth expert, while PEij is the score of expertise regarding PSij. The scoring value of the above variables is set from 0 to 10:
P i = j = 1 n P S i j × P E i j j = 1 n P E i j ,   i = 1 , 2 , , m ;   j = 1 , 2 , , n .
Since any IST relates to both impact and likelihood, the Impact (Ii) and Probability (Pi) grades should be simultaneously examined to determine the key ISTs, i.e., high Impact and high Probability. Additionally, it is necessary to consider the relationship of the weights of the Impact and Probability if the importance of these two factors is not equal. That is, the threat assessment process must consider not just Ii and Pi, but also the Impact weight (IW) as well as the Probability weight (PW).
A detailed description of how key ISTs are screened is given in Figure 5 (a Cartesian coordinate system). Assume that the value range in Figure 6 is the same, i.e., the coordinate value is equal. Each IST with both the Impact grade Ii and Probability grade Pi can be regarded as a corresponding point on a coordinate system. When the selection of key ISTs is based on the principle of high Impact and high Probability, point T in Figure 5 is the first priority, with the highest Impact and highest Probability. From the viewpoint of Analytic Geometry, starting from point T, proceeding toward point O along the α direction, the priority of the representative options is shown in a descending order, from the highest position to the lowest position. That is, through point A1, point A3 and point A4 is a sequential selection from higher priority to lower priority. In addition, any two points on the plane coordinate system can determine a straight line. For example, the line TO passes through point T, point A1, and point O, and its slope is ( P W I W ) = 1 ; i.e., P W = I W ( | P W | : | I W | = 1 : 1 ) .
Equation (3) is used to compute the output, R i , of a linear equation on a specific IW:PW ratio. Since point A1 and point A2 have the same R i value, they can jointly determine a line, a1, with a slope ( P W I W ) = 1 ; i.e., P W = I W ( | P W | : | I W | = 1 : 1 ) . Line a1 and line TO are perpendicular to each other. The linear equation f(x, y) of line a1 using the slope–intercept form is f ( A 1 ) = f ( P a 1 , I a 1 ) : I a 1 ( 1 ) P a 1 = R a 1 . Similarly, point A3 falls on line a2, point A4 falls on line a3, and lines a1, a2, and a3 are parallel to each other. The three lines have the same slope but different values, so the priority order of the points falling on a1 is higher than that of the points falling on a2. The priority situation of a2, a3 can be analogously deduced.
R i = ( P W × P i + I W × I i )
Furthermore, if the weighting ratio UW and IW changes, the slope of the line will change accordingly, and the equation of the line will be different. When point T extends along the β direction toward the midpoint of the P axis, the extended line with a slope of ( P W I W ) = 2 is perpendicular to line b. The linear equation of line b is f ( B ) = f ( P b , I b ) : I b ( 1 2 ) P b . Similarly, the linear equation of line c is f ( C ) = f ( P c , I c ) : I c ( 2 ) P c .
Based on the above, when screening ISTs with two respective factor vectors, regardless of the weighting ratio of the two factors, the ISTs can be prioritized according to the computed result of the corresponding liner equation. Essentially, R i is the basis for prioritizing participating ISTs.
This study proposes the following three steps for prioritizing and choosing key ISTs. First, Equation (3) is used to compute R i . Next, the group of key ISTs ( S I W : P W ) is determined by Equation (4) with a threshold ( L ) set as a satisfied condition. Third, the above two steps are repeated with different linear equations. Key ISTs are then determined through an open-discussion cross-analysis of all the considered S I W : P W groups:
S I W : P W = { i | R i = ( P W × P i + I W × I i ) L }

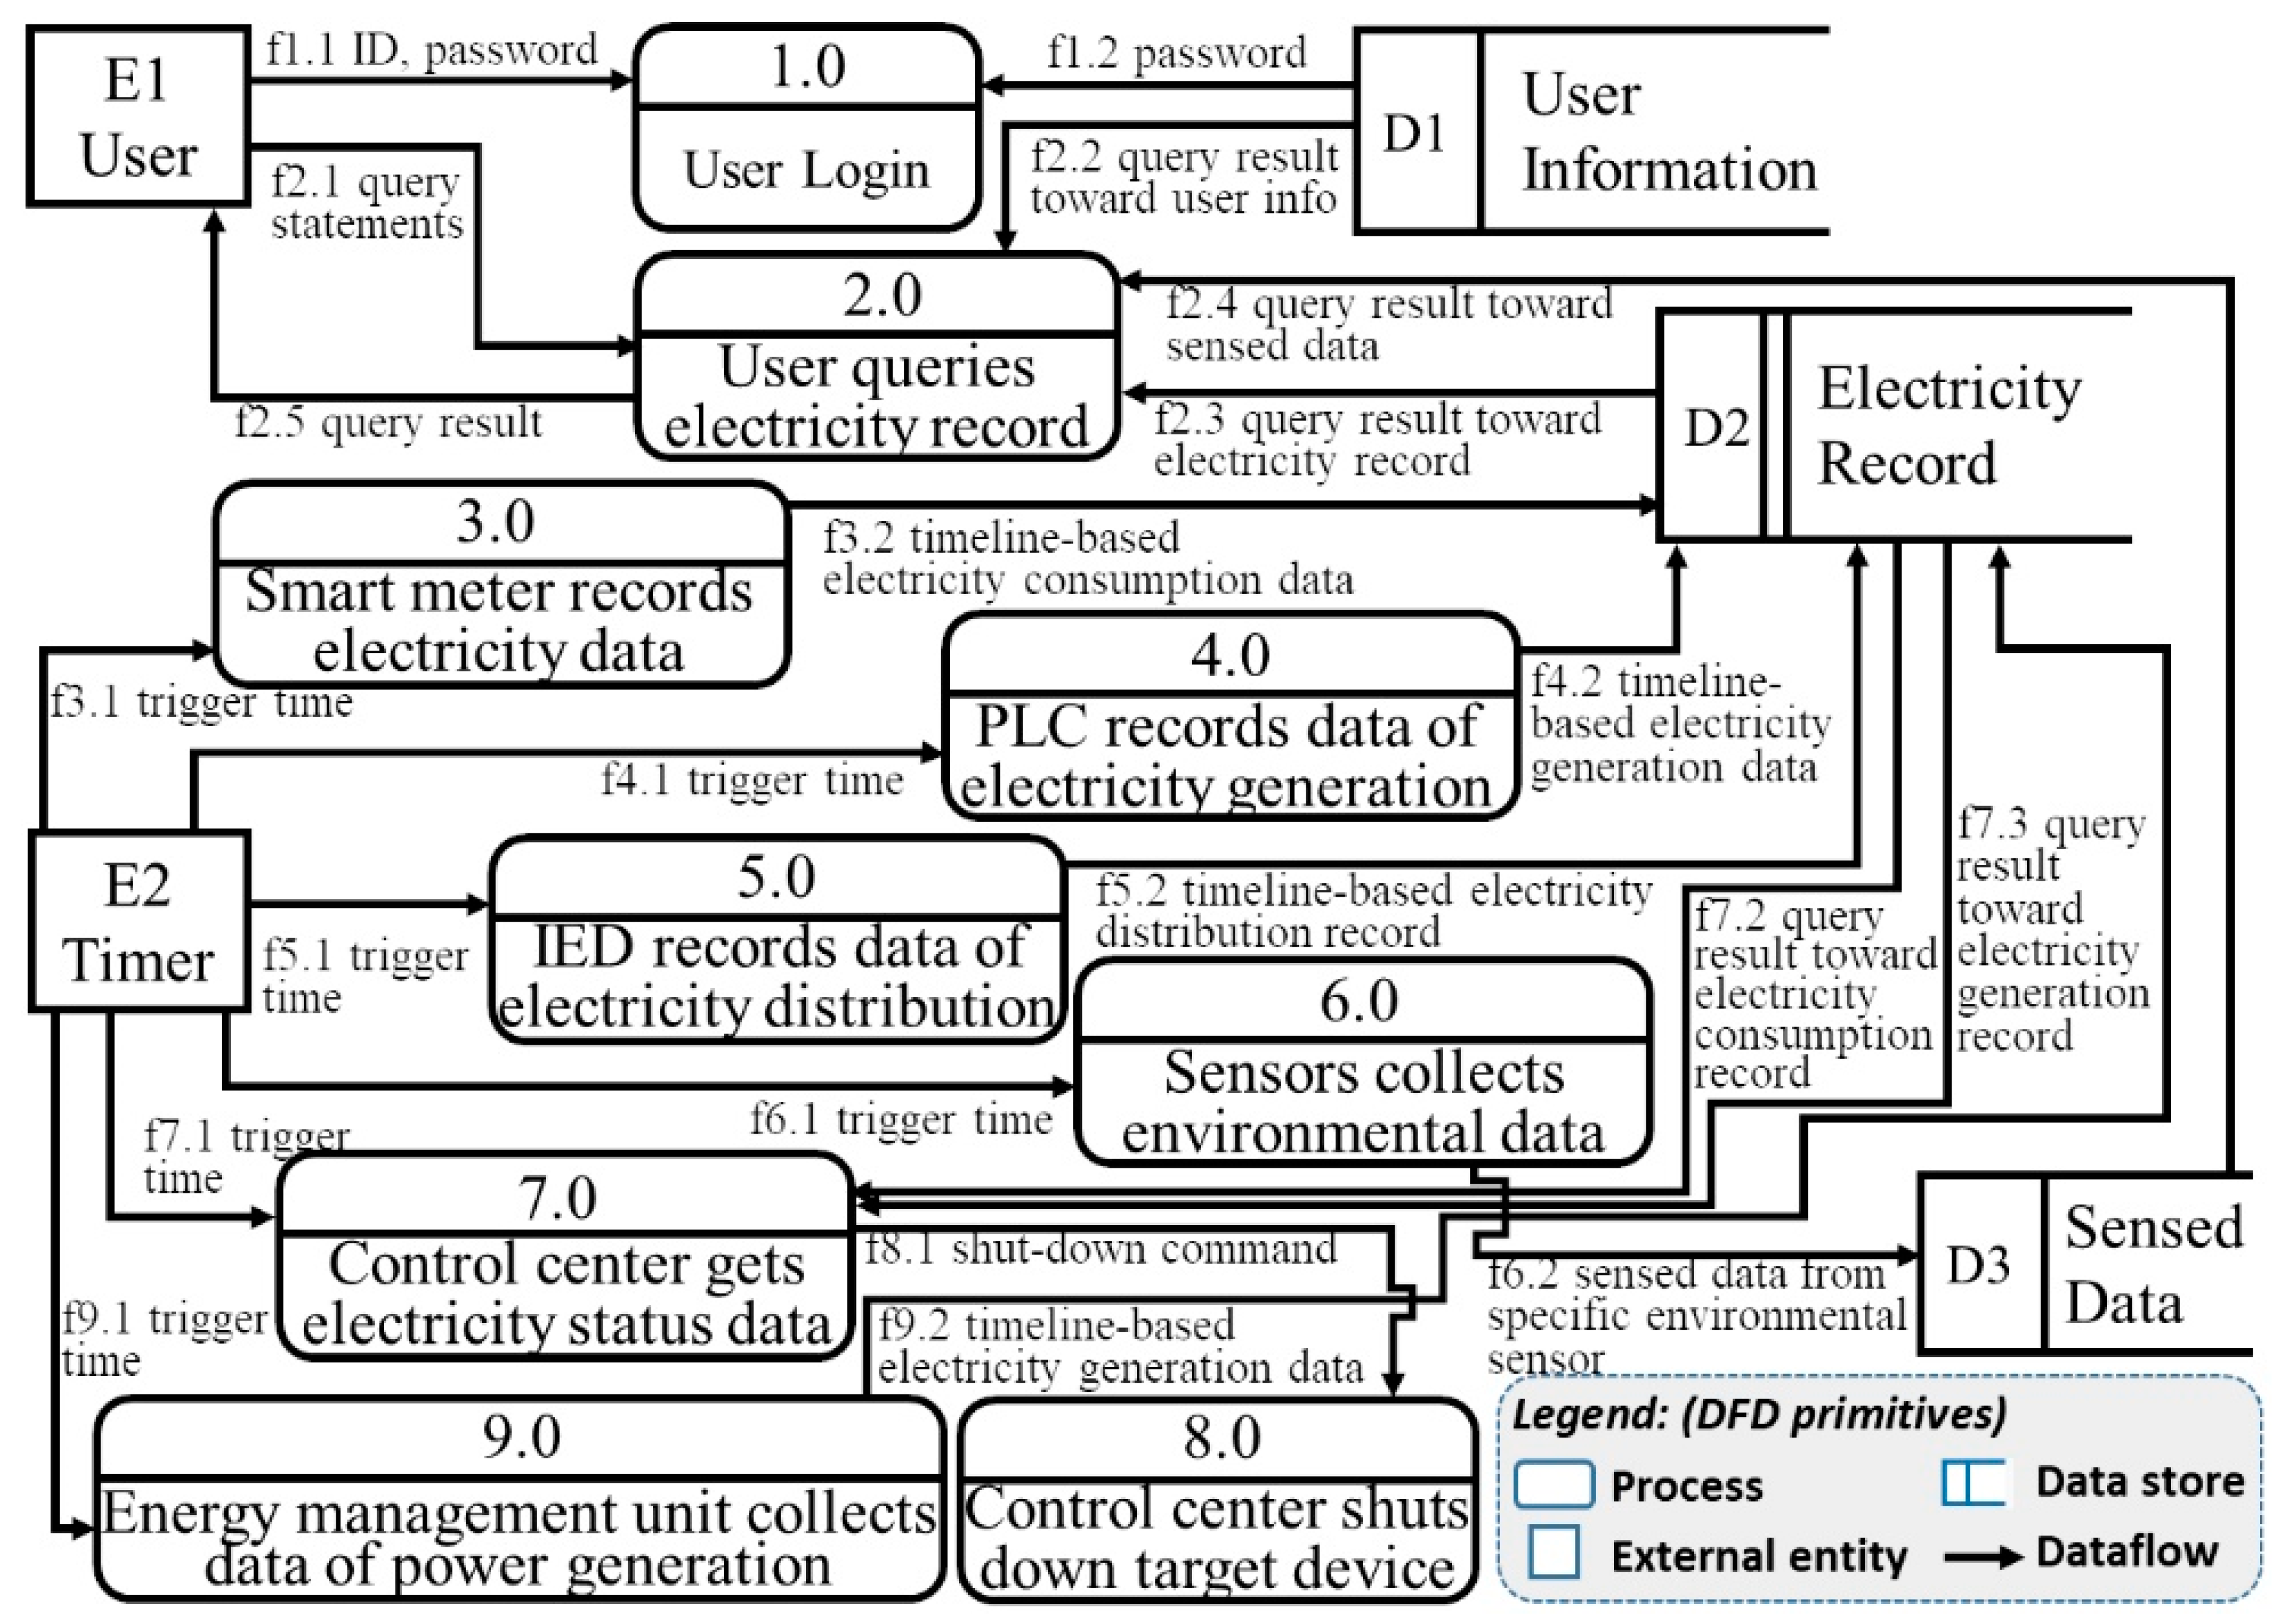
4. Demonstration of an I-SERM Practice: SG Electricity Load Balance

This section demonstrates an I-SERM practice that focuses on electricity load balance (ELB) on SG.

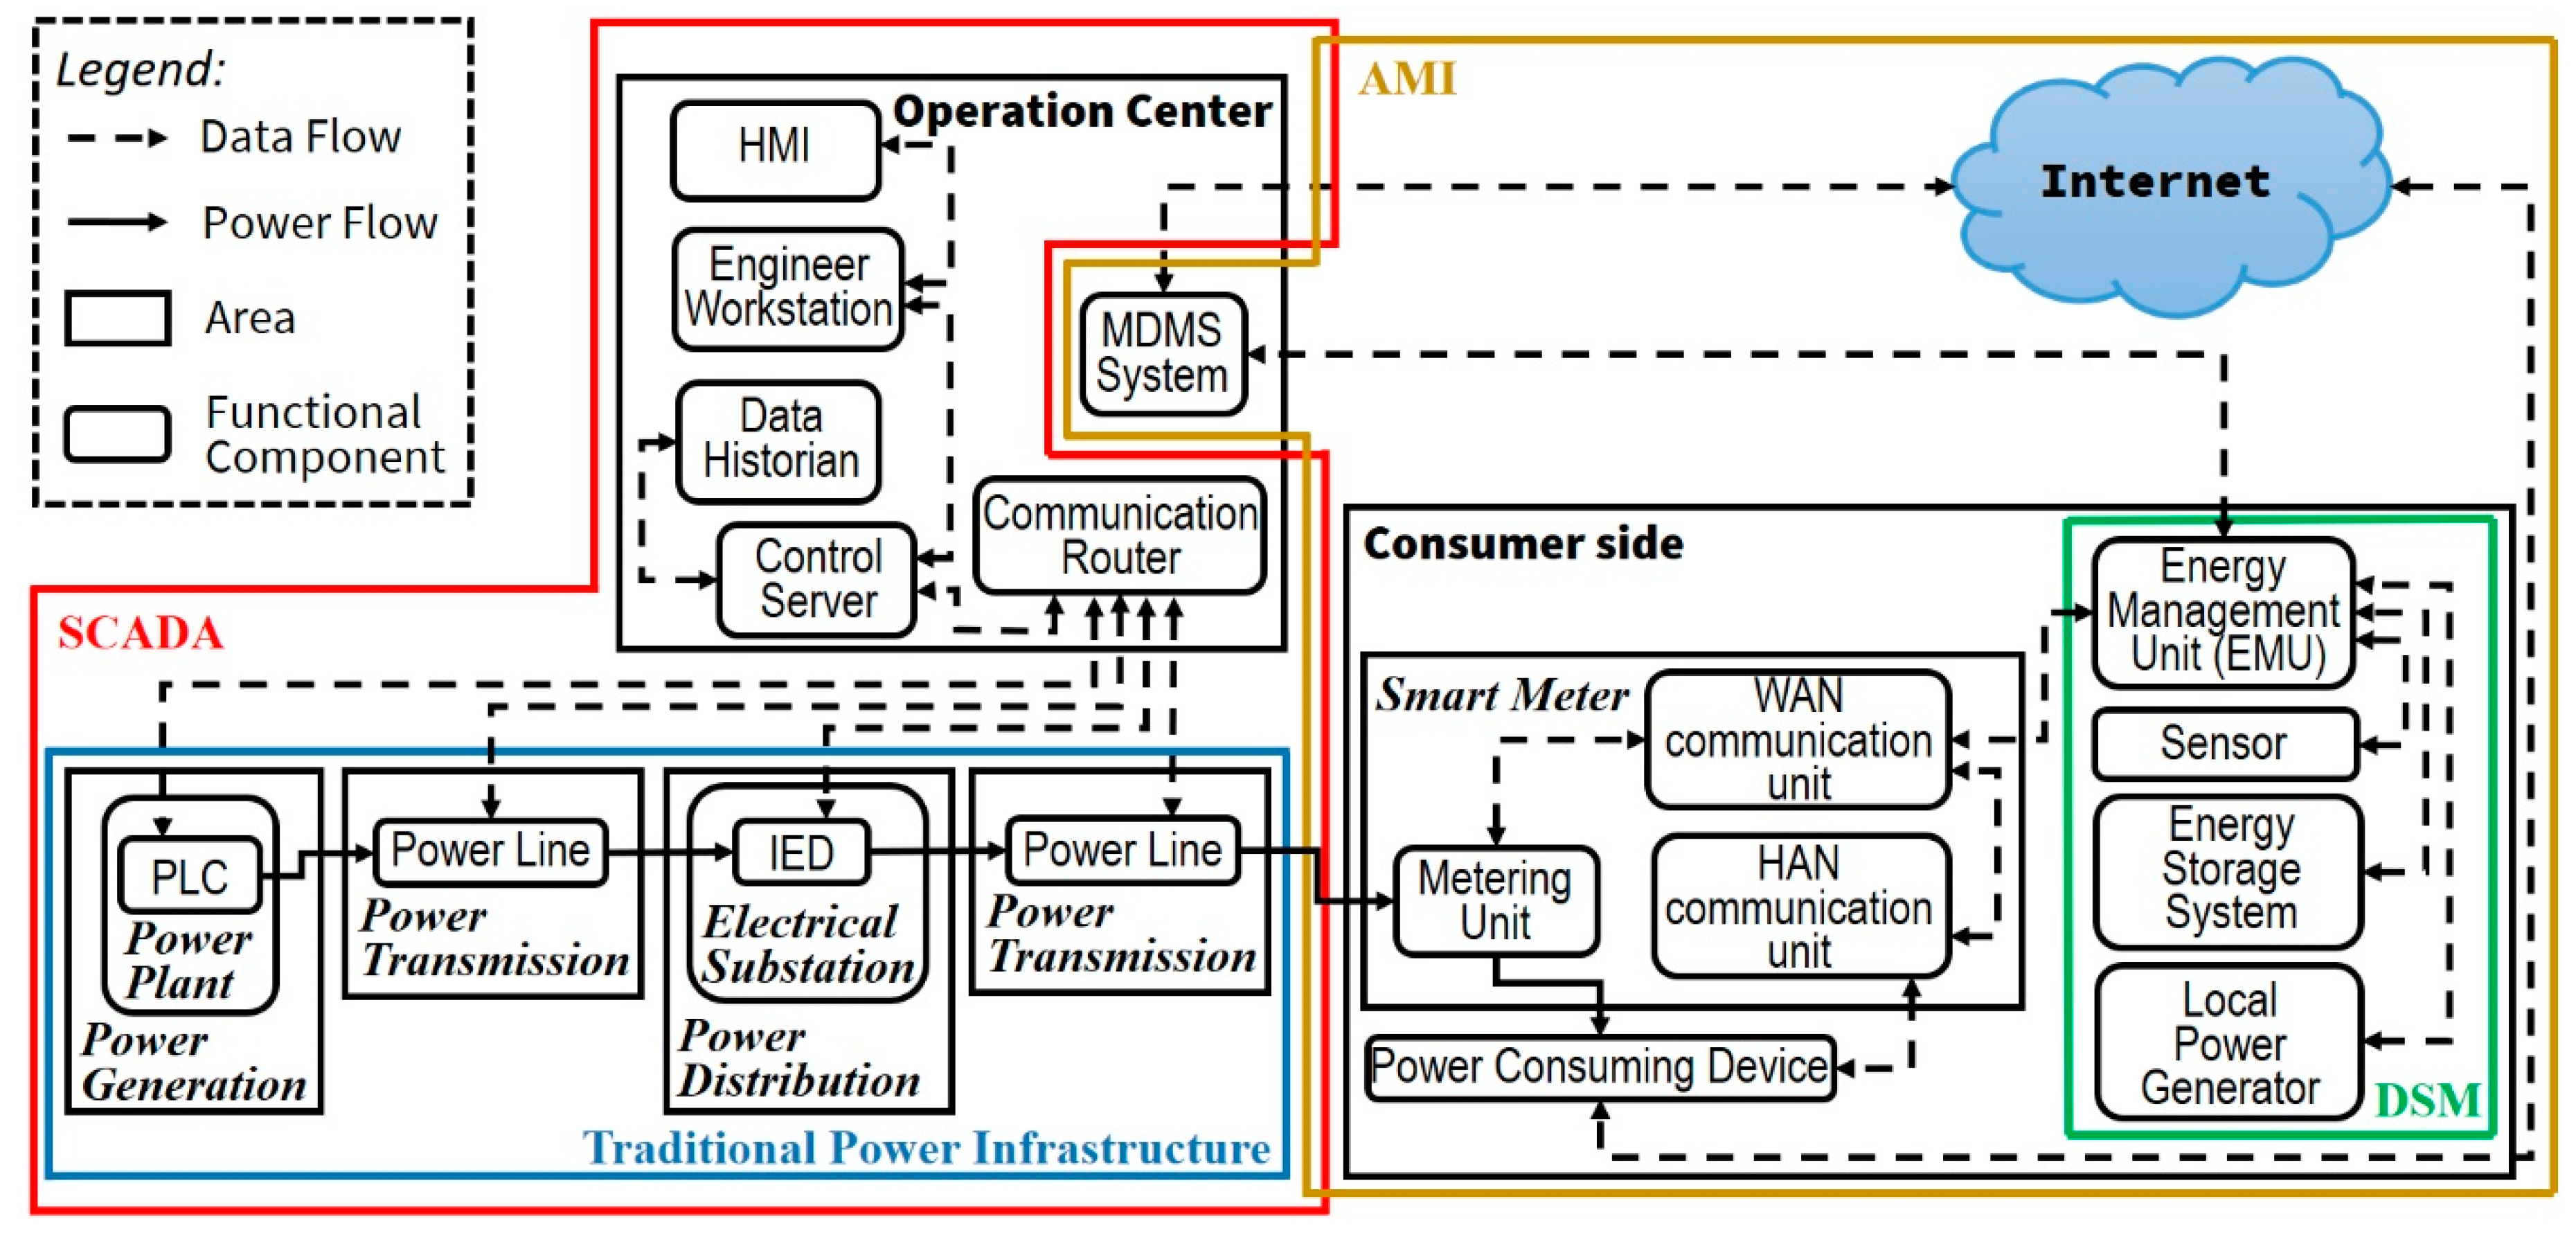
4.1. Identifying the Functional Components of the Target Sensor System

Since the proposed I-SERM is designed for ISTM of large-scale sensor systems such as SGs, the architecture of the functional components of the target sensor system must first be confirmed. The first step of I-SERM is to create an architecture of the SG’s functional components, i.e., an SG framework. Step 1 of I-SERM is detailed as a nine-substep (from 1a to 1i) process as shown in Figure 6. Step 1a is to explore the components of the physical power system. According to [24], the components of physical power systems include power plants, renewable energy stations, power line networking systems, substations, transformers, and physical electricity meters. In the next step, four facility areas including generation, transmission, distribution, and user side are defined. Step 1c determines the functional components located in proper facility areas in the physical power system using the PFD approach.
Similarly, Steps 1d to 1f are for the SCADA part. In Step 1d, 10 components including wide area networks (WANs), intelligent electronic devices (IEDs), programmable logic controllers (PLCs), remote terminal units (RTUs), engineering workstations, human machine interfaces (HMIs), communication routers, data historians, control servers, and communication networks are involved [33]. A new facility area called a control center is included in Step 1e. All the SCADA components are appropriately placed in five facility areas. Then, a PFD presenting the functional components for both the physical power system and SCADA is created.
Steps 1g to 1i are for the AMI part. In Step 1g, three components including smart meters, home area networks (HAN), and meter data management systems (MDMS) are confirmed [26,38]. Finally, the overall functional components of the physical power system, SCADA, and AMI are integrated in the form of a PFD, forming an SG framework, as shown in Figure 7.

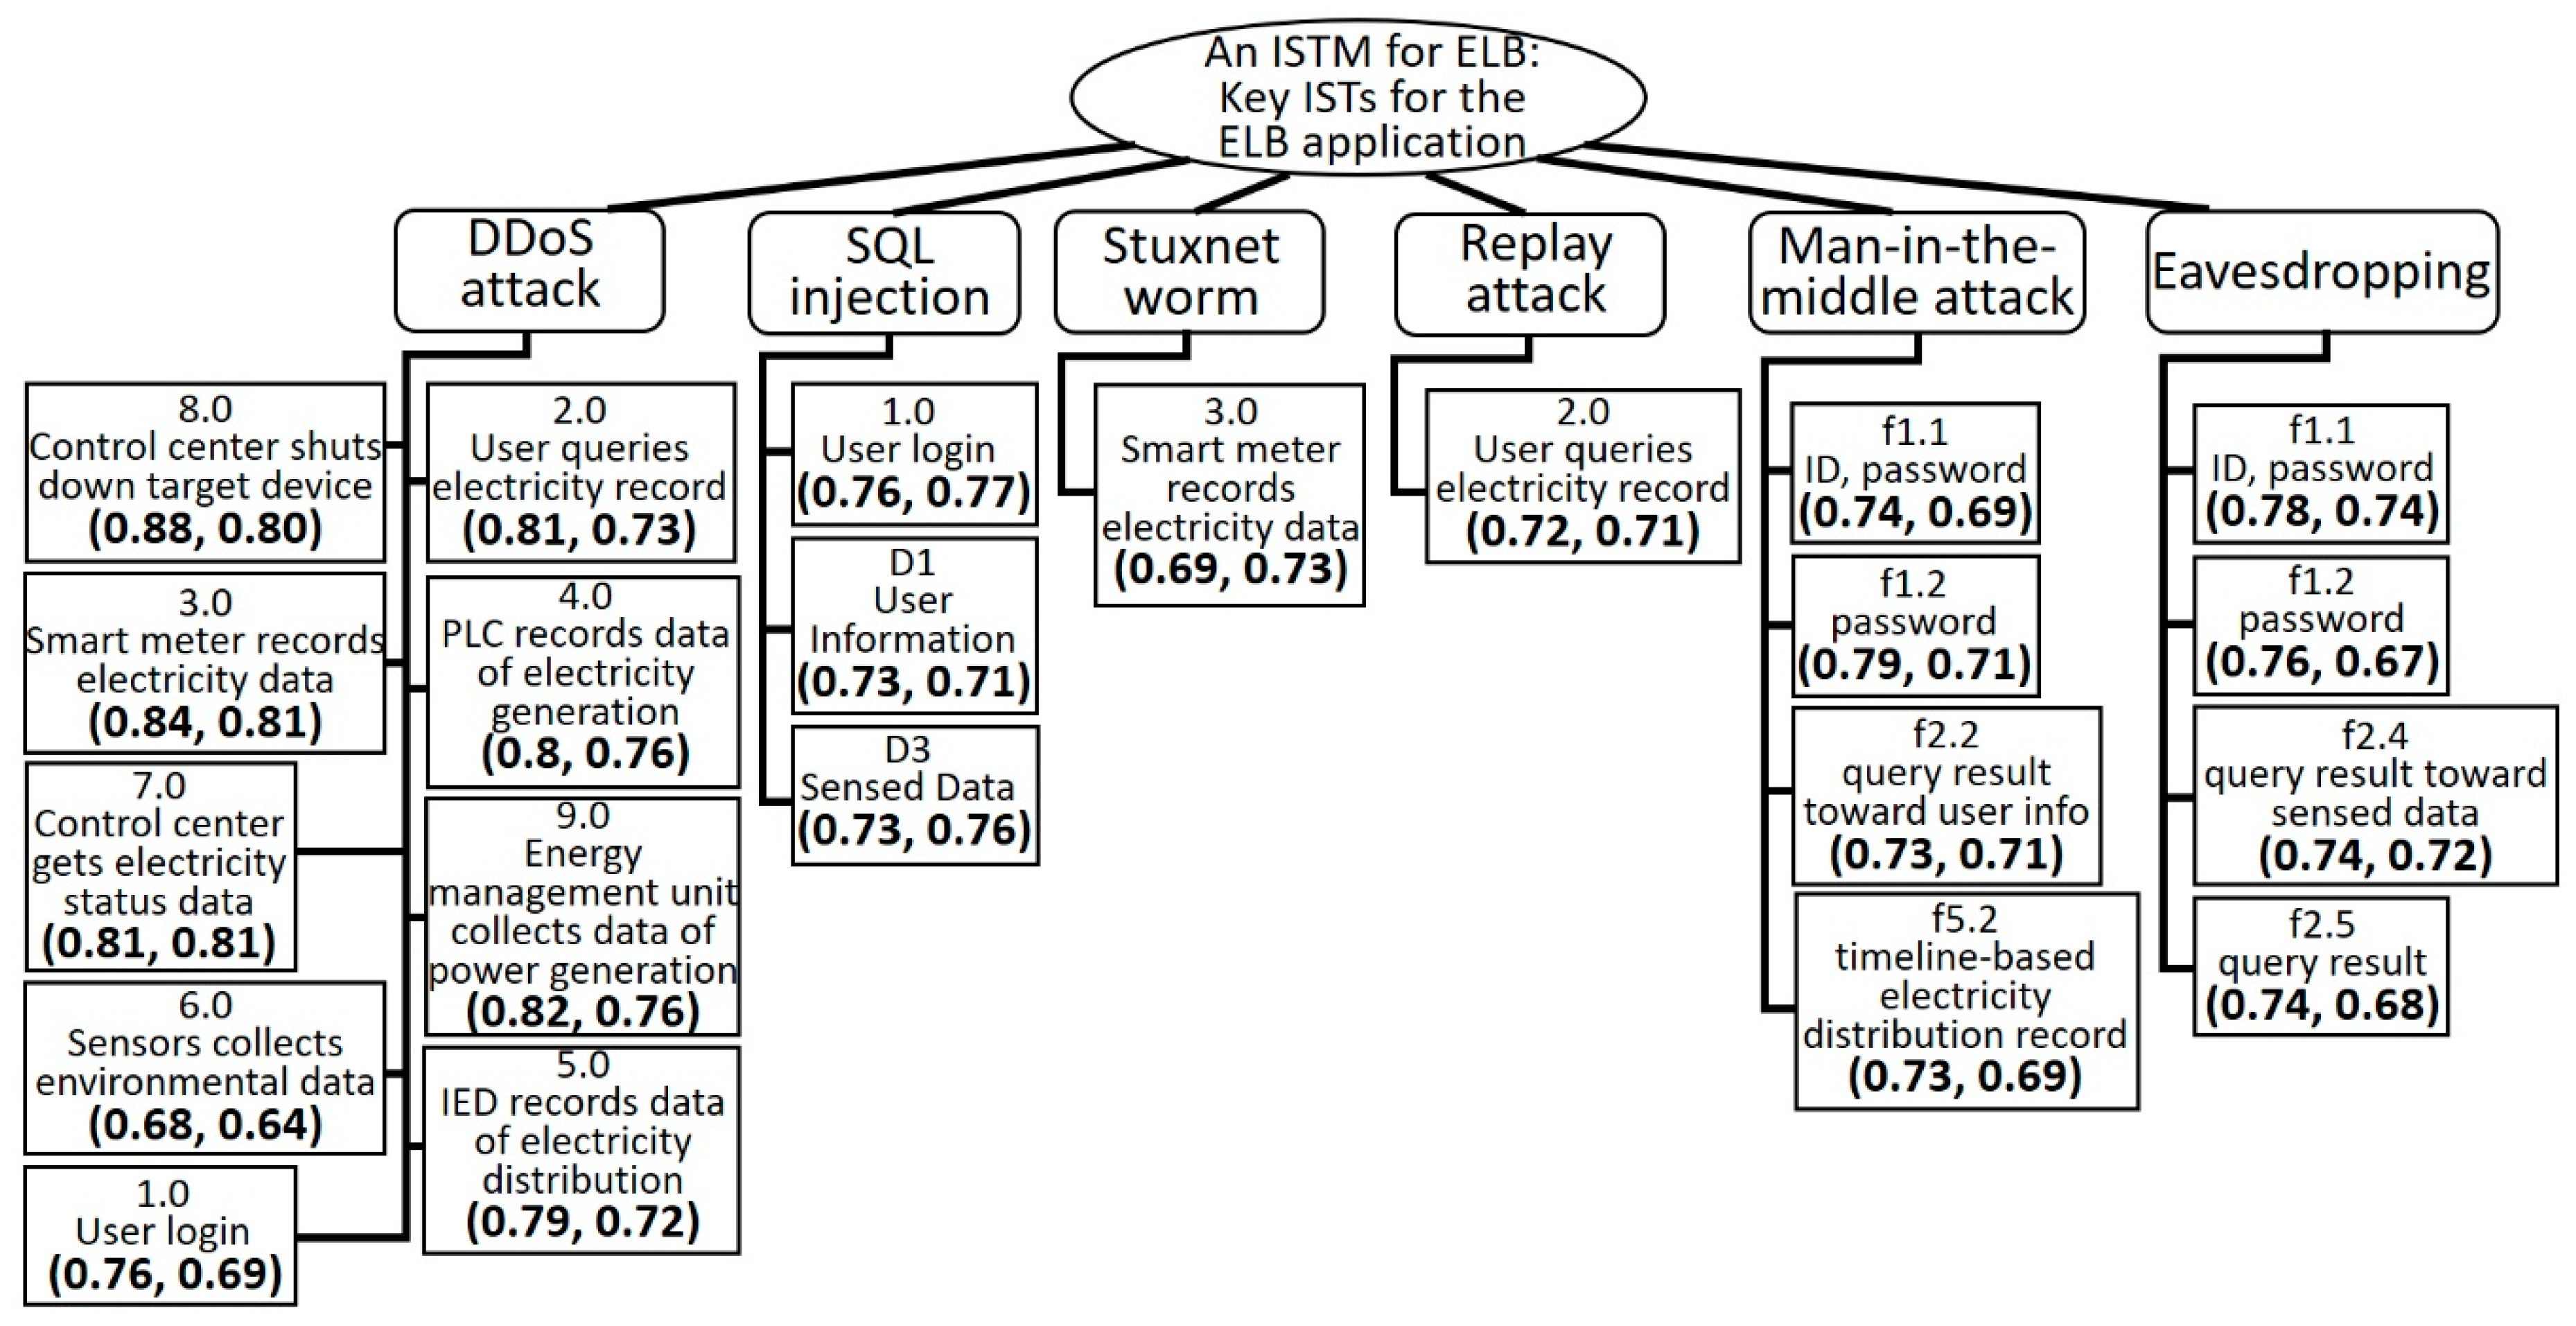
4.2. Steps 2 to 7 of the I-SERM

The remainder of the I-SERM steps (from Step 2 to Step 7) for ELB and the deliverables are shown in Figure 8, wherein Step 2 is divided into substeps 2a, 2b, and 2c, and Step 3 includes substeps 3a and 3b.
First, the functional components related to the target application, i.e., the ELB, were selected. Based on the functional components, the functional requirements of the ELB were determined by Step 2b. Step 2c determines the required functions of the ELB, as well as the relationships between these functions, and then consults the output as a UCD. In Step 3a, the use cases were detailed in the form of scenario descriptions, so that all the operation paths and the data dictionary were clarified. Accordingly, in Step 3b, the DFD was created, as presented in Figure 9.
In the next steps, several experts were invited to help determine key ISTs for ELB through Steps 4 to 7. In Step 4, the threat types of the use cases were identified by referring to STRIDE+p. Step 5 explores the ISTs of DFD elements according to the TBS+r for ELB. The TBS+r for ELB, shown in Figure 10, is a specified TBS+r version for this ELB practice, and was confirmed by the invited experts before performing this step. In this step, the DFD elements f3.1, f4.1, f5.1, f6.1, f7.1, f8.1, and f9.1 were excluded because these elements are expected not to have ISTs.
In Step 6, all the ISTs were assessed by the participants, with reference to the scores of TBS+r for ELB. The IST evaluation scores, I for Impact score and P for Probability score, are listed by DFD types in Table 2, Table 3, Table 4 and Table 5, respectively.
Step 7 confirms the key ISTs using a Delphi operation. The ratio of |PW|:|IW| was set as = 1:1, and the threshold L was set to 1.39, so that 22 key ISTs (with respective Ri values greater than or equal to 1.39) were confirmed. Finally, an ISTM result for the SG ELB, as depicted in Figure 11, was built as a threat tree with the Impact and Probability values, noted as the (Impact, Probability) of the key ISTs. For example, SQL injection with process 1.0 is one of the 22 key ISTs, and its Impact value is 0.76 and Probability value is 0.77. This indicates that this SQL injection threat should be carefully considered when designing and implementing the user login function (process).

5. Conclusions

This paper presents an I-SERM approach for IST analysis for applications of large-scale systems. The I-SERM approach provides a systematic process for determining key ISTs for complex information systems. To practically evaluate the performance of the proposed I-SERM approach, a simple electricity load balancing (ELB) example was used to demonstrate the I-SERM operations. This ELB example not only demonstrated the usability of STRIDE+p and TBS+r, but also showed a suggested SG framework covering a basic physical power system and emerging SG mechanisms. The results of this investigation contribute to research in the field of information security for smart energy management, offering more comprehensive viewpoints on new SG functions and ISTM schemes for intelligent applications of power consumption and management.
Although the I-SERM is able to effectively and efficiently perform ISTM for complex systems by using the proposed schemes, there are the following extended issues worthy of further discussion:
  • The maintenance of the content of TBS+r. A key feature of I-SERM is applying TBS+r in a Delphi process in order to enhance the performance of the ISTM operation. In addition, the success of I-SERM should also rely on the IST scoring by the participating experts, while their feedback will be associated with the referred TBS+r. In other words, the content of TBS+r will significantly affect the ISTM result. As similar as the importance of maintaining updated rules for firewalls, intrusion detection systems (IDS) or intrusion prevention systems (IPS), the TBS+r must be kept up to date.
  • The use of multi-dimensional analysis. In practice, the use of a single-dimensional perspective is illogical for assessing target factors. In this ELB case, the ratio of |PW|:|IW| set as = 1:1 is the only perspective for selecting key ISTs. Different |PW|:|IW| ratios should deliver different viewpoints of the selection. That is, a multi-dimensional analysis method could improve the reliability and validity of a study. For this issue, the Theoretical Triangulation approach [59,60,61] could be considered in future work.
  • The suggested IST action-list. The I-SERM outputs are key ISTs that should be carefully considered in designing and implementing application functions. Unfortunately, the I-SERM cannot provide appropriate actions for these selected key ISTs. In fact, since the TBS+r can be used as a reference to help determine ISTs and prioritize key ISTs, it is reasonable to create an action-list scheme that may identify the initiatives to protect against any specific IST.
  • A complete ISTM for the Energy Internet. In this study, only one simple practice, ELB, is considered. This practice demonstrates the usability of the I-SERM but is limited in terms of presenting a complete ISTM for the IoT-based Energy Internet. In the future, more complex and innovative SG applications, such as Time-of-Use Pricing, could be included to describe a complete ISTM for the IoT Energy Internet by using the proposed I-SERM approach. Such I-SERM-generated ISTM for the IoT Energy Internet may contribute more to the field of information security for the Energy Internet.

Author Contributions

Conceptualization, Y.-T.C. and C.-C.H.; Data curation, Y.-T.C. and C.-C.H.; Formal analysis, Y.-T.C. and C.-C.H.; Funding acquisition, Y.-T.C.; Methodology, Y.-T.C. and C.-C.H.; Project administration, Y.-T.C.; Validation, Y.-T.C.; Visualization, Y.-T.C.; Writing—original draft, Y.-T.C.; Writing—review and editing, Y.-T.C.

Funding

This research was funded by the Ministry of Science and Technology (MOST), Taiwan [grant number MOST 106-2221-E-239-003] and National United University, Taiwan [grant numbers 107-CSP001 and 108-CSP006].

Acknowledgments

The authors would like to thank the participating specialists for providing their expertise through expert interviews and a panel of experts. They would also like to thank the journal editor and the reviewers for their precious time and valuable comments.

Conflicts of Interest

The authors declare no conflicts of interest.

References

  1. Pan, J.; Jain, R.; Paul, S.; Vu, T.; Saifullah, A.; Sha, M. An Internet of Things Framework for Smart Energy in Buildings: Designs, Prototype, and Experiments. IEEE Internet Things J. 2015, 2, 527–537. [Google Scholar] [CrossRef]
  2. Marinakis, V.; Doukas, H. An Advanced IoT-based System for Intelligent Energy Management in Buildings. Sensors 2018, 18, 610. [Google Scholar] [CrossRef]
  3. Ejaz, W.; Naeem, M.; Shahid, A.; Anpalagan, A.; Jo, M. Efficient Energy Management for the Internet of Things in Smart Cities. IEEE Commun. Mag. 2017, 55, 84–91. [Google Scholar] [CrossRef]
  4. Noor-A-Rahim, M.; Khyam, M.O.; Li, X.; Pesch, D. Sensor Fusion and State Estimation of IoT Enabled Wind Energy Conversion System. Sensors 2019, 19, 1566. [Google Scholar] [CrossRef] [PubMed]
  5. Zhou, K.; Yang, S.; Shao, Z. Energy Internet: The business perspective. Appl. Energy 2016, 178, 212–222. [Google Scholar] [CrossRef]
  6. Mohassel, R.R.; Fung, A.; Mohammadi, F.; Raahemifar, K. A survey on Advanced Metering Infrastructure. Electr. Power Energy Syst. 2014, 63, 473–484. [Google Scholar] [CrossRef] [Green Version]
  7. Henrie, M. Cyber Security Risk Management in the SCADA Critical Infrastructure Environment. Eng. Manag. J. 2013, 25, 38–45. [Google Scholar] [CrossRef]
  8. Zetter, K. Inside the Cunning, Unprecedented Hack of Ukraine’s Power Grid. Wired. Available online: https://www.wired.com/2016/03/inside-cunning-unprecedented-hack-ukraines-power-grid/ (accessed on 31 July 2019).
  9. Zetter, K. The Ukrainian Power Grid Was Hacked Again. Motherboard. Available online: https://motherboard.vice.com/en_us/article/bmvkn4/ukrainian-power-station-hacking-december-2016-report (accessed on 31 July 2019).
  10. Paganini, P. Israeli Public Utility Authority Hit by a Severe Cyber Attack. Available online: http://securityaffairs.co/wordpress/43989/hacking/israeli-public-utility-authority-under-attack.html (accessed on 31 July 2019).
  11. Venkatesan, R.; Bhattacharya, S. Threat-Adaptive Security Policy. In Proceedings of the IEEE International Performance, Computing, and Communications Conference, Phoenix, Tempe, AZ, USA, 5–7 February 1997; pp. 525–531. [Google Scholar]
  12. Olivoa, C.K.; Santina, A.O.; Oliveira, L.S. Obtaining the threat model for e-mail phishing. Appl. Soft Comput. 2013, 13, 4841–4848. [Google Scholar] [CrossRef]
  13. Cardenas, A.A.; Roosta, T.; Sastry, S. Rethinking security properties, threat models, and the design space in sensor networks: A case study in SCADA systems. Ad Hoc Netw. 2009, 7, 1434–1447. [Google Scholar] [CrossRef]
  14. Opdahl, A.L.; Sindre, G. Experimental comparison of attack trees and misuse cases for security threat identification. Inf. Softw. Technol. 2009, 51, 916–932. [Google Scholar] [CrossRef]
  15. Fovino, I.N.; Masera, M. Through the Description of Attacks: A Multidimensional View. In Proceedings of the 25th International Conference on Computer Safety, Reliability, and Security, Gdansk, Poland, 27–29 September 2006; Springer: Berlin, Heidelberg, 2006; pp. 15–28. [Google Scholar]
  16. Abdo, H.; Kaouk, M.; Flaus, J.M.; Masse, F. A safety/security risk analysis approach of Industrial Control Systems: A cyber bowtie—Combining new version of attack tree with bowtie analysis. Comput. Secur. 2018, 72, 175–195. [Google Scholar] [CrossRef]
  17. Wyuts, K.; Scandariato, R.; Joosen, W. Empirical evaluation of a privacy-focused threat modeling methodology. J. Syst. Softw. 2014, 96, 122–138. [Google Scholar] [CrossRef]
  18. Shostack, A. Threat Modeling: Designing for Security; Wiley: Hoboken, NJ, USA, 2014. [Google Scholar]
  19. Khan, R.; Mclaughlin, K.; Laverty, D.; Sezer, S. STRIDE-Based Threat Modeling for Cyber-Physical Systems. In Proceedings of the 2017 IEEE PES Innovative Smart Grid Technologies Conference Europe (ISGT-Europe), Torino, Italy, 26–29 September 2017; pp. 1–6. [Google Scholar]
  20. Madan, S. Shielding against SQL Injection Stacks Using Admire Model. In Proceedings of the International Conference on Computational Intelligence, Communication systems and Networks, Indore, India, 23–25 July 2009; pp. 314–320. [Google Scholar]
  21. Torr, P. Demystifying the threat modeling process. IEEE Secur. Priv. 2005, 3, 66–70. [Google Scholar] [CrossRef]
  22. Ding, D.; Han, Q.L.; Xiang, Y.; Ge, X.; Zhang, X.M. A survey on security control and attack detection for industrial cyber-physical systems. Neurocomputing 2018, 275, 1674–1683. [Google Scholar] [CrossRef]
  23. Noponen, S.; Karppinen, K. Information Security of Remote File Transfers with Mobile Devices. In Proceedings of the Annual IEEE International Computer Software and Applications Conference, Turku, Finland, 28 July–1 August 2008; pp. 973–978. [Google Scholar]
  24. Howard, M.; Lipner, S. The Security Development Lifecycle; Microsoft Press: Redmond, WA, USA, 2006. [Google Scholar]
  25. Nafi, N.S.; Ahmed, K.; Gregory, M.A.; Datta, M. A survey of smart grid architectures, applications, benefits and standardization. J. Netw. Comput. Appl. 2016, 26, 23–36. [Google Scholar] [CrossRef]
  26. Rahman, M.A.; Al-Shaer, E.; Bera, P. A Noninvasive Threat Analyzer for Advanced Metering Infrastructure in Smart Grid. IEEE Trans. Smart Grid 2013, 4, 273–287. [Google Scholar] [CrossRef]
  27. Güngör, V.C.; Buccella, C.; Hancke, G.P. Smart Grid Technologies: Communication Technologies and Standards. IEEE Trans. Ind. Inform. 2011, 7, 529–539. [Google Scholar] [CrossRef] [Green Version]
  28. Gharavi, H.; Ghafurian, R. Smart Grid: The Electric Energy System of the Future; IEEE: Piscataway, NJ, USA, 2011; Volume 99, pp. 917–921. [Google Scholar]
  29. Delgado-Gomes, V.; Martins, J.F.; Lima, C.; Borza, P.N. Smart Grid Security Issues. In Proceedings of the 9th International Conference on Compatibility and Power Electronics (CPE), Costa da Caparica, Portugal, 24–26 June 2015; pp. 534–538. [Google Scholar]
  30. Ahmad, F.; Rasool, A.; Ozsoy, E.; Rajasekar, S.; Sabanovic, A.; Elitas, M. Distribution system state estimation—A step towards smart grid. Renew. Sustain. Energy Rev. 2018, 81, 2659–2671. [Google Scholar] [CrossRef]
  31. Abdrabou, A. A Wireless Communication Architecture for Smart Grid Distribution Networks. IEEE Syst. J. 2016, 10, 251–261. [Google Scholar] [CrossRef]
  32. Jiang, R.; Lu, R.; Lai, C.; Luo, J.; Shen, X. Robust Group Key Management with Revocation and Collusion Resistance for SCADA in Smart Grid. In Proceedings of the IEEE Global Communications Conference (GLOBECOM), Atlanta, GA, USA, 9–13 December 2013. [Google Scholar]
  33. Keith, S.; Victoria, P.; Suzanne, L.; Marshall, A.; Adam, H. Guide to Industry Control Systems (ICS) Security. NIST Special Publication 800-82 Revision 2. Available online: https://www.nist.gov/publications/guide-industrial-control-systems-ics-security (accessed on 30 November 2018).
  34. Patel, S.; Nazir, S.; Patel, D. Assessing and Augmenting SCADA Cyber Security—A Survey of Techniques. Comput. Secur. 2017, 70, 436–454. [Google Scholar]
  35. Cherdanseva, Y.; Burnap, P.; Blyth, A.; Eden, P.; Jones, K.; Soulsby, H.; Stoddart, K. A review of cyber security risk assessment methods for SCADA systems. Comput. Secur. 2016, 56, 1–27. [Google Scholar] [CrossRef] [Green Version]
  36. Ranathunga, D.; Roughan, M.; Nguyen, H.; Kernick, P.; Falkner, N. Case study of SCADA Firewall Configurations and the Implications for Best Practices. IEEE Trans. Netw. Serv. Manag. 2016, 13, 871–884. [Google Scholar] [CrossRef]
  37. Shaukata, N.; Alia, S.M.; Mehmooda, C.A.; Khana, B.; Jawadb, M.; Farida, U.; Ullaha, Z.; Anwarc, S.M.; Majid, M. A survey on consumers empowerment, communication technologies, and renewable generation penetration within Smart Grid. Renew. Sustain. Energy Rev. 2018, 81, 1453–1475. [Google Scholar] [CrossRef]
  38. Esther, B.P.; Kumar, K.S. A survey on residential Demand Side Management architecture, approaches, optimization models and methods. Renew. Sustain. Energy Rev. 2016, 59, 342–351. [Google Scholar] [CrossRef]
  39. Muralitharan, K.; Sakthivel, R.; Shi, Y. Multiobjective optimization technique for demand side management with load balancing approach in smart grid. Neurocomputing 2016, 177, 110–119. [Google Scholar] [CrossRef]
  40. McDaniel, P.; McLaughlin, S. Security and Privacy Challenges in the Smart Grid. IEEE Secur. Priv. 2009, 7, 75–77. [Google Scholar] [CrossRef]
  41. Li, X.; Lille, I.; Liang, X.; Lu, R.; Shen, X.; Lin, X.; Zhu, H. Securing Smart Grid: Cyber Attacks, Countermeasures, and Challenges. IEEE Commun. Mag. 2012, 50, 38–45. [Google Scholar] [CrossRef]
  42. Skopik, F.; Ma, Z. Attack Vectors to Metering Data in Smart Grids under Security Constraints. In Proceedings of the International Computer Software and Applications Conference, Izmir, Turkey, 16–20 July 2012; pp. 134–139. [Google Scholar]
  43. Wang, W.; Lu, Z. Cyber security in the Smart Grid: Survey and challenges. Comput. Netw. 2013, 57, 1344–1371. [Google Scholar] [CrossRef]
  44. Suleiman, H.; Alqassem, I.; Diabat, A.; Arnautovic, E.; Svetinovic, D. Integrated smart grid systems security threat model. Inf. Syst. 2015, 53, 147–160. [Google Scholar] [CrossRef]
  45. Mead, N.R.; Hough, E.D.; Stehney, T.R. Security Quality Requirements Engineering (SQUARE) Methodology; Proceedings of Software Engineering for Secure Systems: Building Trustworthy Applications (SESS′05): St Louis, MO, USA, 2005; pp. 15–16. [Google Scholar]
  46. Langer, L.; Skopik, F.; Smith, P.; Kammerstetter, M. From old to new: Assessing cybersecurity risks for an evolving smart grid. Comput. Secur. 2016, 62, 165–176. [Google Scholar] [CrossRef]
  47. Cadle, J.; Yeates, D. Project Management for Information System, 5th ed.; Pearson/Prentice Hall: Upper Saddle River, NJ, USA, 2008; pp. 259–272. [Google Scholar]
  48. Hubbard, D. The Failure of Risk Management: Why It’s Broken and How to Fix It; John Wiley & Sons: Hoboken, NJ, USA, 2009; p. 46. [Google Scholar]
  49. Raz, T.; Michael, E. Use and Benefits of Tools for Project Risk Management. Int. J. Proj. Manag. 2001, 19, 9–17. [Google Scholar] [CrossRef]
  50. Macgill, S.M.; Siu, Y.L. A new paradigm for risk analysis. Futures 2005, 37, 1105–1131. [Google Scholar] [CrossRef]
  51. Linstone, H.A.; Turoff, M. The Delphi Method: Techniques and Applications. Reading: Addison-Wesley Pub. Co. 2002. Available online: https://web.njit.edu/~turoff/pubs/delphibook/delphibook.pdf (accessed on 31 July 2019).
  52. Rowe, G.; Wright, G.; Bolger, F. Delphi: A re-evaluation of research and theory. Tech. Forecast. Soc. Chang. 1991, 39, 235–251. [Google Scholar] [CrossRef]
  53. Gallego, D.; Bueno, S. Exploring the application of the Delphi method as a forecasting tool in Information Systems and Technologies research. Technol. Anal. Strateg. Manag. 2014, 26, 987–999. [Google Scholar] [CrossRef]
  54. Chen, Y.T.; Hsu, C.W. The key factors affecting the strategy planning of Taiwan’s hydrogen economy. Int. J. Hydrogen Energy 2019, 44, 3290–3305. [Google Scholar] [CrossRef]
  55. Ashraf, Q.M.; Habaebi, M.H. Autonomic schemes for threat mitigation in Internet of Things. J. Netw. Comput. Appl. 2015, 49, 112–127. [Google Scholar] [CrossRef]
  56. Bhushan, B.; Sahoo, G.; Rai, A.K. Man-in-the-Middle Attack in Wireless and Computer Networking—A Review. In Proceedings of the 3rd International Conference on Advances in Computing, Communication & Automation (ICACCA), Dehradun, India, 15–16 September 2017. [Google Scholar]
  57. Kaur, G.; Behal, S.; Shifali, C. An Information Divergence Based Approach to Detect Flooding DDoS Attacks and Flash Crowds. In Proceedings of the 3rd International Conference on Applied and Theoretical Computing and Communication Technology (iCATccT), Tumkur, India, 21–23 December 2017. [Google Scholar]
  58. Somani, G.; Gaur, M.S.; Sanghi, D.; Conti, M.; Buyya, R. DDoS attacks in cloud computing: Issues, taxonomy, and future directions. Comput. Commun. 2017, 107, 30–48. [Google Scholar] [CrossRef] [Green Version]
  59. Jick, T.D. Mixing Qualitative and Quantitative Methods: Triangulation in Action. Adm. Sci. Q. 1979, 24, 602–611. [Google Scholar] [CrossRef]
  60. Denzin, N. Sociological Methods: A Sourcebook, 5th ed.; Transaction Publishers: Piscataway, NJ, USA, 2006. [Google Scholar]
  61. Yeasmin, S.; Rahman, K.F. Triangulation research method as the tool of social science research. BUP J. 2012, 1, 154–163. [Google Scholar]
Figure 1. The proposed I-SERM process.
Inventions 04 00053 g001
Figure 2. The TBS+r for DFD Process.
Inventions 04 00053 g002
Figure 3. The TBS+r for DFD Data Store.
Inventions 04 00053 g003
Figure 4. The TBS+r for DFD Data Flow and DFD External Entity, respectively.
Inventions 04 00053 g004
Figure 5. Different linear equations of different Impact and Probability weighting ratios.
Inventions 04 00053 g005
Figure 6. The process of constructing a SG framework.
Inventions 04 00053 g006
Figure 7. The suggested SG framework.
Inventions 04 00053 g007
Figure 8. The ISTM process for the ELB practice.
Inventions 04 00053 g008
Figure 9. The DFD for the ELB practice.
Inventions 04 00053 g009
Figure 10. The adopted TBS+r for the ELB practice.
Inventions 04 00053 g010
Figure 11. The ISTM result of the ELB practice.
Inventions 04 00053 g011
Table 1. Comparison of STRIDE, LINDDUN and STRIDE+p threats.
Threat TypeSTRIDELINDDUNSTRIDE+p
DFD Element STRIDELINDDUNSTRIDE
Process
Data Flow
Data Store
External Entity
Note. √ means that the specified DFD element has the corresponding threat type.
Table 2. The IST evaluation scores for DFD External Entity of the ELB practice.
RFD External EntityE1E2
IST IPIP
Man-in-the-middle
(MITM) attack
0.710.640.330.22
Replay attack0.640.580.600.66
ARP spoofing0.330.300.730.66
Phishing0.680.660.380.27
Malware0.560.590.390.20
Attack to log file0.670.560.690.70
Table 3. The IST evaluation scores for DFD Data Flow of the ELB practice.
DFD
Data Flow
f1.1f1.2f2.1f2.2f2.3f2.4f2.5
IST IPIPIPIPIPIPIP
Man-in-the-middle
(MITM) attack
0.740.690.790.710.680.670.730.710.740.690.720.660.680.71
SQL injection0.310.170.490.440.260.190.510.470.310.170.460.430.370.28
ARP spoofing0.600.590.630.590.630.590.620.540.600.590.620.590.580.58
Sinkhole attack0.600.340.360.220.490.340.400.300.600.340.360.340.400.34
Stuxnet worm0.490.380.450.380.460.390.480.350.490.380.480.420.490.51
Eavesdropping0.780.740.760.670.640.580.700.640.780.740.740.720.740.68
Cross-site scripting0.230.260.260.280.290.200.280.200.230.260.320.240.280.22
Phishing0.480.450.480.460.340.280.290.280.480.450.340.360.340.34
Clickjacking0.270.200.290.300.250.280.490.430.270.200.460.410.520.46
DoS attack0.520.460.580.520.600.380.580.470.520.460.630.470.590.47
Hello flood0.280.260.490.330.290.220.290.280.280.260.290.320.290.24
DDoS attack0.630.590.670.600.670.470.590.550.630.590.630.540.630.54
Continuous
DFD
Data Flow
f3.2f4.2f5.2f6.2f7.2f7.3f9.2
IST IPIPIPIPIPIPIP
Man-in-the-middle
(MITM) attack
0.600.510.600.510.730.690.680.660.640.670.640.620.640.56
SQL injection0.310.200.310.200.450.360.430.370.380.410.440.350.440.43
ARP spoofing0.500.450.500.450.620.610.620.650.580.590.580.540.540.52
Sinkhole attack0.440.300.440.360.500.390.450.340.540.480.530.480.500.31
Stuxnet worm0.540.240.600.360.600.480.640.580.590.520.640.520.560.39
Eavesdropping0.650.600.510.550.660.640.660.680.430.480.430.480.320.42
Cross-site scripting0.250.250.250.250.260.260.220.220.190.200.190.200.220.18
Phishing0.500.390.360.300.310.220.240.220.250.320.250.320.460.26
Clickjacking0.350.250.350.250.240.200.220.180.220.240.260.280.240.21
DoS attack0.560.460.650.510.630.570.590.570.710.550.660.540.660.57
Hello flood0.500.450.550.450.380.320.340.350.420.360.460.440.360.31
DDoS attack0.710.650.750.610.680.670.730.670.740.650.700.610.720.63
Table 4. The IST evaluation scores for DFD Data Store of the ELB practice.
DFD Data StoreD1D2D3
IST IPIPIP
Man-in-the-middle
(MITM) attack
0.220.160.180.200.220.20
SQL injection0.730.710.680.670.730.76
ARP spoofing0.300.200.300.240.260.20
Sinkhole attack0.490.380.490.380.400.33
Stuxnet worm0.400.430.440.430.400.39
Eavesdropping0.200.220.200.220.160.18
Cross-site scripting0.220.120.130.120.180.16
Phishing0.440.480.520.480.410.36
Clickjacking0.200.220.200.220.160.17
DoS attack0.380.380.380.380.540.54
Hello flood0.320.280.310.270.310.27
DDoS attack0.640.640.550.640.640.64
Table 5. The IST evaluation scores for DFD Process of the ELB practice.
DFD Process1.02.03.04.05.06.07.08.09.0
IST IPIPIPIPIPIPIPIPIP
MITM
attack
0.670.650.660.650.620.610.620.610.620.610.630.650.660.580.580.570.620.58
Replay attack0.720.670.720.710.640.660.600.670.640.620.640.620.600.580.560.580.620.66
ARP spoofing0.670.720.670.720.660.630.620.590.670.680.670.630.660.590.620.590.660.65
Phishing0.380.340.420.340.220.180.220.190.260.260.340.290.220.220.270.220.260.24
Malware0.350.380.350.380.220.210.270.250.270.330.310.250.220.250.230.210.230.26
SQL injection0.760.770.710.730.650.600.620.570.580.520.510.520.650.620.620.600.580.52
Sinkhole attack0.450.410.450.390.510.490.490.450.490.440.490.450.490.490.500.490.510.45
Stuxnet worm0.530.510.530.460.690.730.640.610.690.620.640.620.640.580.600.580.710.63
Attack to log file0.270.180.310.230.440.450.410.360.420.440.480.380.430.400.450.360.410.33
Eavesdropping0.580.560.580.520.620.520.570.440.620.390.580.510.580.440.540.400.640.42
Cross-site scripting0.420.400.410.390.250.240.210.180.250.240.250.240.250.190.250.190.250.17
Click-jacking0.400.420.440.420.230.180.280.260.320.220.320.310.240.170.190.220.210.23
DoS attack0.560.580.640.580.600.660.560.580.640.660.640.620.560.620.600.580.580.70
Hello flood0.310.340.350.380.350.370.370.390.340.370.340.380.380.370.390.420.340.30
DDoS attack0.760.690.810.730.840.810.800.760.790.720.680.640.810.810.880.800.820.76

