Patent Summary

Chronometric Quantitation of Analytes in Paper-Based Microfluidic Devices (MicroPADs) via Enzymatic Degradation of a Metastable Biomatrix

by
Aditya R. Jangid
1,†,
E. Brandon Strong
1,†,
Emiliano Escamilla
1,
Brittany A. Lore
1,
Nicholas J. Tod
1,
Robert Thiel
1,
Andres W. Martinez
2 and
Nathaniel W. Martinez
1,*
1
Department of Biological Sciences, California Polytechnic State University, San Luis Obispo, CA 93407, USA
2
Department of Chemistry & Biochemistry, California Polytechnic State University, San Luis Obispo, CA 93407, USA
*
Author to whom correspondence should be addressed.
These authors contributed equally to this work.
Inventions 2019, 4(3), 48; https://doi.org/10.3390/inventions4030048
Submission received: 30 June 2019 / Revised: 10 August 2019 / Accepted: 15 August 2019 / Published: 21 August 2019
(This article belongs to the Special Issue Microfluidic Devices)

Abstract

:
The following article summarizes United States Patent Application No. US20180052155A1, titled ‘Assay Devices and Methods’ (filed 16 August 2016, published 22 February 2018). While lateral flow assays (LFAs) have revolutionized point-of-care diagnostics by enabling accurate, inexpensive, and rapid detection of biomarkers, they typically do not provide quantitative results. Hence, there is a significant need for quantitative assays at the point of care. This patent summary describes a novel method of chronometric biomarker quantitation via enzymatic degradation of a metastable gelatin-based biomatrix, principally suited for use in paper-based microfluidic devices (microPADs). This new quantitation mechanism was designed to meet the ASSURED criteria for point-of-care diagnostic devices laid forth by the World Health Organization and may ultimately provide increased access to healthcare, at a significantly reduced cost, around the world.

Graphical Abstract

1. Introduction

According to the World Health Organization (WHO), in 2010 an estimated 97 million individuals in low and middle-income nations were forced into severe poverty through healthcare spending, and in 2013, 400 million people worldwide lacked access to essential health services [1,2]. It has become evident that providing inexpensive and accessible healthcare alternatives is of paramount importance toward improving the quality of life in these demographics [3]. To this end, a critical first step is the development of cost-effective diagnostic devices for the accurate and timely diagnosis of diseases, as well as initiation of treatment and patient monitoring [4,5,6]. Point-of-Care (POC) diagnostic devices, an important subclass of diagnostic technologies, are ideally suited for use in low and middle-income countries as they are typically both cost-effective and accessible to a wide range of users [3]. The WHO outlines the ASSURED criteria to guide the design of all POC diagnostics: affordable, sensitive, specific, user-friendly, rapid and robust, equipment free, and deliverable to end users [7]. This patent application describes a paper-based POC diagnostic device principally suited for the quantitative analysis of biomarkers of interest, while also being designed to meet the ASSURED criteria.
Arguably the most ubiquitous POC diagnostic device is the lateral flow assay (LFA, also known as a lateral flow immunochromatographic assay), which is composed of overlapping layers of glass fiber paper, a nitrocellulose membrane, and a paper absorbent pad [8,9]. LFAs were first developed in the 1960s, and subsequently commercialized in the 1980s as inexpensive, robust, and reliable diagnostic modalities for the rapid binary detection of biomarkers in fluidic samples [10,11,12]. They are also widely accepted by end users and regulatory agencies [9]. The classic example of an LFA is the home pregnancy test, which has revolutionized women’s health by promoting healthcare privacy and independence. While these tests provide simple binary results that are easily interpreted by end-users, they are typically not useful for applications that require quantitative results.
In response to the need for quantitative POC assays, microfluidic paper-based analytical devices (microPADs) emerged in the late 2000s, and have since gained in popularity over the past decade on account of their low-cost, portability, and ease-of-use [13,14,15,16]. MicroPADs are typically fabricated by patterning a piece of paper with hydrophobic wax to control the flow of fluid through the porous medium via capillary action [13,14,15,16,17,18]. This increased fluid control (as compared to LFAs) allows for more complex assays to be performed on paper (i.e., multiplexed, multi-step, and/or in-series assays) [14,19,20], and many techniques have been developed for quantifying the results of these assays [21,22,23,24,25]. By far the most common quantitation technique has been the use of enzymatically- or chemically-activated colorimetric indicators, which produce a color intensity that can be correlated with analyte concentration [21,22]. The color intensity on a microPAD can be analyzed by cell phone applications for simple telemedicine. However, variations in color intensity can sometimes be difficult to distinguish and differentiate on paper, even when using image color analysis software [22], therefore alternative microPAD quantitation techniques are also necessary (e.g., chemiluminescence, fluorescence, and electrochemical) [26,27,28,29,30]. With the rapid advancement of electronics and electrode deposition techniques on paper, electrochemical microPADs (ePADs) are emerging as one of the most popular forms of quantitative analysis [29,30], and have been used for measuring heavy metals [31], environmental chemicals [32], metabolites [33,34,35,36], DNA [37], and proteins [38,39,40,41]. While ePADs are a promising platform for rapid, quantitative analysis at the point of care, they can still be difficult to utilize in low-resource settings due to complex fabrication techniques, use of external equipment (e.g., potentiostat, power supply), or additional input by trained personnel [42].
The Phillips group at Pennsylvania State University introduced the concept of using time as the signal for an assay [43,44]. Specifically, they demonstrated that the time it took for a liquid sample to wick across a channel in a microPAD could be correlated to the concentration of analyte in the sample—The channel contained a hydrophobic oligomer that would react with the analyte, depolymerize, and become hydrophilic, thus allowing fluid to wick across the channel at a rate proportional to the concentration of analyte [45]. Time is a convenient signal for POC diagnostics because it can be measured easily with a watch, and relative differences in time can be observed directly without the need for any additional equipment. Using this approach, the Phillips group demonstrated the quantitative measurement of femtomolar concentrations of analyte [46,47].
The purpose of this patent summary is to detail a new method of chronometric (i.e., time-dependent) quantitation on microPADs via enzymatic degradation of a metastable gelatin-based biomatrix as outlined in the US patent application no. US20180052155A1, as well as discuss the potential importance of this innovation with regard to global health. With millions of individuals and families in under-served communities lacking access to basic healthcare, diagnostic devices like the one presented herein could help bring rapid quantitative analysis of biomarkers to these point-of-care settings and empower end-users in resource limited areas to take charge of their health.

2. Highlights

This patent summary describes a method for the quantitative analysis of biomarkers using time as the signal for the assay. The assay relies on the enzymatic degradation of a metastable gelatin-based biomatrix. The time it takes for an indicator dye to appear on the device can be readily correlated to concentration of analyte with a pre-established standard concentration curve. This technology is principally suited for use in paper-based microfluidic devices (microPADs).

3. Methods

MicroPADs are fabricated on cellulose chromatography paper (Whatman no. 1) via wax printing [17]. Reagents are applied to individual layers of the device and dried under ambient conditions (~25 °C). The simplest version of the microPAD requires three reagents in sequential layers: Layer 1—Trypsinogen (zymogen), Layer 2—Gelatin (biomatrix), and Layer 3—Red dye (indicator). Unassembled devices are vacuum-sealed and stored at room temperature. Prior to use, the devices are removed from the plastic storage bag and the layers are stacked to create 3D flow-through channels bounded by hydrophobic wax barriers. The assembled devices are placed in a plastic cassette to hold the layers of paper in contact with each other during the assay. To perform an assay, 15 µL of sample is added to the loading zone of the device, and the time it takes for red dye to appear in the readout well is recorded.

4. Quantitative MicroPAD Overview

4.1. Quantitation Mechanism

A simple microPAD is diagrammed to demonstrate the quantitation mechanism (Figure 1). In this device, trypsinogen (i.e., zymogen/pro-enzyme) is spotted and dried in zone/layer 1. Gelatin is spotted and dried downstream of the zymogen in zone/layer 2, creating a metastable gelatin-based biomatrix that impedes fluid flow. A sample containing enterokinase (i.e., an activator enzyme for trypsinogen) is applied to zone/layer 1. Upon addition of enterokinase, the dried trypsinogen is converted to active trypsin (a non-specific serine protease). Activated trypsin is autocatalytic, thereby initiating a protease amplification cascade in zone/layer 1. Trypsin then cleaves the gelatin biomatrix, thereby allowing fluid from zone/layer 1 to travel past zone/layer 2 and into zone/layer 3 at a rate that is proportional to the concentration of the initial activator enzyme. Time is measured between the addition of the activator enzyme and the arrival of fluid in zone/layer 3 (fluid can be readily tracked with indicator dyes). Addition of increased enterokinase concentrations to zone/layer 1 results in accelerated biomatrix degradation and a faster time of fluid arrival to zone/layer 3 (Figure 1C). The limit of detection for this quantitation mechanism is approximately 5 femtomoles (15 μL of sample applied; Figure 1C). Using an enterokinase standard concentration curve, assay run time could be correlated to the analyte concentration. This allows time (a readily measurable unit) to become the quantitative variable for this device, effectively replacing the need for quantitation mechanisms such as enzymatically-activated colorimetry, electrochemical detection, or chemiluminescence.

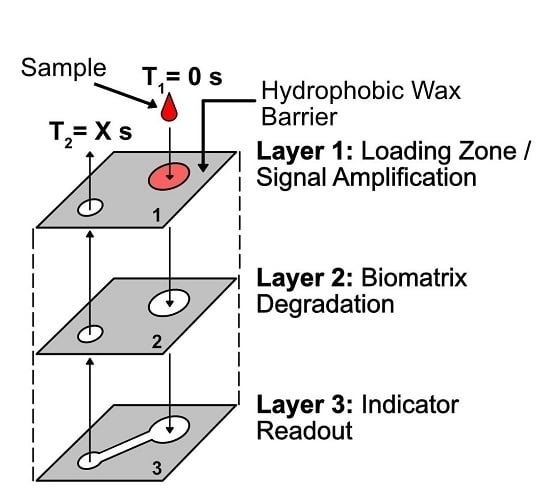
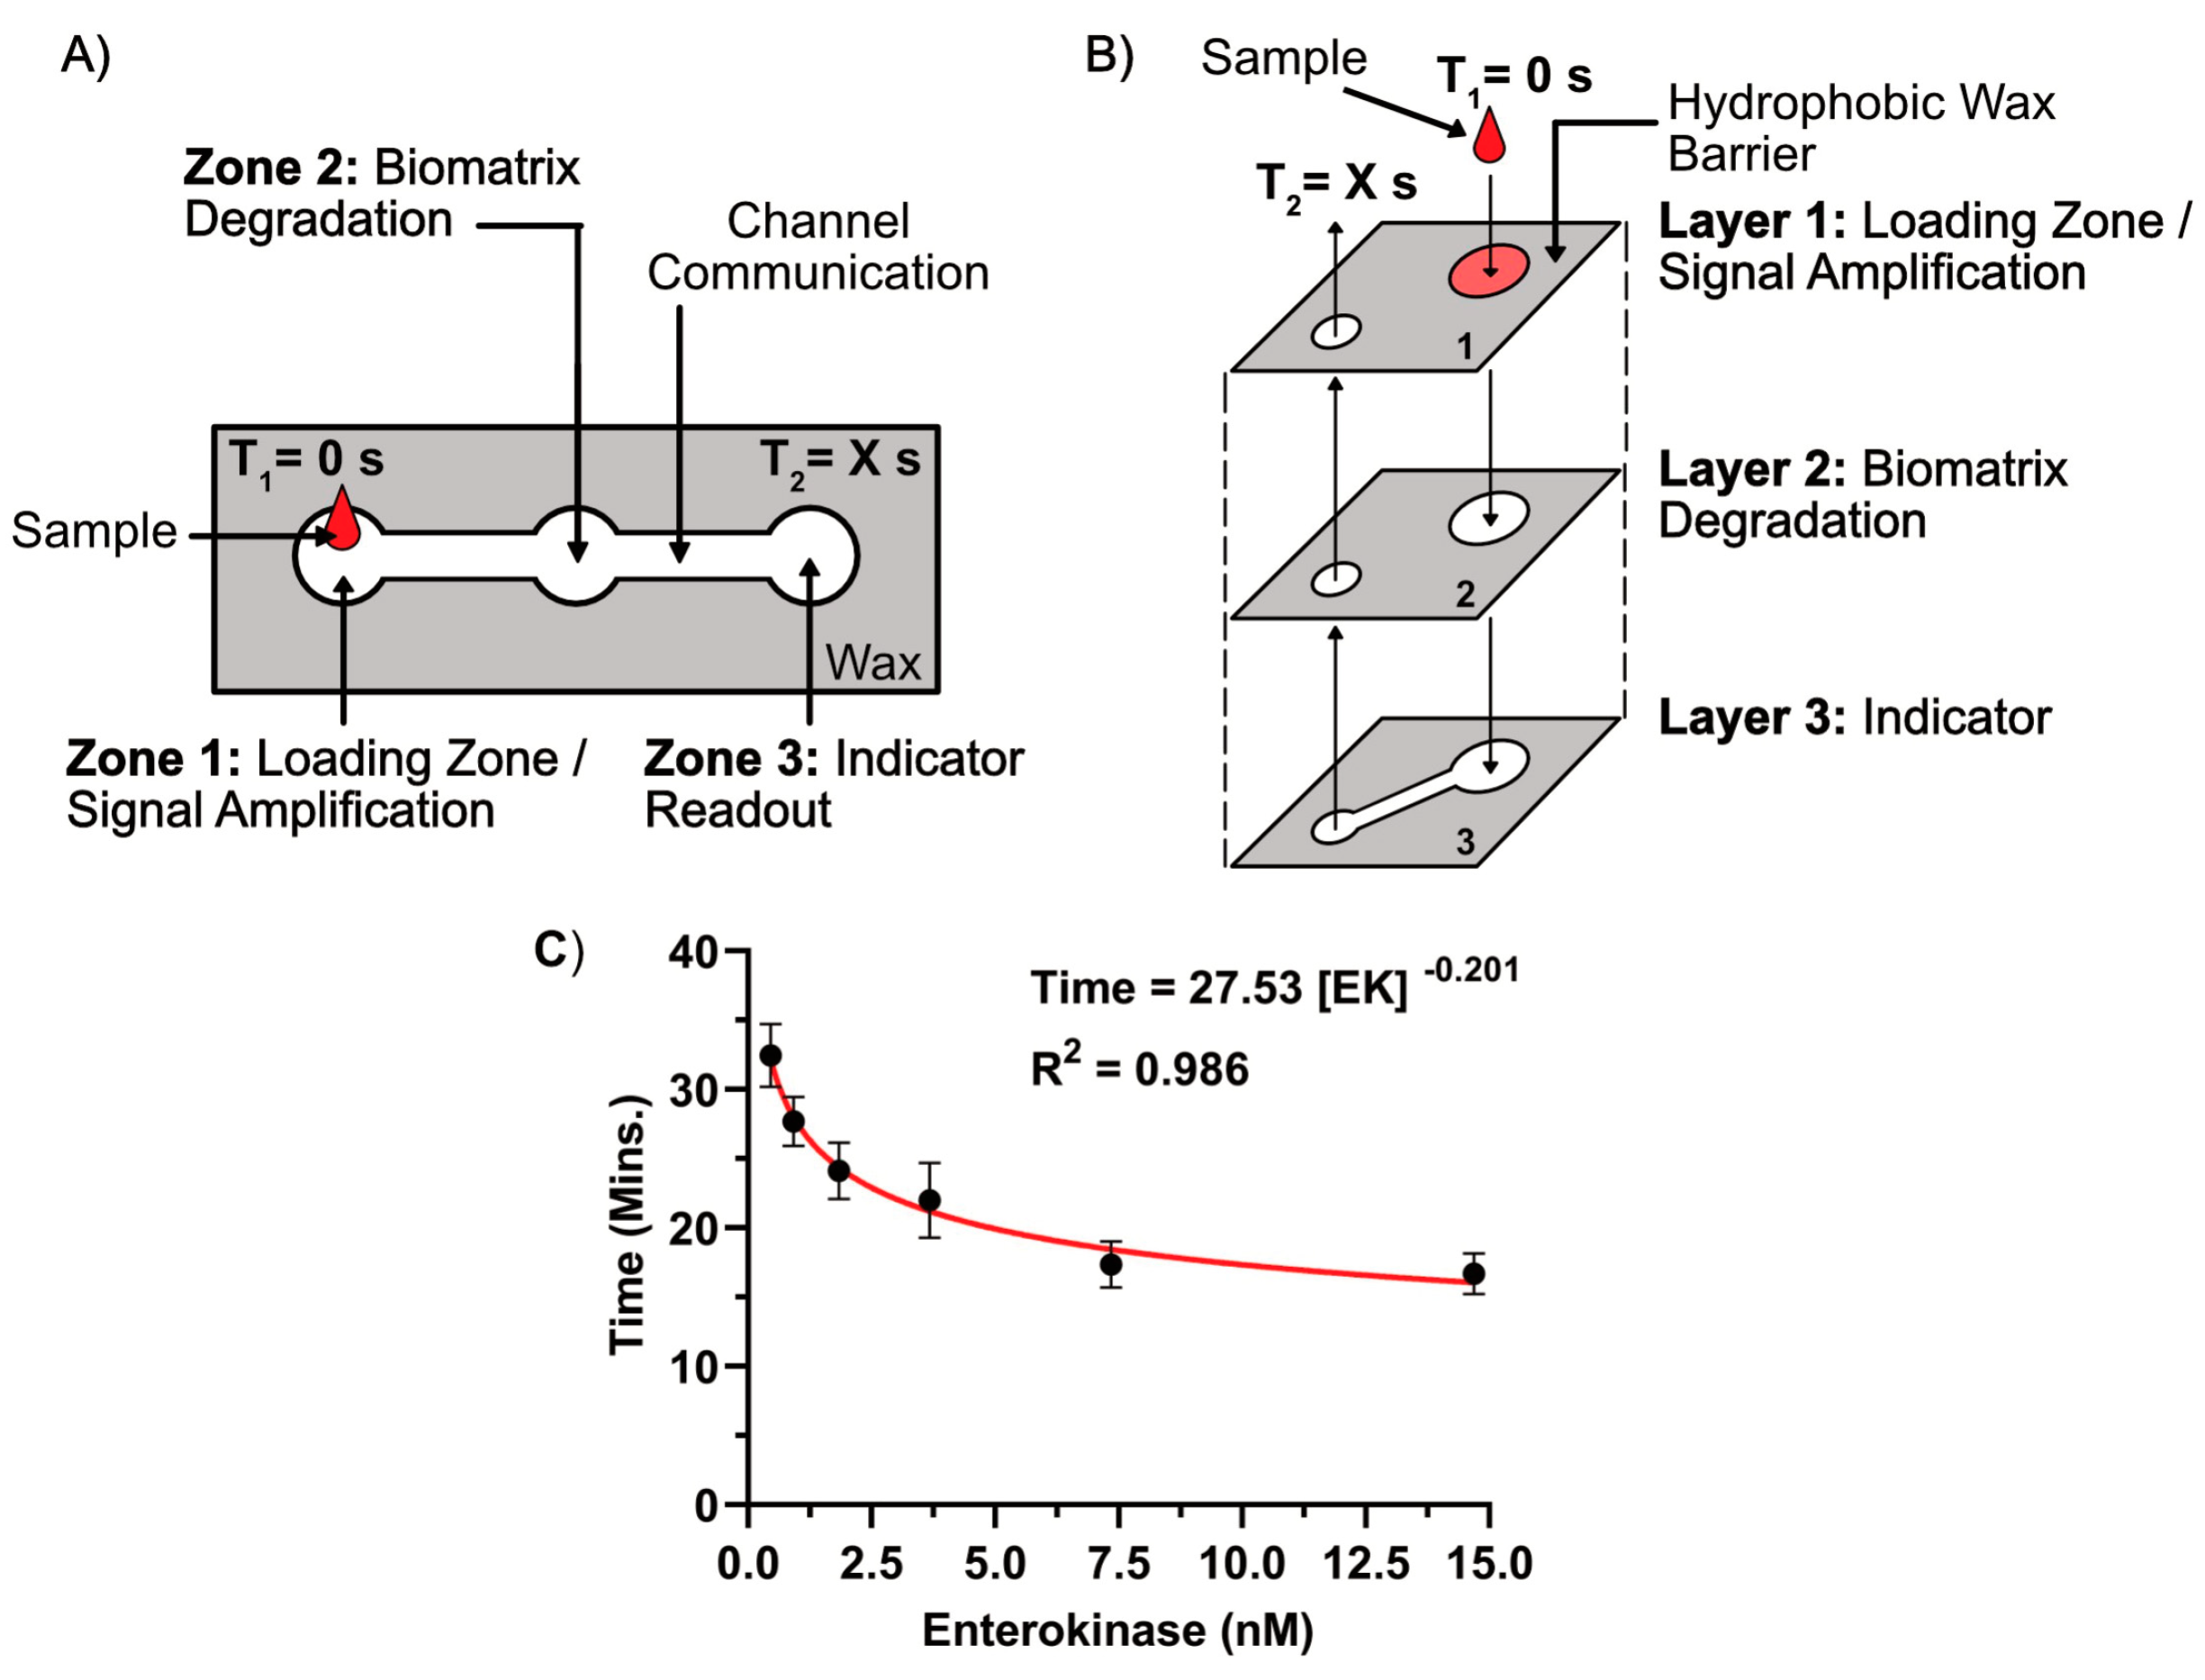
4.2. MicroPAD with Integrated Chronometric Quantitation

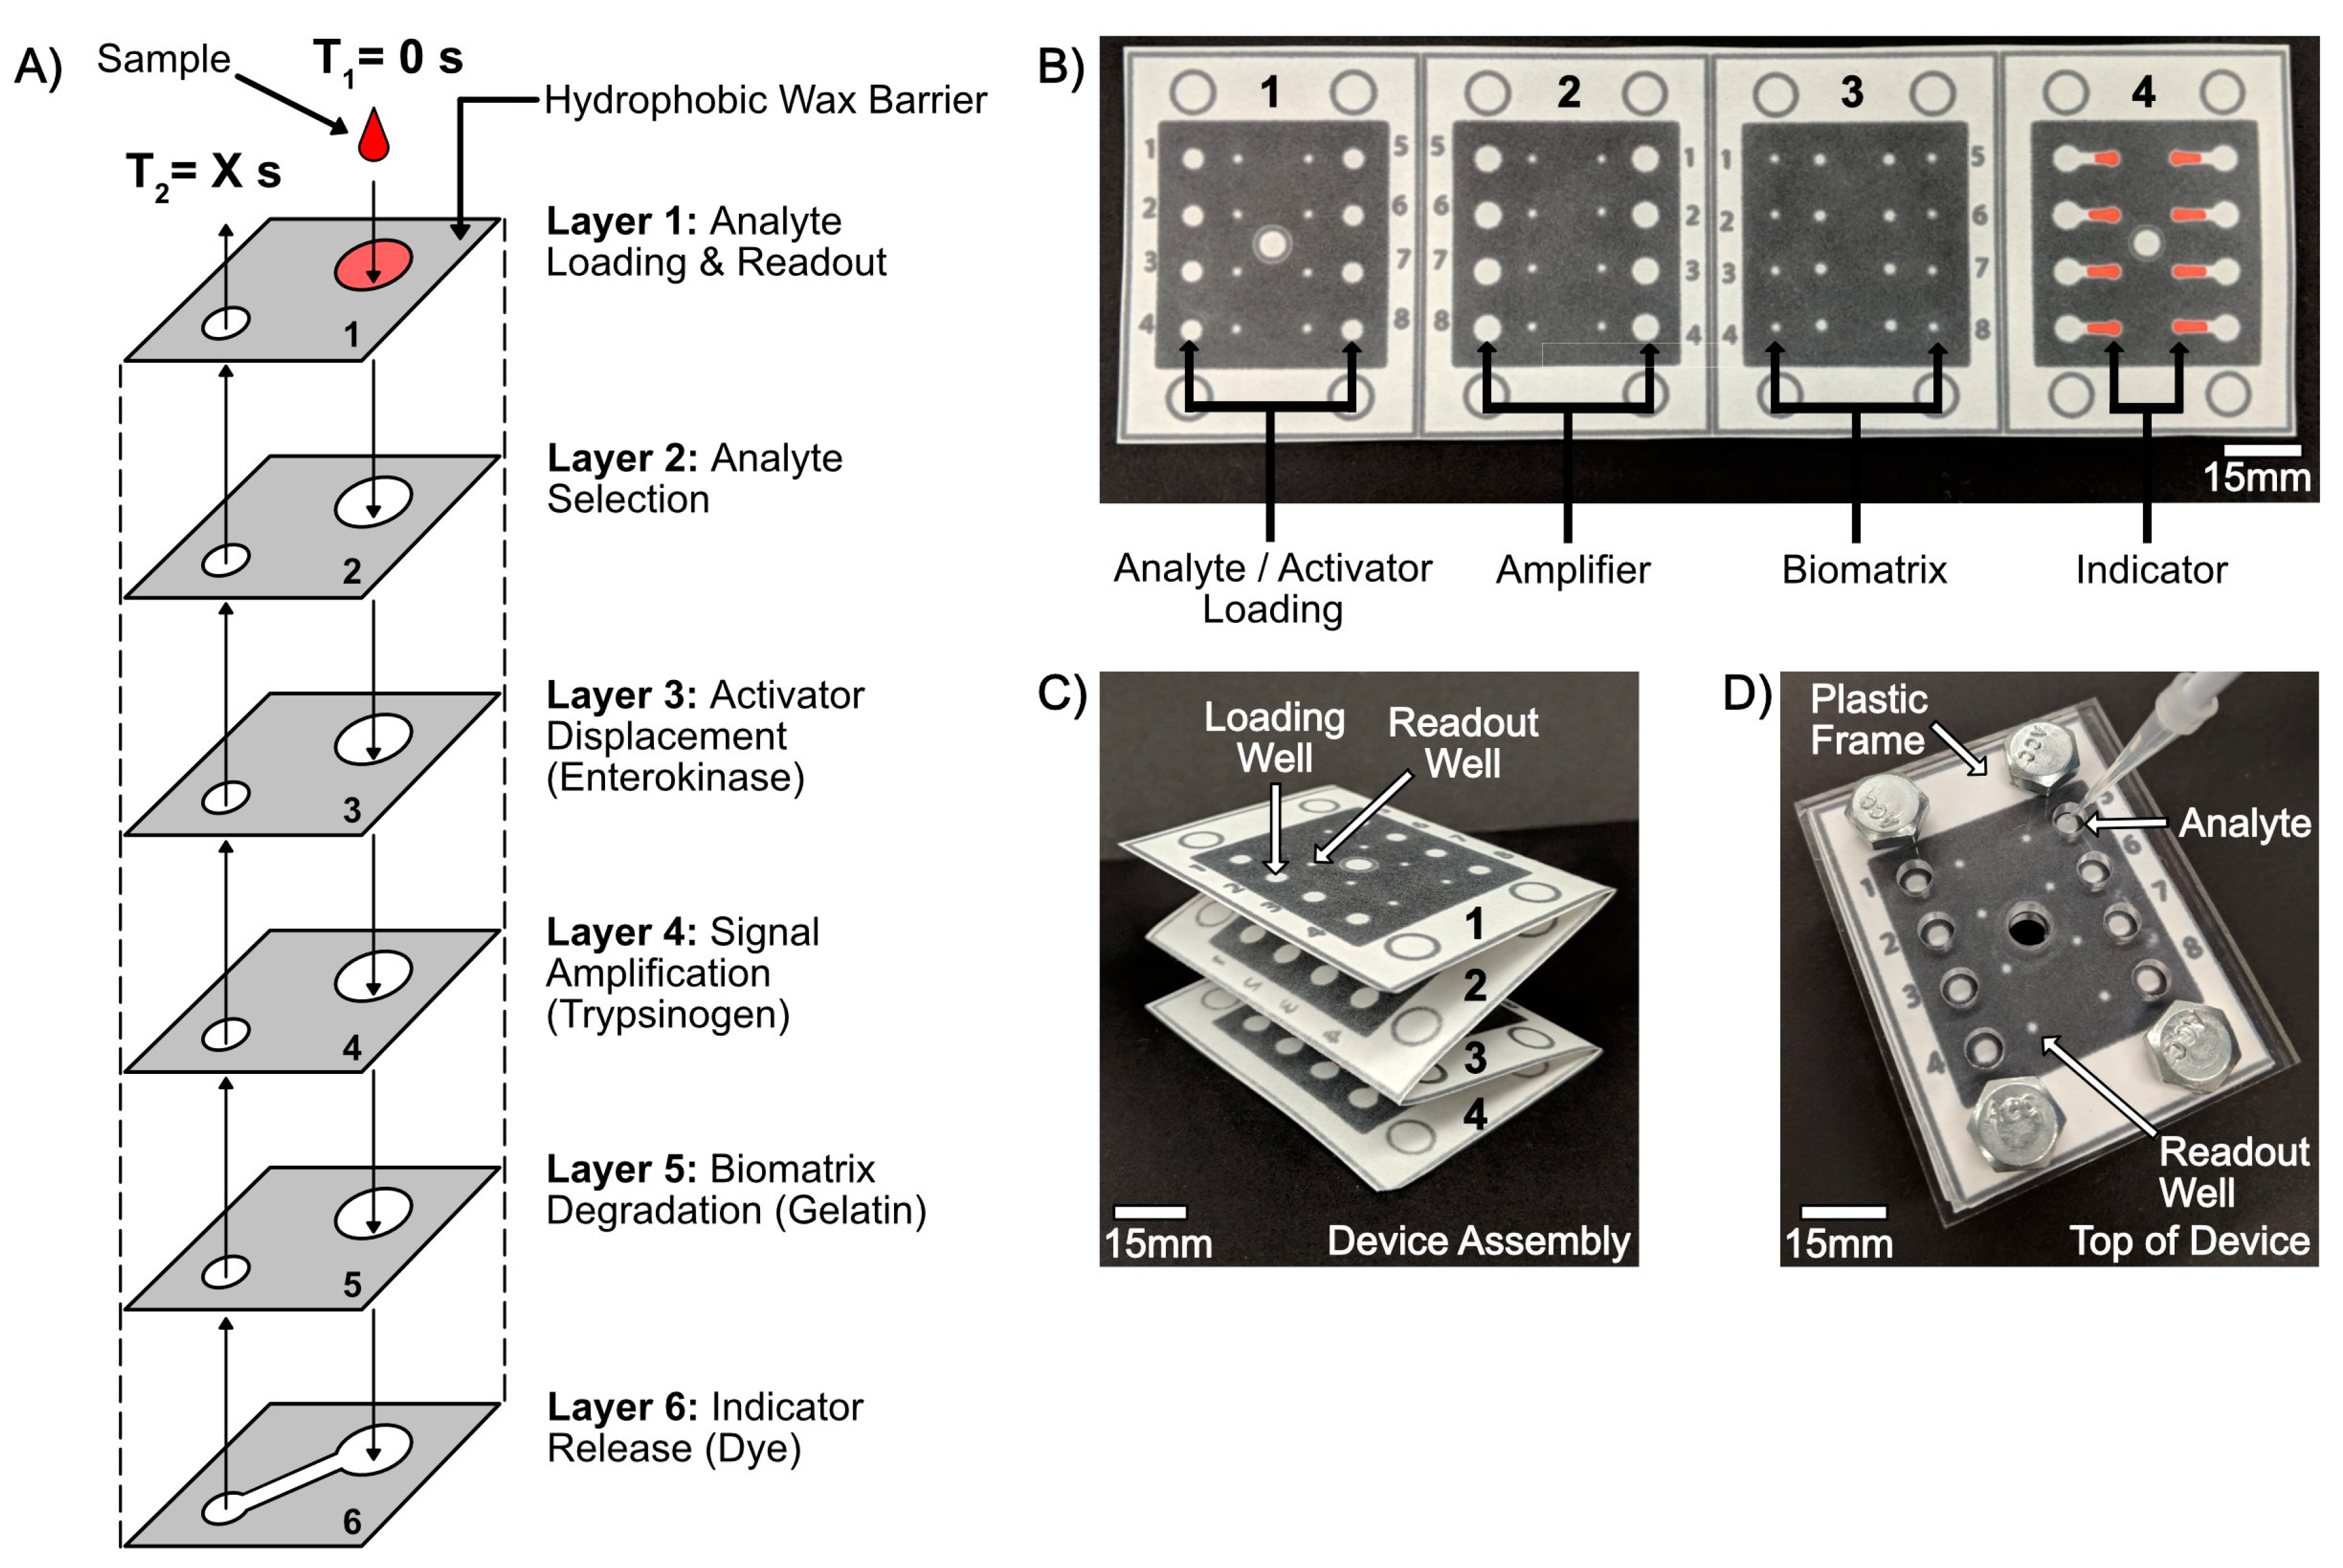
4.2.1. Overview of Device Design and Mechanism

To translate the chronometric quantitation mechanism into a functional POC device, a fully integrated microPAD is required. The device requires 4 to 6 layers (Figure 2), dependent on the complexity of analyte capture and detection. Devices are fabricated as described above, and could include additional layers for selection, isolation, and competition of the sample analyte. In one proposed version of the device (Figure 2A), Layer 1 houses no biologically active molecules and serves as a sample loading zone (T1 = 0 s) and visual read-out zone (T2 = Xs). The sample analyte is selected and competed for in Layers 2 and 3, initiating a proteolytic cascade in Layers 3 and 4, which results in the enzymatic degradation of the metastable biopolymer on Layer 5. Degradation of the biopolymer allows for fluid passage through Layer 5, resulting in the return of the indicator dye, found on Layer 6, back to Layer 1 at the top of the device, thereby completing the assay.

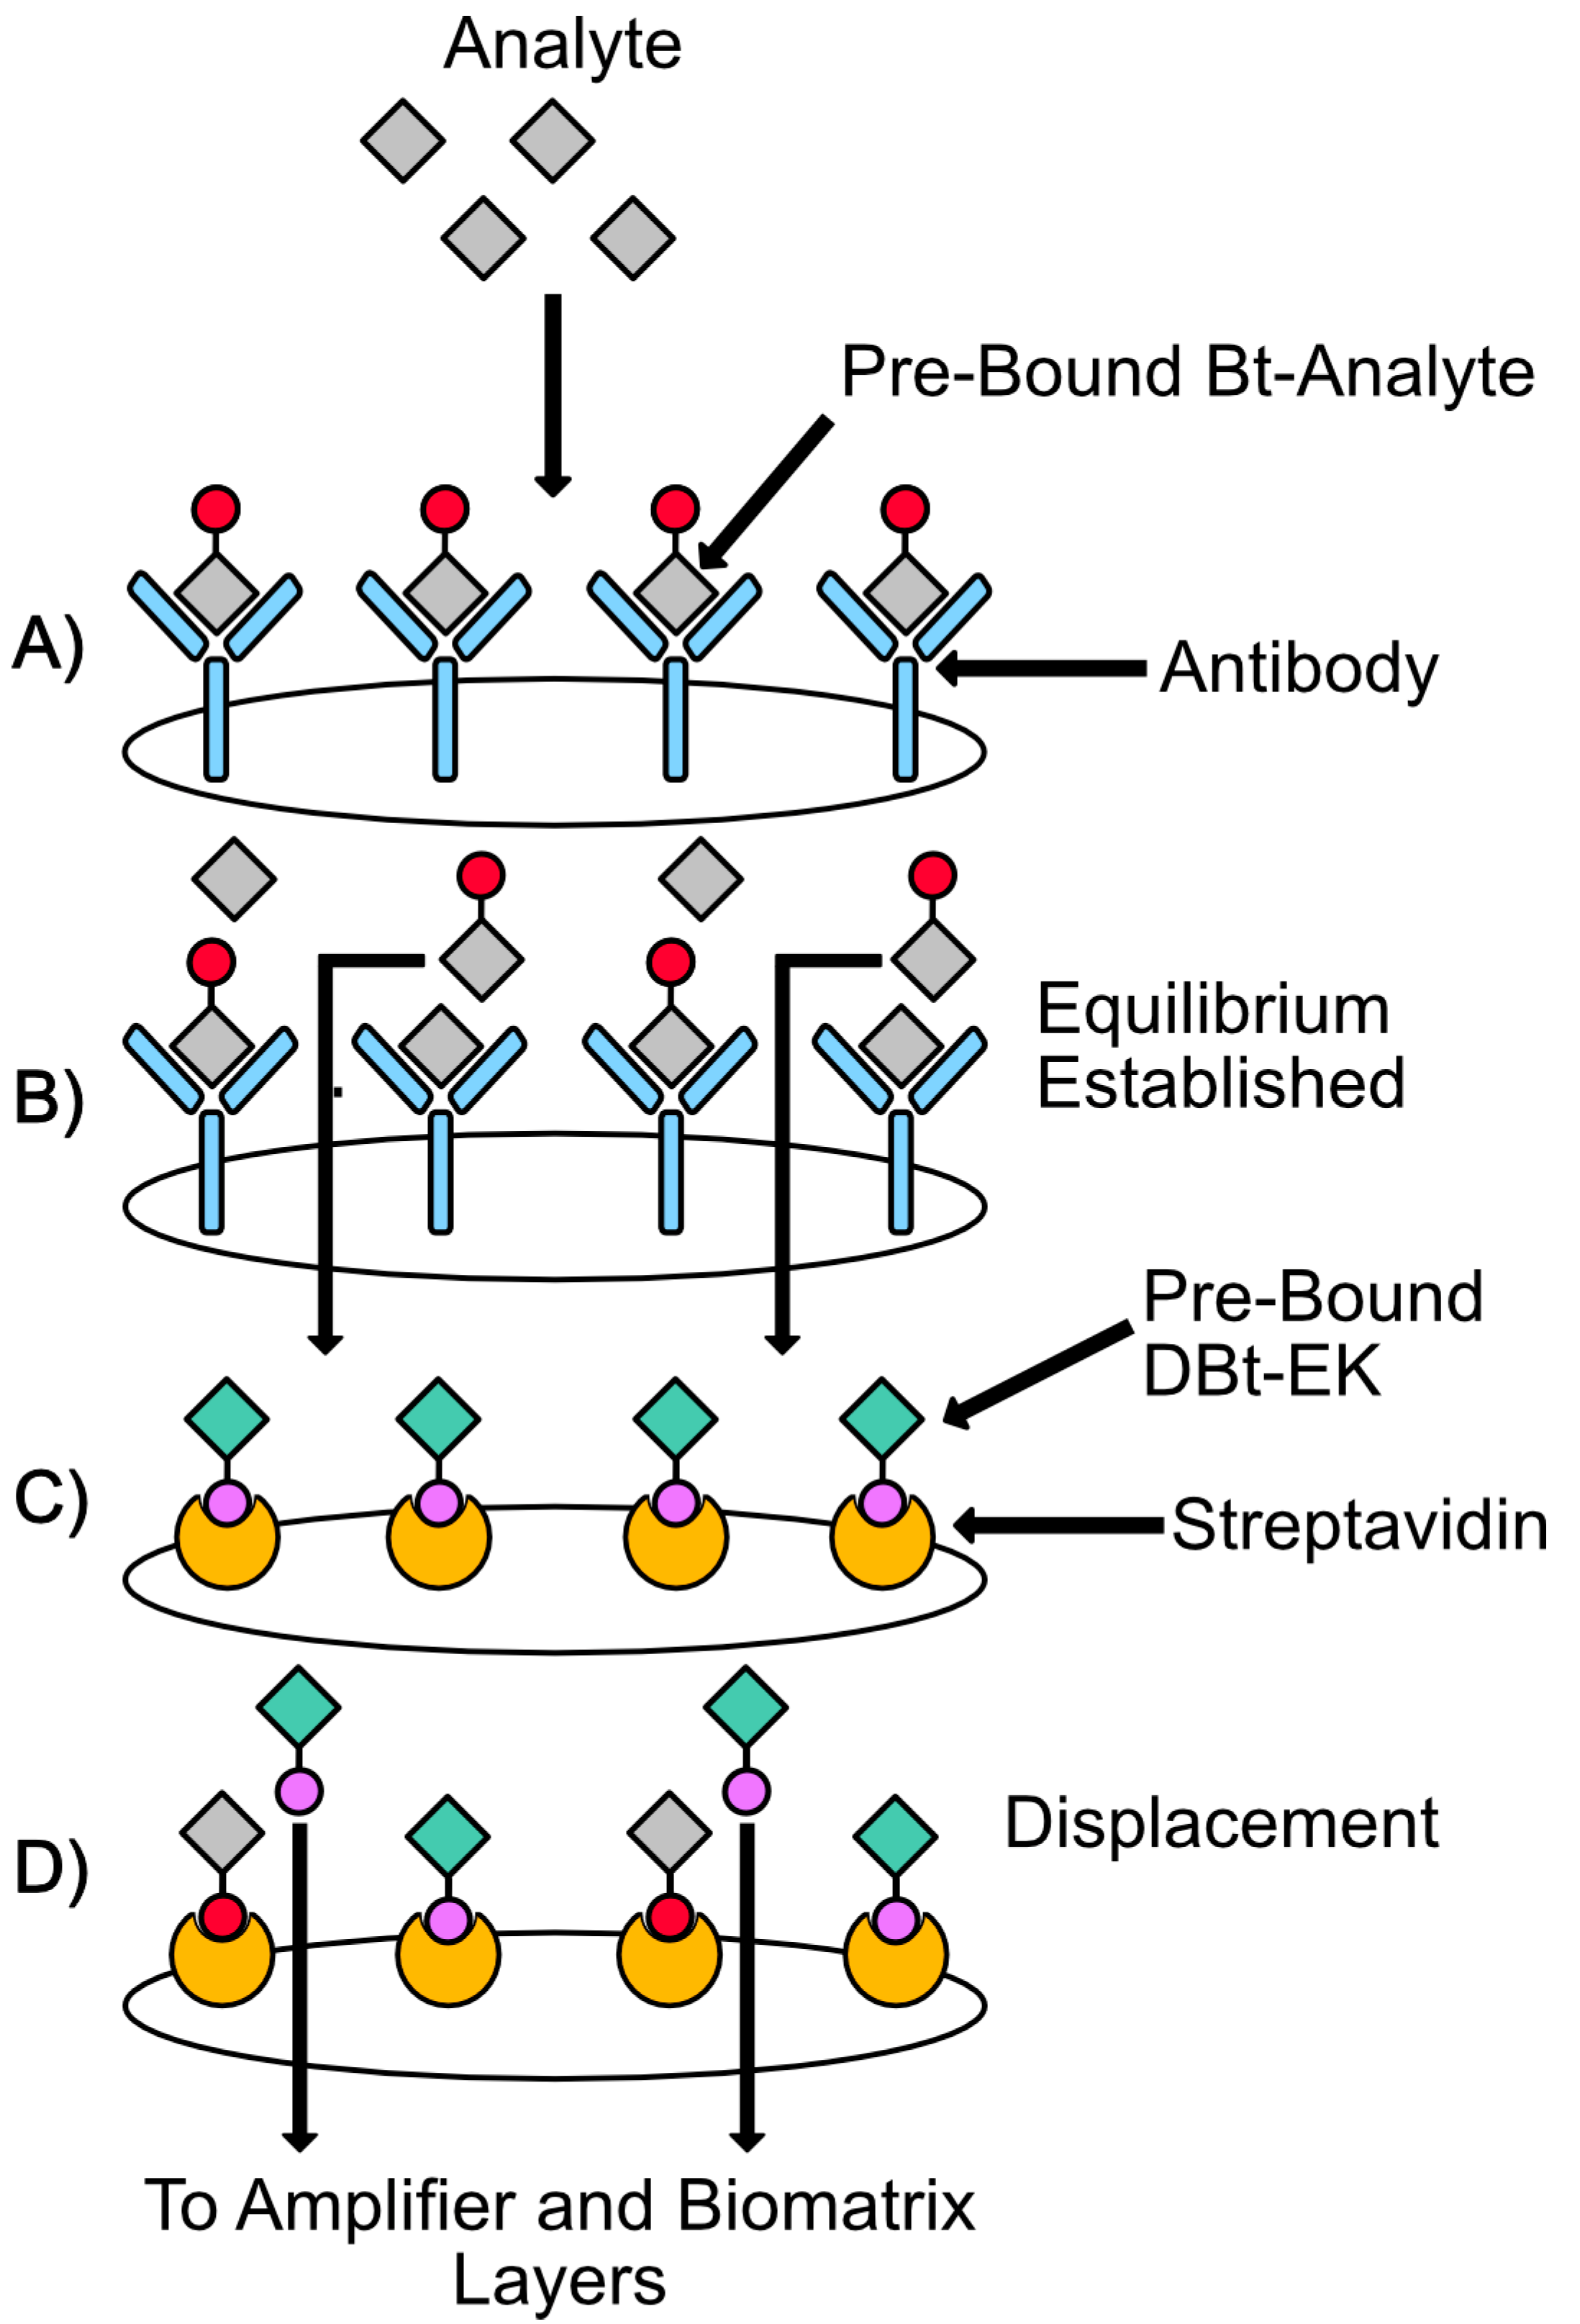
4.2.2. Overview of Analyte Selection, Isolation, and Competition

Layer 1, Analyte loading and readout: This top layer serves as the analyte loading zone and as the device readout (Figure 2A).
Layer 2, Analyte selection and competition: This layer is comprised of biotinylated (Bt) analyte molecules that are pre-bound to anti-analyte antibodies and dried on the device (Figure 3A). When a sample with free analyte is introduced to the device (Figure 3A), it competes for the Bt-analyte bound antibody binding sites, displacing the Bt-analyte (Figure 3B). Equilibrium is reached based upon the initial sample analyte concentration.
Layer 3, Activator competition and displacement: This layer is comprised of desthio-biotinylated (DBt) Enterokinase (activator) bound to a support of streptavidin immobilized on the device (Figure 3C). Bt-analyte displaced from layer 2 (Figure 3B) competes with and displaces DBt-Enterokinase (Streptavidin-Bt Affinity: Kd ~1 × 10⁻¹⁴ mol/L, Streptavidin-DBt Affinity: Kd ~1 × 10⁻¹¹ mol/L; Figure 3C,D). Free enterokinase can then initiate the protease amplification loop (Section 4.1).

4.2.3. Overview of the Biomatrix Degradation and Chronometric Quantitation

Layer 4, Proteolytic enzyme amplification: This layer is comprised of the dried zymogen, trypsinogen. Enterokinase displaced from layer 3 initiates the enzymatic activation of trypsinogen to trypsin. The proteolytic trypsin is autocatalytic, resulting in a serine protease amplification loop (Figure 2A).
Layer 5, Biomatrix degradation: Fluid flow through the device is blocked by the metastable gelatin biomatrix dried on this layer (Figure 2A). Passage of fluid is only achieved upon degradation of the biomatrix. Activated trypsin from layer 4 results in the proteolytic degradation of the biomatrix in a concentration-dependent manner.
Layer 6, Indicator release and analyte quantitation: An indicator dye is dried on this final layer and serves as a visual cue for the degradation of the biomatrix and fluid flow through the device. Arrival of the indicator dye back to layer 1 (T2 = Xs) concludes the assay. Quantitation of analyte is achieved by correlating the sample time of passage to a chronometric standard curve.

5. Main Patent Claims

5.1. Claim 1

A device comprised of an analyte loading zone, an activator (e.g., enterokinase), which could be displaced by an analyte, an amplifier (e.g., trypsinogen) that is activated by the activator, a biomatrix barrier (e.g., gelatin) that is degraded/modified by the activated amplifier (e.g., trypsin), and an indicator (e.g., dye) that is used to determine the analyte concentration.

5.2. Claims 2 and 3

Selection of the analyte and/or displacement of the activator (Figure 2A, layer 2/3) could occur off-platform, and might involve the use of non-covalent interactions (e.g., streptavidin-biotin interaction).

5.3. Claims 4 and 5

The activator might be an enzyme, including enterokinase, or another reagent that activates the amplifier.

5.4. Claims 6–8

The amplifier might be a zymogen, including trypsinogen, or another reagent that becomes activated through interaction with the activator (e.g., enterokinase converts trypsinogen into trypsin).

5.5. Claims 9 and 10

The activator (e.g., enterokinase) might be bound to magnetic beads, which might then be affixed to the device via printed magnetic toner. This feature was not discussed in this patent summary. Please see the patent application publication for further details.

5.6. Claims 11 and 12

The biomatrix layer is composed of an aqueous impermeable (or semipermeable) biopolymer. This biopolymer may be gelatin, chitosan, alginate, agar, or agarose.

5.7. Claims 13 and 14

All assay components (i.e., loading zone, activator, amplifier, biomatrix, and indicator), or some combination thereof, are fabricated on paper (or other porous membrane) layers. These layers are then held in communication with one another via a frame (e.g., plastic cassette/frame in Figure 2D).

5.8. Claims 15 and 16

Derivations of this assay with similar principles, including one or more of the following, additional loading zones, associated activators, associated selective reagents, associated amplifiers, associated biomatrix barriers, or associated indicators, and that these derivations may be calibrated to show indications at different times or different intensities, dependent upon analyte concentration.

6. Discussion

The purpose of this invention was to produce a microPAD that harnessed a time-based quantitation method for the detection of analytes. The mechanism of this device is broken down into two segments. The first constitutes an analyte selection and isolation system that could be executed via programmed biomolecule competition. The second is the breakdown of a metastable biomatrix allowing for a time-based analysis. This technology is advantageous because it provides an alternative to the predominantly colorimetric readouts used for quantitation on microPADs [22]. Time measurement holds promise as a readout on devices given its high accuracy and ease of measurement. Furthermore, chronometric quantitation on microPADs does not require post-processing (i.e., scanning) of the device and/or color analysis software, both of which are impediments to colorimetric readout accuracy and ease of use.
While there have been previously published reports of chronometric quantitation in microPADs [43], to the best of our knowledge, these relied on custom-synthesized reagents that are not available commercially. Our biomatrix device utilized commercially-available reagents, and therefore might be more easily adapted to a wider range of potential analytes. Our work is also similar to the published examples of passive fluid control valves (i.e., tunable delay shunts, dissolvable/erodible bridges, sucrose delays, and wax-printed time delays) [19,48,49]. However, these valves are used for assay automation and fluid control, as opposed to chronometric quantitation. They also cannot completely impede flow until an activation signal is provided (i.e., activator enzyme).
During preparation of this device, we envisioned creating a diagnostic technology that advances women’s health. The inspiration was rooted in the impact of LFA devices since the early 1980s, namely the pregnancy test. This revolutionizing technology allowed women to take greater control of their reproductive health, while maintaining a new-found sense of privacy. Aside from the revolutionary role of LFAs in POC diagnostics, it was evident that the binary, non-quantitative readout would not suffice for instances where quantitative analysis of analytes was required (e.g., hormone levels, metabolic panel, lipid panel, hemoglobin A1C, etc.). This gap in technology served as the impetus for developing this quantitative technology, which could then complement the pregnancy LFA.

7. Conclusions

Herein, we described a new chronometric quantitation mechanism for microPADs composed of commercially-available reagents, which may allow for its ready adaptation toward a wide range of potential analytes of interest, including those associated with women’s and reproductive health monitoring. This device may also be principally suited for use in low-resource settings as it was designed to meet the ASSURED criteria, as well as may ultimately allow for the rapid, inexpensive, and reliable monitoring of health-related biomarkers at the point of care.

8. Patent Information & Disclaimer

This article is intended to discuss, but not modify, United States Patent Application Publication No. US 2018/0052155 A1, titled ‘Assay Devices and Methods’, for the purpose of increasing the accessibility of the scientific content contained therein. Inventors: Nathaniel Martinez and Andres Martinez. Current Assignee: Cal Poly Corporation (California Polytechnic State University). Filed: 16 August 2016. Published: 22 February 2018. This patent application is in no way limited by the publication of this article. Readers interested in the specific intellectual property covered by this patent should review the patent at the link provided below. Readers may also contact the authors or Cal Poly Technology Transfer for licensing information.

Supplementary Materials

Author Contributions

Patent Conceptualization, N.W.M., A.W.M.; Assay Design and Development, N.W.M., A.W.M., R.T., E.B.S., E.E., B.A.L., N.J.T.; Initial manuscript draft, A.R.J., E.B.S.; Manuscript editing and revision, A.R.J., E.B.S., A.W.M., N.W.M.

Funding

This research received no external funding. Patent application and filing expenses were covered by the Cal Poly Office of Research and Economic Development.

Acknowledgments

The authors would like to thank Kristi H. Johnson and Jim M. Dunning (Office of Research and Economic Development, Cal Poly) for their invaluable assistance with the patent application and filing.

Conflicts of Interest

The authors declare no conflict of interest.

References

  1. WHO—World Health Organization. World Health Statistics 2017: Monitoring Health for The SDGs; WHO: Geneva, Switzerland, 2017. [Google Scholar]
  2. WHO—World Health Organization. World Health Statistics 2018: Monitoring Health for the SDGs; WHO: Geneva, Switzerland, 2018. [Google Scholar]
  3. Yager, P.; Domingo, G.J.; Gerdes, J. Point-of-care diagnostics for global health. Ann. Rev. Biomed. Eng. 2008, 10, 107–144. [Google Scholar] [CrossRef]
  4. Sia, S.K.; Linder, V.; Parviz, B.A.; Siegel, A.; Whitesides, G.M. An integrated approach to a portable and low-cost immunoassay for resource-poor settings. Angew. Chem. Int. Ed. 2004, 43, 498–502. [Google Scholar] [CrossRef] [PubMed]
  5. Laksanasopin, T.; Chin, C.D.; Moore, H.; Wang, J.; Cheung, Y.K.; Sia, S.K.; Reader, A. Microfluidic point-of-care diagnostics for resource-poor environments. In Proceedings of the 2009 Annual International Conference of the IEEE Engineering in Medicine and Biology Society, Minneapolis, MN, USA, 3–6 September 2009; pp. 1057–1059. [Google Scholar]
  6. Hay, B.D.; Wasserman, J.; Dahl, C.A. Global health diagnostics. Nature 2006, 444, 1. [Google Scholar] [CrossRef]
  7. Kosack, C.S.; Page, A.-L.; Klatser, P.R. A guide to aid the selection of diagnostic tests. Bull. World Health Organ. 2017, 95, 639–645. [Google Scholar] [CrossRef]
  8. Posthuma-Trumpie, G.A.; Korf, J.; Van Amerongen, A. Lateral flow (immuno) assay: Its strengths, weaknesses, opportunities and threats. A literature survey. Anal. Bioanal. Chem. 2009, 393, 569–582. [Google Scholar] [CrossRef]
  9. Koczula, K.M.; Gallotta, A. Lateral flow assays. Essays Biochem. 2016, 60, 111. [Google Scholar] [CrossRef]
  10. Gordon, J.; Pugh, C.S.G. Lateral Flow Chromatographic Binding Assay Device. U.S. Patent 4,956,302, 11 September 1990. [Google Scholar]
  11. Shuler, J.K.; Lovell, S.J.; Fisher, A.S.; Weiss, A.J.; Rosenstein, R.W. Direct Read Lateral Flow Assay for Small Analytes. U.S. Patent 5,798,273, 25 August 1998. [Google Scholar]
  12. Wild, D. The Immunoassay Handbook: Theory and Applications of Ligand Binding, ELISA and Related Techniques, 4th ed.; Elsevier Science: Amsterdam, The Netherlands, 2013; ISBN 0080970389. [Google Scholar]
  13. Martinez, A.W.; Phillips, S.T.; Butte, M.J.; Whitesides, G.M. Patterned paper as a platform for inexpensive, low-volume, portable bioassays. Angew. Chem. Int. Ed. 2007, 46, 1318–1320. [Google Scholar] [CrossRef]
  14. Martinez, A.W.; Phillips, S.T.; Whitesides, G.M.; Carrilho, E. Diagnostics for the developing world: Microfluidic paper-based analytical devices. Anal. Chem. 2010, 82, 3–10. [Google Scholar] [CrossRef] [PubMed]
  15. Gong, M.M.; Sinton, D. Turning the page: Advancing paper-based microfluidics for broad diagnostic application. Chem. Rev. 2017, 117, 8447–8480. [Google Scholar] [CrossRef] [PubMed]
  16. Strong, E.B.; Schultz, S.A.; Martinez, A.W.; Martinez, N.W. Fabrication of miniaturized paper-based microfluidic devices (MicroPADs). Sci. Rep. 2019, 9, 7. [Google Scholar] [CrossRef] [PubMed]
  17. Carrilho, E.; Martinez, A.W.; Whitesides, G.M. Understanding wax printing: A simple micropatterning process for paper-based microfluidics. Anal. Chem. 2009, 81, 7091–7095. [Google Scholar] [CrossRef] [PubMed]
  18. Akyazi, T.; Basabe-Desmonts, L.; Benito-Lopez, F. Review on microfluidic paper-based analytical devices towards commercialisation. Anal. Chim. Acta 2018, 1001, 1–17. [Google Scholar] [CrossRef]
  19. Strong, E.B.; Knutsen, C.; Wells, J.; Jangid, A.; Mitchell, M.; Martinez, N.; Martinez, A. Wax-printed fluidic time delays for automating multi-step assays in paper-based microfluidic devices (MicroPADs). Inventions 2019, 4, 20. [Google Scholar] [CrossRef]
  20. Land, K.J. (Ed.) Paper-Based Diagnostics; Springer Nature: Cham, Switzerland, 2019; ISBN 9783319968681. [Google Scholar]
  21. Martinez, A.W.; Phillips, S.T.; Carrilho, E.; Thomas, S.W.; Sindi, H.; Whitesides, G.M. Simple telemedicine for developing regions: Camera phones and paper-based microfluidic devices for real-time, off-site diagnosis. Anal. Chem. 2008, 80, 3699–3707. [Google Scholar] [CrossRef] [PubMed]
  22. Morbioli, G.G.; Mazzu-Nascimento, T.; Stockton, A.M.; Carrilho, E. Technical aspects and challenges of colorimetric detection with microfluidic paper-based analytical devices (μPADs)—A review. Anal. Chim. Acta 2017, 970, 1–22. [Google Scholar] [CrossRef]
  23. Cate, D.M.; Adkins, J.A.; Mettakoonpitak, J.; Henry, C.S. Recent developments in paper-based micro fluidic devices. Anal. Chem. 2015, 87, 19–41. [Google Scholar] [CrossRef] [PubMed]
  24. Verma, M.S.; Tsaloglou, M.-N.; Sisley, T.; Christodouleas, D.; Chen, A.; Milette, J.; Whitesides, G.M. Sliding-strip microfluidic device enables ELISA on paper. Biosens. Bioelectron. 2018, 99, 77–84. [Google Scholar] [CrossRef]
  25. Choi, J.R.; Hu, J.; Tang, R.; Gong, Y.; Feng, S.; Ren, H.; Wen, T.; Li, X.; Wan Abas, W.A.B.; Pingguan-Murphy, B.; et al. An integrated paper-based sample-to-answer biosensor for nucleic acid testing at the point of care. Lab Chip 2016, 16, 611–621. [Google Scholar] [CrossRef] [PubMed]
  26. Yu, J.; Wang, S.; Ge, L.; Ge, S. A novel chemiluminescence paper microfluidic biosensor based on enzymatic reaction for uric acid determination. Biosens. Bioelectron. 2011, 26, 3284–3289. [Google Scholar] [CrossRef]
  27. Wang, S.; Ge, L.; Song, X.; Yu, J.; Ge, S. Paper-based chemiluminescence ELISA: Lab-on-paper based on chitosan modified paper device and wax-screen-printing. Biosens. Bioelectron. 2012, 31, 212–218. [Google Scholar] [CrossRef]
  28. Yamada, K.; Takaki, S.; Suzuki, K.; Citterio, D. Microfluidic Paper-Based Analytical Device for Fluorescence Detection of Lactoferrin in Tear Fluid. In Proceedings of the 17th International Conference on Miniaturized Systems for Chemistry and Life Sciences, MicroTAS 2013, Freiburg, Germany, 27–31 October 2013; Chemical and Biological Microsystems Society, 2013; pp. 895–897. [Google Scholar]
  29. Adkins, J.; Boehle, K.; Henry, C. Electrochemical paper-based microfluidic. Electrophoresis 2015, 36, 1811–1824. [Google Scholar] [CrossRef] [PubMed]
  30. Mettakoonpitak, J.; Boehle, K.; Nantaphol, S.; Teengam, P.; Adkins, J.A.; Srisa-Art, M.; Henry, C.S. Electrochemistry on paper-based analytical devices: A review. Electroanalysis 2016, 7, 1420–1436. [Google Scholar] [CrossRef]
  31. Nie, Z.; Nijhuis, C.A.; Gong, J.; Chen, X.; Kumachev, A.; Martinez, A.W.; Narovlyansky, M.; Whitesides, G.M. Electrochemical sensing in paper-based microfluidic devices. Lab Chip 2010, 10, 477–483. [Google Scholar] [CrossRef] [PubMed]
  32. Santhiago, M.; Henry, C.S.; Kubota, L.T. Electrochimica acta low cost, simple three dimensional electrochemical paper-based analytical device for determination of p-nitrophenol. Electrochim. Acta 2014, 130, 771–777. [Google Scholar] [CrossRef]
  33. Nie, Z.; Liu, X.; Akbulut, O.; Whitesides, G.M. Integration of paper-based microfluidic devices with commercial electrochemical readers †. Lab Chip 2010, 3163–3169. [Google Scholar] [CrossRef]
  34. Dungchai, W.; Chailapakul, O.; Henry, C.S. Electrochemical detection for paper-based microfluidics. Anal. Chem. 2009, 81, 5821–5826. [Google Scholar] [CrossRef]
  35. Dossi, N.; Toniolo, R.; Impellizzieri, F.; Bontempelli, G. Doped pencil leads for drawing modified electrodes on paper-based electrochemical devices. Electroanal. Chem. 2014, 723, 90–94. [Google Scholar] [CrossRef]
  36. Carvalhal, R.F.; Sima, M.; Helena, M.; Piazetta, D.O.; Gobbi, A.L.; Kubota, L.T. Electrochemical detection in a paper-based separation device. Electroanal. Chem. 2010, 82, 1162–1165. [Google Scholar] [CrossRef]
  37. Reboud, J.; Xu, G.; Garrett, A.; Adriko, M.; Yang, Z.; Tukahebwa, E.M.; Rowell, C.; Cooper, J.M. based microfluidics for DNA diagnostics of malaria in low resource underserved rural communities. Proc. Natl. Acad. Sci. USA 2019, 116, 4834–4842. [Google Scholar] [CrossRef]
  38. Zang, D.; Ge, L.; Yan, M.; Song, X.; Yu, J. Electrochemical immunoassay on a 3D microfluidic paper-based device. Chem. Commun. 2012, 48, 4683–4685. [Google Scholar] [CrossRef]
  39. Scida, K.; Cunningham, J.C.; Renault, C.; Richards, I.; Crooks, R.M. Simple, sensitive, and quantitative electrochemical detection method for paper analytical devices. Anal. Chem. 2014, 86, 6501–6507. [Google Scholar] [CrossRef] [PubMed]
  40. Liu, Z.; Parvez, K.; Li, R.; Dong, R.; Feng, X.; Müllen, K. Transparent conductive electrodes from graphene/PEDOT:PSS hybrid inks for ultrathin organic photodetectors. Adv. Mater. 2015, 27, 669–675. [Google Scholar] [CrossRef] [PubMed]
  41. Cunningham, J.C.; Brenes, N.J.; Crooks, R.M. Paper electrochemical device for detection of DNA and thrombin by target-induced conformational switching. Anal. Chem. 2014, 86, 6166–6170. [Google Scholar] [CrossRef]
  42. Maxwell, E.J.; Mazzeo, A.D.; Whitesides, G.M. Paper-based electroanalytical devices for accessible diagnostic testing. MRS Bull. 2019, 309–314. [Google Scholar] [CrossRef]
  43. Lewis, G.G.; DiTucci, M.J.; Phillips, S.T. Quantifying analytes in paper-based microfluidic devices without using external electronic readers. Angew. Chem. Int. Ed. 2012, 51, 12707–12710. [Google Scholar] [CrossRef]
  44. Noh, H.; Phillips, S.T. Fluidic timers for time-dependent, point-of-care assays on paper. Anal. Chem. 2010, 82, 8071–8078. [Google Scholar] [CrossRef]
  45. Lewis, G.G.; Robbins, J.S.; Phillips, S.T. Phase-switching depolymerizable poly(carbamate) Oligomers for signal amplification in quantitative time-based assays. Macromolecules 2013, 46, 5177–5183. [Google Scholar] [CrossRef]
  46. Lewis, G.G.; Robbins, J.S.; Phillips, S.T. Point-of-care assay platform for quantifying active enzymes to femtomolar levels using measurements of time as the readout. Anal. Chem. 2013, 85, 10432–10439. [Google Scholar] [CrossRef] [PubMed]
  47. Lewis, G.G.; Robbins, J.S.; Phillips, S.T. A prototype point-of-use assay for measuring heavy metal contamination in water using time as a quantitative readout. Chem. Commun. 2014, 50, 5352–5354. [Google Scholar] [CrossRef]
  48. Toley, B.J.; McKenzie, B.; Liang, T.; Buser, J.R.; Yager, P.; Fu, E. Tunable-delay shunts for paper microfluidic devices. Anal. Chem. 2013, 85, 11545–11552. [Google Scholar] [CrossRef] [PubMed]
  49. Lutz, B.; Liang, T.; Fu, E.; Ramachandran, S.; Kauffman, P.; Yager, P. Dissolvable fluidic time delays for programming multi-step assays in instrument-free paper diagnostics. Lab Chip 2013, 13, 2840–2847. [Google Scholar] [CrossRef] [PubMed]
Figure 1. Overview of the chronometric quantitation mechanism on a simple microPAD design. (A) Lateral flow design on a 2D microPAD and (B) vertical flow design on a 3D microPAD (adapted from Figure 1 and Figure 2 from the patent application publication). Quantitation is achieved by measuring the start-time (T1 = 0 s), when the sample is loaded on the device, and stop time (T2 = Xs), when the sample passes through the degradable biopolymer. Enzymatic activation and amplification results in a concentration-dependent degradation of the metastable biomatrix barrier, which is correlated to a concentration-dependent time-of-passage through the device. (C) Graph displaying the relationship between readout time and enterokinase (activator enzyme) concentration. The limit of detection is ~5 femtomoles (15 μL sample applied).
Inventions 04 00048 g001
Figure 2. MicroPAD with integrated chronometric quantitation mechanism. (A) Schematic of the complete microPAD design (adapted from Figure 3 of the patent application publication). The analyte is applied to layer 1, selected/competed for in layers 2/3, which initiates a proteolytic cascade in layers 3/4, resulting in the degradation of a metastable biopolymer in layer 5. Following degradation, the indicator dye (layer 6) returns to layer 1. Time is tracked from addition of the analyte to layer 1 (T1 = 0 s) to the return of the indicator dye (T2 = Xs). (BD) Images of an actual microPAD. (B) Paper device with four layers requiring off-device analyte selection. Layer 1—sample loading zone, layer 2—amplifier (zymogen), layer 3—metastable biomatrix (degradable biopolymer), and layer 4—indicator (Dye). Devices are folded so that the left border of layer 1 aligns with the left border of layer 3, going over layer 2, with creases on both sides of layer 2. Folding resembles an accordion pattern. (C) Folded device prior to securement in plastic cassette/frame. (D) Fully constructed device with sample loading example.
Inventions 04 00048 g002
Figure 3. Overview of the selection/competition steps in the complete microPAD design (Figure 2A, layers 2 and 3). (A) Sample with the analyte of interest is introduced to pre-bound biotinylated-analyte (Bt-analyte) complexed with anti-analyte antibodies. (B) Competition between the sample analyte and Bt-analyte for antibody binding reaches an equilibrium where some sample analyte displaces the Bt-analyte. (C) Out-competed Bt-analyte molecules flow into the next layer (Figure 2A, layer 4). This layer is comprised of pre-bound desthio-biotinylated enterokinase (DBt-EK), which is complexed with immobilized streptavidin. (D) Bt-analyte molecules displace all DBt-EK molecules from streptavidin due to greater binding affinity. DBt-EK molecules initiate the proteolytic amplification cascade, and subsequent degradation of the metastable biomatrix. Antibody and streptavidin drawings are intended for visualization purposes only and do not represent accurate molecular structure, conformation, or binding.
Inventions 04 00048 g003

