1. Introduction
Nowadays, the term Critical Infrastructures (
) describes the assets that are vital for a society to function correctly. Critical Infrastructures provide the essential services that underpin society and serve as the backbone of the global economy, national security and the public health sector. Specifically, there are 16 main Critical Infrastructure sectors (
Figure 1) whose systems and assets, whether physical or virtual, critically depend on this on various levels [
1].
One can easily comprehend the importance of protecting these assets from malicious attacks, and therefore, the need to define a security plan arises. In particular, processes for the identification, selection and prioritization of counter-measures and procedures must be defined. Taking into account the extent of how mainstream and accessible the Internet is, the technological progress and the emergence of Big Data becomes even more complicated for the protection of said infrastructures. Following the trends that the Big Data era has created, modern Information Systems require even more data from both external and internal resources in order to achieve high security standards. However, amassing all of this data without any significant pre-process planning can be inefficient; thus, it is imperative to define a standardised life cycle that will describe the steps needed to extract valuable information from raw data. Another factor that should be considered is that today’s data springs from various places and in different forms, so when it comes to the collection phase, an entity that stores said data in its native format is preferable. Planning how the data will be treated before entering the and organising it in an optimal manner creates a safe zone that improves the validity of the Information System input. Therefore, the operation of the is controlled and orchestrated, providing at the same time a wealth of data with accurate results.
Due to the advances in Information Technology (IT), the interdependencies between Critical Infrastructures have increased considerably [
2], creating new vulnerabilities and raising the risk levels. A failure in an infrastructure can also affect other infrastructures, resulting in cascading failures [
3]. Failure within a single
is damaging enough, but a broader multi-sector failure may be catastrophic [
4] and could affect practically all aspects of society in multiple countries [
5]. The attacks that describe the threat profile of a critical infrastructure are of two types. The first type includes unintended damages caused by poor maintenance [
6] or threats such as natural disasters [
7], whereas the second type concerns cases of organised attacks targeting these infrastructures. Every security plan that frames a Critical Infrastructure must provide protection from both of these types. In recent years, the incidents of organised attacks, that focus and exploit cybersecurity and IT security vulnerabilities, have grown considerably in number, causing debilitating damage to various critical sectors of different countries. Noticeable incidents are found:
In the Energy Sector: In December 2015, a cyber-attack on a power grid in the Ukraine left 225,000 people in the western part of the country without power for hours. Through spear-phishing, the attackers seized control of the Supervisory Control and Data Acquisition (SCADA), remotely switching substations off [
8].
In the Nuclear Sector: In June 2010, it was found that 14 Iranian industrial sites, including a uranium-enrichment plant, were infected by a virus known as the Stuxnet worm. This worm was able to spread through the network and take control of the Programmable Logic Controlers (PLCs), thus spying on the system and causing the fast spinning centrifuges to tear themselves apart [
9].
In the Emergency Services Sector: In July 2017, the Murfreesboro Police and Fire and Rescue Departments were hit by a ransomware attack, referred to as WannaCry, infecting 19 computers along with two file servers. The IT Department had to take the entire system offline [
10].
In the Health Sector: The National Health Service (NHS)hospitals in England and Scotland were attacked by the malware WannaCry, causing serious implications and disabling care provision for its patients [
11].
In the Financial Sector: In 2017, nearly half of the American population (
million) was affected due to a massive data breach in Equifax’s credit bureau records [
12].
As a result, the protection of Critical Infrastructures has drown major research interest particularly focusing on modelling, analysis and simulation of the processes [
13,
14,
15,
16,
17,
18]. In addition, the research that mainly targets small-scale systems is inadequate to reflect the complexity of these infrastructures [
19] and does not include various types of attacks [
20]. Our approach departs from traditional modelling techniques and tries to achieve security and resilience of Critical Infrastructures by focusing on the data that derives from both their internal ecosystem (e.g., SCADA, sensors, cameras, etc.) and external sources (e.g., weather forecast data, social network data, etc.). This increasing hunger for data for the operational chain of
s in combination with non-standardised filtering and analysis methods could cause undesired effects. A case that highlights the above is a mistakenly broadcast report by the Associated Press’ Twitter account that presented President Barrack Obama was injured in an explosion at the White House, which resulted in a 150-point drop in the Dow Jones index within minutes [
21]. At the same time, our approach orchestrates the complex operations of infrastructure, shielding critical processes from situations where several systems become unavailable.
This paper extends Critical Infrastructure capabilities and enhances its resilience against intentional (e.g., Distributed Denail of Service (DDoS) attacks [
22]) or unintentional (e.g., earthquake [
23,
24]) hazards that threaten the smooth operation of the system. The work has two main contributions: (a) the introduction of a complete Information Life Cycle tailored for computer-oriented systems, which is inspired by the military’s information security management systems, and (b) the designing and modelling of a reference architecture that makes use of these life cycle’s concepts. Finally, it introduces a framework that was developed to highlight how we can leverage data, resources and processes in order to maximize the efficiency and minimize the risk of downtime.
2. Information Life Cycle
Nowadays, aside from managing and processing the data produced by the systems and applications of an infrastructure assets’ inner circle, a considerable amount of focus should be directed towards evaluating and managing the data channels deriving from external information. In this era, the control and management of Critical Infrastructures cannot be considered unaffected by their external environment in terms of their architecture or security. Data from the outside world tends to increase in size exponentially, and this is something that puts strain on the process of protecting, maintaining and upgrading an existing Critical Infrastructure. Since 2013, human-created content was estimated at
exabytes
, 90% of which was created in the last two years [
25]. By 2025, the International Data Corporation (IDC) predicts that there will be overall 163 zettabytes
of data [
26]. This massive production of information comes from everywhere: sensors used to gather climate information, posts to social media sites, digital pictures and videos, purchase transaction records and cell phone GPS signals, just to name a few. This vast quantity of data raises the need for a quality framework that takes into account its various sources and results in qualitative data.
Data has a unique and prominent role in securing Critical Infrastructures in an efficient and timely manner, so it is of great importance to examine and understand every aspect of the life cycle and management of information within a security system. In a general context, the life cycle of information can be viewed as having a standard structure that consists of the following basic stages: collection, validation, storage, analysis, use and evaluation. Nonetheless, when it comes to security systems, a more detailed and complete structure is needed; one that will embody new stages and that will offer the capabilities and flexibility that a modern system must incorporate. The proposed Information Life Cycle is a hybrid model based on the protocols of North Atlantic Treaty Organisation (NATO), European Border and Coast Gaurd Agency—Frontex [
27] and the Hellenic Army [
28],tailored to face the above challenges. As opposed to these systems that are human capital-centred, this framework is based on information systems.
It is a new and innovative approach that is able to manage a wide range of data sources. The proposed Information Life Cycle consists of the following stages (
Figure 2):
Tasking: This is the first phase of the cycle that sets out all the security objectives and decisions to be made in order to define the information requirements and therefore what data sources to use and what data to collect. Each security task is an independent entity having its own data requirements. Tasks are organised into categories relevant to the current security scenario. Moreover, due to their distinct nature, tasks are not of the same importance and, consequently, may have different priorities allocated to them.
Data Sources: Regardless of how well the tasking stage is set up and organised, it is vital to identify the appropriate data sources that meet the tasking requirements. In order to determine the sources from which we can draw information, we must first categorize them. For that purpose, we use the intelligence-gathering disciplines, which describe this kind of derived information, as well as its source and scheme. Briefly, the most important of those disciplines are: HUMINT (Human Intelligence) [
29], GEOINT (Geospatial Intelligence), OSINT (Open-Source Intelligence) [
30], SIGINT (Signals Intelligence) and COMINT (Communication Intelligence) [
31], TECHINT (Technical Intelligence), CYBINT/DNINT (Cyber Intelligence/Digital Network Intelligence) and IMINT (Imagery Intelligence) [
31]. Moreover, the data from all these sources can be combined with existing data in the Critical Infrastructure’s databases.
Data Collection: This is the stage in which data is gathered from the defined data sources. It contains all methods and Application Programming Interfaces (APIs) for connecting to the sources in order to draw the requested data. It is important that this stage is always up-to-date and follows-up on all the changes that may occur in the sources or to the data (e.g., change in the data format or change in the way the sources are accessed, etc.). It is also vital to have the appropriate tools for collection of this data, since not all of them are provided through services or APIs. To that end, it may be necessary to use crawling engines to capture and collect (dynamic) web pages, images and videos from web sites, marketplaces, forums, social media and dark-web sources.
Data Cleaning: This stage ensures the quality of the data upon which we act. It incorporates the Big Data quality indicators [
32], making certain that we act on clean, correct, accurate and complete data. Based on these indicators, the Data Cleaning stage detects all of the anomalies and corruptions that the data derived from a record set, table or database. Then, it only proceeds with the appropriate indicator-specific actions in order to meet the desired quality properties.
Data Transformation: Regardless of the cleaning process applied to the data, it remains unstructured and scheme-less. In order to be able to store and analyse them, data must have a certain structure. For this reason, proper transformations are applied. This stage converts a set of data values from the data format of a source data system into the data format of a destination data system [
32].
Index and Storage: At this stage, the collected data is stored for future use. Due to the large amount of data, we resort to a more organised and structured way of storage. Additionally, by using indexing or hashing algorithms, efficient database tuples-retrieval is achievable. There are plenty of indexing options, from Non-Artificial Intelligence Indexing, to Artificial Intelligence and Collaborative Artificial Intelligence Techniques [
33].
Data Collation: As mentioned, each task requires a different dataset, which leads to accessing multiple data sources. All tasks will finally be formulated together serving the original security goal. The same should be done with the data. This is the stage where the gathered data is aggregated and combined properly, in order to be fed into the analysis stage where relations will be made.
Data Analysis: The pre-processed data at this stage is appropriately analysed with the goal of discovering useful information in order to support decision-making. Depending on the data provided, techniques such as data mining, descriptive statistics or exploratory data analysis and data visualisation can be used for modelling and knowledge discovery. Furthermore, deep learning techniques that can achieve abstract representations and semantic tagging can obtain relational and semantic knowledge [
34], extracting the maximum information from the given data. The process of data analysis may result in additional requests for data or information, so it is essential to correlate this with historical data and pattern information from previous analysis.
Information Extraction: This is the stage at which the knowledge previously produced is translated into conclusions, predictions and calculations. This step is an integral part of data analysis as it completes the entire data processing phase. Subsequent results and knowledge derived from the data analysis stage are unified under one complete piece of information.
Reporting: This phase is the summarization of the results found during the analysis activities including any measures of certainty involved.
Dissemination: Results and knowledge are distributed at this stage. The information produced is forwarded to the external environment of the , for example to other agencies and organisations, which will make appropriate decisions and will proceed to actions.
Exploitation: At this stage, the knowledge generated is promoted and exploited internally amongst the administration of the . The main purpose is to use the outcomes for their own interests and feed their conclusions and results appropriately to the reviewing process.
Decision Making: At this stage, based on the information received by the relevant recipients, the appropriate decisions are made. The results of the actions following the decisions have a great impact on the feedback of the information cycle, since they reflect the functionality and the quality of the cycle itself.
Review: Finally, the results of the decisions and therefore the quality of data produced are reviewed in order to create suitable feedback for the re-evaluation of the Information Life Cycle. Each part of the tasking phase should be individualised, compared and evaluated against its original intention and purpose with regard to what was ultimately achieved. Framing the right questions, assessing the quality of the whole process, summarising the results and interpreting their effectiveness and impact are vital steps for a healthy review that will upgrade and enhance the function of the Information Life Cycle.
To increase productivity, a mechanism is needed to store information and efficiently retrieve information. The data will have been carefully picked through extensive research and analysis of the
Data Sources that it comes from. The data will consist, not only of information that is outright useful, but also of data that might satisfy future needs. Moreover, it solves possible issues pointed out by field specialists and Critical Infrastructure experts. This evaluation of the data and its sources, which is carried out within the Information Life Cycle, should not be a one-off thing because the data type and the technology that accompanies it constantly evolve. An issue that is much more apparent in the Big Data era is the lack of governance and the absence of any structure whatsoever, making the retrieval and usage of data extremely complex. In addition, consumption of unnecessary or out-of-context data could cause negative side effects on the different types of infrastructure assets. This “ocean of data” cannot provide proper results due to the excessive amount and variety of information that it contains. The contained data could be coming from a plethora of sources such as: (a) social networks like Facebook and Twitter, (b) governmental and financial institutions like trade markets and banks, (c) hospitals and health clinics, (d) data warehouses or/and every other source that could be holding useful information. However, at the same time, there is data that could eventually deteriorate the performance of the system as depicted in
Figure 3 (illustrated as red disposal bins) since there is no mechanism to filter it out. Without the existence of said mechanism, some of the data that is gathered can be noisy, unmanaged or even broken. That excessiveness of information from multiple sources and the existence of “rogue data” can transform this ocean of data to an enormous swamp.
Considering the challenges mentioned above and having theoretically described the Information Life Cycle, we should define how its first stages are implemented. As is defined in Big Data terms, Data Lakes [
35] seem like the right modelling approach. It is a scalable storage repository that holds a vast amount of data in its native format (structured, semi-structured or even unstructured) and therefore is the perfect candidate for the
Data Collection stage. The data structure and requirements are not defined until the data is needed, which provides a lot of flexibility giving the developers and data scientists the ability to easily configure and reconfigure their models, queries and applications. This is an efficient way for businesses and platforms to collect and store raw information from a variety of input, from Customer Relationship Management (CRM) data to social media posts. Moreover, it would take less time to access and locate data, thereby boosting data preparation and reuse efforts. Data Lakes come with additional perks that seem to be very useful in data utilisation and analysis. Given the pace of change within data science, the ability to store this information in its native format will definitely enhance the interoperability as it will be easier to use in future systems. Storage costs are also one of the primary concerns that need to be considered, and therefore, given the comparative unstructured nature and variety of data that can be stored without prior processing, Data Lakes offer sound financial value [
35]. Poorly-designed and neglected systems face the risk of transforming into swamps, containing unusable information that will not only increase in overall size, but can also create inaccuracies when running certain algorithms (e.g., machine learning) [
36]. That is why Data Lakes should have tools like metadata management, to assure data correctness and completeness (
Data Cleaning). When the system fails to document the stored data accurately, it can result in the inability to analyse and exploit the data efficiently. Without proper governance and metadata management, it cannot be utilized in an optimal way, making the Data Lake essentially useless and having more common traits with the vast Data Ocean.
By creating an efficient and agile storage layer, the next step is to retrieve the needed information and perform rigorous analysis on it. Performing these kind of actions on the data that a Data Lake contains serves no significant purpose, and it will not yield the desired results. That is why it is better to focus on a single region of interest or type of content, such as sales, marketing, social media posts or satellite and aerial photographs. The “lake” can be preferable because the location and the access of data regarding a certain category can be carried out very efficiently. However, when the data is needed, certain processing procedures must be carried out. Between data storage and data processing lies another level of data abstraction. This layer can be compared with the Data Marts [
37] in Relational Database Management (RDBM) systems, systems, which is a staging area for data that serves the needs of a particular segment or business unit. This “Data Pond” is a subset of the Data Lake that focuses on a particular subject or operational department, fitted to the purpose of the task without redundancy and therefore implementing the stages of
Data Transformation and
Data Collation. Selecting and organising the data for each need can simplify data analytics by a large margin, meeting a smaller or more specific requirement. A Data Lake can be visualized as a large clean body of water, and parts of it can be described as “Data Ponds” where the user “dives into” to focus their analysis (
Figure 4).
Through continuous refinement of data via Data Lakes and Data Ponds, a system can optimally and efficiently utilise the provided input from external or internal environments. On the one hand, this concept leads business processes to produce faster results. On the other hand, complete and accurate conclusions can be drawn, since “data noise” is reduced to a minimum. In the next section, we will see how the Information Life Cycle and data refinements could be incorporated in Information System Environments.
3. Framework
There has been a significant change in Critical Infrastructures, evolving them from monopolistic and monolithic systems to open market configurations. Therefore, in order for them to work optimally and carry out all the appropriate tasks, it is necessary to have access to data from external environments. There are many situations in which external data is crucial for a . For example, a seaport needs weather forecast data, as well as data from Automatic Identification Systems (AIS) for Vessel Traffic Services (VTS). This data is collected from external resources and is used in order to notify and control incoming and outgoing ships about the weather conditions and possible weather implications and delays. However, this phenomenon severely increases the complexity and the management of s. That is one of the challenges that the “Data Lake” and the “Data Pond” aim to address.
Considering the multidimensional diversity of data that the
requires from the
Data Sources, as well as the computational capacity required to process it, it is fair to say that we enter Big Data territory. The
Data Collection from multiple sources and the process of
Data Cleaning lead to the creation of a Data Lake, especially and meticulously designed by experts to fulfil requirements and reduce management complexity of Critical Infrastructures. Treating the data is the next logical step in order to perform
Data Transformation and
Data Collation (leading to what we described in the previous chapter as the Data Pond), thus creating an infrastructure
Data Source Repository, as illustrated in
Figure 5.
At this point, the process of gathering and refining
data is completed (orange steps in
Figure 2), and according to the proposed Information Life Cycle, the next step is to exploit this data in order to produce useful information (green steps in
Figure 2). The goal of the proposed Framework is to fulfil that essential requirement. The Framework performs
Data Analysis, which uses previously identified
Information Patterns and
Historical Data to provide added value. The resulting
extracted information is then
reported in order to
exploit the derived knowledge within the Framework. Up until this step, the Framework has completed its mission of producing and exploiting valuable information. However, in the context of a
, the results of the previous process should be constantly
reviewed based on quality and quantity key performance indicators to improve the life cycle steps (from
Data Collection until
Exploitation). Finally, the review of results and revision of recommendations lead to the
Tasking phase, whose purpose is to alter the existing
Critical Infrastructure Business Processes, so that already defined goals could be reached, as well as to create new business processes that could satisfy newly-identified needs. Therefore, it is imperative to describe the business processes of a
in a common way, which is the scope of the next section. Furthermore, we highlight among others, the role of the
Resources that are the means to performing the business processes and the
Policies that illustrate the way these resources are utilized, as shown in
Figure 5.
3.1. Business Processes
Ensuring efficient and secure management of a
is challenging, mainly due to the fact that current systems are developed from different manufacturers, and therefore, the lack of adoption of widely accepted technical standards makes them incompatible and non-interoperable. In order to deal with that issue, the
s could exploit standards such as Business Process Modelling Notation (BPMN) [
38], to graphically notate the end-to-end flow of their Business Processes and identify in every step the systems that could carry out each part of these processes. Given the need to orchestrate heterogeneous hardware devices, APIs and online services that are under data flows, BPMN-based tools come into the equation. Using those tools, any Business Process of the
is simulated by a
graph that “breaks” into a logical sequence of
tasks, represented as
nodes with specific functions, offering in this way an abstract layer for building a solution towards the goal of the process. In this section, we present the strict definition of the key concepts and terms that appear throughout the paper.
Definition 1 (
Graph)
. Graph (G) represents a specific Business Process as is gate access control, which is a combination of tasks (nodes in the graph) such as video analysis and image processing. Each G contains exactly one starting task (a task with output and no input) and exactly one end task (a task with input and no output). With respect to graph theory, every G is considered as a directed graph that contains at least one path from the starting task towards the end task.
In case the purpose is to find out the shortest path in the graph, then the latter becomes a weighted directed graph where the weight of each edge represents the sum of the process time inside a node plus the network delay between this node and the next one following the sequence of the path. In the context of a , many Business Processes are carried out, each one of which is represented by a distinct Graph. For instance, regarding the oil and gas extraction industry, at least four major business processes could be identified: the exploration, development, production and site abandonment. Therefore, four distinct Graphs are used to model the whole .
Until the use case section, we present model graphs that contain a few tasks in order to present all the concepts and definitions needed to be explained and visualized. However, the business processes that are used in the use case section are significantly more complex.
Definition 2 (
Path)
. Path (P) represents a distinct way (in terms of algorithms, APIs, Resources, etc.) of reaching the goal of a specific Business Process. With respect to graph theory, each one P, that belongs to a specific G, is considered as a finite directed path, whose first and last node are the starting task and the end task of G, respectively. The fact that each graph contains multiple paths reflects the capability of the Framework to adapt to various conditions, either regular or irregular, in order to optimise the way that the Business Processes are performed.
3.1.1. Resource Blueprint
Performing
processes requires the use of resources, which could be a cloud infrastructure, a cluster, a dedicated PC, a database or even a sensor. There is a need to create a description of these resources, which will contain all the appropriate information for the selection process. All this information is contained in the form of a description file called a Blueprint (the JSON Schema of the Blueprint is available on GitHub:
https://github.com/vrettos/persefoni/blob/master/schema_BP.json). This Blueprint is structured in a way that every important feature, attribute and characteristic of a resource is described and easily accessed. There are seven main attributes that a resource has in the context of the
operation. All the attributes are used in different stages of the selection process, each and every one of them for different purposes. All the attributes, as well as the logic behind their creation are described below:
Geolocation: There are situations in which the geographical location of a resource is essential in order to perform a specific task (i.e., there are situations in which the monitoring system needs to access specific resources such as cameras that are located in a specific area).
Network Locality: Communication between resources most of the times has specific requirements that concern the network. The network locality is separated into three major categories; an external network for communication between cloud or other third party providers; an internal network for communication between on premise resources; and a local network for inner resource communication.
Virtual Entity: The parameter of Virtual Entity contains information about the governance of a resource. Every resource is managed and belongs to a specific organisation, company or institution. In the resource selection process, the governance of a resource is taken under consideration, for privacy, logging and security purposes. As data could have strict rules regarding its distribution, specific guidelines about governance should be considered for the resources that will be handling this kind of data.
Resource Identifier: This parameter is used for internal purposes only to uniquely identify a resource.
Type: It is important to know the computational capabilities and the nature of a resource in order to orchestrate the system and efficiently manage the resources. All the resources fall under a specific category based on the factors mentioned. A distinction in the proposed Framework is the classification of resources as computational nodes or as data store nodes.
Details: Following the specification of the Type, there are specific details (resource specifications) for the two types of resources (computational and data store nodes). In the case of a computational resource, the details contain the instance type attribute, which describes in a strict enumerated form the types of computational nodes based on their capabilities. Every type of computational node corresponds to a set of hardware specification (number of CPUs, RAM capacity, etc.) like the Amazon Elastic Compute Cloud (Amazon EC2) instance type paradigm. As far as the details of the data store nodes are concerned, there are two attributes, one defining the type of the database (Database Type) and the other one defining the specific Data Collection to which the resource refers.
Operational Period: The operational period describes the time window in which a resource can be used or operates. Resources such as sensors or infrastructure monitoring components (cameras) might have constraints or limitations for their operational period. Moreover, some resources might also be unavailable due to energy saving reasons. Knowing the availability period of a resource is an important factor for the resource selection process, as well as for the scheduling of the infrastructure (as shown in the
Figure 6).
As already mentioned in this section, a graph (Business Process) in our Framework consists of a plethora of tasks that are essentially carried out for the to reach a specific goal. However, each of these tasks can be performed by a variety of distinct resources that either belong to the or are external to it. Hence, the framework resource choice of suitability per task can be optimised, by introducing a proper characterization of resource sets. Similarly, a standard task specification must be defined and compared with the Resources Blueprint. We then introduce two task classes, depending on whether they are assigned to specific resources or not. Unassigned tasks formulate the Abstract Task class and are characterised by their specification, whereas tasks that result as an assignment process set up the Concrete Task class.
Definition 3 (
Abstract Task)
. An Abstract Task () is defined as a theoretical quantity, representing the smallest unit to which a Business Process can be broken down. We denote the set of all by (set); given that , it follows that .
Typical examples of
range from video transcoding to file encryption, voice compression and querying a database (a database
example is illustrated in
Figure 7). The specification of each
includes the following parameters:
DoF: a textual description of the functionality that the implements
API: the interface of the , which is used to identify the possible interconnections (edges in the ) of this with other
TLS: a Boolean parameter that indicates whether the complies with encryption/security guidelines or not
Type: this parameter is the same as the one in the Resource Blueprint
Details: this parameter is the same as the one in the Resource Blueprint
Definition 4 (
Abstract Graph)
. Following the definition of the , an Abstract Graph () is a directed graph whose nodes are Abstract Tasks (Figure 8). It represents a business process, before identifying the candidate resources that could perform the tasks. The figure above presents an indicative Abstract Graph, which in this case includes four possible paths to reach the goal (end task) of the specific Business Process of the . The blue dots represent both the start and the end Abstract Task of the Graph. On the other hand, the red colour is used to indicate other tasks.
Definition 5 (
Concrete Task)
. A Concrete Task () is defined as the with exactly one resource allocated to it. It could be considered as an ordered pair (two-tuples), where the first object is the specification of the corresponding and the second one is the Blueprint of the resource allocated to the .
3.1.2. Resource Allocation Process
This process is carried out by the Resource Pool Manager (introduced in
Section 3.2) and is represented by a one-to-one mapping that accepts input of
and returns a list of
. The process must ensure that the same resource can be selected for multiple
. Moreover, only a subset of the resource set is suitable for each
; this subset is defined by comparing the specification of an
and the Blueprint over all the available resources. As a working example, we apply the mapping to
(
), whose specification is presented above, to one or more specific resources. Before proceeding, it is crucial that we introduce the theoretical framework needed for a procedure to be realised. To do so, we denote the sets of abstract and Concrete Tasks by
and
respectively. Then, define a map
F in the following way:
It is evident that F does not satisfy the definition of a function, in the sense that if , then it is true that , such that ; something that contradicts our initial assumption.
In this spirit of assigning a single element to a plethora (list) of , we introduce the notion of an equivalence relation.
3.1.3. Relations
We define a relation S on a finite set X as a subset of the Cartesian product . Now, and are said to be related if the ordered pair , where . The number of possible relations is the total number of subsets of , which is no other than .
Equivalence Relations
For our purposes, we turn our attention to a special class of the relation set. Let be in a finite given set X. A binary relation S is then called an equivalence relation if and only if S is:
Reflexive:
Symmetric:
Transitive: If and , then .
We denote the equivalence relation with ∼, and for two elements we write , that is: is equivalent to under a specific equivalence relation.
Partitions
Given a finite set X, a collection of its subsets , is called a partition if and only if:
A partition is essentially “splitting” the set into disjoint subsets, such that their union constitutes X, whereas it is well-defined in the sense that there exist no empty subsets.
Prerequisites are then concluded by the definitions that follow.
Equivalence Class
An
equivalence class is denoted with
, and it is defined as:
An important result of this is that for any two equivalence classes , it holds that or . We are now ready to introduce our equivalence relation.
3.1.4. Equivalence Relations on Abstract and Concrete Tasks
For the sets of Abstract Tasks and Concrete Tasks , we introduce the following relation between the elements of with the help of mapping F:
Given two elements , we say that is equivalent to if and only if and are images originating from a common element in .
A more formalistic way to put forward the above is the following:
For the sake of completeness, we show that is indeed an equivalence relation.
is reflexive: For every Concrete Task , if there exists an Abstract Task , then the “other” element also equals . Hence, .
is symmetric: Let
, and let
. Then:
Hence, .
is transitive: Let and , . Then, given , we have that and . However, we know that , which translates to: and . Hence, and , which simply means that .
Given that
is indeed an equivalence relation, we are ready to introduce the corresponding equivalence class:
Application of
creates a disjoint union on the set of subsets of
, i.e., a partition
P of all possible outcomes. Let us define a map
in the following way:
, such that
. This mapping will assist us into constructing a function between the set of Abstract Tasks and the partition
P of
. We are now ready to construct a function
f between the set
and the partition of
. For every incoming task of the sequence of Abstract Tasks, this function has to be bijective, as well as well-defined, i.e., the empty set cannot be part of the equivalence relation. Let
f be defined as:
with its closed form:
. This is indeed a well-defined function since by definition; any partition does not contain the empty set. Moreover, at each consecutive
i-th Abstract Task element, a new partition
of the available Resources is realised.
Passing on to the working example,
could be defined as “all the data stores that are MongoDB AND contain the collection employees (
)”.
Figure 9 depicts (a) the Abstract Task
illustrated with a yellow circle, (b) the set of available resources of the
(green and pink boxes in the middle of the figure) and (c) the subset of those resources (on the right) that satisfy the equivalence relation
, which is illustrated with the red arrow. Initially, the pink resources are excluded since their type is computational and not data store. Moreover,
is also excluded as it is not a MongoDB, but a Cassandra one and does not contain the needed data. Consequently, the resource allocation process results in matching
to a list (two) of
, whose resources are
and
, respectively, as shown in
Figure 9.
This repetitive process applies to all (one by one) that need to be assigned to specific resources. The final result of the Resource Allocation Process is the Concrete Graph.
Definition 6 (
Concrete Graph)
. A Concrete Graph is a directed graph whose nodes are Concrete Tasks. It represents a Business Process, after identifying all the candidate resources that could perform the tasks.
In
Figure 10, a Concrete Graph that is derived from the Abstract Graph (
Figure 8) is depicted. The oval shapes, notated with capital letters, represent different Virtual Entities. The blue dots represent both the start and the end Concrete Task, similarly to the Abstract Graph. The green colour is used to indicate that after the resource allocation process, the corresponding
matches to exactly one resource and therefore to a set of
s that contains exactly one element (singleton). On the other hand, the yellow colour is used to highlight that the
derives from an
, which matches to a set that contains more than one
s, thus creating one or more different paths in the Graph. For example, the last
of the bottom path in
Figure 8 matches to four
s that are circled in
Figure 10 within
H Virtual Entities. There are also cases where
s that derive from the same
do not belong to the same
, as circled within
I and
J s in the figure bellow.
The way the goal of a process is achieved reflects the need of a framework that should be able to implement business processes in different ways (e.g., including or excluding a task, using cloud or edge resources etc.). In addition, the current conditions of the system in terms of security, availability of resources, saving energy or even in case of an emergency have to be taken into consideration. Therefore, the selection of the most suitable path depends on the current state of the system that has been declared by the Security Officer (Actor) of the .
Definition 7 (
State)
. State is an abstract and generic concept that is used to describe the current conditions of the , the goals that need to be achieved and possible events/threats that are taking place, like a terrorist attack.
Following this definition, it is necessary to determine the values that the State could be in, in a . This, in turn, provides comprehensive and effective means to disseminate information regarding the kind of conditions that may affect the operation of the . This logic leads us to identify four values for the State parameter.
Normal: This state implies that the is operating under regular conditions. During its existence, the will mostly be under this state, and if it is not, actions either subtle or vital will be taken in order to recover and return to this state. This is the desired state of the .
Energy Efficiency: During this state, the aims to decrease the energy consumption (footprint) for its working processes. There are cases where this goal requires some kind of compromise, like higher execution times, in order to be achieved, but on the other hand, it could save money or it could be a way to achieve governmental goals in energy efficiency.
Isolation: Under this state, every external data source in relation to the is ignored, in order to create a layer of data isolation. There are cases where a receives information from outside sources like public services, utility companies or even from social media and news feeds in order to provide advanced, more accurate and detailed results to end users. However, there are cases in which the external sources or even the network itself are not reliable, causing corrupted or misleading data. Unverified data could cause unexpected behaviours within the system and by extension of the .
Critical: This state reveals that the is or will be under some kind of threat and there is a dire need for protection of its vital operations and its integral systems. The danger could originate from the external environment, in the form of a terrorist or a cyber-attack, or it might originate from within the , such as a major system malfunction.
The State refers to the as a whole, but each graph of the should follow its own rules and functionalities depending on the State. Therefore, when the Security Officer declares a distinct value for the State, the following parameters for every graph change in a deterministic way (e.g., selecting the appropriate condition from the UI when a terrorist attack is under way):
Constraints: A set of rules that could exclude one or more Concrete Tasks and consequently the path (or paths), thus changing the way a graph could be accomplished. Four Constraints have been identified, but more can be added depending on the business intelligence that is required.
Enforce Security Limitations: Every resource outside the must comply with security and privacy guidelines for its communication with the .
Enforce Operation Period Limitations: The Operating Administrator defines working hours for each device in the system meaning that outside of these hours, it is not recommended to use these resources (a reason could be to reduce the energy footprint of the ). If this Constraint exists, then all the tasks that run on a resource outside of its working period will become unavailable.
Enforce Operation Time Limitations: The Operating Administrator defines the maximum time of a task execution. If this Constraint exists, then the tasks whose execution exceeds the threshold time will become unavailable.
Restrict to Resources: If this Constraint exists, then the Concrete Tasks and eventually paths that include interconnections with external service providers are not valid.
Prioritisation: This criterion describes the level of priority of each graph. When a G has a higher priority (compared to others), it will contest the resources of the more frequently, making the rest of the graphs that have lower prioritization slower. Six levels of prioritization have been identified:
Emergency: The highest level of prioritization. The safety of vital assets is threatened, meaning that the whole operation of the is at risk. Initiation of the corresponding processes is set into motion, as well as diversion of resources as necessary.
Urgent: Not a “life-threatening” emergency. This level implies that certain processes are required for the continuous operation of the (e.g., maintenance or repair work). These processes have to be completed in order to ensure the continuous and uninterrupted operation of the facility.
High Priority: Processes that are essential, under normal working conditions, have this level of prioritization.
Medium Priority: Processes of the that are important, but fall below higher priority processes, are found at this level. Their execution depends on the availability of resources and whether more crucial ongoing processes are in effect.
Low Priority: Processes that are desired, but not that essential in terms of completion fall into this category. Typically, new, untested or secondary processes are given this level of priority.
No Priority: This level contains processes of the that may be safely postponed without any major economic or operational impact. These processes should be executed, but cannot be scheduled due to ones with higher priority, or due to fund shortages, or conditions outside of the . A reclassification in the future can lead to their eventual execution.
Routing Algorithm: A criterion that is used to determine which path (if there are multiple available and valid ones) is going to be selected in order to reach the end node of the graph. Apparently, only one Routing Algorithm is valid at a time. Three possible Routing Algorithms have been identified:
Shortest Path: It is used to minimize the total execution time of the graph. The way to calculate the execution time of each edge in the graph is defined in Definition 1.
Minimum Nodes: It is used to minimize the number of tasks needed to traverse a graph.
Minimum Virtual Entities: It is used to minimize the number of Virtual Entities involved in the graph.
According to the graph in
Figure 11, the selected path per Routing Algorithm for that Business Process is the following:
Shortest Path: path (blue path, 11 time units)
Minimum Nodes: path (green path, 6 tasks)
Minimum Virtual Entities: path (red path, 3 Virtual Entities)
In case the Routing Algorithm is the Shortest Path, then the State also defines for this graph:
The function that calculates the weight of the edges in the graph (ratio between benchmarking and monitoring data).
The number or percentage of the paths that could actually be deployed, given the ranking of all the paths based on their total execution time (e.g., top 10%, or top 5%). That parameter is necessary when the graphs are too complex or big for a complete re-evaluation during runtime due to computational overhead.
The time period (window) where the Framework re-evaluates the total execution time of the above paths, a process that would consequently lead to path changes.
As mentioned, the State of the , determined by the Security Officer, holds a distinct value that assigns the Constraints, the Prioritization and the Routing Algorithm per graph. Therefore, full control of all the Business Processes is achieved, while at the same time, the systems of the are able to adapt to its current needs, in a fully-automated and efficient way. The rationale behind the uniqueness of the State within the whole is that the proposed framework needs to manage the interference between the various Business Processes of the , since those usually compete for the same resources. In order to deal with that issue, the framework should primarily consider the current conditions of the , which are actually reflected by the current value of the State. For instance, that necessity becomes more clear taking into account a like a port, which is examined in this paper, and the way through which its mechanisms should react in case of an incident like a terrorist attack. When such events occur, the safety of the passengers and the staff is the main goal. At the same time, processes like face recognition for terrorist identification become significant. On the other hand, processes like vessel traffic, port handling and logistics should be postponed or should not use resources that main and urgent processes should take. If those processes had a different State, then it might be the case where valuable resources, which should be dedicated to the people safety, would be occupied by less important processes like logistics.
However, there could be slices that should be isolated and independent of the rest part of a
, like a nuclear reactor within an energy manufacturing infrastructure. For security reasons, the reactor has preallocated and isolated resources. The architecture of the proposed framework could also adapt to these types of infrastructure, but such a kind of
s is out of the scope of this paper. In these cases, the Resource Pool Manager (introduced in
Section 3.2) and its subcomponents would annotate the resources, which belong to the nuclear reactor
, as unavailable for all the other business processes of the
. Consequently, despite being under the same State, the resources of the nuclear reactor are still totally devoted to its needs.
3.2. Architecture
The idea behind the design of the architecture of the system is to easily scale its processes and the type and amount of data that it could host and handle, considering the various needs of the states. At the same time, it should be able to adapt to highly unstable environments and respond accordingly in order to manage the resources efficiently. The architecture and components are developed in order to efficiently manage the complex and heterogeneous operations of a along with delivering crucial information about the status of the overall system to the actor (Security Officer of the ). Another goal of this architecture is to maximize utilization of the underutilized resources in order to increase data that the could receive and use. Offering even more data to the infrastructure and taking full advantage of available underutilized resources ensure smooth operation of the system and increase the accuracy of the information that the processes produce, giving better response mechanisms against threats. Furthermore, a high level of transparency of the operations performed in the framework should be available, since it is one of the main objectives in a .
Every component that is going to be described in the following paragraphs contributes to the orchestration and better utilization of resources, so that the main processes are executed in an optimal way. At the same time, by the continuous monitoring of the components that produce or store data, the system can investigate—via deep learning algorithms—patterns regarding the operational status and performance of every component and resource, both at present and in the future.
Figure 12 depicts all the components and the connections between them that compose the architecture of the Framework introduced. Seven major components are going to be described and analysed in the following paragraphs. In order to comprehend the relations and functionalities of each of the components, we will present the life cycle of the architecture, as well as how this architecture responds to State changes and manages resources in order to become more efficient.
Business Continuity Framework: This component is the backbone of the architecture, and it is responsible for the orchestration and control of the information flow. Moreover, it handles the connection between system components, as well as deployment of the processes. Finally, it is the means that enables the Actor to interact with the Framework through a user-friendly interface. The Business Continuity Framework contains four subcomponents:
Dashboard: The main purpose of the dashboard is to make the Framework functionalities accessible to the actor through a user interface. The dashboard, as a subcomponent of the Business Continuity Framework, provides information about the current State of the system, displaying real-time analytics of the running processes and proposes recommendations regarding the optimal administration of the and its processes. Along with the fact that it presents a general overview of the system, the dashboard enables the Actor to proceed with State changes, if deemed necessary by the status of the infrastructure.
Orchestration Engine: This component is responsible for the orchestration, deployment and real-time management of the Business Processes that are portrayed as complex graphs (created by the Graph Resolver). It enables resuming, restarting, stopping and blocking capabilities for these complex processes, and at the same time, it can trace and benchmark every available path for further evaluation. Another goal is to take corrective actions to ensure the efficiency and reliability of the by selecting the optimal path for a specific time window. Additionally, it offers complete visibility concerning the status of the graphs, giving the Actor the power to alter them.
Deployment Engine: This component is an operating system-agnostic middleware, responsible for hosting and scaling the integration tool, which is responsible for the orchestration of the processes as presented above and has to deploy Virtual Machines or micro-containers for the processes that require it. Moreover, it works in direct relation with the monitoring component, to evaluate the resources constantly and to keep track of the performance of the containerised services.
Semaphore: The heart of the Framework’s architecture is the Semaphore, because communication of the components is conducted and orchestrated through it. Specifically, whenever the State is changed by the Framework or by the Actor, the Semaphore is triggered and enables the interaction between the Dashboard and the Resource Resolver. This initiates the matchmaking process between the Abstract Tasks and the Resources. This action is initiated after the change of State, which the Actor or the Framework could make due to a scheduled or an unexpected event. In addition, the Semaphore gathers the necessary information from the Policy Repository, in order to retrieve the policies that affect the Constraints, the Prioritization and the Routing Algorithm of each Concrete Graph. Furthermore, it interacts with the Policy Resolver and the Micro Benchmarking System, in order to apply Constraints to each Concrete Graph and to conduct benchmarks. All these communications are needed so that the Semaphore can send the necessary information and graphs to the Graph Resolver component in order to compute the optimal solution/path. The stateless nature of those operations, as well as the distribution of the operations that the Framework needs to perform in order to reach the final flow of tasks, makes the Semaphore a very crucial component for the procedures of the system.
Resource Resolver: This component is responsible for selecting the best candidate resources given an Abstract Task. Every Abstract Graph contains many Abstract Tasks, which can be performed by specific resources. There is a need to map every resource based on their description with the corresponding Abstract Task. The result of this mapping is the Concrete Graph that contains all the possible resources for the tasks in order to complete a specific process. Creating this mapping is not sufficient. Furthermore, the appropriate quality control is performed for all the resources in order to assure efficient management. There are four subcomponents in the Resource Resolver:
Process Manager: Given a specific State change, this component gathers all the appropriate Abstract Graphs (business processes that need to be performed at a certain state) from the Infrastructure Processes Repository in order to organise them and send them to the Resource Pool Manager. Afterwards, the organisation of the resources, the matchmaking between the Abstract Tasks (that the Abstract Graphs contain) and selection of the resource that can perform these tasks (delivered from the Resource Pool Manager) are carried out. After the operation of the following components, the Process Manager transforms the Abstract Graphs to Concrete Graphs.
Resource Pool Manager: Receiving all the Abstract Tasks (delivered from Process Manager) as input, this component initiates the resource discovery procedure. Primarily, it requests all the resource blueprints, which match with each Abstract Task specification, from the Registered Resource Repository. This repository contains all the blueprints that describe every resource within the so that the Resource Manager can identify the compatibility of every resource and assign it to the proper Abstract Task. Therefore, evaluating the compatibility of a resource regarding a given task is the first step towards mapping. However, resources can be off-line or generally unavailable, automatically excluding them as eligible candidates. The Resource Pool Manager, given the type of a resource (either a computational resource or a data store resource), sends a signal to the appropriate quality control subcomponents.
Computational Node Manager: This component is responsible for evaluating all the candidate resources that are of a computational nature. Specifically, the Computational Manager gathers information from the Monitoring component and evaluates it based on the availability of the resources, their utilization and the computational load they currently have in order for them to fulfil certain quality characteristics. In addition, it could be a Service Level Agreement () that needs to be taken into consideration for the resource selection.
Datastore Node Manager: In the same manner as the Computational Node Manager, this component evaluates the resources related to data storage. Just like the computational resources, so do the data repositories have some quality characteristics. This component evaluates the resources on two levels. Keeping in mind that many repositories can contain eligible information for a specific task, the first evaluation measures the quality of data for each one of these sources. Nevertheless, evaluating the quality of the data can also ensure the best matching between a data store resource and an Abstract Task. As a second step, it evaluates the capabilities of the data stores by taking into consideration characteristics such as scaling, cloning and also capabilities like data movement and cashing.
Policy Resolver (Policy Enforcer): In a Critical Infrastructure, there are specific policies defined for each of its processes. These policies must be implemented by the Framework, by translating them into rules that transform the graph to the desired form. To be more precise, the Policy Enforcer uses the Concrete Graphs from the Resource Resolver (through the Semaphore) as input, as well as the policies from the Policy Repository to deliver a more refined Concrete Graph that marks all the nodes that do not meet the Constraints regarding the policies of the . This graph is then delivered back to the Semaphore, which forwards it to the Graph Resolver.
Micro Benchmarking System: This component is responsible for conducting real-time benchmarks for every path of a Concrete Graph in order to calculate the execution times of the Concrete Tasks. It is a lightweight benchmark tool that performs benchmarks with the minimum amount of load in order to avoid overhead in the system and its resources. All the results from the benchmarking are stored in the Historical Repository in order to be used by other components, such as the Graph Resolver. The operation of micro benchmarking is triggered by the Semaphore for every Concrete Graph whenever a change takes place in the ’s State. As the execution times of the Concrete Tasks may vary from time to time regardless of the ’s State, the Micro Benchmarking System is triggered periodically for an already deployed graph by the Orchestration Engine for re-evaluation purposes.
Monitoring: The Monitoring component is responsible for constantly monitoring the resources operated by the and the processes that are currently running. It works in direct collaboration with the Deployment Engine and delivers monitoring information to the Resource Resolver for evaluation purposes. All data produced by this component is stored in the Historical Repository in order to be mainly used by the Graph Resolver component for conducting graph resolution and finding the optimal paths based on this data.
Graph Resolver: This component makes the final decision regarding which path of the Concrete Graph is the most suitable for a given State. It receives input from both the Policy Repository and Historical Repository in order to take under consideration both the active policy and the performance of the resources. The Graph Resolver contains two subcomponents:
Graph Resolver: This component is in charge of updating the graph provided by the Policy Resolver through the Semaphore with all the necessary information so that the Path Resolver is able to find the optimal path. This component queries the Historical Repository to get three sets of data. The first one consists of data derived from the benchmarks performed on the graphs; the second one contains all the data that were collected during the runtime by the Monitoring Component; and the last one is a correlation (scale comparison) between the first two. The reason for having the third dataset is because the computational load in real-time monitoring differs from the computational load produced by the micro benchmarks; this dataset acts as a bridge between the other two and helps the evaluation of each graph in order to apply the appropriate weights to them. Moreover, the Graph Resolver communicates with the Policy Repository. The reason behind this connection is that a policy of any given State dictates the ratio of monitoring and benchmarking data that should be considered when calculating the weights of the graphs’ edges. A good example is that, in the case of an emergency, the latest benchmarking data is more crucial than the historical captured data of a path, so the policy dictates that the final value will mainly be produced from benchmarking data, while historical data will have less impact (i.e., vs. ).
Path Resolver: The Path Resolver takes the weighted graph from the Graph Resolver and runs the appropriate algorithm. The algorithm that is going to be applied to the graph in order to find the optimal path is decided based on the policy related to the given state. This algorithm will run using the graph weights that the Graph Resolver has generated. Specifically, the Path Resolver takes into account not only the weighted graph, but also the routing algorithm specified for the given state by the Graph Resolver; for instance, if the State is “emergency”, then the policy dictates that the “shortest path” algorithm is going to be used on the graph. Taking into consideration this information, the Path Resolver will run the Dijkstra algorithm to find the shortest path.
Recommendation System: In contrast to the Orchestration Engine, in which the actions are reactive, the Recommendation Engine is designed to be proactive. Its scope is to assist the Actor with best practice guidelines, hints and recommendations, in order to (a) modify the graphs in case of dead loops (where two or more graphs are constantly swapping paths between each other), (b) alert the Actor in case a specific state could cause major delays and (c) provide a better system overview. In addition, it analyses the information, which the monitoring component produces and stores in the Historical Repository, for pattern identification. The results of this analysis (using deep learning algorithms) are stored in the Pattern Repository, and the components can consult it so that they can detect threats or operational anomalies.
3.3. Sequence
After the description of the general architecture and its components, illustrating the life cycle of the system should be the next logical step. To demonstrate the life cycle, we chose to examine the operation of the system when a change of the global state of the Critical Infrastructure is enforced. To represent this, we use sequence diagrams that follow the Unified Modelling Language (UML) 2.0 paradigm. These type of diagrams show object interactions arranged in time sequence, thus providing a very comprehensive description of the actual life cycle. Furthermore, we have divided said life cycle into three separate sequence diagrams named “Resource Resolving”, “Constraints and Micro Benchmarking” and “Graph Resolving” (
Figure 13), in order to make it more coherent for the readers.
The first diagram displays the communication of the components that are involved mainly in the
Resource Resolver and the assignment of the tasks into specific resources inside the
ecosystem. Everything starts when an external actor forces a change to the global state of the
, by using the Dashboard that the Business Continuity Framework has provided, as shown in the picture above. This message will be forwarded by said Dashboard to the Semaphore, which will communicate with the Process Manager in order to retrieve the active graphs (Business Processes) of this new state. These graphs are stored in a repository called the Infrastructure Processes Repository, and they contain Abstract Tasks (
) at every node, meaning that each task has not been assigned to any resource. Therefore, when the Process Manager asks for these graphs, the repository will return all the active Abstract Graphs (
) for the new state in which the
is found. The next step is to assign all the
of the selected graphs to resources. The Resource Pool Manager is the one that will perform this job for every single
, and it will take place in two stages. First, there has to be a communication with a repository that holds the blueprints for each
resource (Registered Resources Repository) in order the match the
with the resources that are able to perform it. Afterwards, when the blueprints of the candidate
resources have been retrieved based on the matching that took place in the previous step, there has to be an actual validation of these resources to figure out whether the allocation is possible. Taking into consideration the type of
, the Resource Pool Manager sends the matched blueprints to either the Computational Nodes Manager or Data Store Nodes Manager to validate these resources in real time and receives the blueprints that correspond to the ones that are ready and capable to run the
. When this assignment is completed for every
, the Resource Pool Manager will have a list of Concrete Tasks (
) for every
, which indicates the resources that can run a specific
. This list will then be forwarded to the Process Manager in order to assign the
to each
and eventually generate the Concrete Graphs (
), which are graphs that contain the
, which means
that have been assigned to the
resources. The
will be sent back to the Semaphore in order to continue the life cycle and eventually deploy them. The sequence diagram of the interactions that we just described is depicted in
Figure 14.
The second stage begins after all
of every active
have been assigned to resources, thus creating the
. This stage is about applying the Constraints using the
Policy Resolver component and running benchmark tests on the
using the
Micro-Benchmarking System. The Semaphore asks the Policy Repository for the Constraints, the Prioritization and the Routing Algorithm (given the State) for every
. When the Semaphore receives those values, it will communicate with the Policy Enforcer and the Micro-Benchmarking System. The Policy Enforcer will apply Constraints on every graph and will return to the Semaphore the new constrained Concrete Graphs (
). Meanwhile, the Micro-Benchmarking System will benchmark every
, given the new state and each graph’s Prioritization, and store the results on the Historical Repository in a parallel fashion. When these operations (benchmark and storing) are completed for all of the
, a confirmation message will be sent back to the Semaphore. At this point, the Semaphore has the
, and the benchmarking of the
is completed. The sequence diagram that shows these actions is illustrated in
Figure 15.
In the final step of this process, the system resolves the
with the assistance of the Graph Resolver component. The first course of action is for the Semaphore to send the global state and the
to the Graph Resolver along with the Constraints, the Prioritization and the Routing Algorithm of each graph. The Graph Resolver needs to generate weights for the edges of the graphs in order for the Path Resolver to find the optimal path for the deployment phase. For every
, the Graph Resolver checks what kind of Routing Algorithm has been dictated by the policy. In the first and easy case, setting the weights of the edges is straightforward due to the routing algorithm (e.g., Minimal Nodes), so they are generated immediately. On the other hand, if the Routing Algorithm is the Shortest Path (based on time), a more complex procedure must take place, because the way the weights on edges is calculated may change according to the policy that the graph follows. First, the Graph Resolver must communicate with the Policy Repository and ask what kind of data types are needed from the Historical Repository and under what kind of formula they are combined in order to generate the appropriate values. Afterwards, for every
of a
, the Graph Resolver will query the Historical Repository and will receive the duration process times concerning the specific state, timestamp and graph. Along with these records, there is also a value that represents the relation that these duration times might have. That is due to the fact they might be coming from different data types (e.g., benchmarking time vs. real-world scenario time). When all this information is available on the Graph Resolver, the weights on the edges of the graphs can finally be calculated, thus concluding the case of the Routing Algorithm being the Shortest Path. Further on, the Graph Resolver will now forward the newly-created weighted
to the Path Resolver with their policy values (Constraints, Prioritization and Routing Algorithm) and will evaluate the optimal path plus some of the next best candidate paths in order to have alternative routes during the runtime. The completely resolved graphs will be forwarded to the Semaphore, and from there, they will be sent to the Orchestration Engine in order to be deployed. These actions are illustrated in
Figure 16.
4. Test Case and Validation
For validation, we choose to test our proposed Framework at a Greek port. Greece’s port infrastructure is being constantly upgraded and improved to meet the needs of cargo shipping, security concerns and the country’s tourism. As the port’s ecosystem constantly evolves, so must its needs, its services and data. A port is a complex system that consists of multiple heterogeneous critical infrastructures, which are connected and dependent on each other.
Mandatory elements of this complex system are: ports, ships and ICT supporting and management systems. The maritime transportation system operates using information and communication systems. These systems play an important role in each of these links as a core platform for the information exchange and support the safety monitoring of people, vessels, equipment and cargo in ports and during the ships’ waterway passage. Based on their interdependencies and interconnections, port operations can be classified into three different
networks: the port
network, the shipping
network and the ship traffic and port operation information
network, as introduced in [
39]. Dependencies between these operations, as well as strong interconnections between the different
s, can lead to a cascade of failures or a domino effect. A disruption of a
network or the
itself may become a source of disturbance for another
or
network. Furthermore, the need of resilient systems arises in order to provide the ability to withstand the slings and arrows of life and operations, from human error to migration failure to natural disasters. Any of these factors can disrupt or even cripple the port’s functionality. For all of the reasons presented above, a port seems to be the most suitable candidate to test our Framework implementation. Its main goal is to increase the resilience of the port’s
assets at an individual level and more importantly to shield them from cascading failures.
There are five major Virtual Entities (
) that form the port ecosystem, as depicted in
Figure 17. One is the Security and Control Network, that is responsible for the security of the infrastructure and its surveillance. The Governmental
keeps the data backup of the whole Infrastructure in case of failure or data loss. The primary
consists of the main Infrastructure premises where the offices and the main data and computer rooms are located. The Cargo and Traffic Monitor is the
that controls and navigates the vessels, schedules the arrivals to the port, informs and communicates with vessels and handles bulk cargoes. Finally, Cloud Providers compose a secondary solution for process execution and data backup and retrieval. The resources that are used by these
are presented in
Table 1.
There are various types of network links between and several redundant ones, as this is vital for their communication. Wide Area Network (WAN) is the main way to communicate between on-premises and off-premises buildings. For redundancy or Quality of Service (QoS) purposes, some vital Business Processes have been assigned dedicated leased lines or satellite communications. In the following sections, we introduce tests that highlight the core concepts of the Routing Algorithm, Prioritization and Constraints, as well as tests regarding the performance of the overall system.
4.1. State Change Paradigm
A process of the Critical Infrastructure system is actually a business functionality, and as mentioned, a graph with multiple paths and tasks can describe it accurately. Each of these graphs, considering the global state of the , have three identifiers: the Routing Algorithm, Prioritization and Constraints. In this section, we will present examples of State change on the and will try to highlight how these identifiers affect the chosen path, by showing the before and after status of certain graphs.
4.1.1. Routing Algorithm Use Case
In the first use case example (
Figure 18), there is a graph that operates on an “Energy Efficiency” State and uses “Minimum Nodes” as its Routing Algorithm. The Constraints and the Prioritization are not important in this example; for completeness, we assume that there are no Constraints and no specific Prioritization. In this state, the path chosen has a value of 43 s, but time is of no importance due to the Routing Algorithm chosen (green arrow path in "Before" graph,
Figure 18).When the State changes to “Normal”, which forces the Routing Algorithm to also change to “Shortest Path”, the chosen path should be re-evaluated. At the end, a different path is chosen, one that accumulates 28 s and complies with the new Routing Algorithm (green arrow path in "After" graph,
Figure 18).
4.1.2. Prioritization Use Case
In the next use case, there are three different running graphs under the State “Normal”. These graphs do not have any special Prioritization, and they all use the same Routing Algorithm, the “Shortest Path”. One thing to notice is that all of them have
one common Concrete Task in Node 4, which is why that node is highlighted (
Figure 19). When the State changes to “Critical”, Prioritization changes are imposed on graphs
and
without any Routing Algorithm and Constraint changes. The graph
has the highest priority, which means that its tasks have high priority, as well.
’s priority also increased, but it stays behind
, while
takes last priority. What we notice in this case that the path of
, which uses Node 4, becomes faster (28 s prior, compared to 22 s now) due to the fact that
is using the resources for Node 4 more and therefore decreasing the processing time on that node. On the other hand,
stands at the bottom of the priority list, so using Node 4 increases the time of the chosen path from 40 s to 51 s, ultimately forcing an alternative path that has a value of 44 s, complying with the Routing Algorithm. Finally, yet importantly, even though
has a higher priority than before, it also received an increase in time, from 30 time units to 35, because using Node 4 led to competition with “Urgent” priority graph
. That time increase though was not a substantial one, and it had no effect on the path because
’s priority is higher than
’s.
4.1.3. Constraints Use Case
In order to understand the effects of the Constraints on the path choice, a model, as depicted in
Figure 20, was designed, where a graph under the State “Normal” enforces the “Minimum Nodes” Routing Algorithm and medium Prioritization. In this State, there are two Constraints that the path needs to follow, the first being “Enforce Security Limitation” and the second being “Enforce Operation Time Limitations”. These Constraints ultimately give the results that are presented in
Figure 20 before the State change. One can notice here that Nodes 3 and 4 are “crossed out”. This crossing out implies that the path cannot include these nodes because the Constraints will not be fulfilled.
When the State changes to “Critical”, the “Shortest Path” Routing Algorithm is implemented, and the Prioritization of the graph receives the characterisation “Emergency”, changing some of the values of the edges. In this test, two different cases are taken into consideration. In the first one, when the State changed, the Constraints remain the same, but the Shortest Path (22 s) cannot be chosen because it uses Node 4; therefore, the system compromises with an alternative one that accumulates 31 s. The second test shows that, if some of the Constraints are loosened or removed while using the same Routing Algorithm, a better outcome can be achieved. By removing the “Enforce Security Limitations” Constraint, Node 4 can now be used, and the fastest path of the graph can be ultimately deployed.
4.2. Framework Application on the Port Critical Infrastructure
In this section, we present the results that derive from the Framework when used at a Greek port. In detail, we measured its responsiveness and adaptivity under unstable or unpredictable conditions. We identified both cases in which the result was expected, as well as situations where the Framework struggled to figure out optimal solutions. These situations could be pinpointed and indexed by the system for future reference.
4.2.1. Resources Utilization Use Case
In the first use case, we evaluate a process that, before the State change, was under the Minimum Nodes Routing Algorithm, and after the State change, it will be under the Shortest Path. The scope of this test is to present the utilization changes of the involved resources in regards to the execution time of the selected path (the flow within the red frame in
Figure 21). Before this change, the selected path was the one with a single node, the “Cloud Service Provider”, as shown in
Figure 21. Due to this selection, the utilization of that resource is extremely high, as the blue coloured line shown in
Figure 22b. After 141 s, the State changed to Normal, which forced the Routing Algorithm to change to Shortest Path (
Figure 22a).
After that point, the chosen path, which is the fastest one, consists of three nodes. The path that consists of the “x64 PC (transcoder)”, “Spark Cluster” and “Raspberry Pi 3” nodes in that exact order is now the selected path (
Figure 21). From now on, every new execution uses the path that utilizes these nodes. The path change results in an immediate increase on the first node’s (x64 PC) utilization (orange line in
Figure 22b); respectively, the “Cloud Service Provider” utilization decreases as the tasks that it has to carry out are declining. When the rest of the nodes “Spark Cluster” and “Raspberry Pi 3” start to receive tasks, there is an increase in the reduction of the utilization for the “Cloud Service Provider”. The black box of
Figure 22b highlights the period where all the resources of the selected path are starting to accept tasks. As the tasks are in sequential order, their utilization increase will happen accordingly. During that period, the utilization of the initial path is falling because the remaining tasks that were using it are getting finished.
Chart (c) in
Figure 22 illustrates this gradual change. It presents the average total time of the path executions and how the change that we made after 141 s in the State affects them. The average time of the two paths is about 60 and 40 s, respectively. The transition period starts at about 40 s after the change (as shown in
Figure 22c with the blue vertical line) because that is when the first graph that uses the new path is completed; thus, after 181 s, the average completion time starts to decrease (green vertical line in
Figure 22c). From that point on, the executions that we observe are coming from both paths. In about 60 s after the change (201 s), the last graph execution via the first path has been completed, and therefore, the total time stabilizes (magenta line).
4.2.2. Benchmarking Window Use Case
In the next use case, we have a graph with four different paths.
Figure 23 shows the total execution time of the paths, when benchmarking them after every second. In that use case, we illustrate the advantages and disadvantages of different “window” intervals using as a base reference the benchmarks that we performed at the 1-s window.
The window’s interval values are presented in the next four charts (
Figure 24) and are 1, 30, 60 and 240 s, respectively. Using a small window, the system is able to identify faster disconnected paths that could be created due to failures ofa resource. Moreover, the smaller the window is, the faster the optimal path will be identified. In the Critical State, this can be crucial as the required goal is to achieve short and stable graph execution time through the best path selection. For example, at the 498th second (indicated by the vertical red line) of
Figure 23, the purple path (Path 4), which was the fastest one, doubles its execution time, leading to different permutations given different windows. This event in the 30-s window case is observable after 12 s on the 510-s mark (indicated by a red arrow) in
Figure 24b, whereas in the 60-s window case (
Figure 24c), after 42 s on the 540 s mark (indicated by a red arrow). On top of that, using a 240-s window (
Figure 24d), the system is not only able to adapt to this change, but it also does not perform any switch to the selected path until the 720-s mark (indicated by a red arrow).During that period, the 30-s window case has led to 10 path changes and the 60-s window to five changes. On the other hand, using a 1-s window, the system performs more than 50 changes, and 20 of them happen in less than a minute. Therefore, the system can be affected by windows that are too small, through continuous unnecessary path switches, which overburden it with extra overhead. As each business process has different requirements and goals, we have to balance between the late response and the process overhead that benchmarking produces.
4.2.3. Overall System-Priorities Use Case
In the last use case, we simulate 134 different Business Processes (graphs) of the
, and we run them in parallel. We enforced a State change from “Energy Efficiency” to “Normal”, causing the system to re-evaluate the graphs based on the new Prioritization, Constraint and Routing Algorithm parameters. The scope of this use case is to present the overall performance of the system and how that could benefit the
by giving the opportunity to use underutilized resources or reallocate them in a way that will best serve the new conditions that the global State has dictated. Furthermore, we evaluated the process execution time taking into consideration the Prioritization of each graph. The main concept of this case is how different processes compete for the available resources, based on their Prioritization. This situation is created because identical resources are specified in a common, unified way (Resource Blueprint), making them candidates for more than one task. The resources are in a main pool, as was shown in
Section 3.1, so some paths that are included in different graphs could contain nodes (tasks) that use the same resource.
We picked 11 indicative graphs, out of the total 134 graphs, which had their priorities changed, while the Routing Algorithm remained the same (Shortest Path). In
Figure 25, we demonstrate the total execution time of those graphs. The first outcome we notice is the improved execution time (after a certain time period) for the graphs that improved their priority and especially those that already had or were changed to the highest priority (Emergency). The main reason is that they use the resources of the optimal path with relatively low competition, due to their higher Prioritization. The higher priority processes slow down the other processes and force them to switch paths. That results in the emergence of alternative shortest paths, forcing them to switch. This procedure can be repeated more than once, causing multiple path shifts and therefore abrupt changes of execution time that are evident in
Figure 25. Eventually, most of the graphs become stable by using the same path. However, there are some exceptions where graphs switch periodically between different paths.
We divided the business processes depicted in
Figure 25 into three different groups according to their new Prioritization.
The processes that receive, or already have, the highest priority (Emergency) are grouped and depicted in
Figure 26. For the majority of them, the execution time eventually decreases. However, there is an exception (Process 1, blue colour) where the time slightly increases. That is because, after the State change, the total number of Emergency Prioritization graphs of the system has been increased, resulting in a higher competition on resources.
The second group of business processes whose priorities remained or changed to medium (
Figure 27) yields no clear conclusion about the execution time for graphs. Many fluctuations have occurred, like the Process 6 case (orange colour) between the time period of 900 and 1500 s in
Figure 27. These graphs are constantly trying to find better paths. Process 7 (yellow colour), on the other hand, is periodically switching between paths as other processes of the system (with higher priorities) are interfering, and therefore, there is no stabilization point for that graph.
Figure 28 illustrates the group of business processes with low priorities (No Priority, Low Priority). Processes 8 (blue), 9 (orange) and 10 (yellow) have their execution time raised even though after the State changes some of them (Processes 8 and 9), they repeatedly try to find alternative paths. An exception to that phenomenon is Process 11 (purple), where despite its low priority, its execution time gets slightly better as it has chosen a path that uses resources without any other competing processes. That is achieved only when all other processes of the system utilize different resources from those that this specific process uses.
4.2.4. Computational Overhead of the Orchestration Engine
A includes many business processes, especially the one we chose to apply the proposed framework on (port use-case), as it is a combination of different s. Moreover, the business processes of such s are complex because they are comprised by a considerable amount of tasks. This overall complexity creates additional computational overhead for the real-time management of the business processes. In order to overcome this challenge, the State value has a parameter that indicates the percentage of the paths that could actually be deployed per graph. For example, if in a graph, this parameter has a value of 30%, that indicates that only 30% of the best paths is going to be deployed. To showcase how this parameter affects the performance of the Orchestration Engine (the component that is responsible for the real-time management of the business processes), we recorded its operation while it was monitoring the port .
The specifications that the Orchestration Engine was running under was an AMD Opteron 6360 CPU (located at the National Technical University of Athens, Athens, Greece) with 64 GB RAM. The results are presented in
Figure 29 where we can see that the computational usage is exponentially increasing due to the additional path resolution that is needed.


 ,
, 
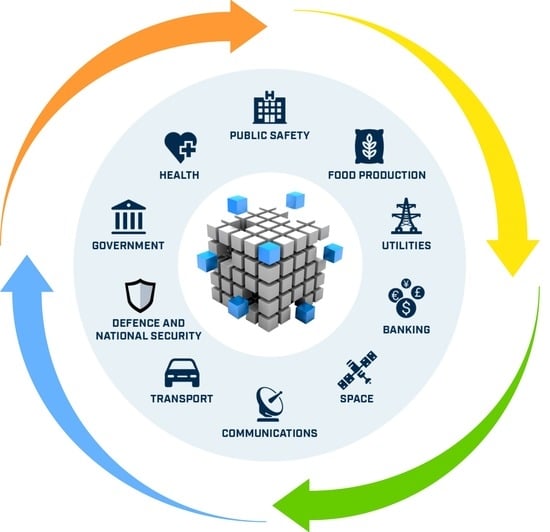


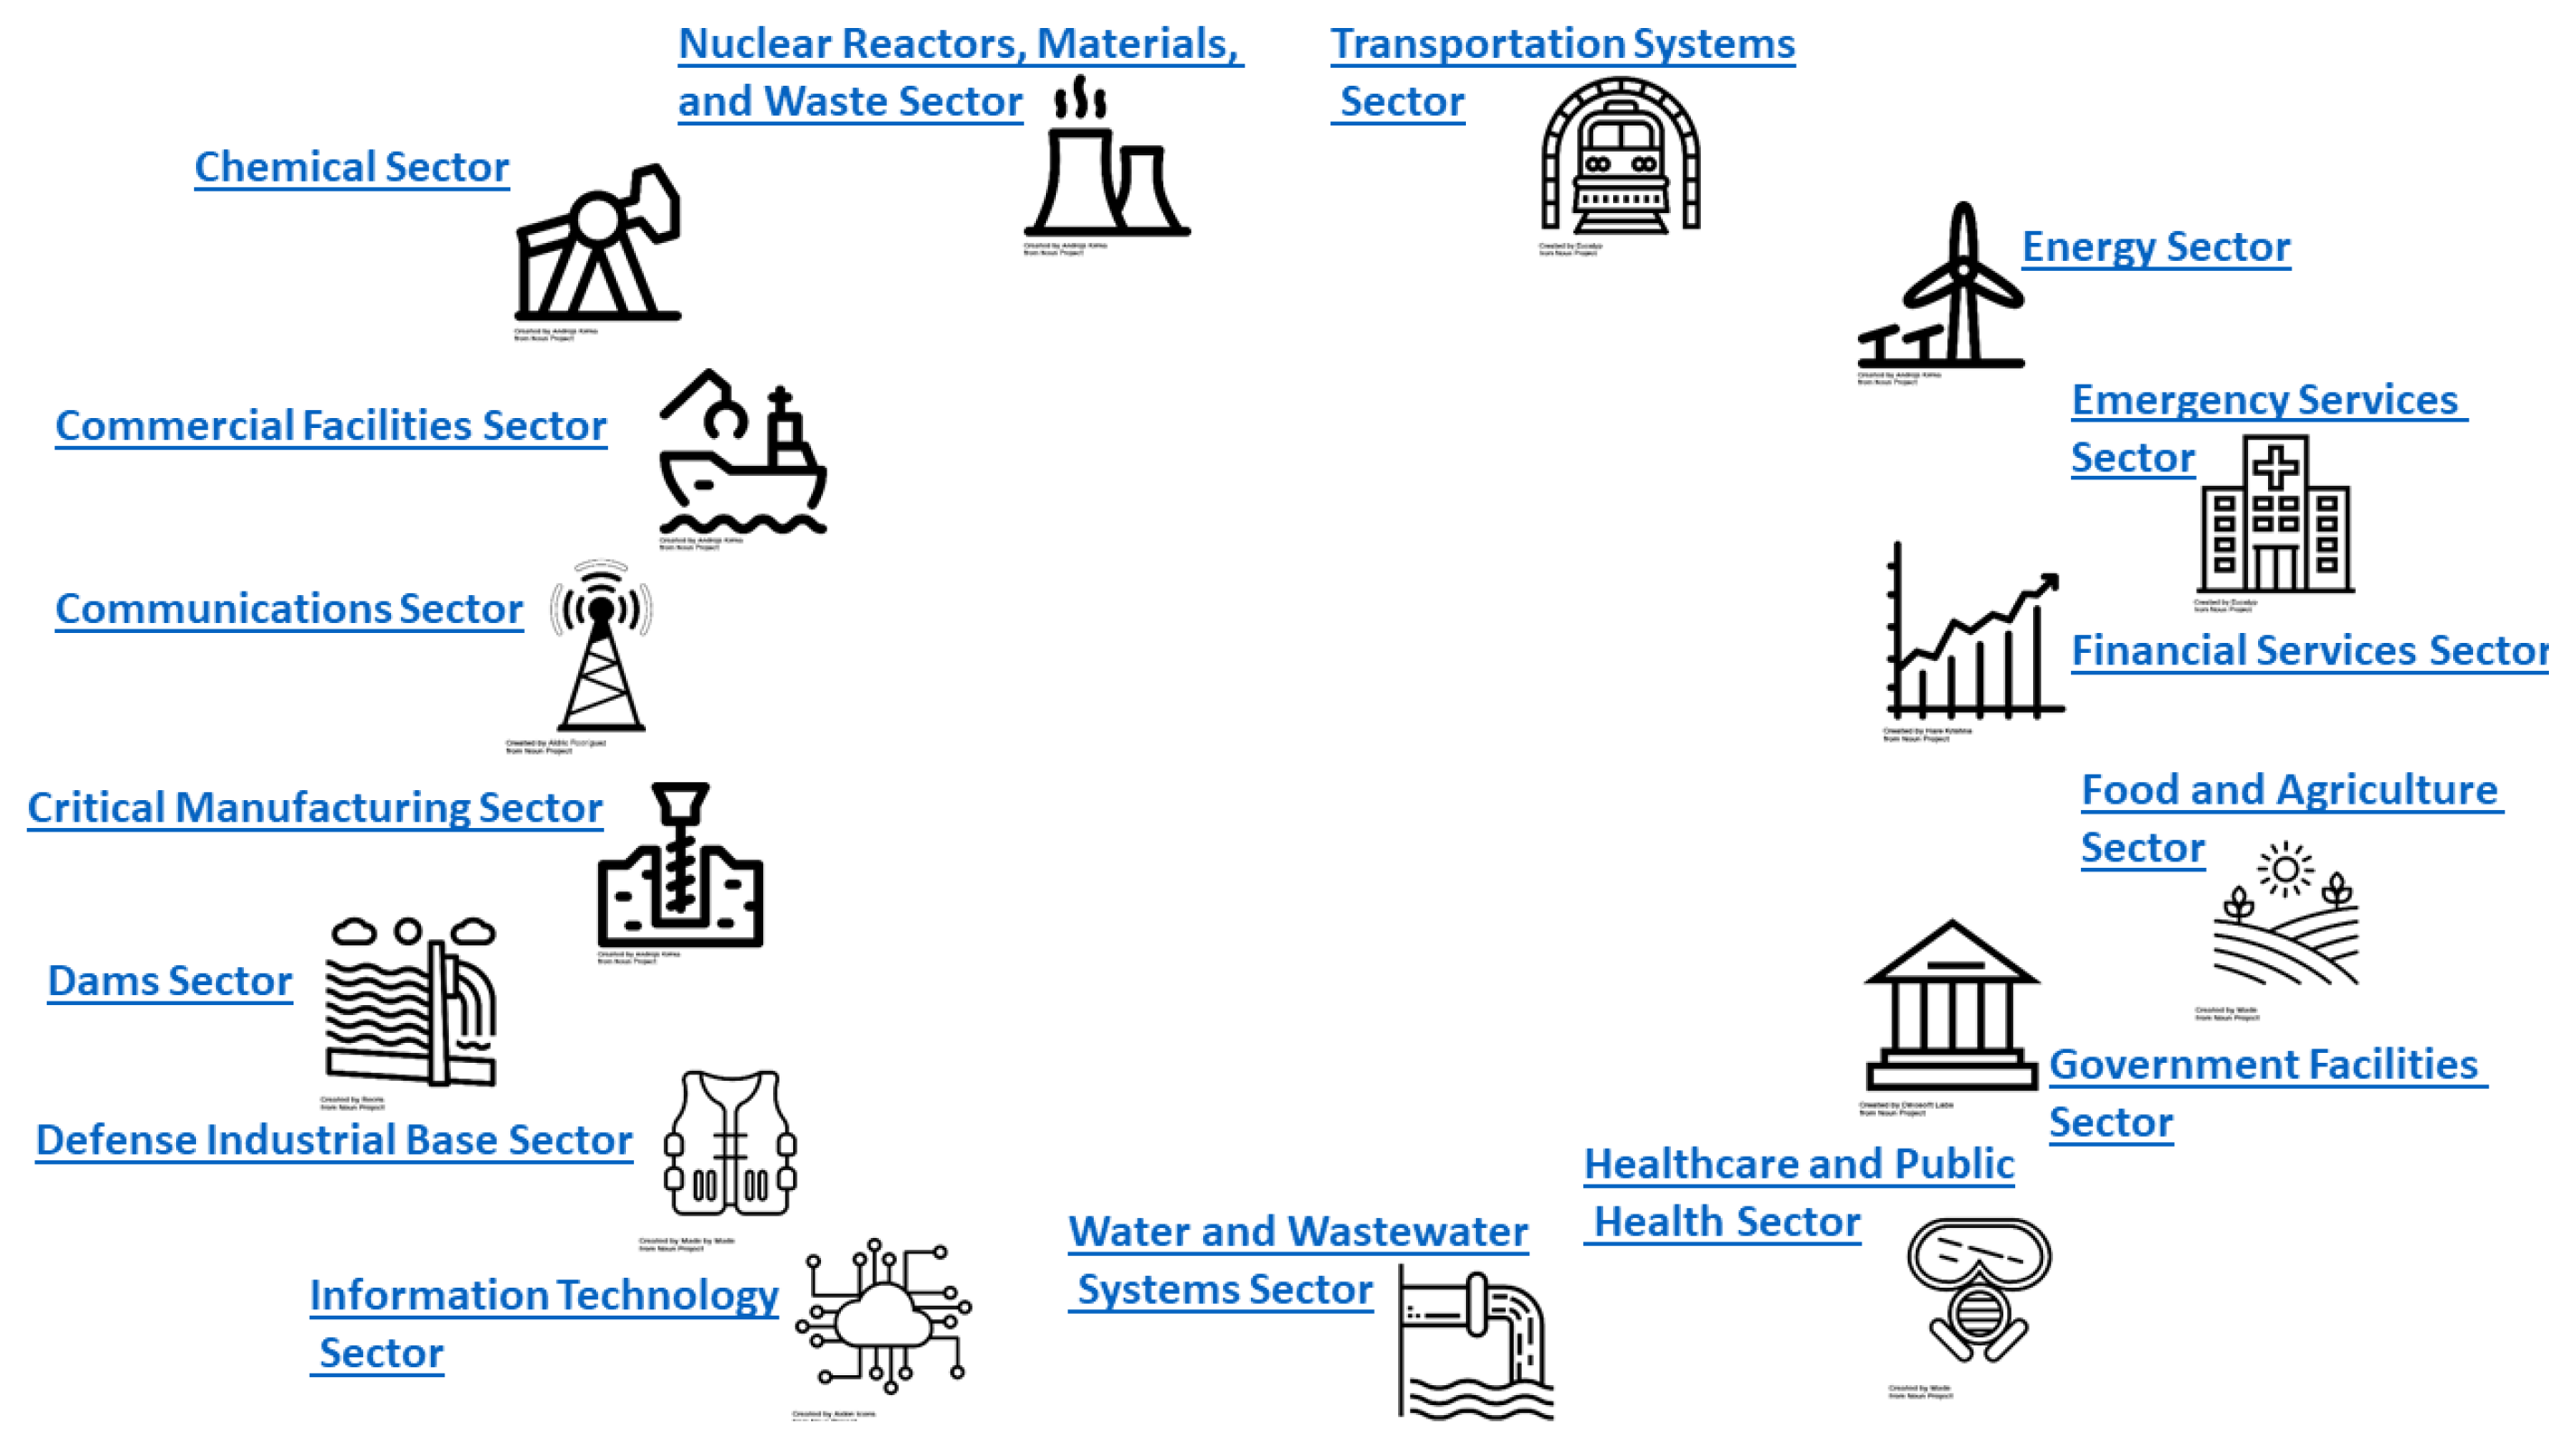
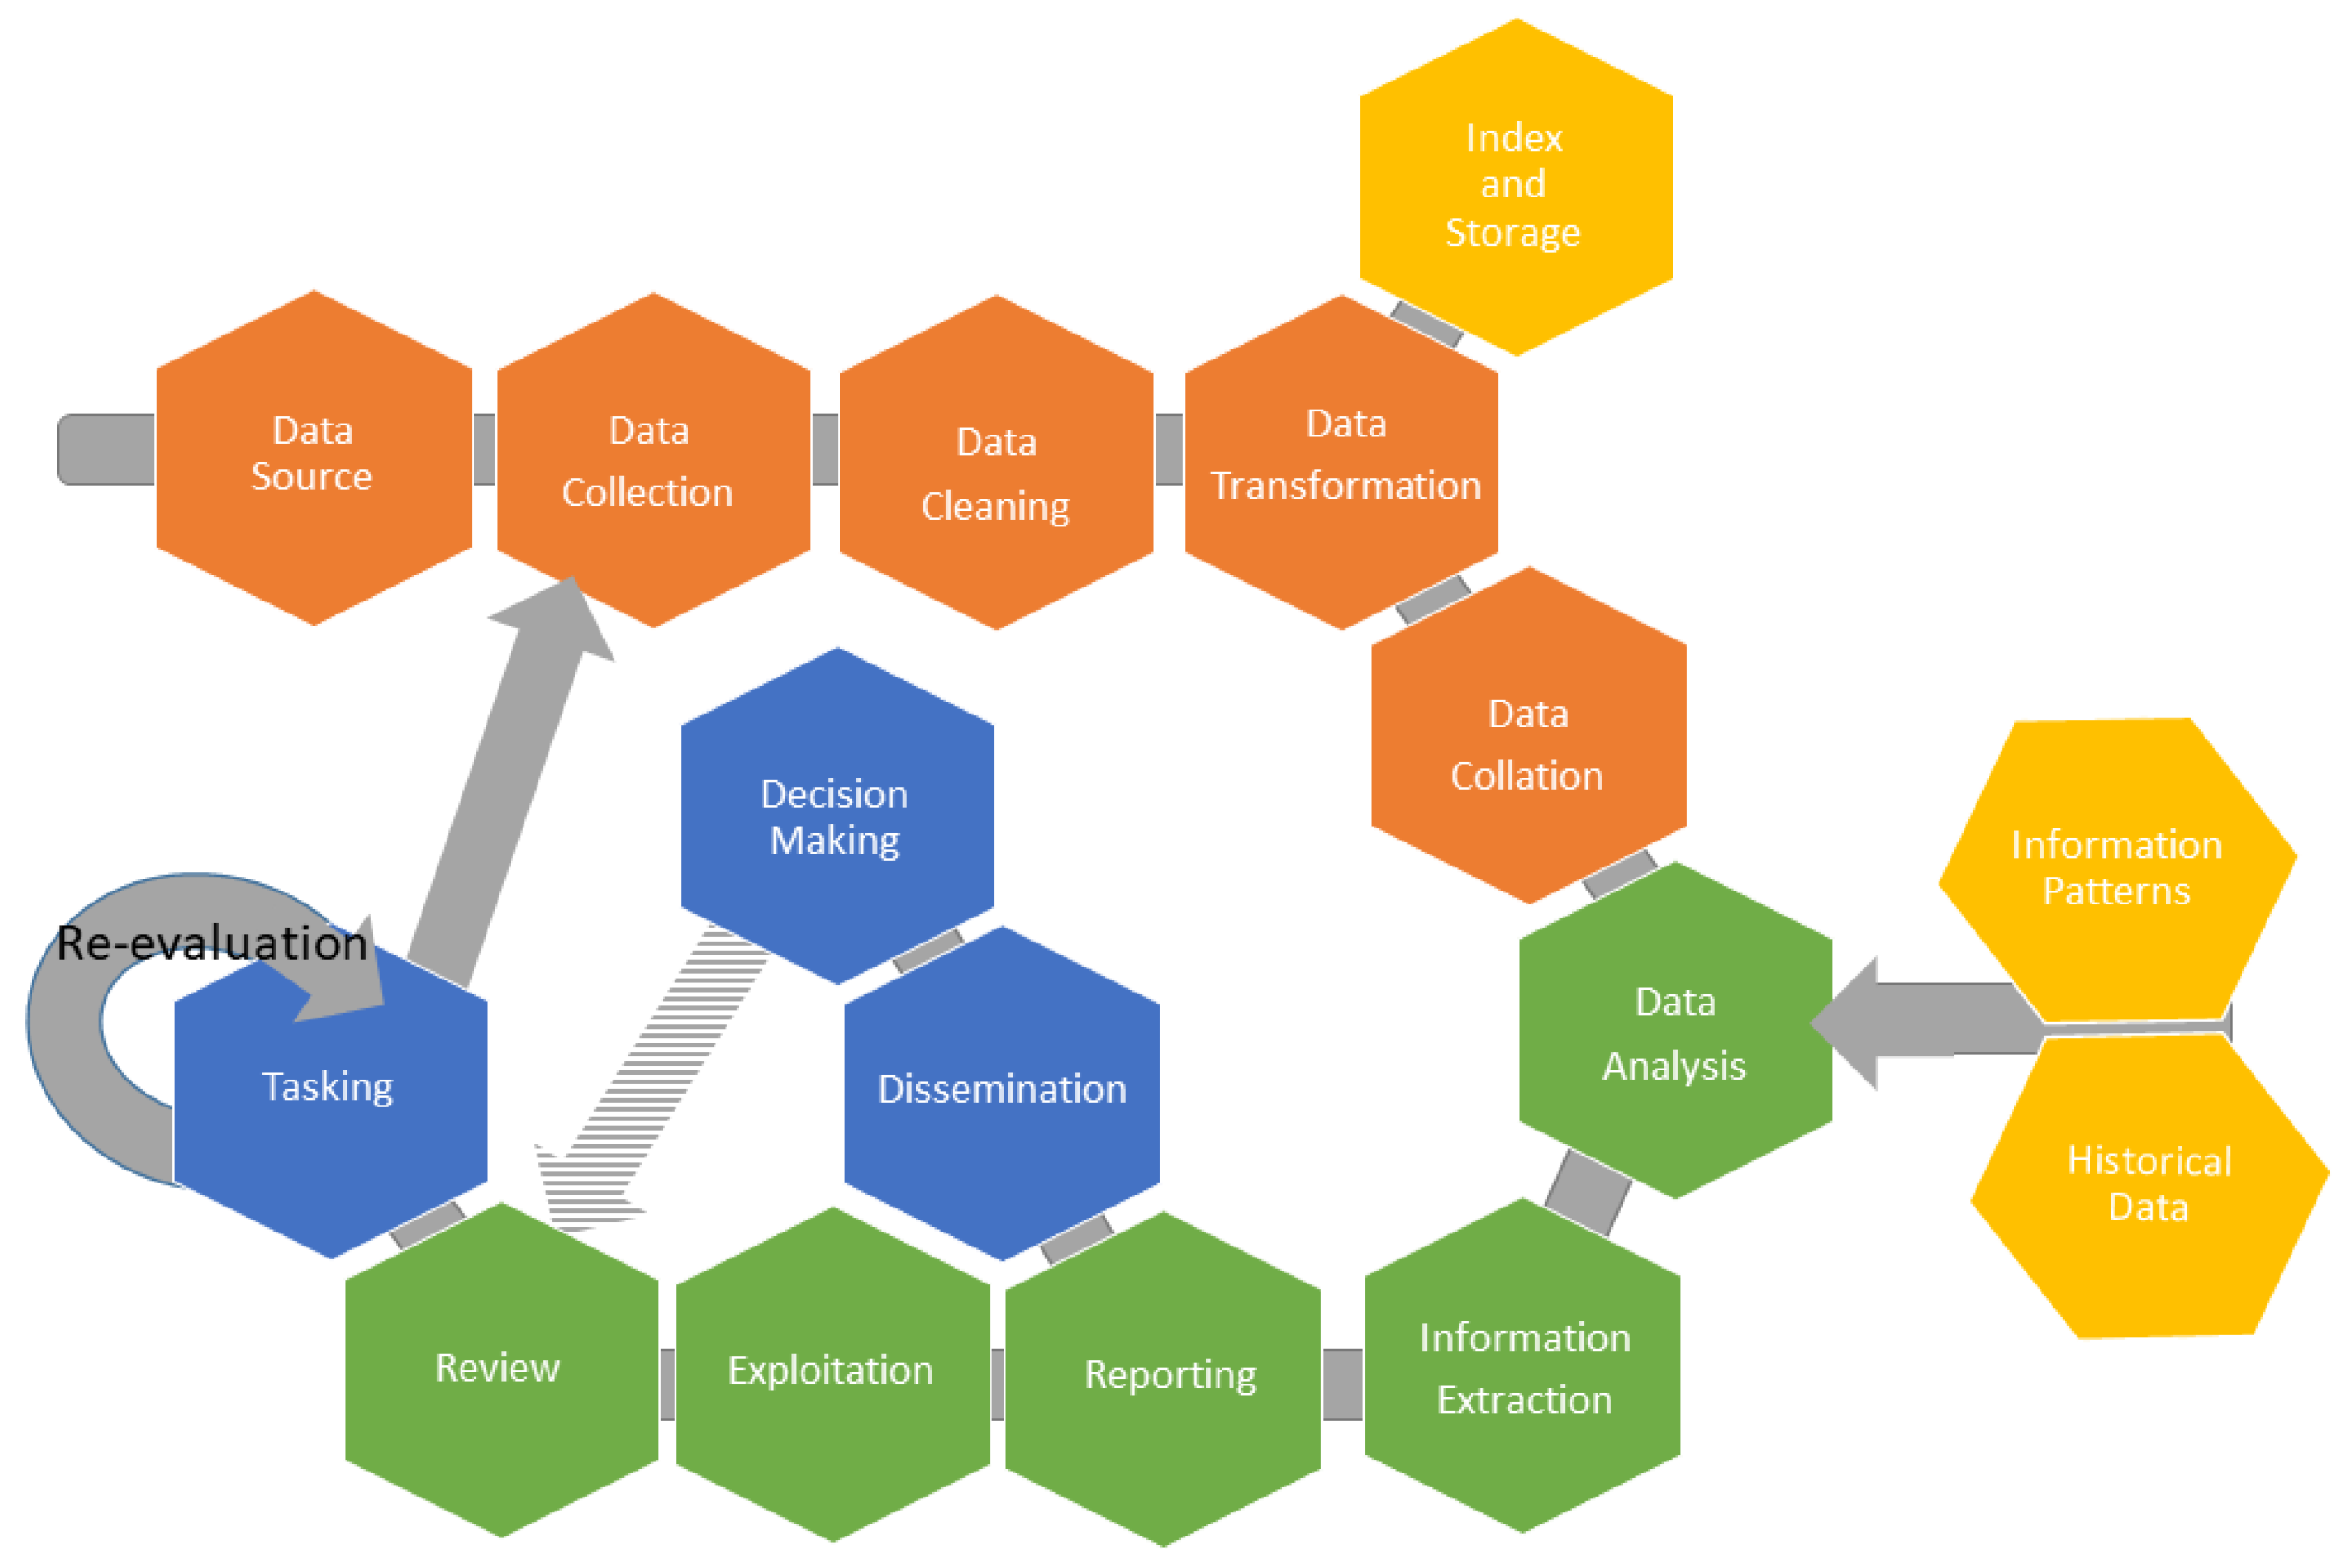
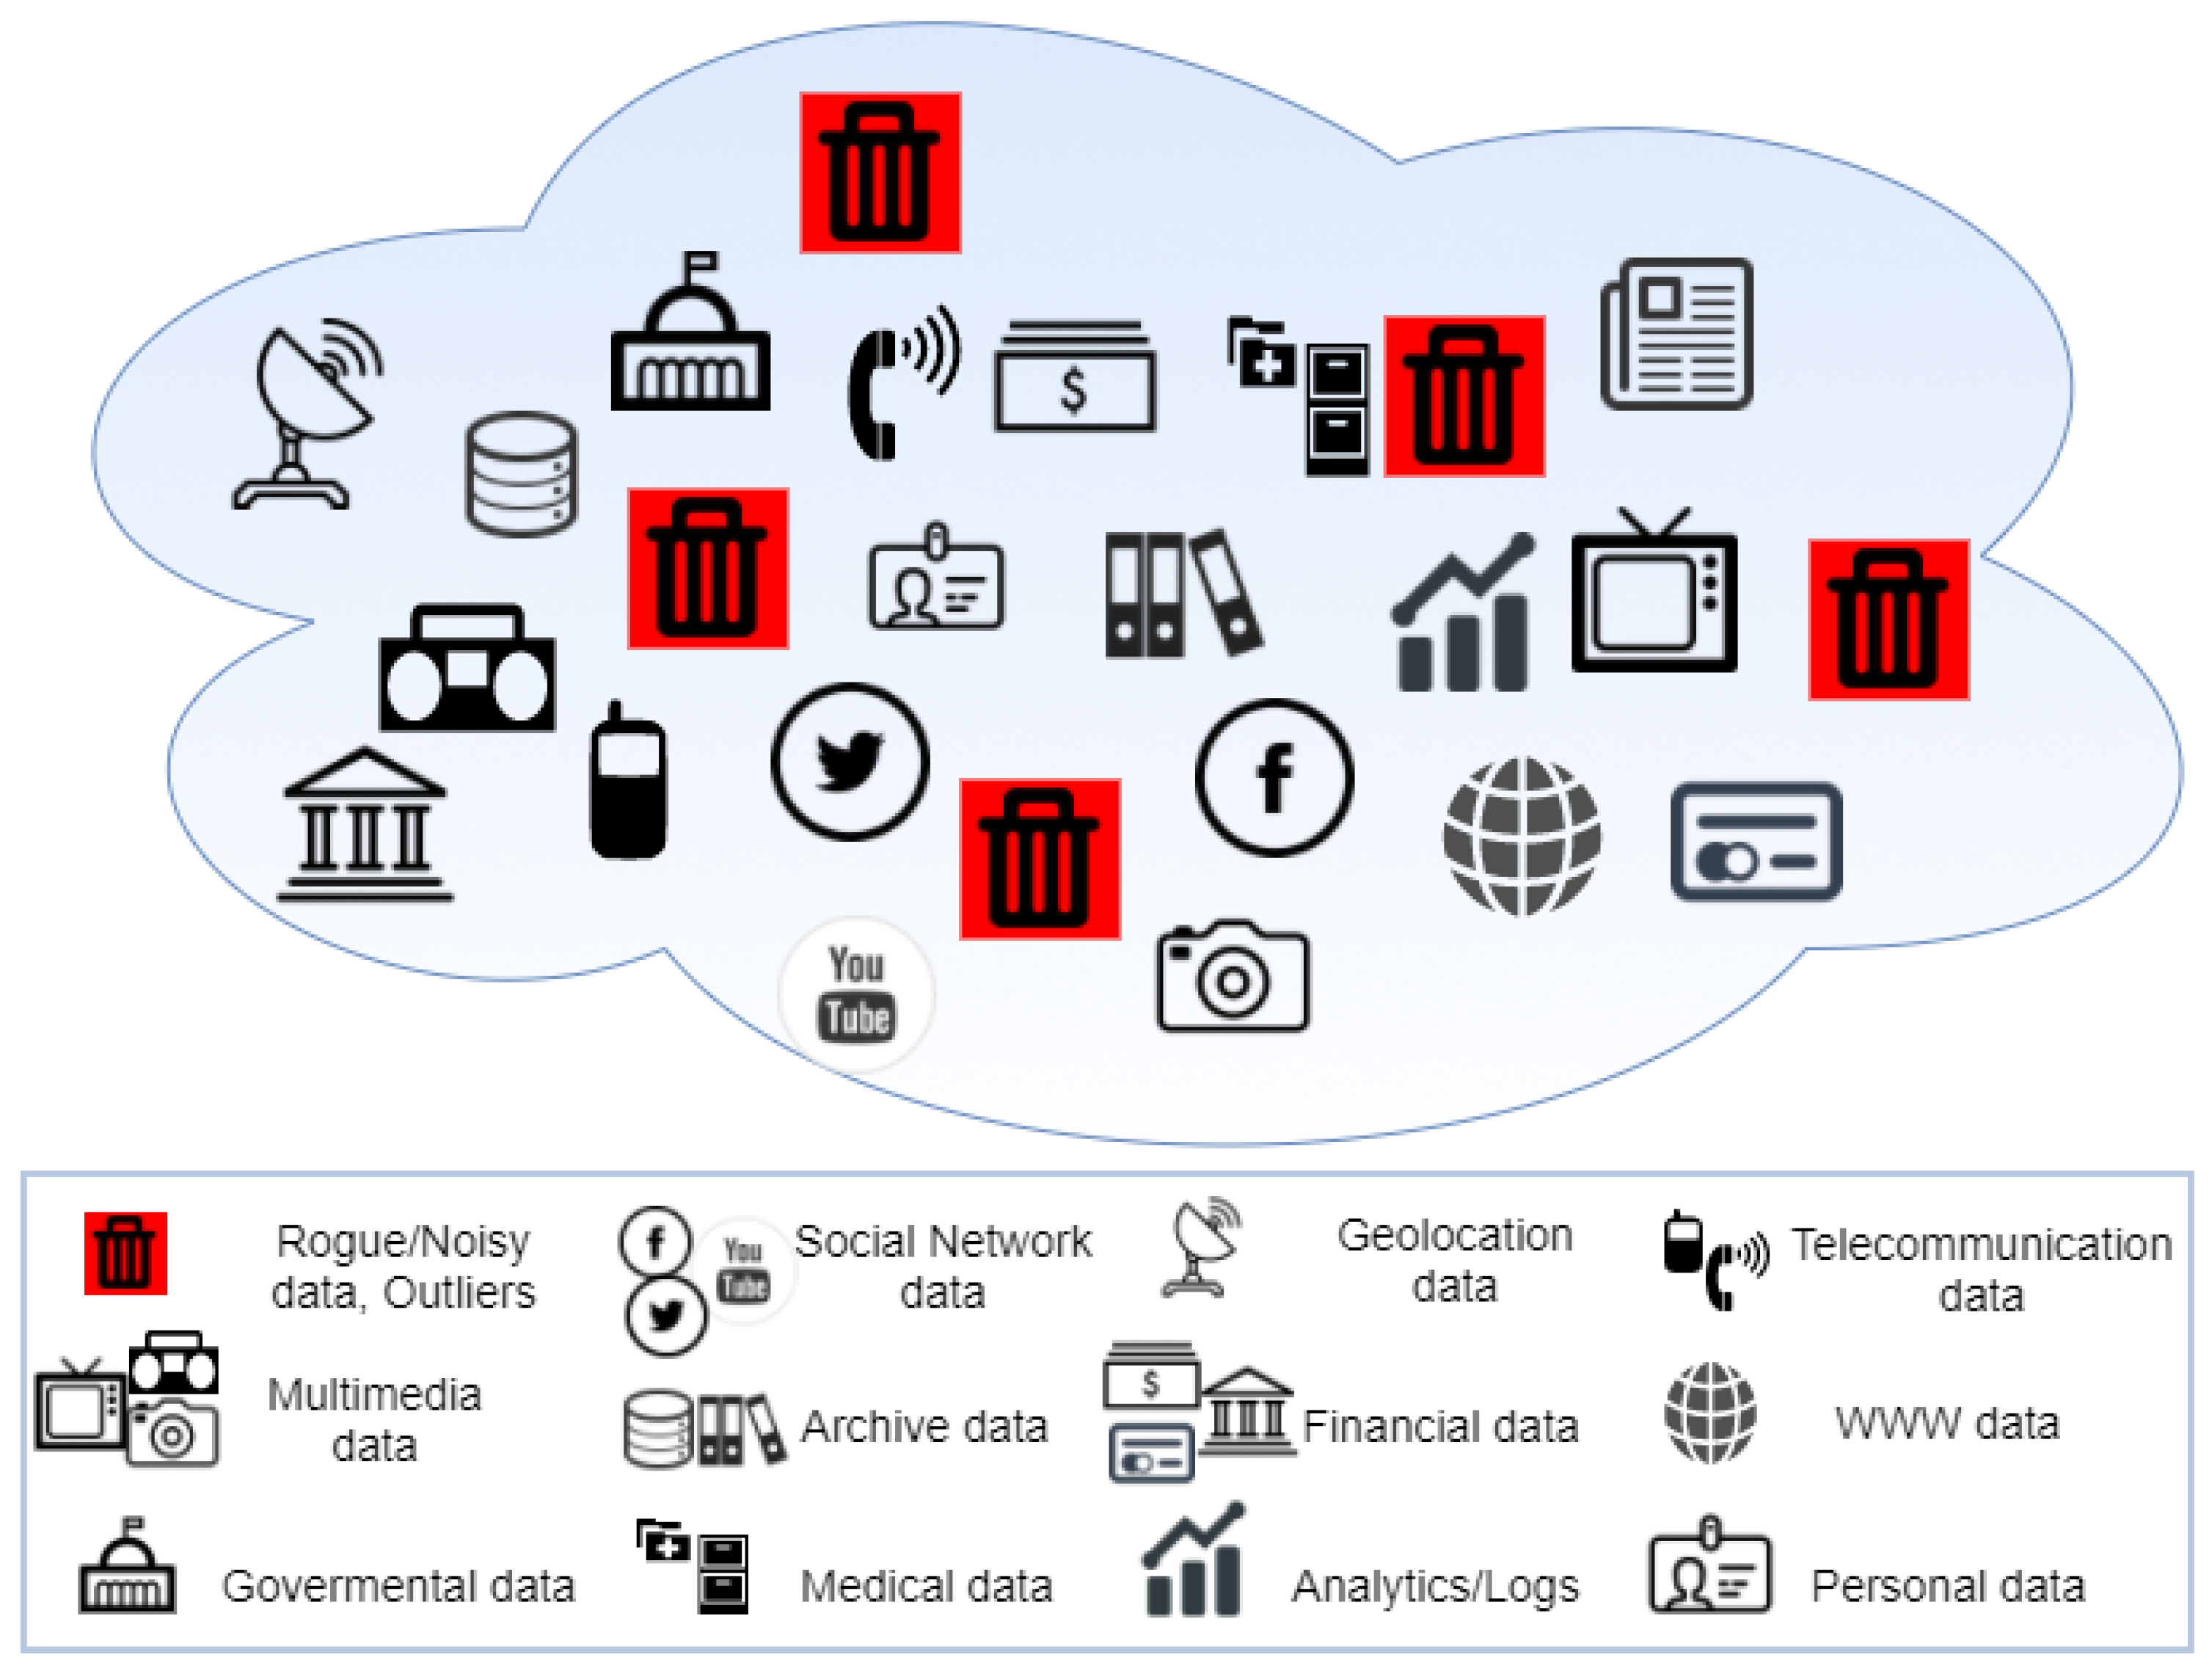
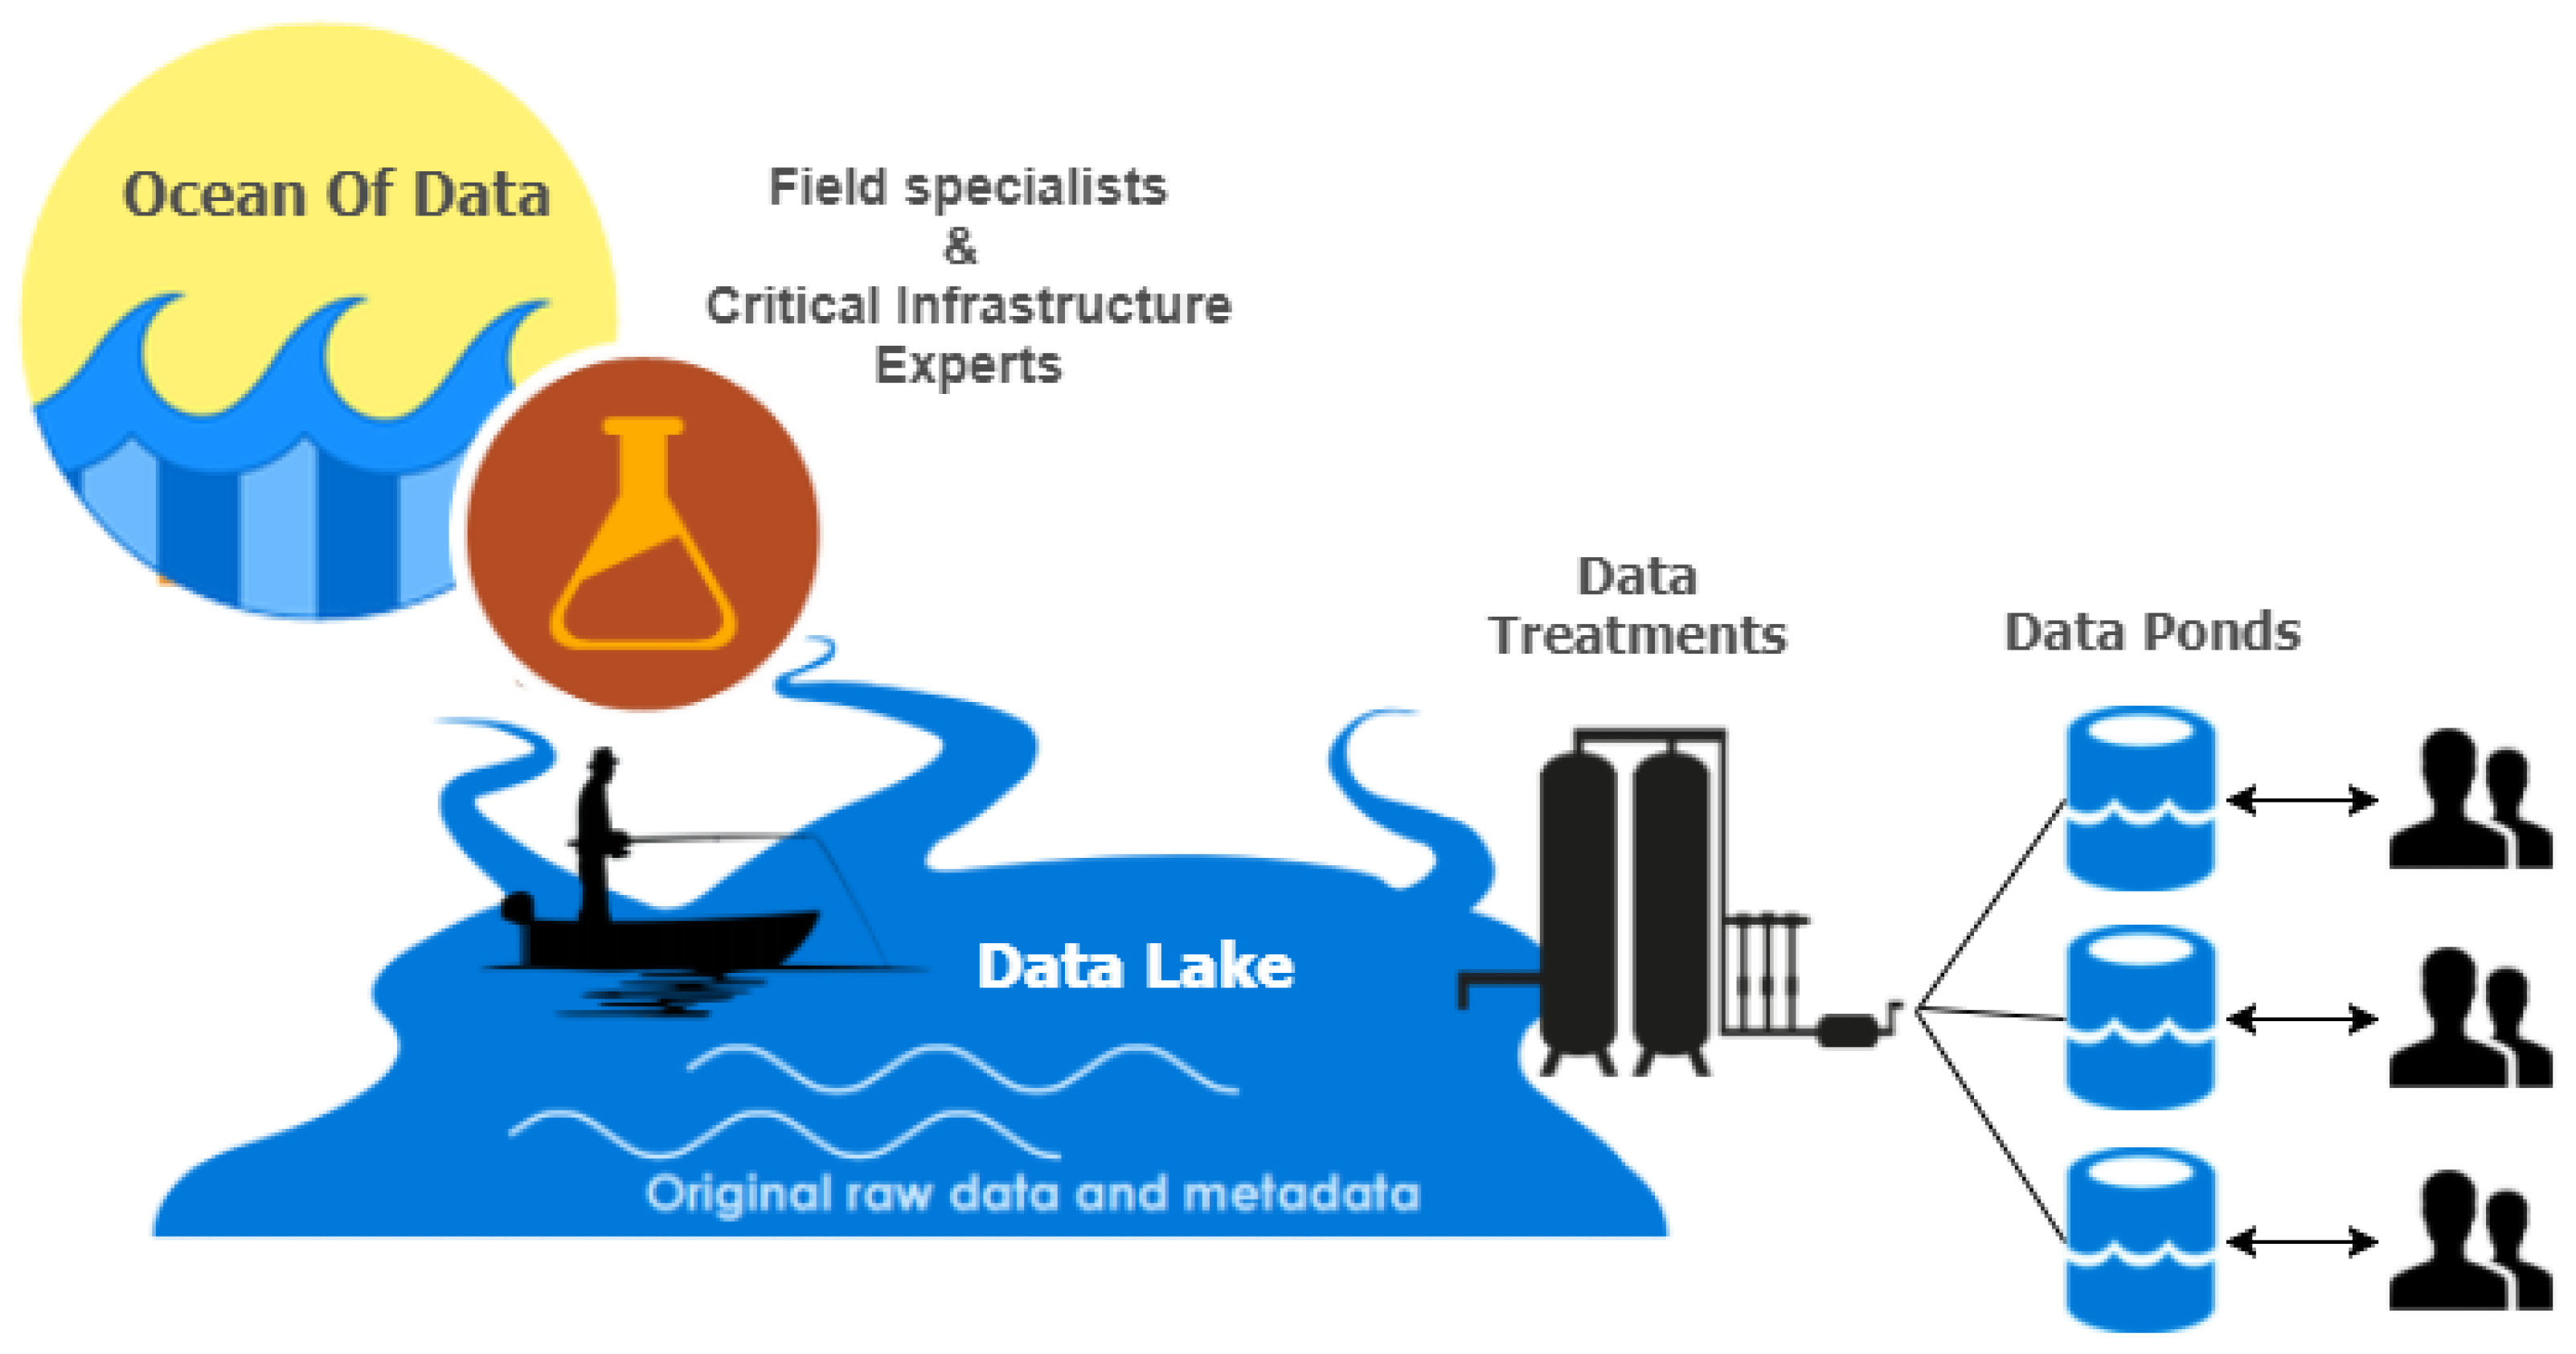
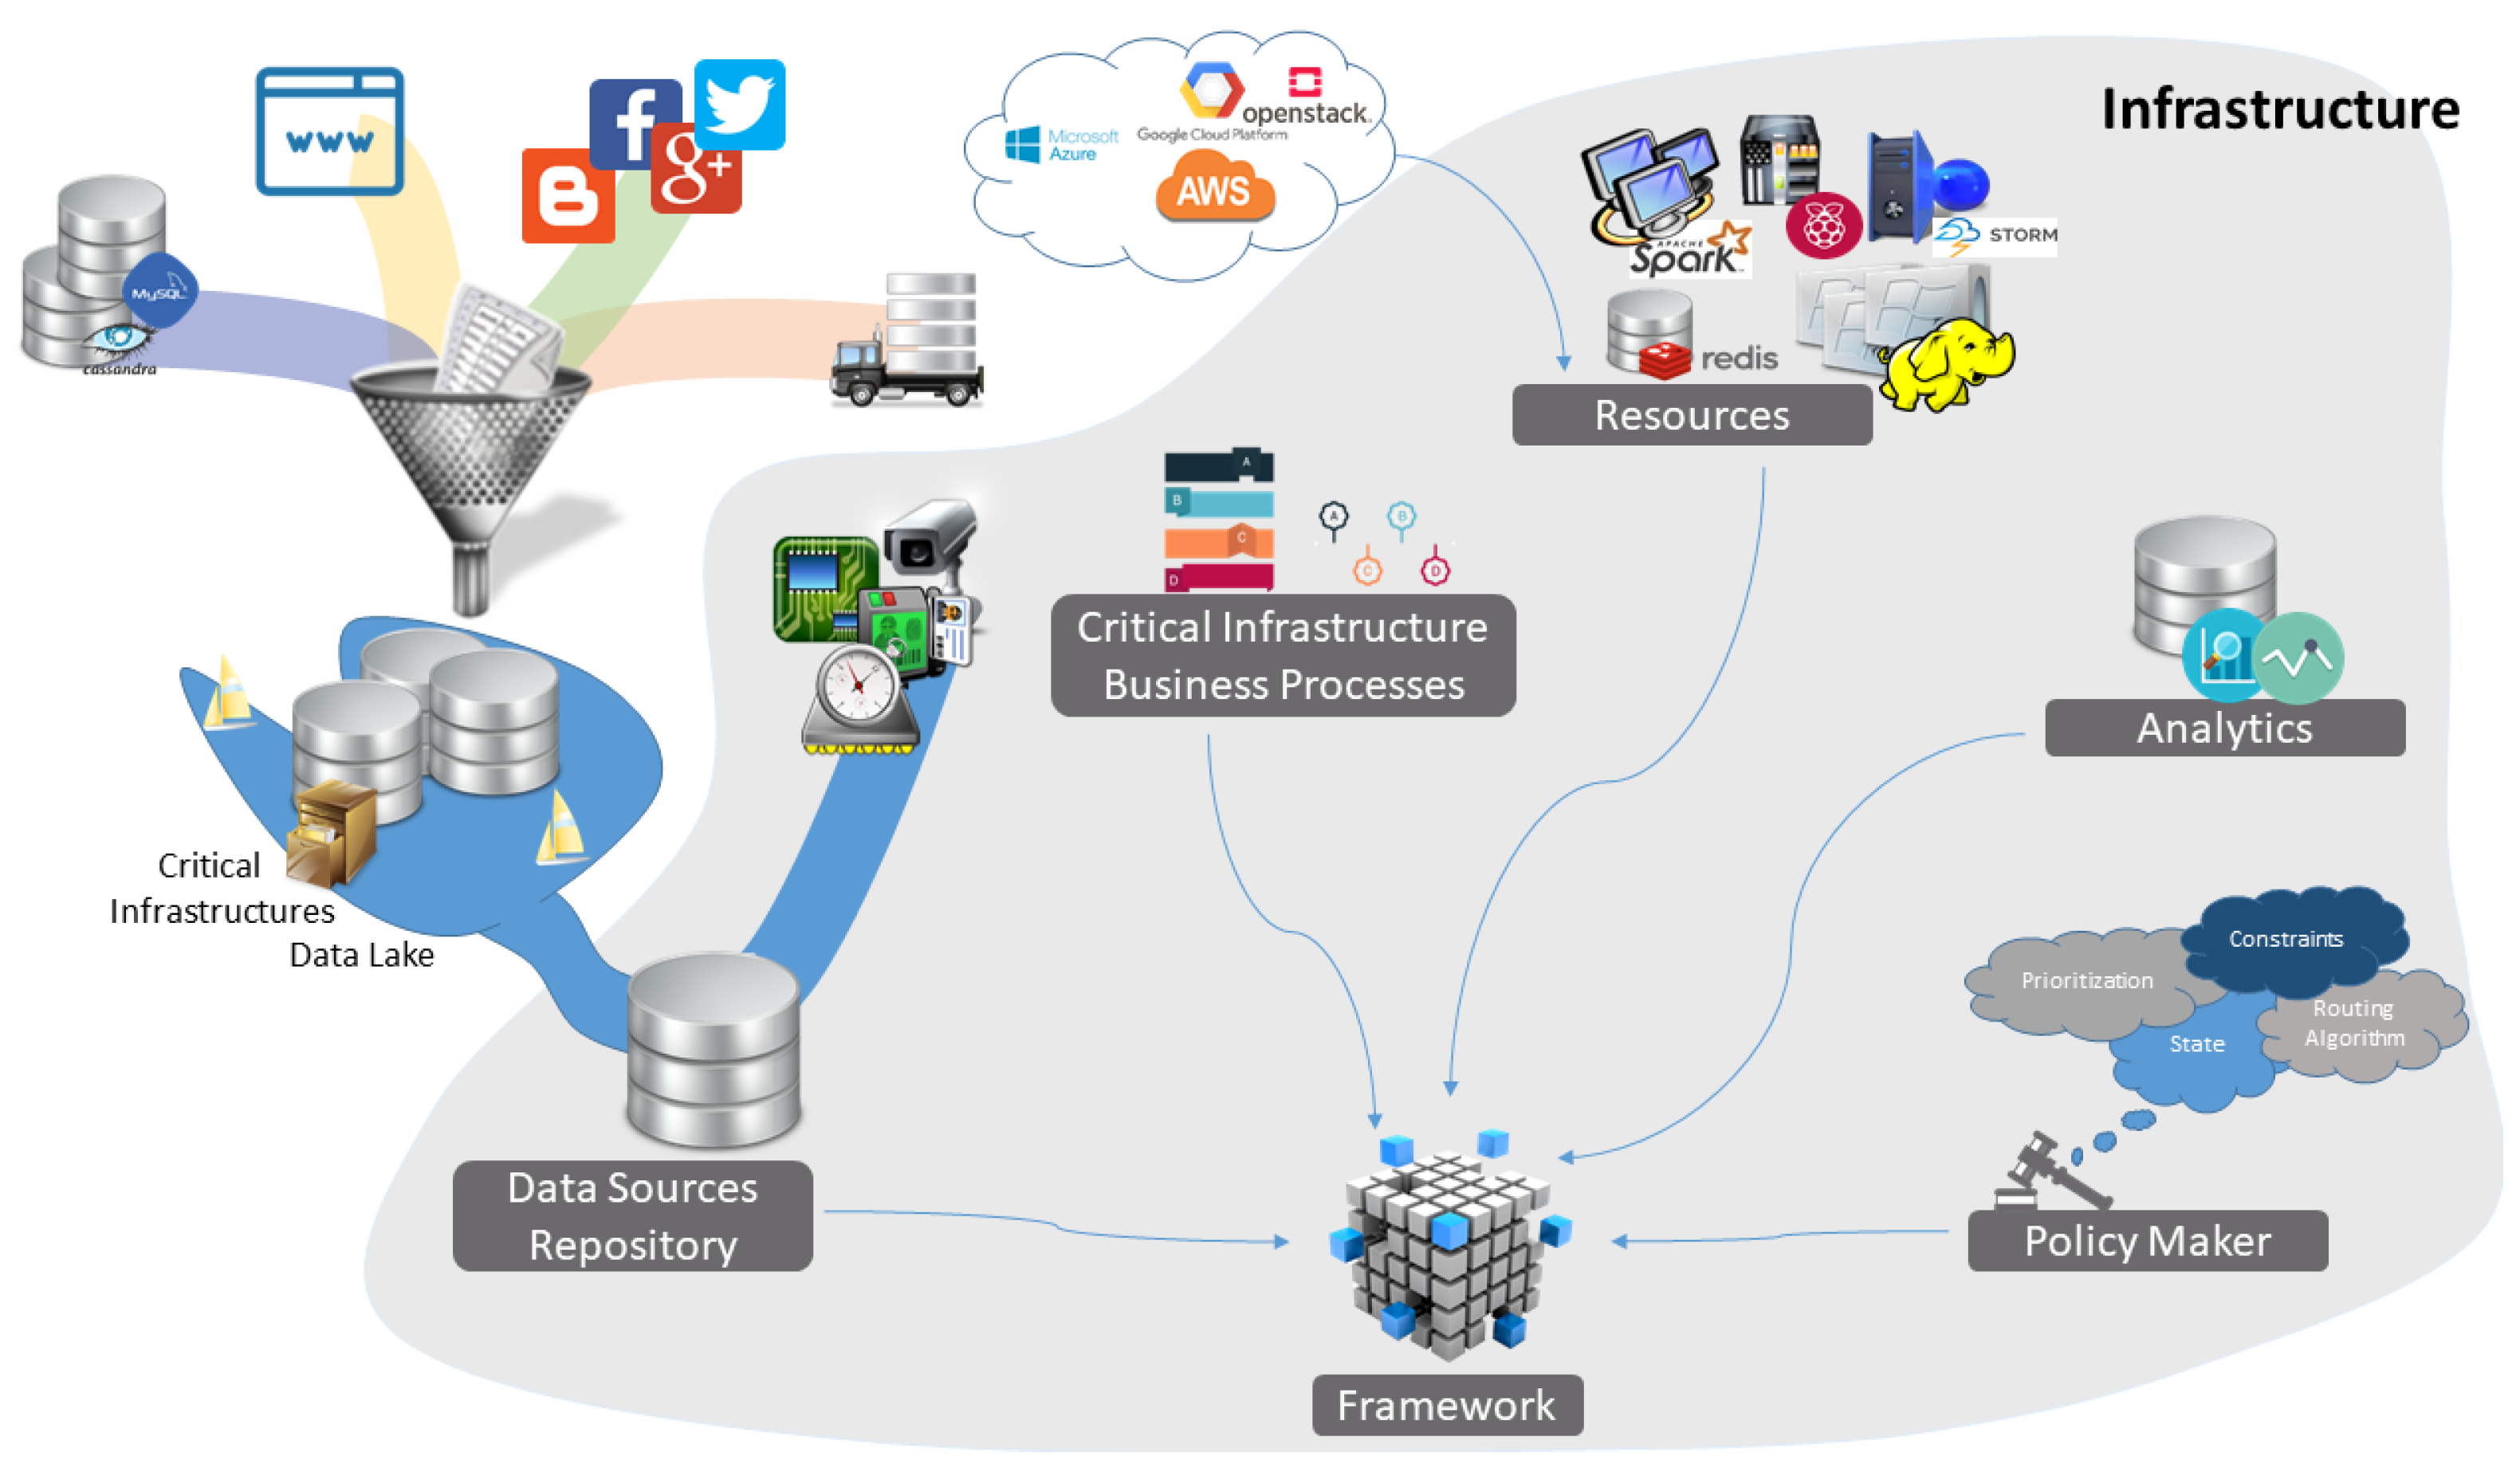
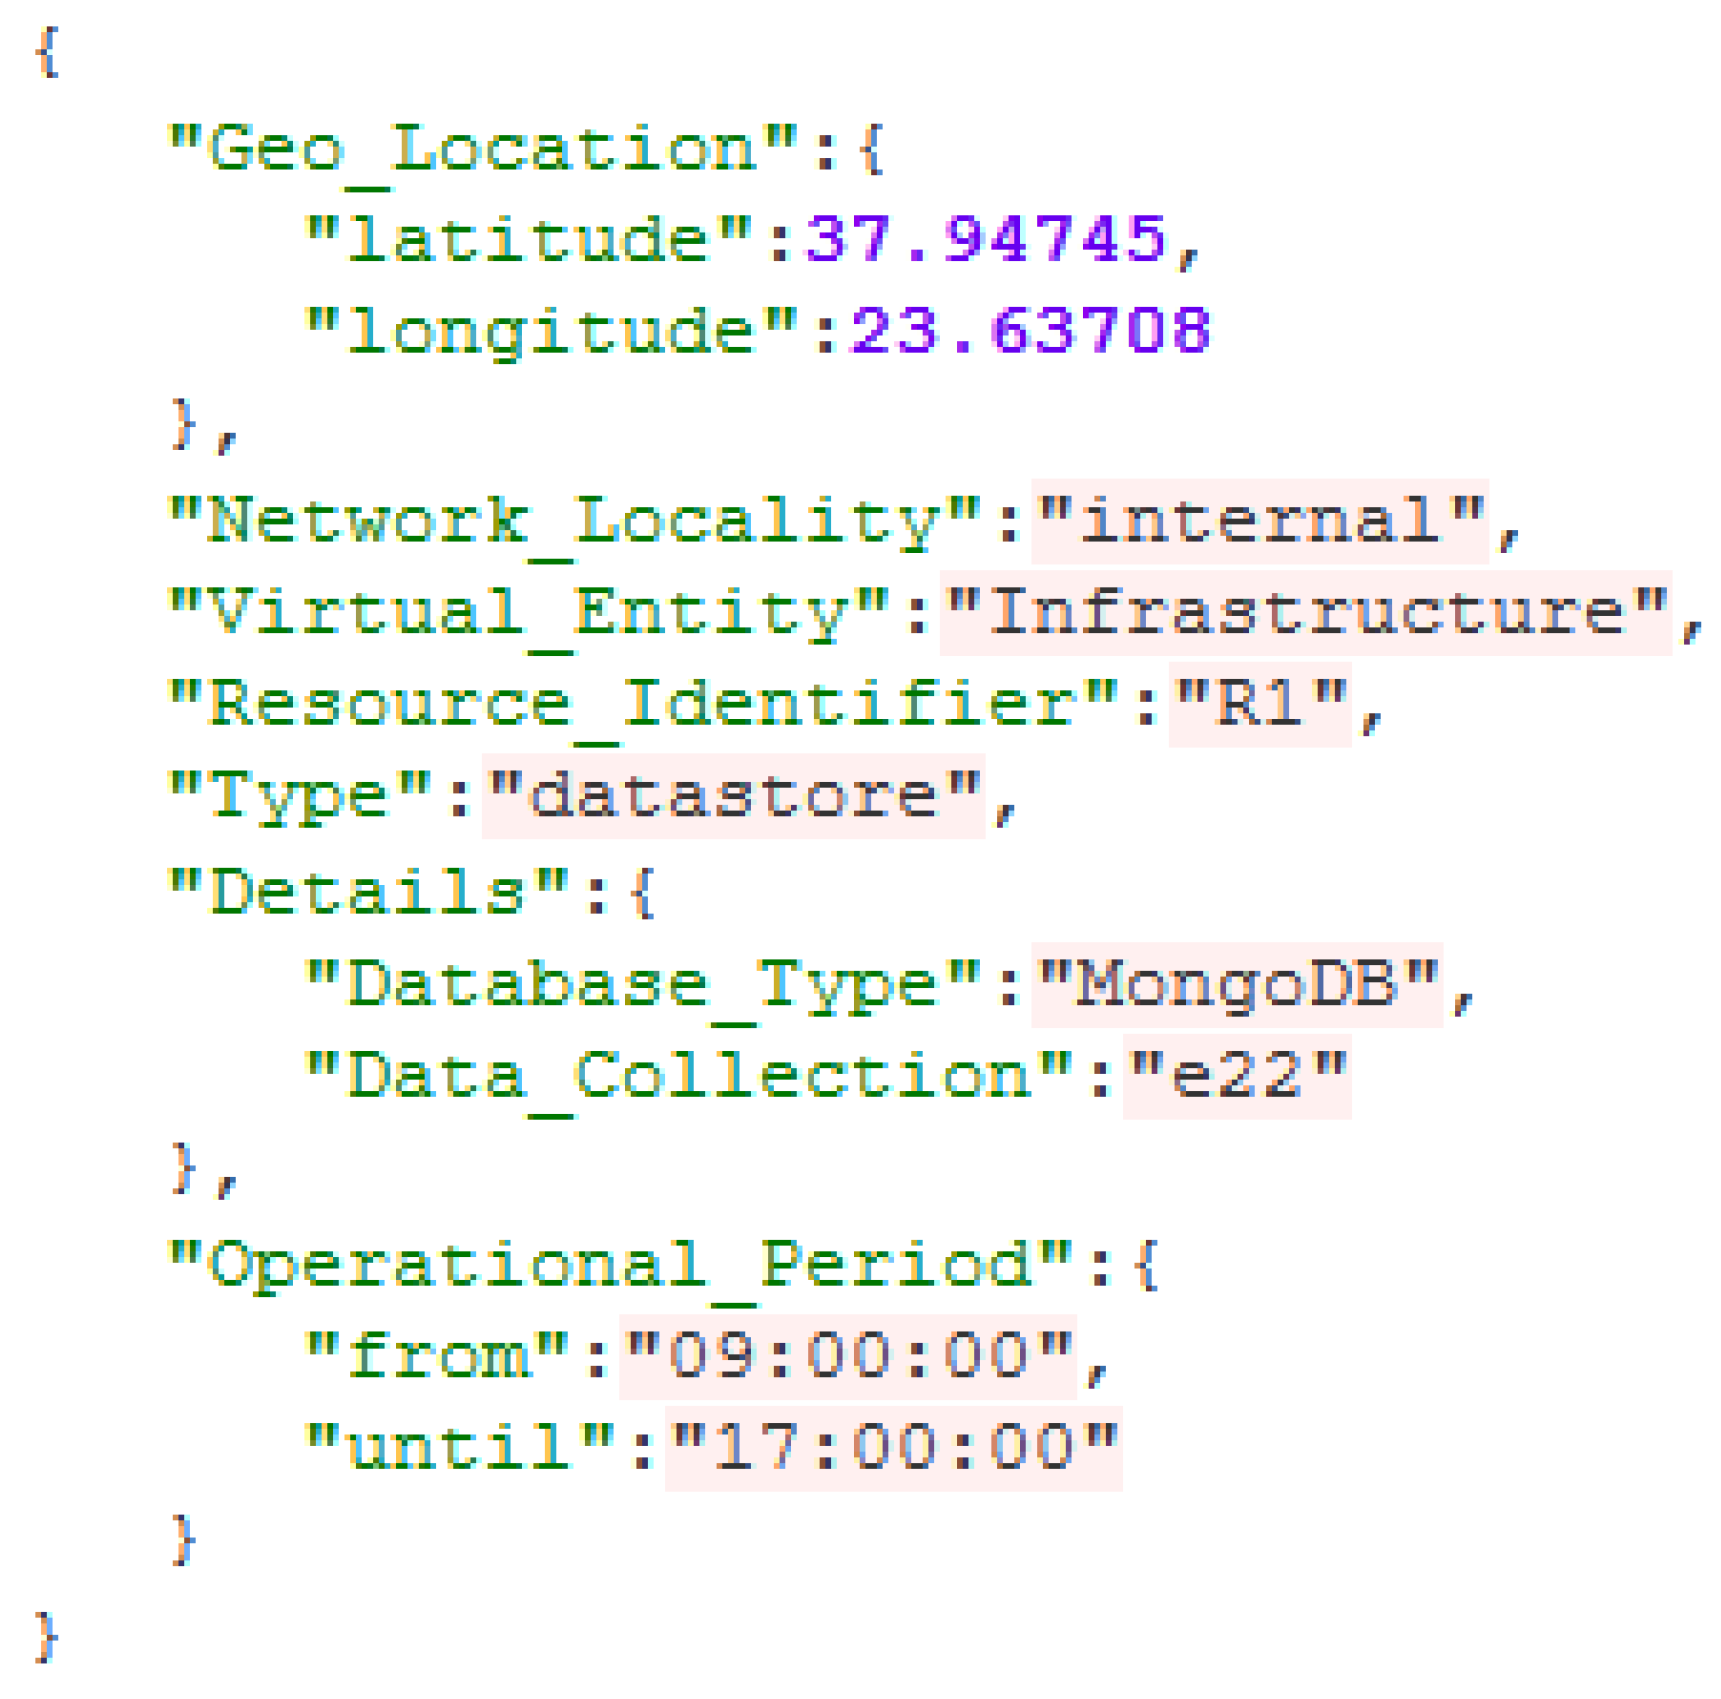
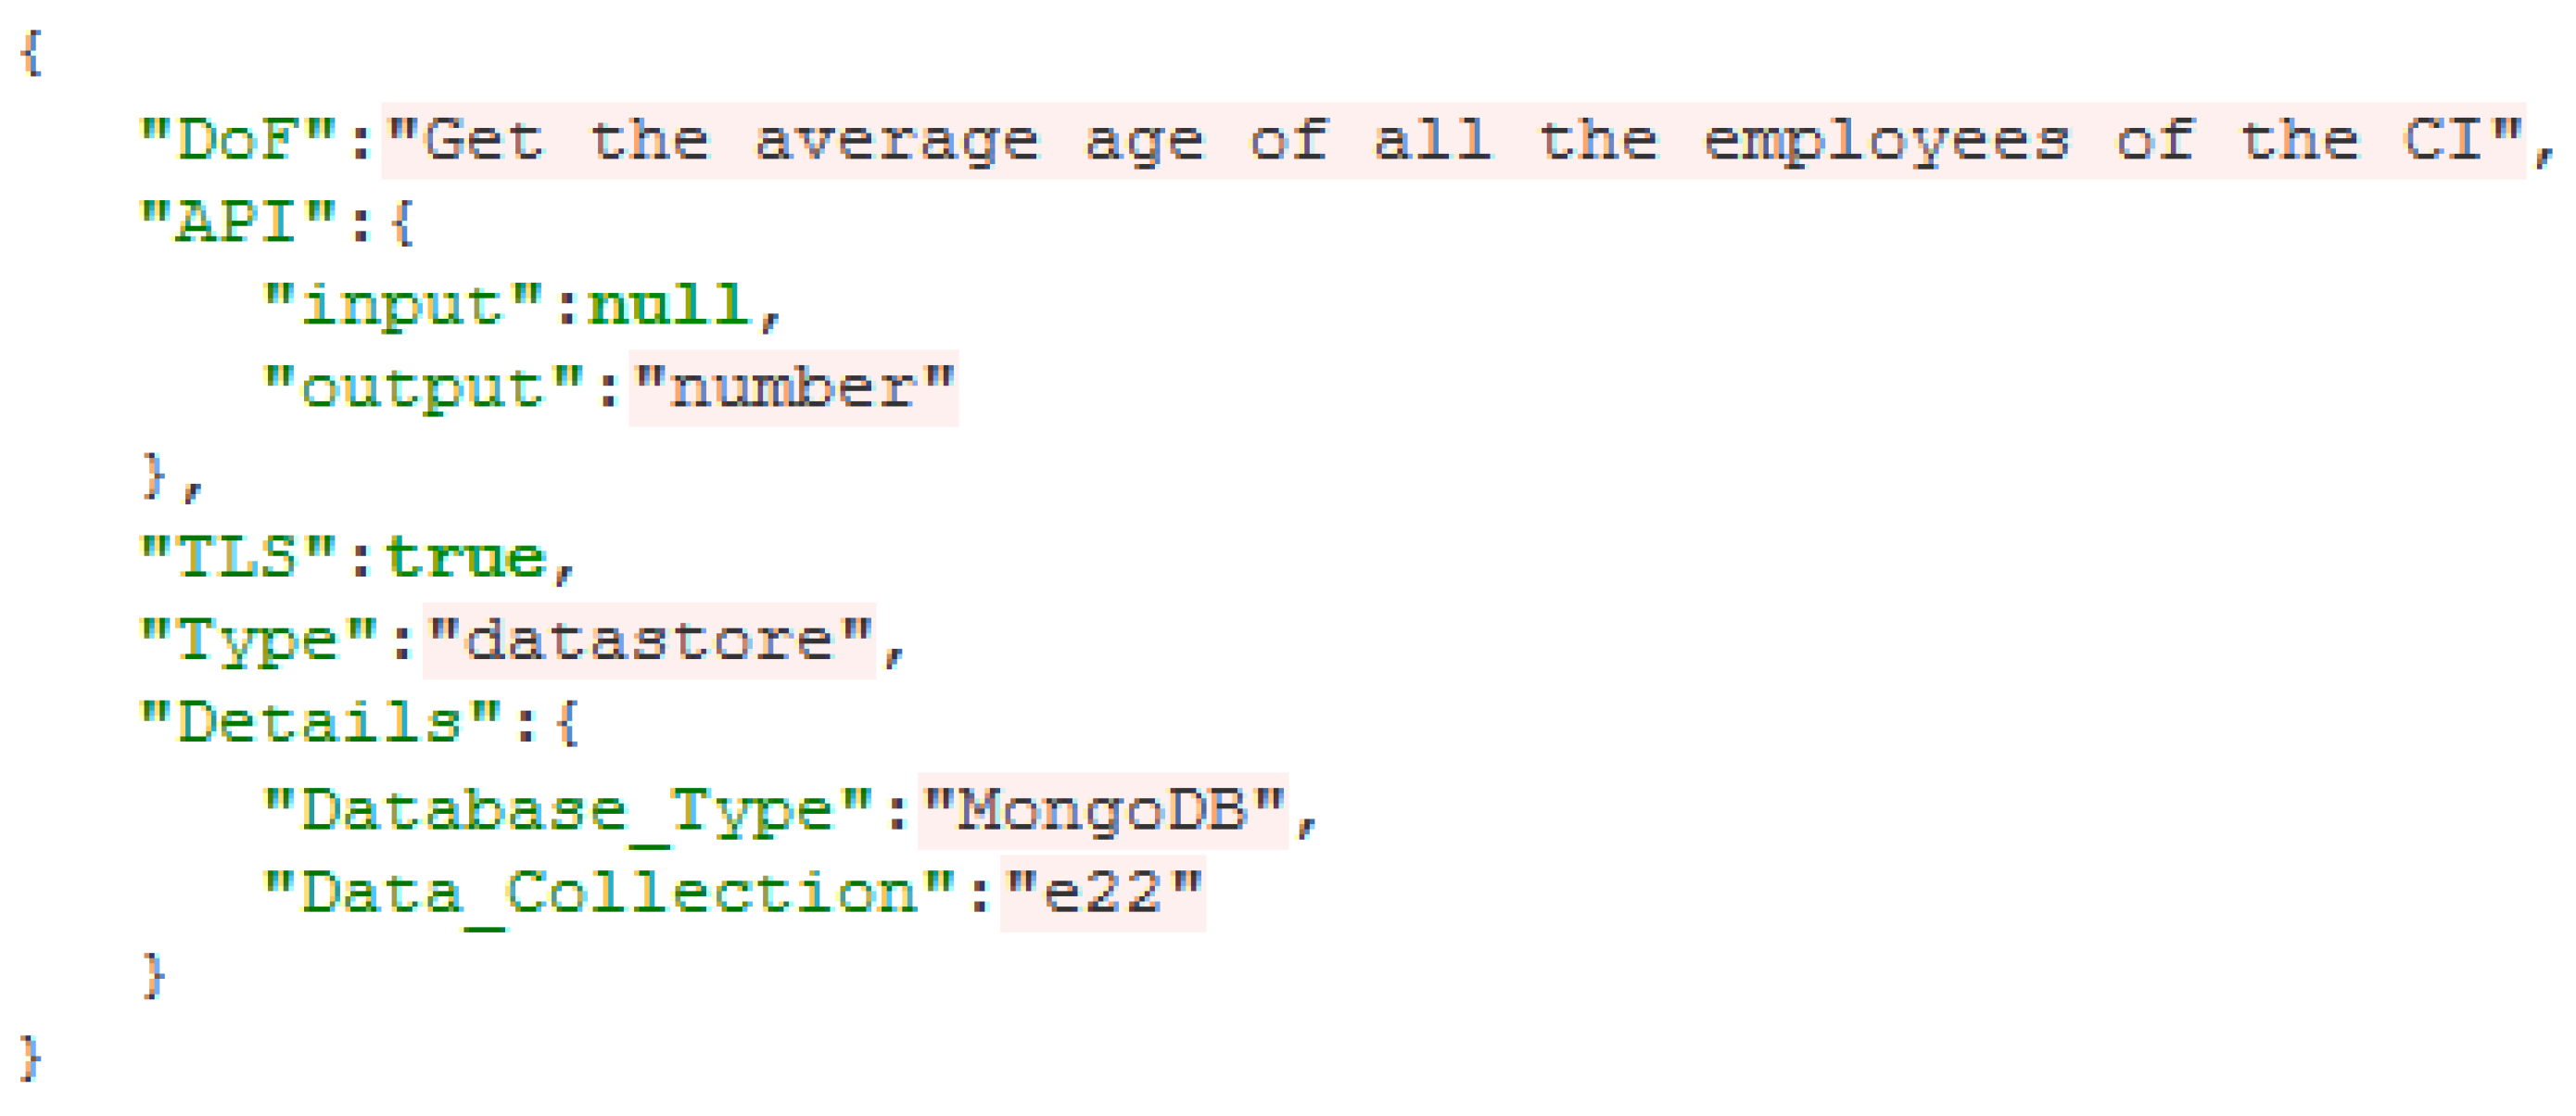
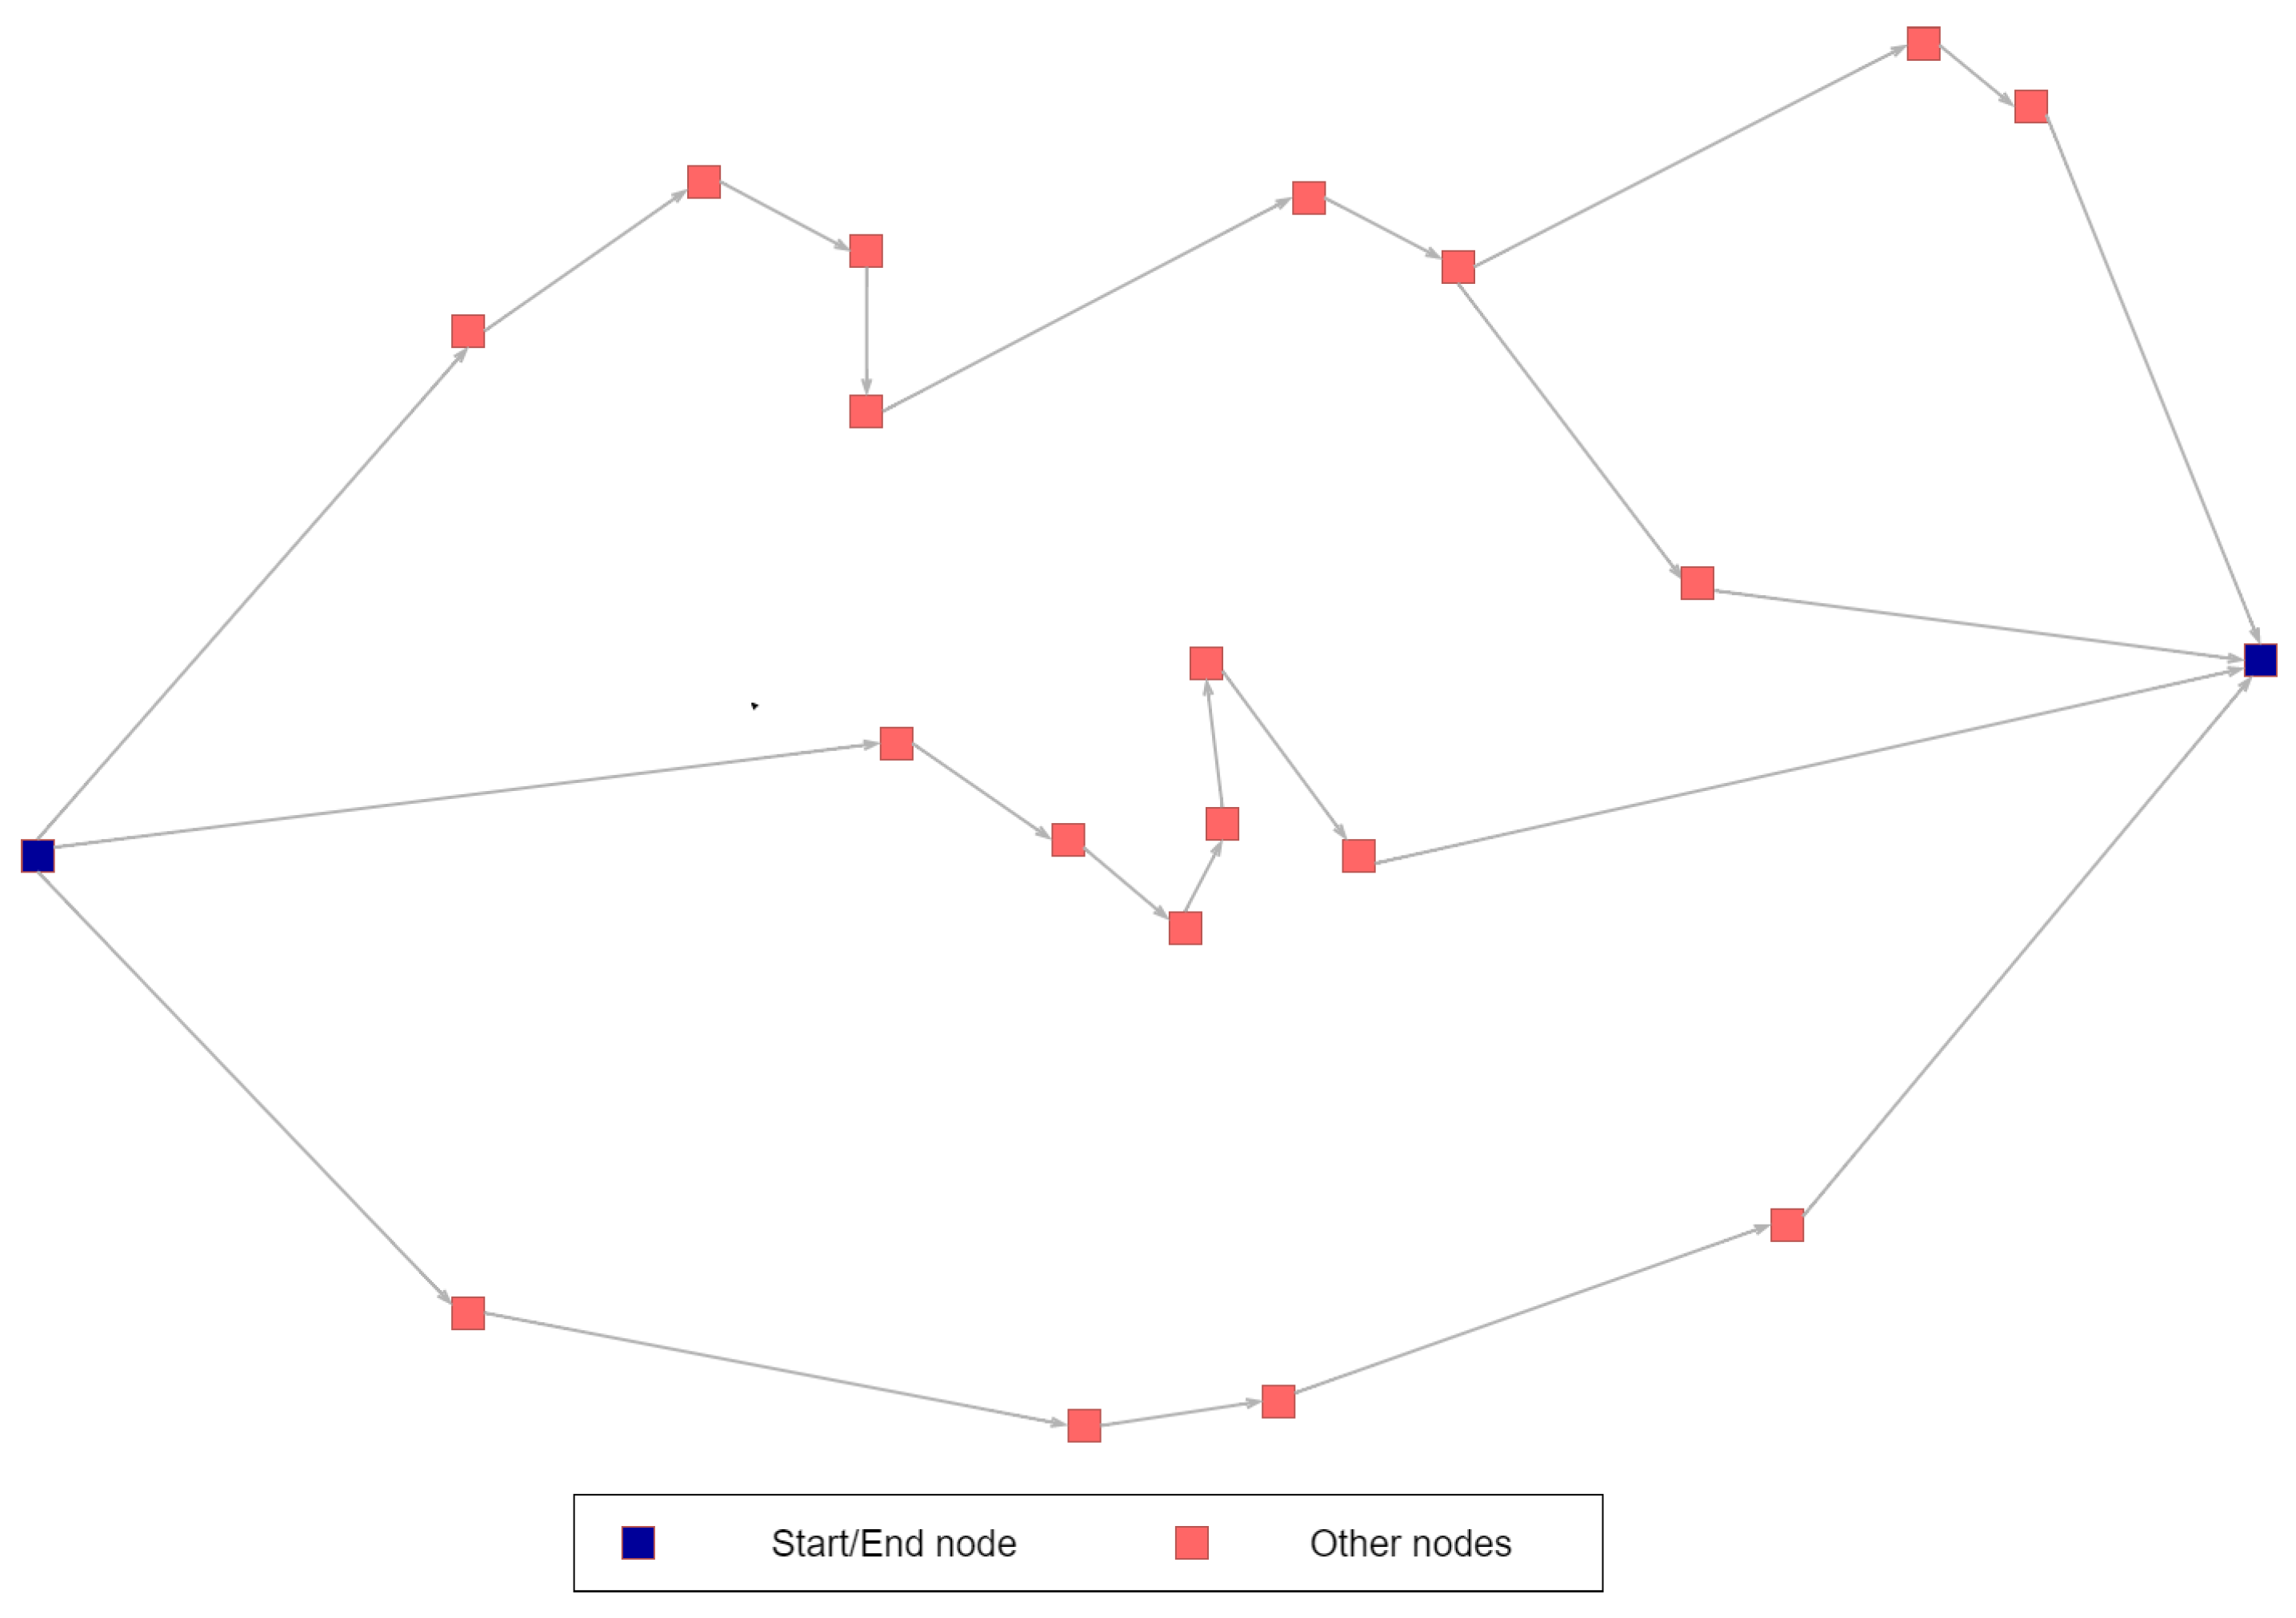
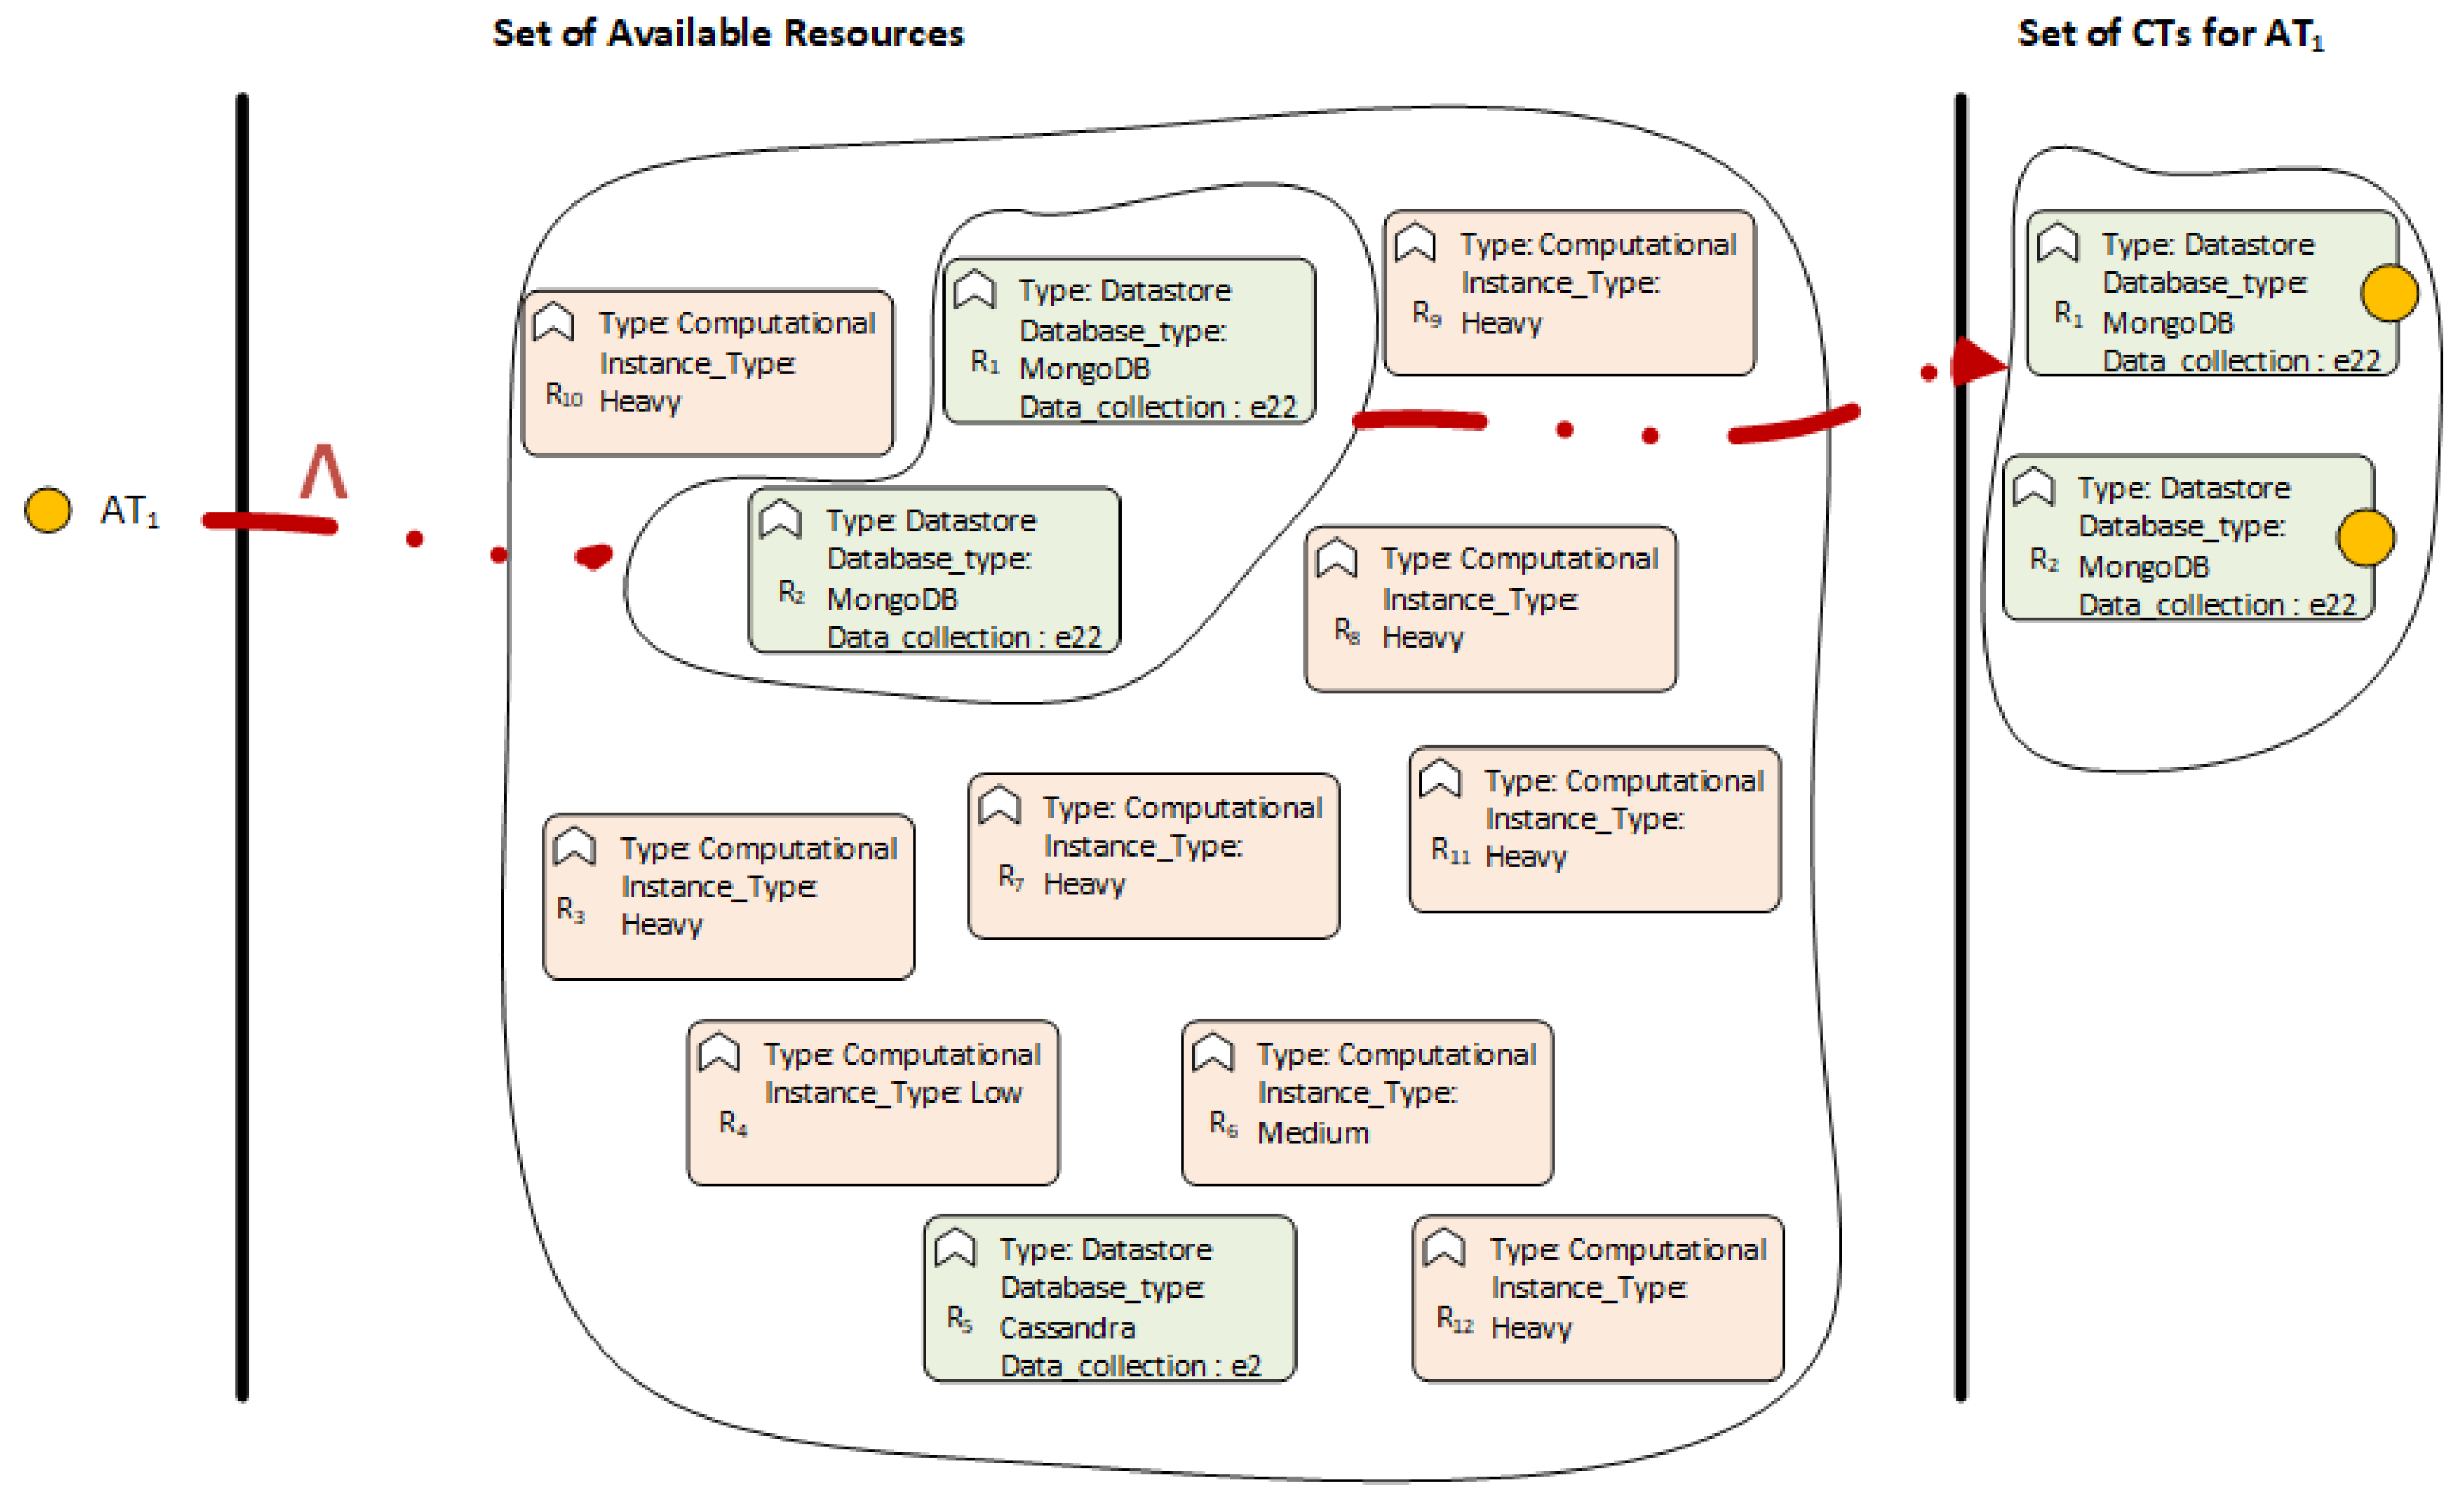
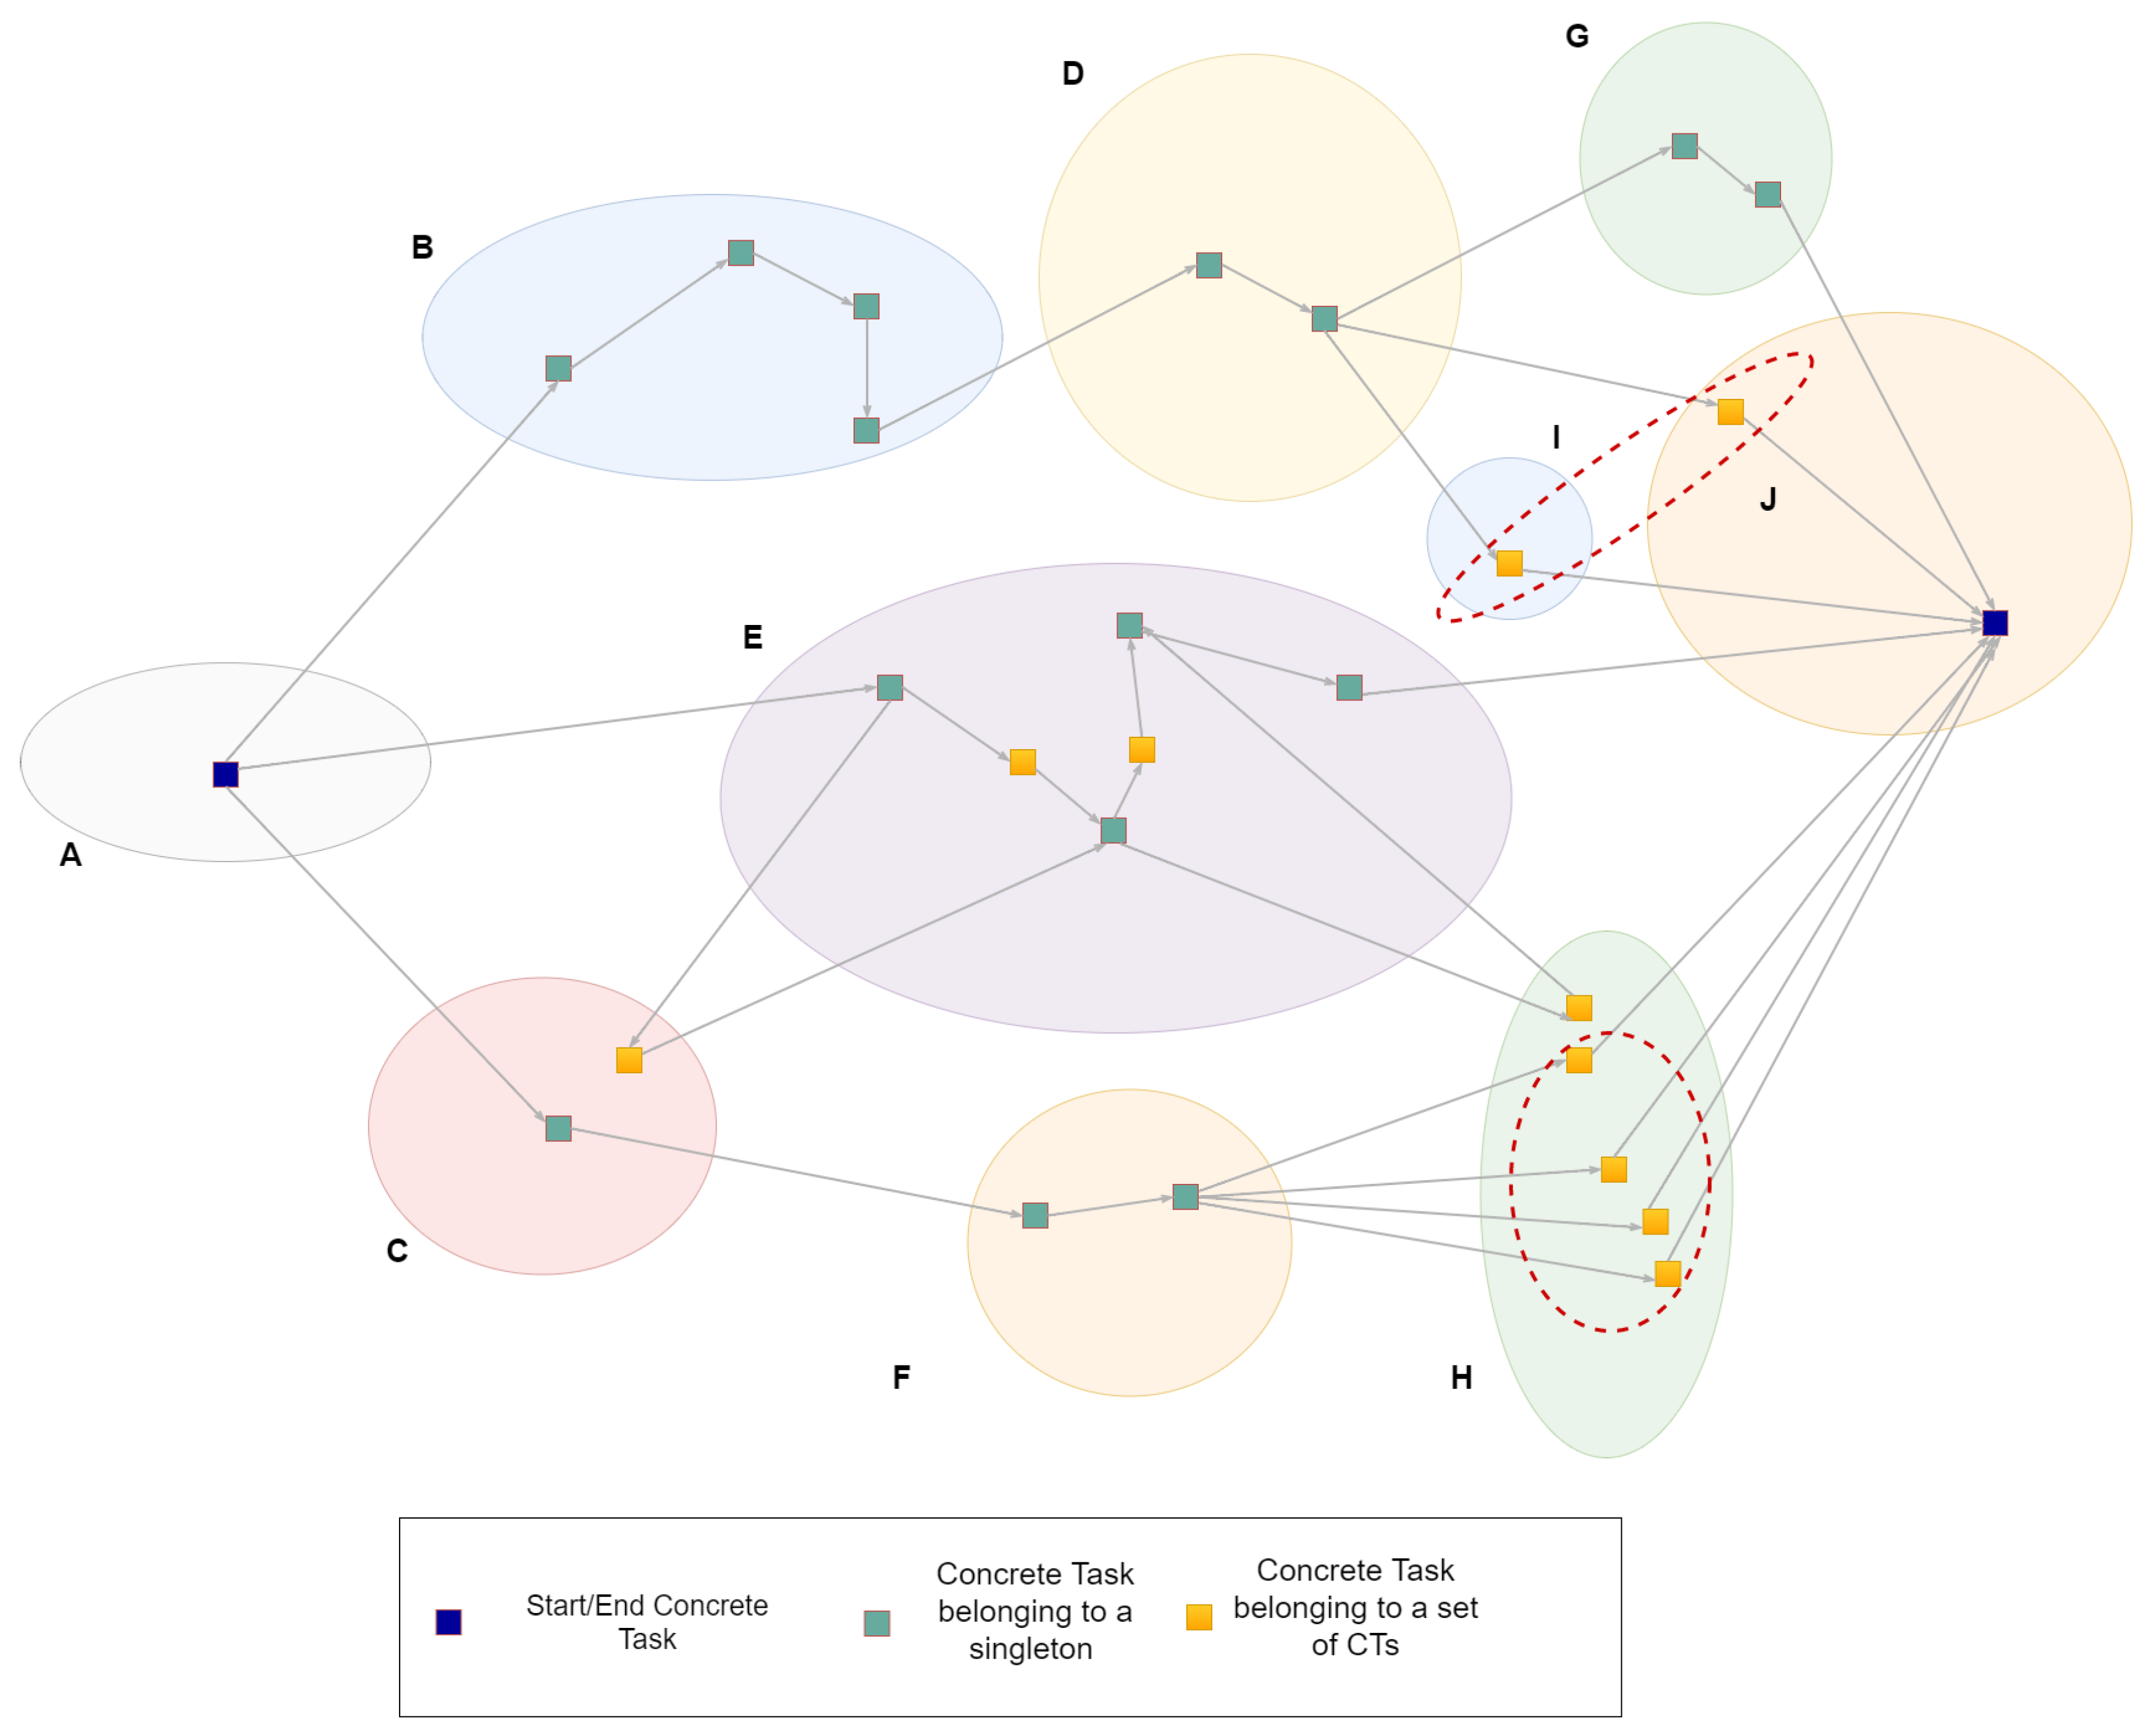
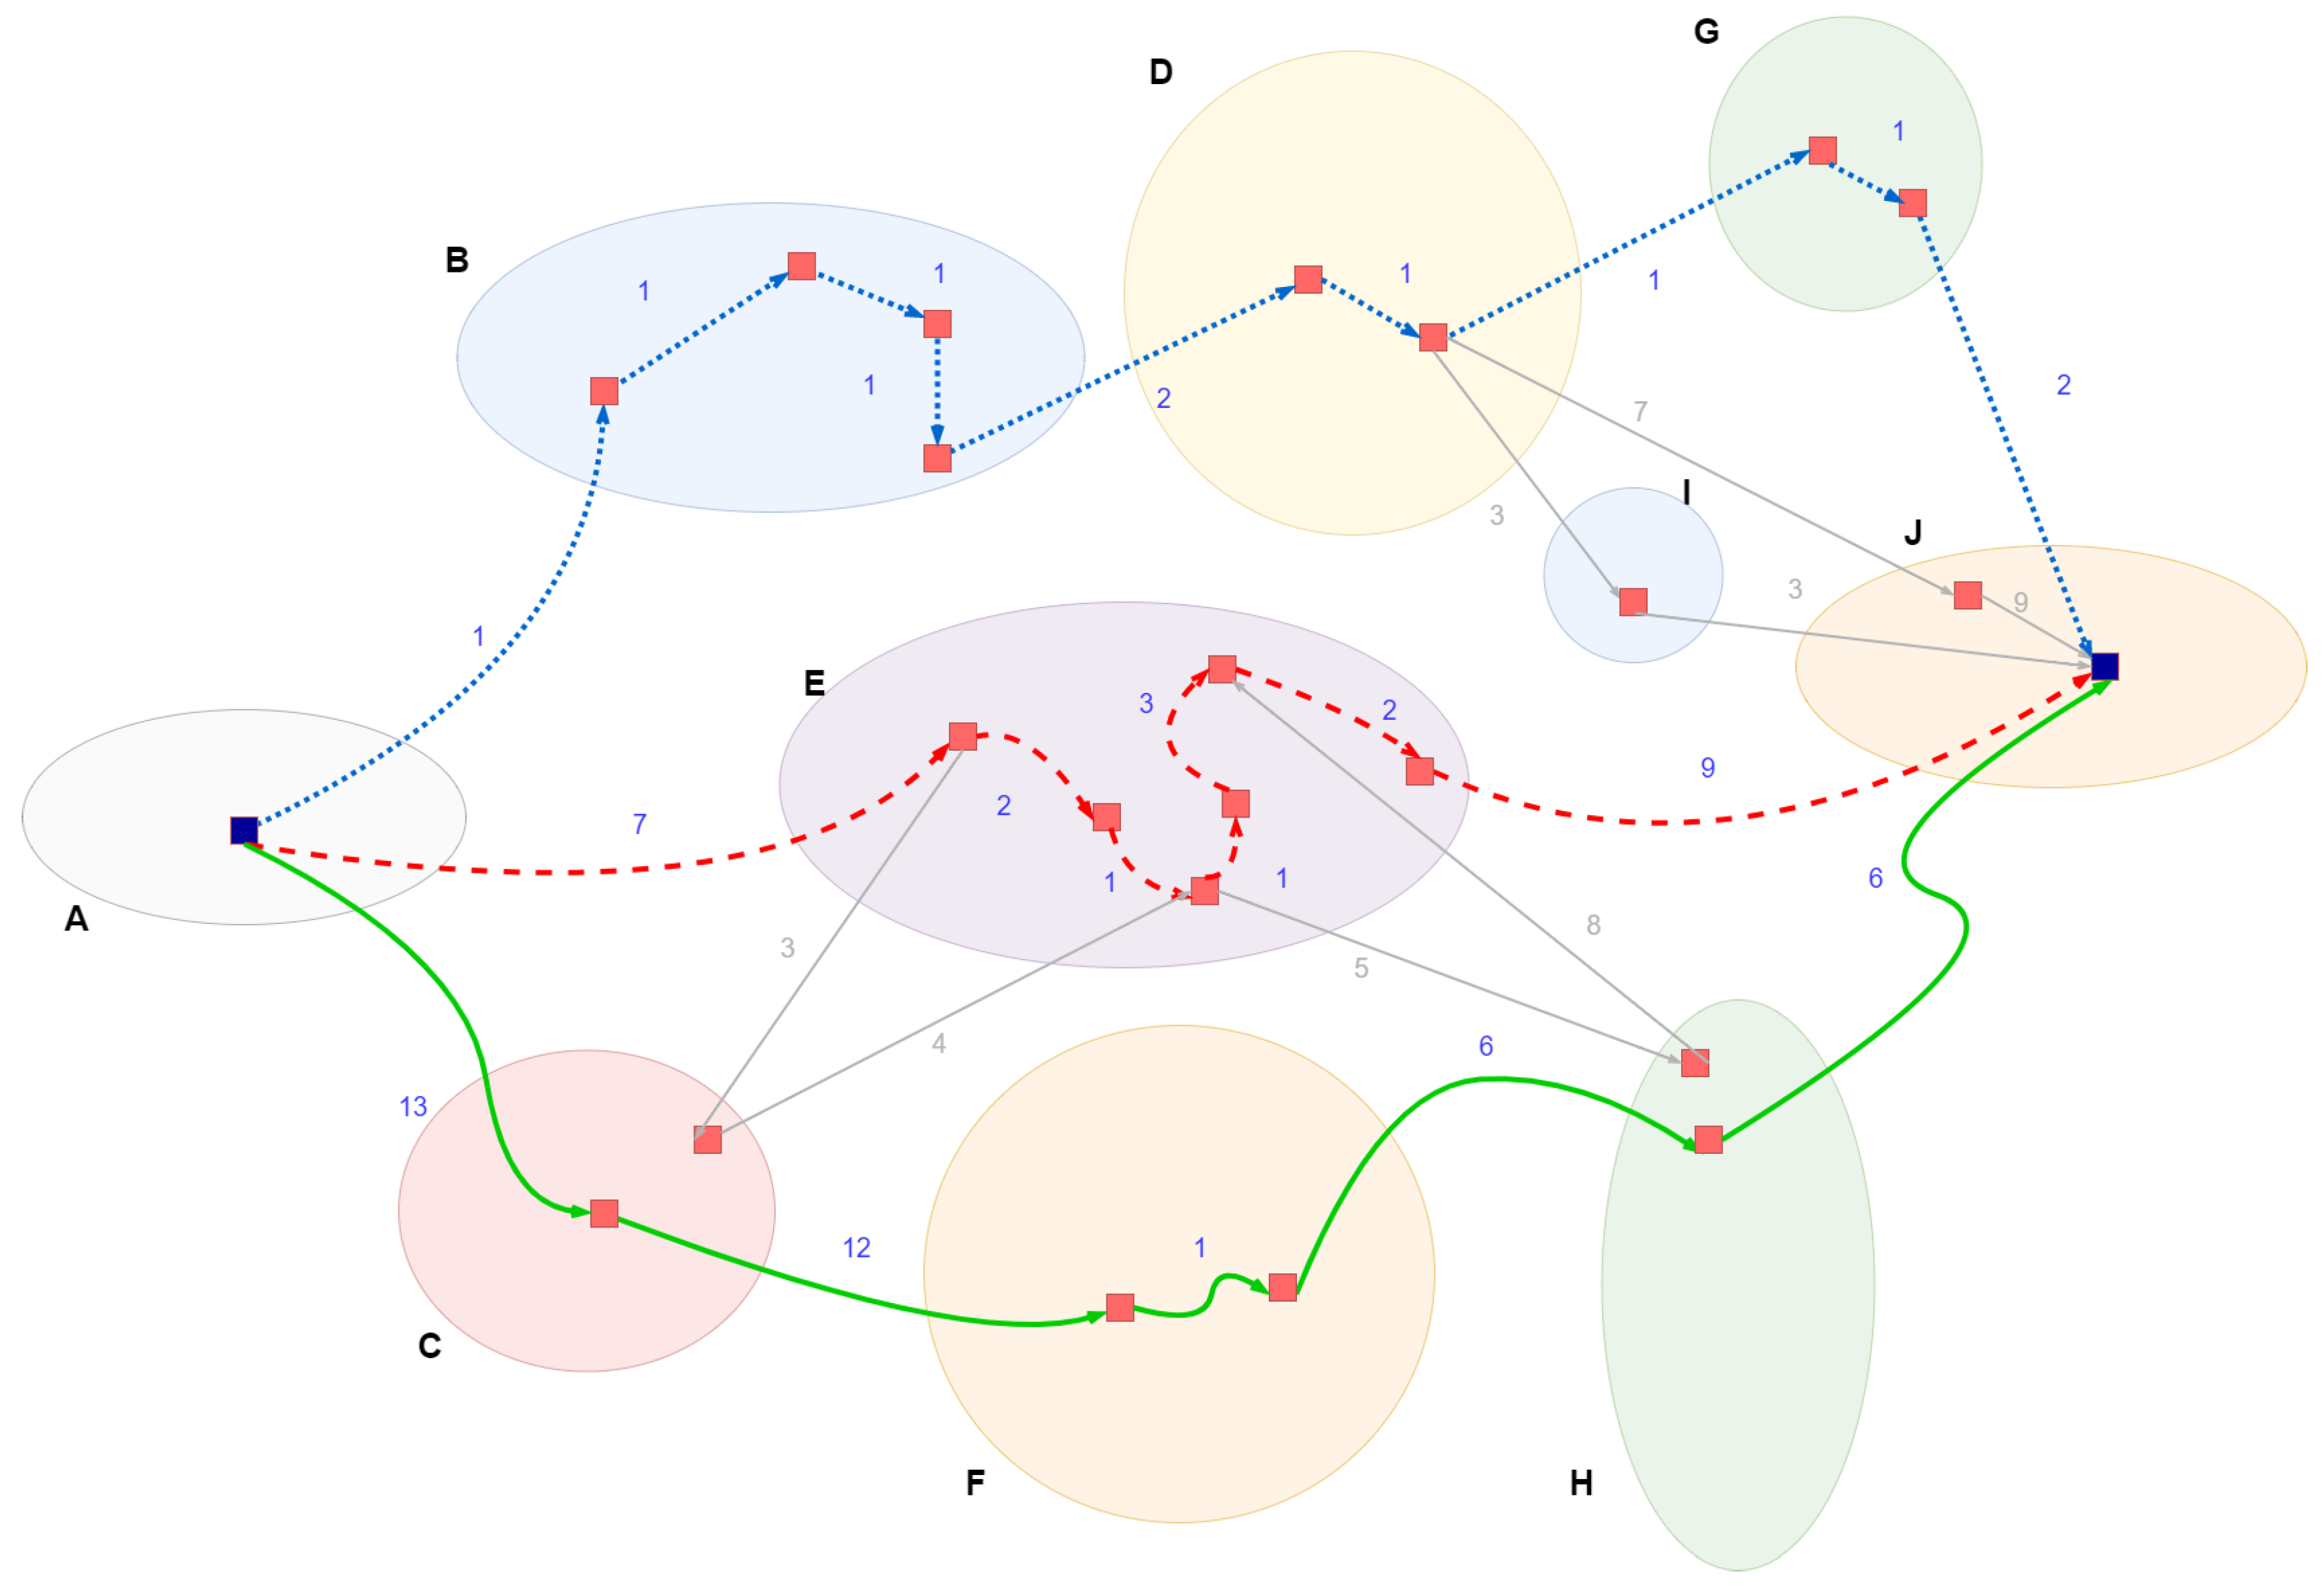
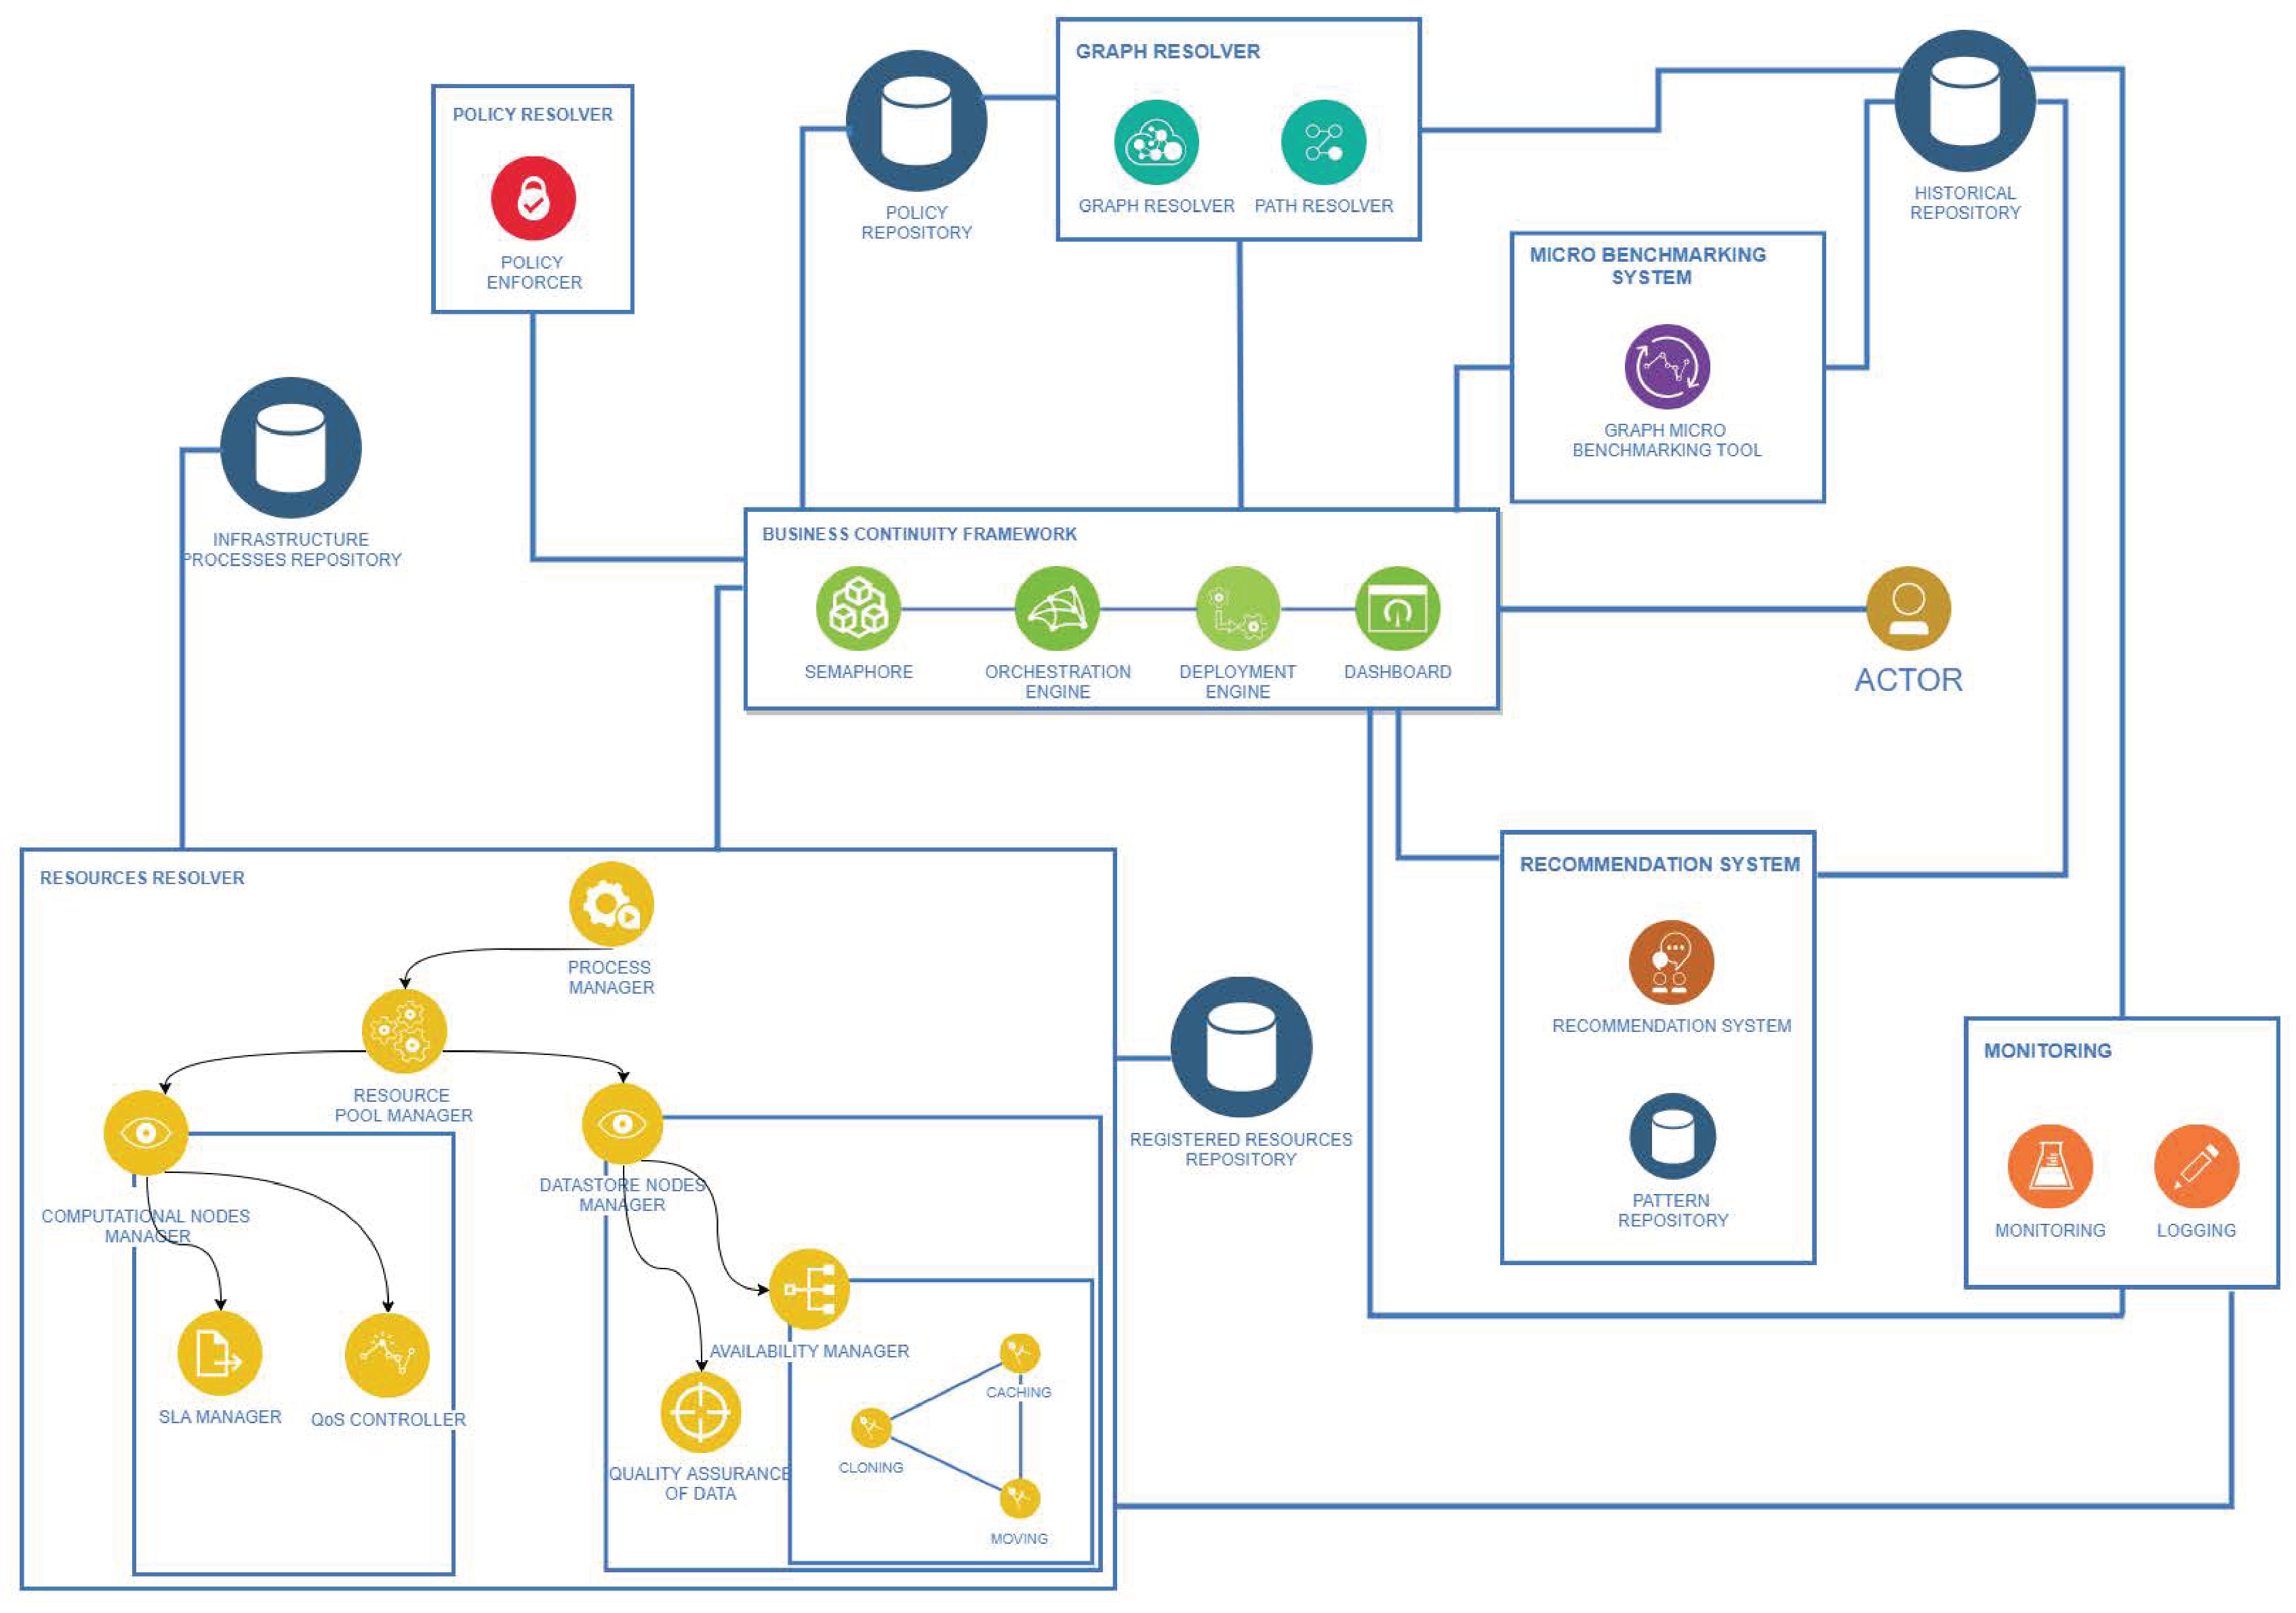
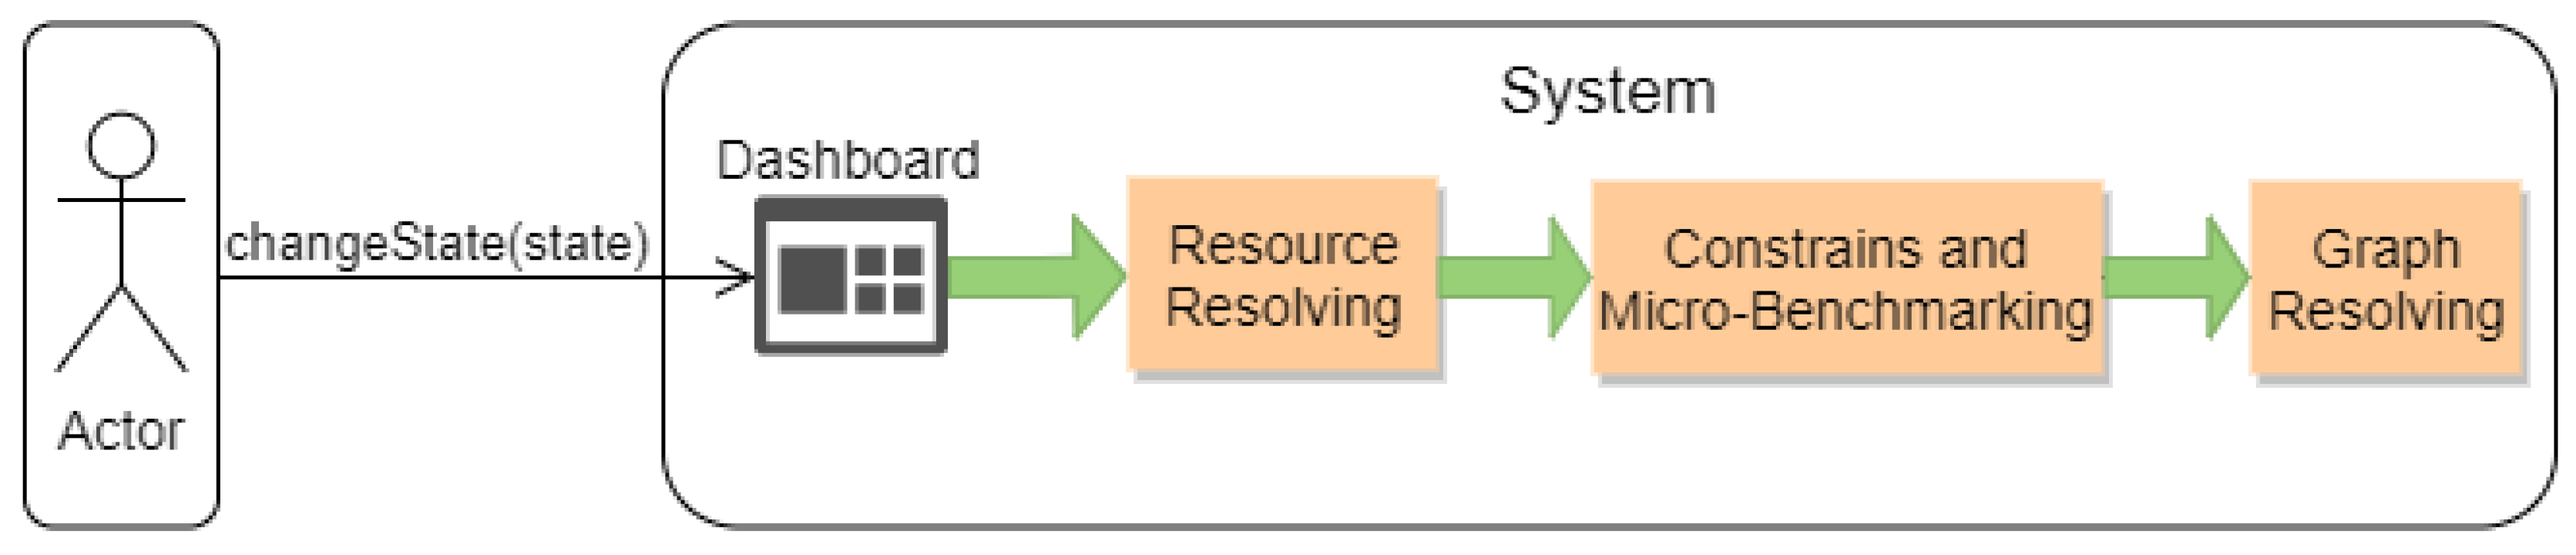
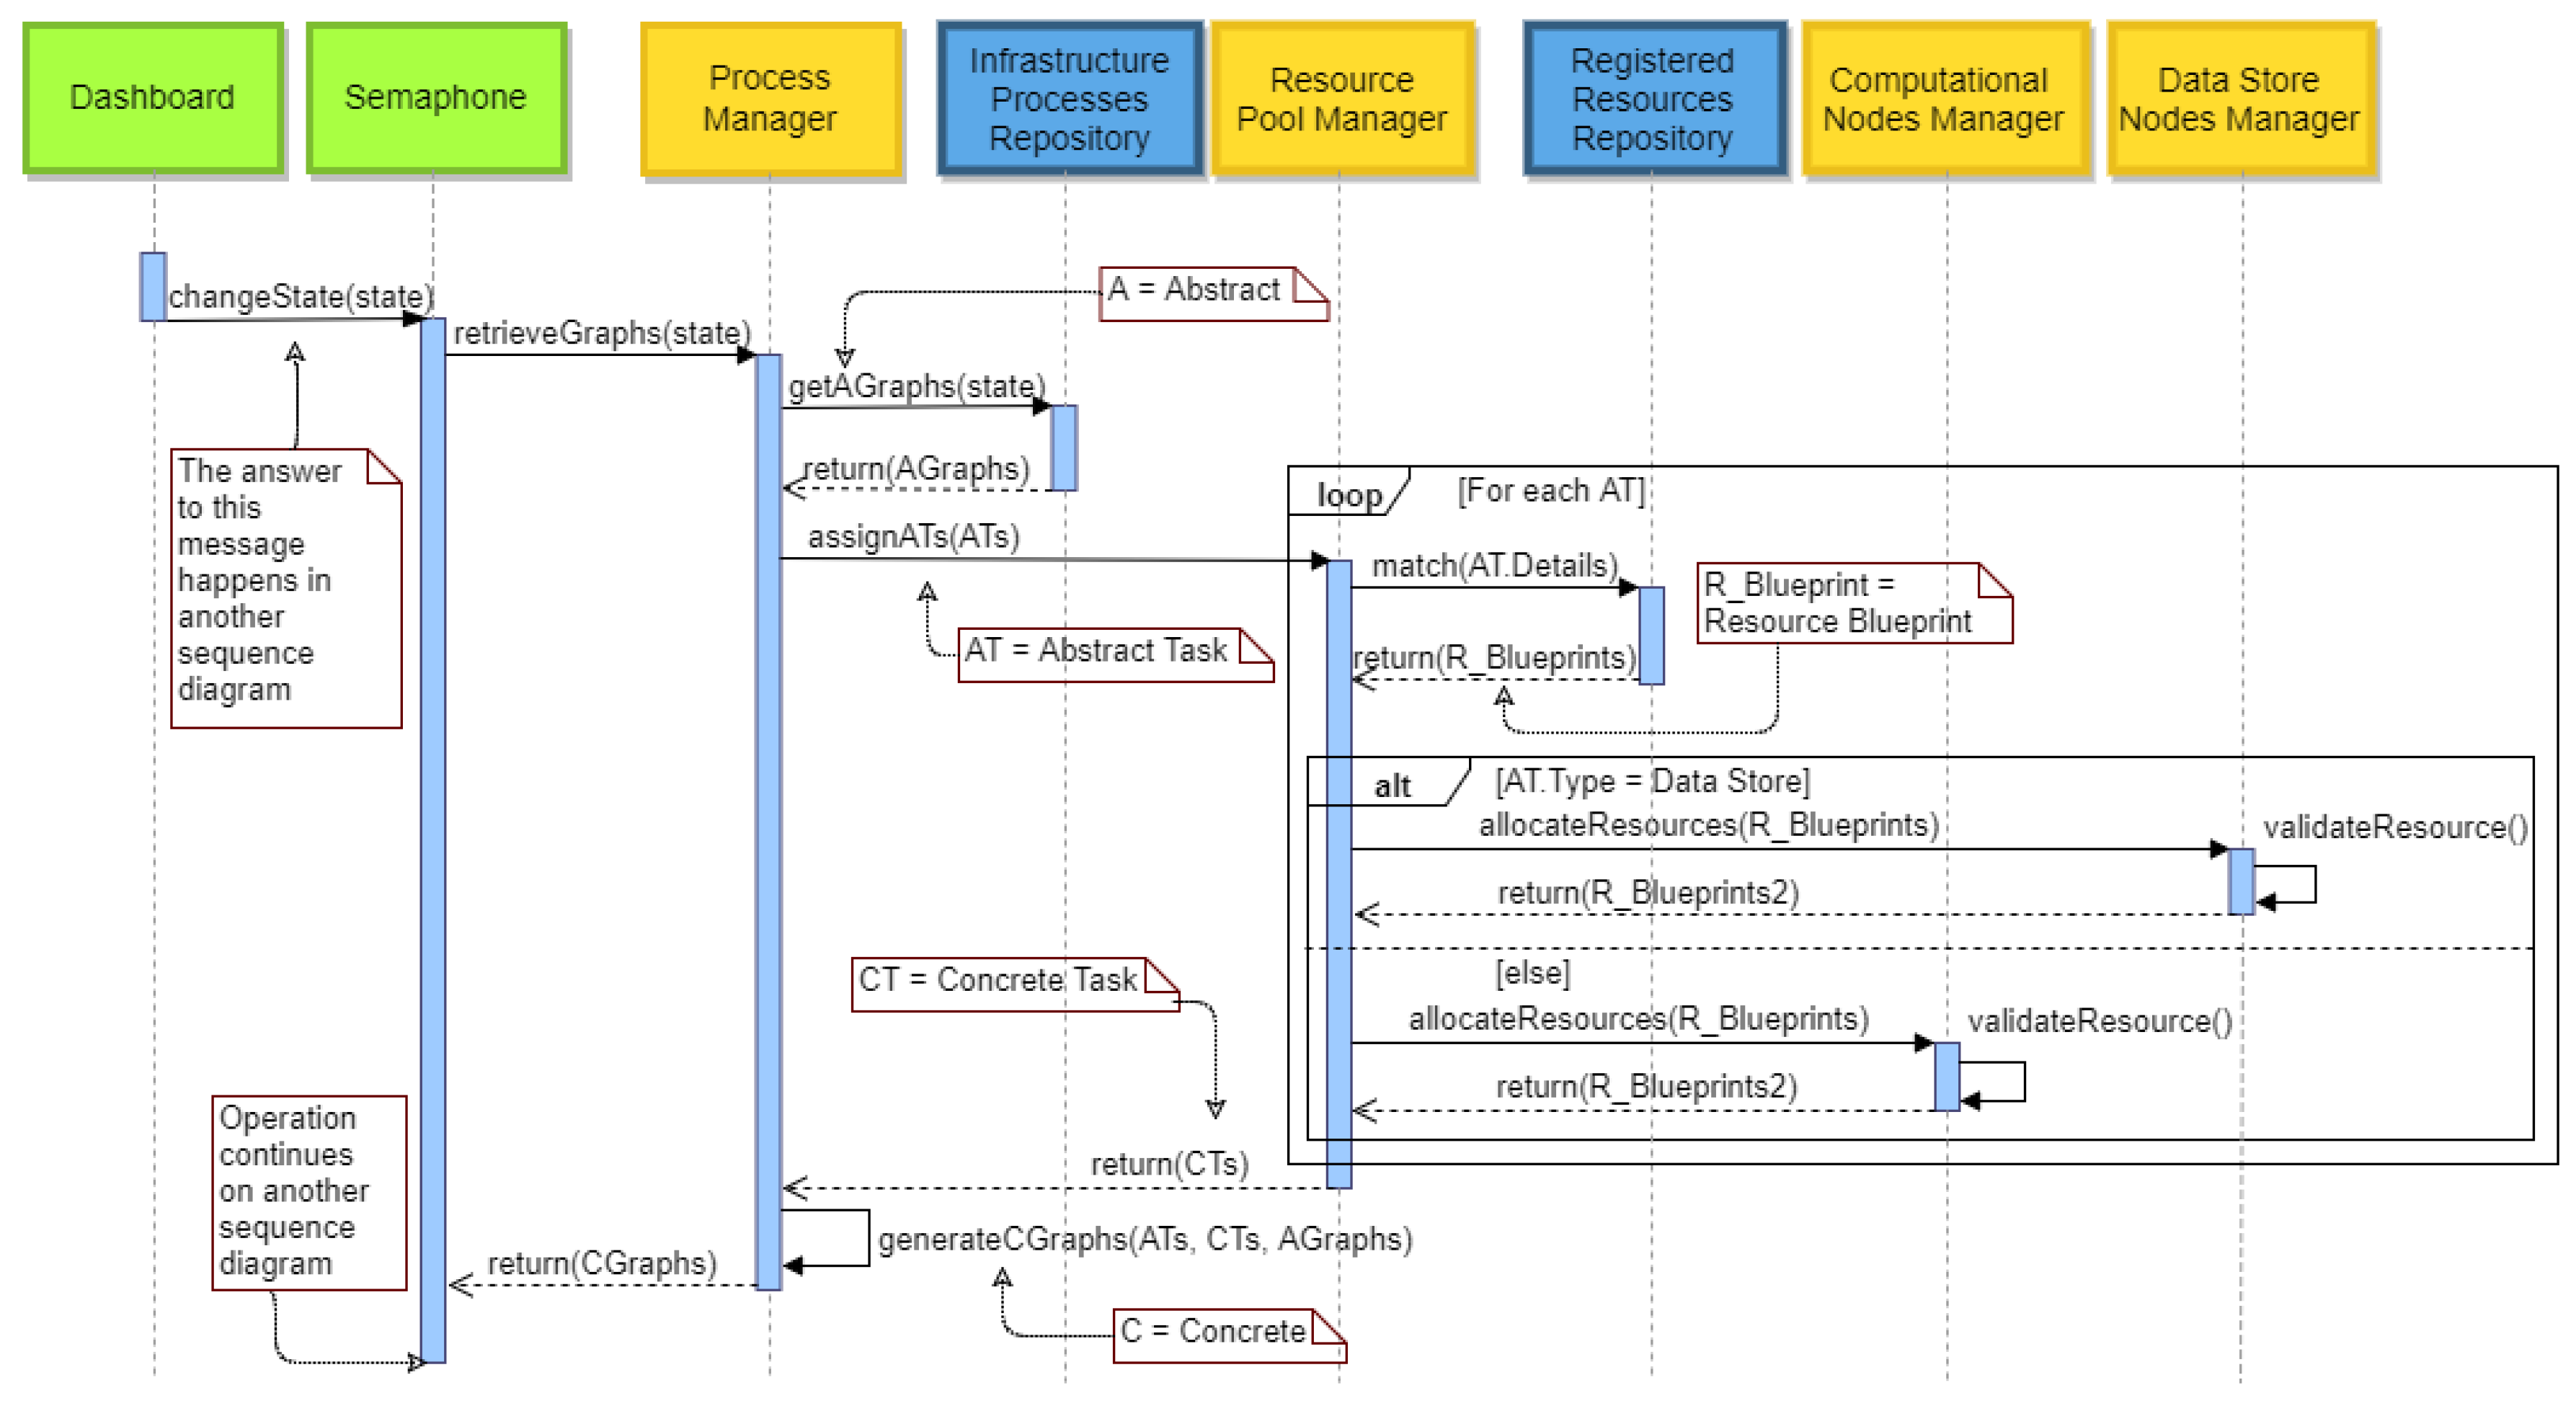
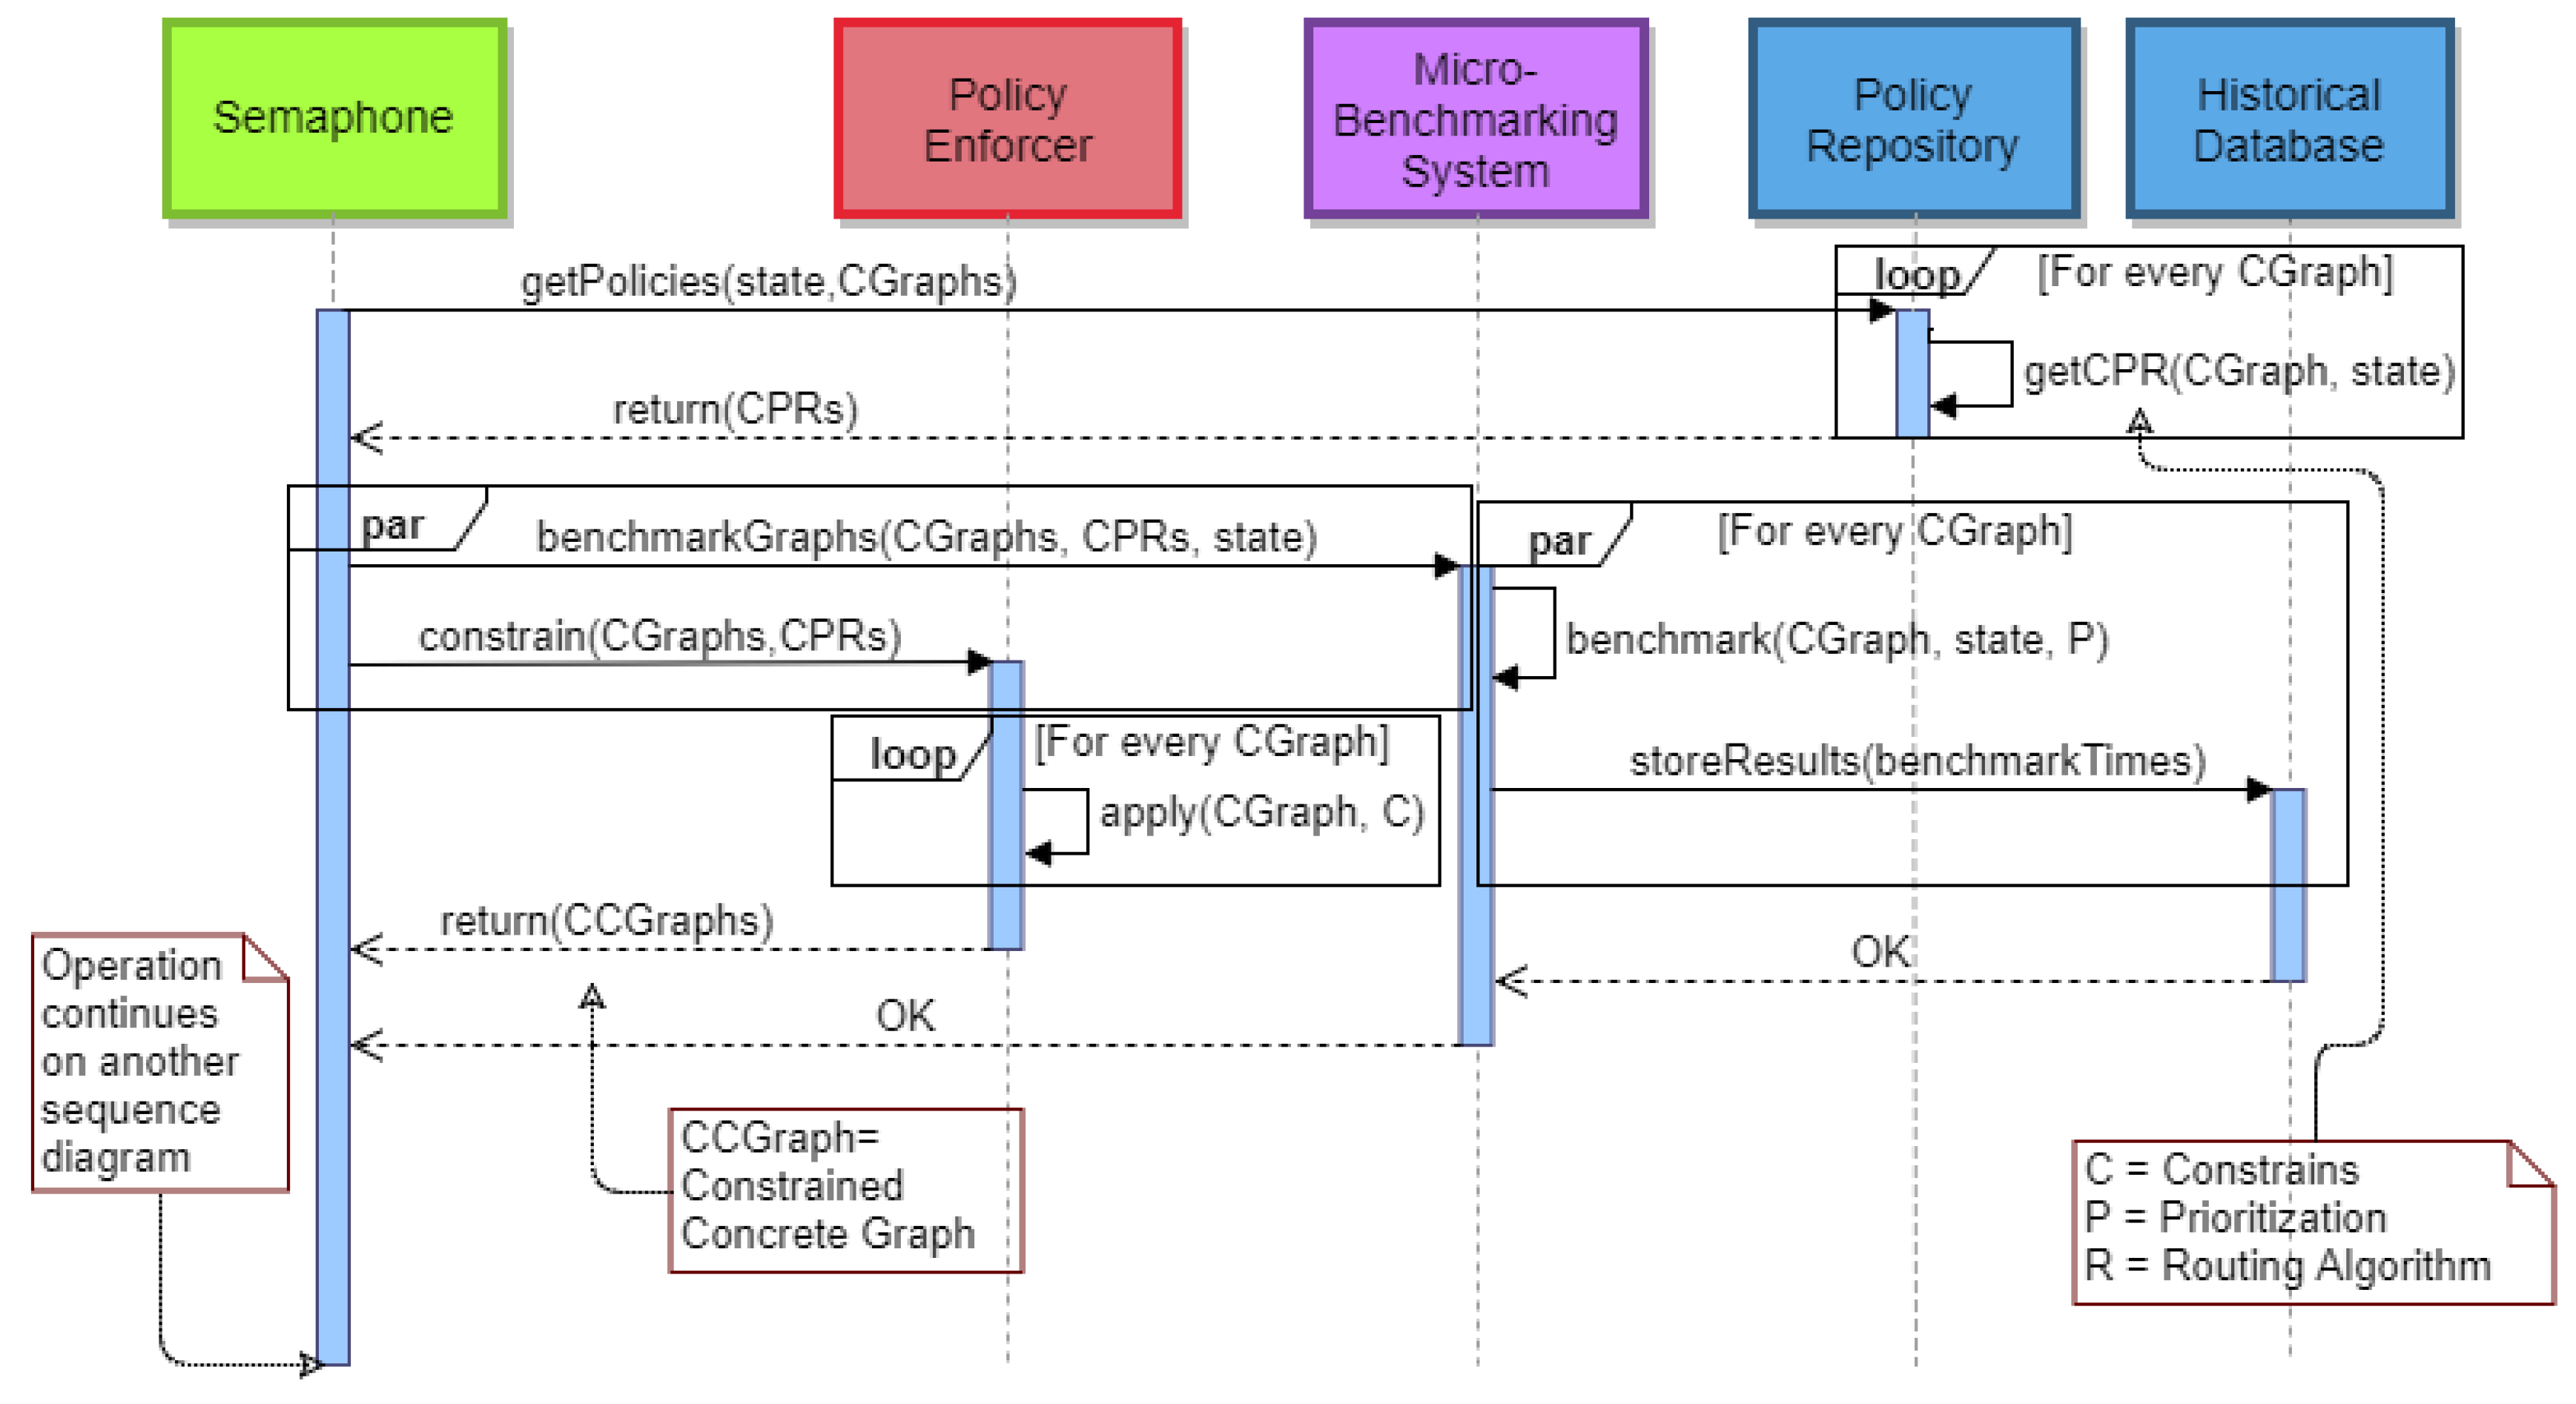
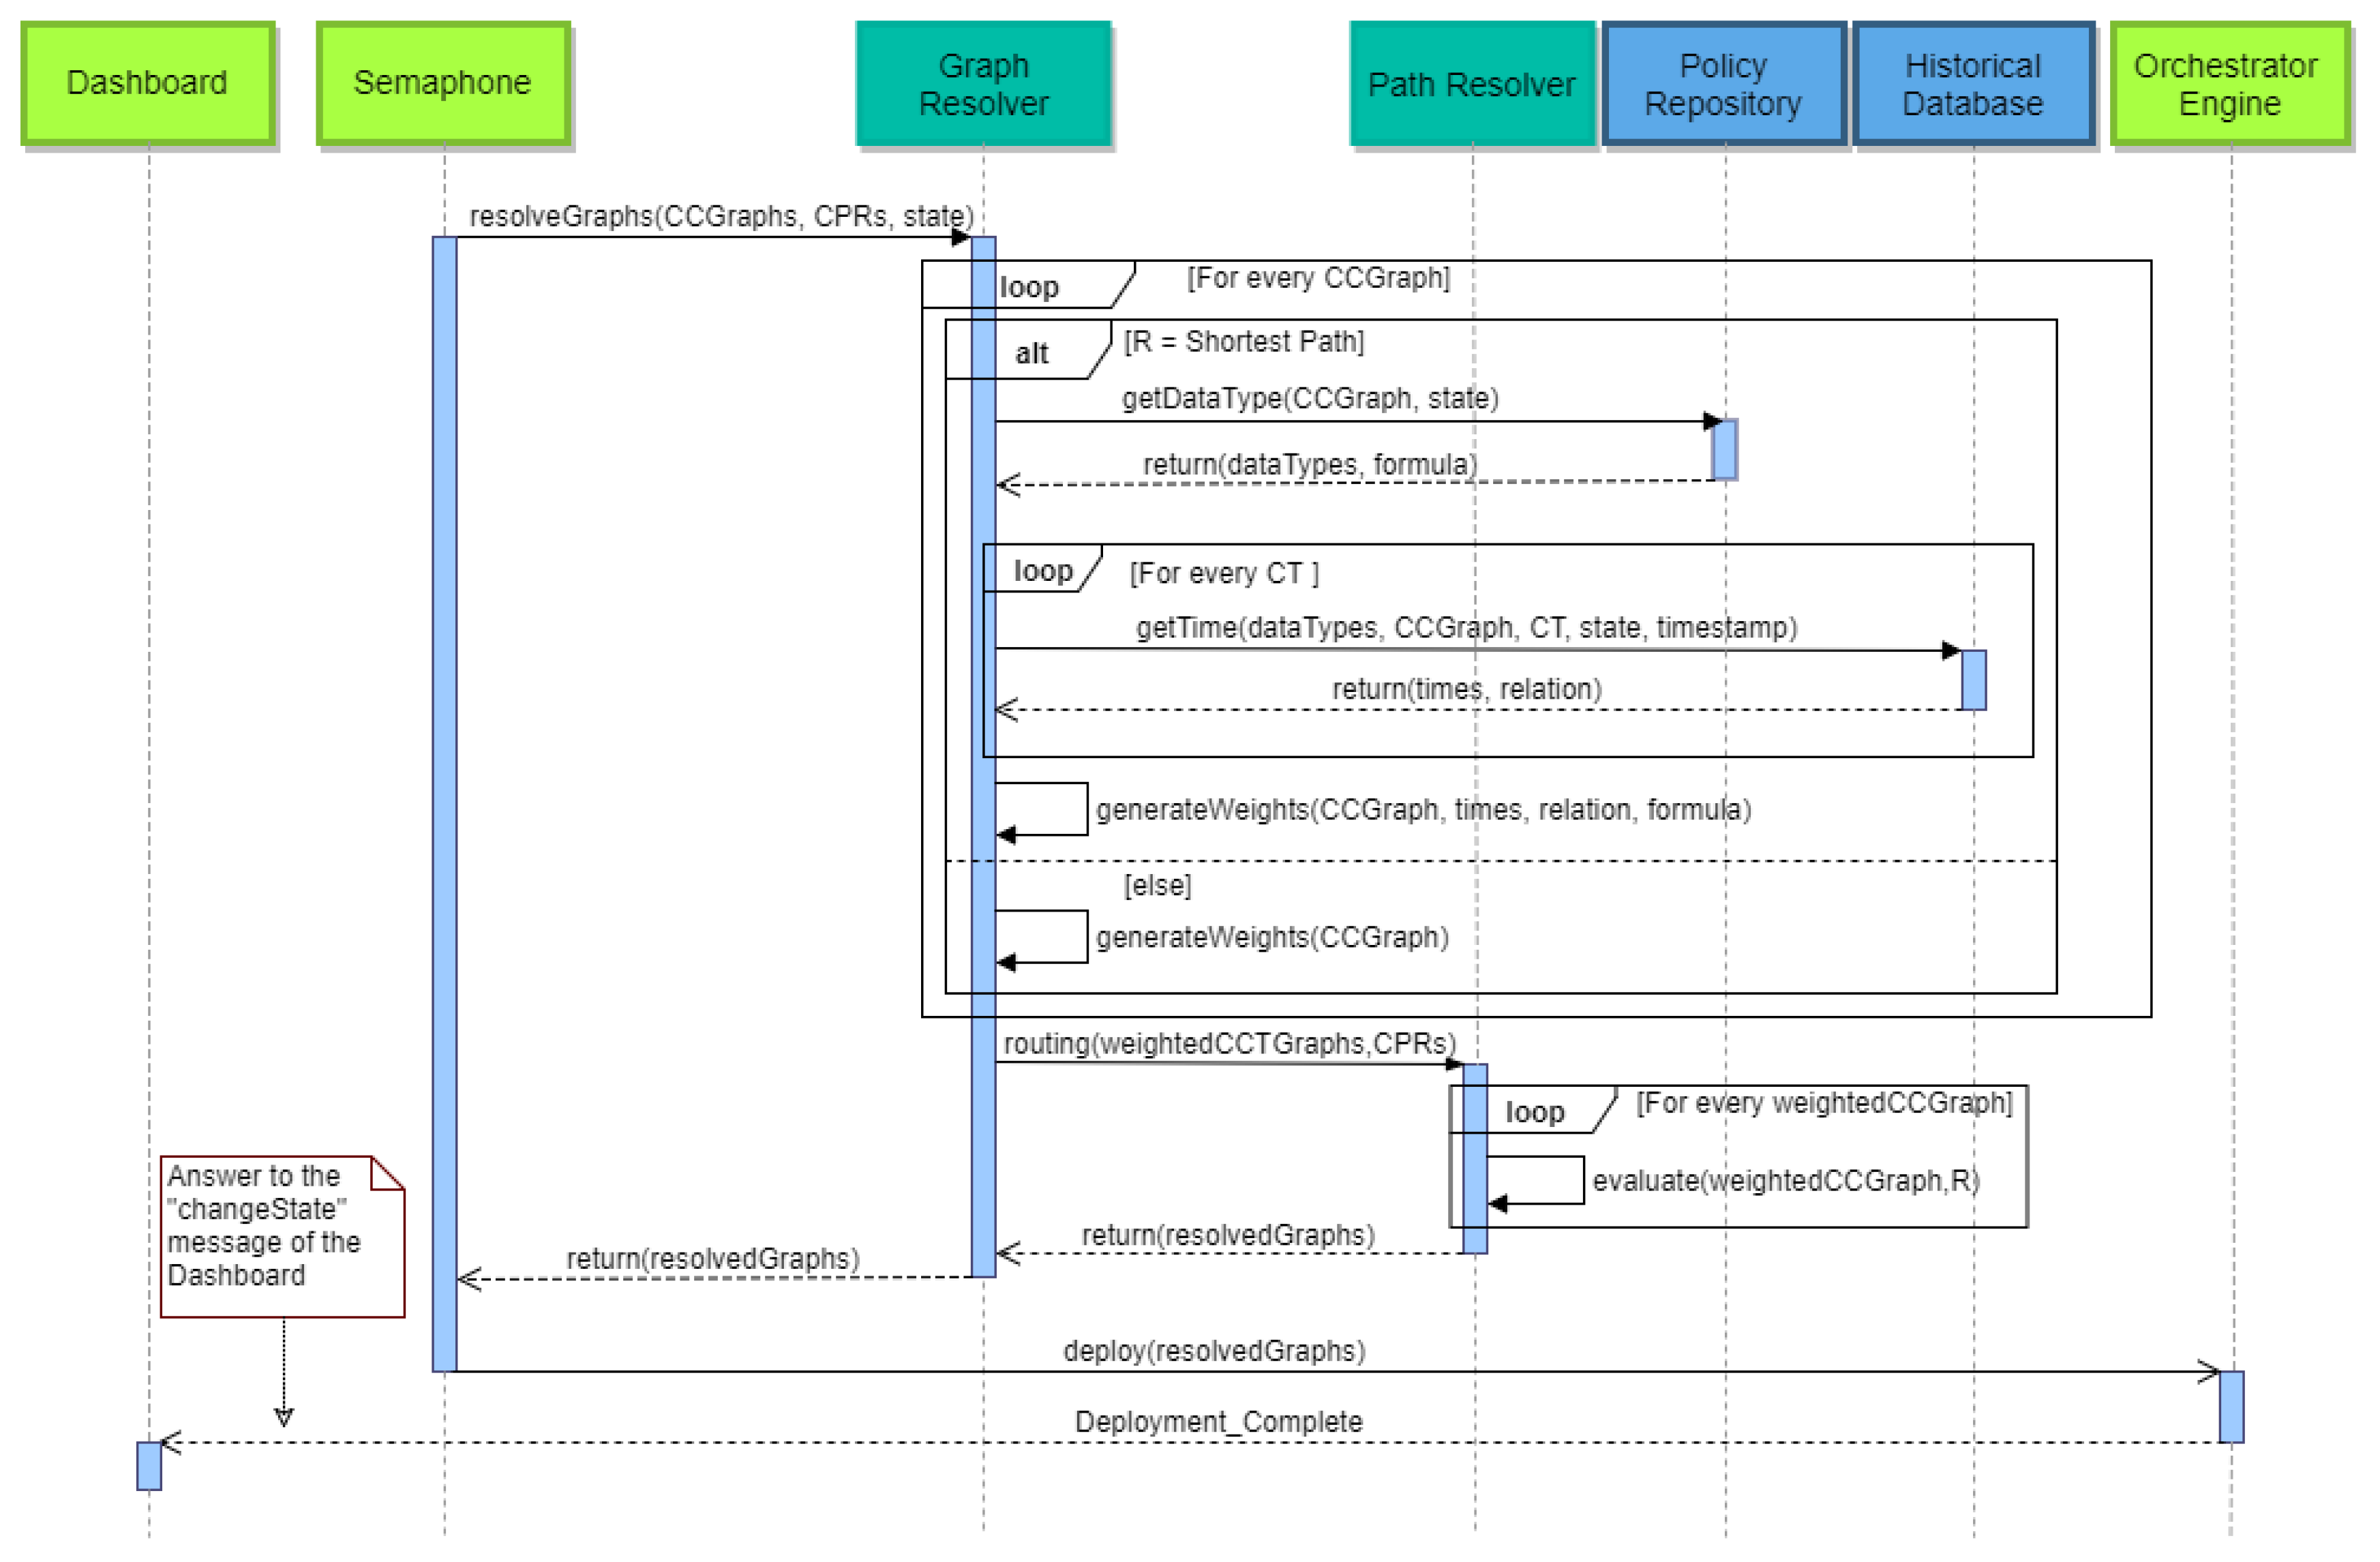
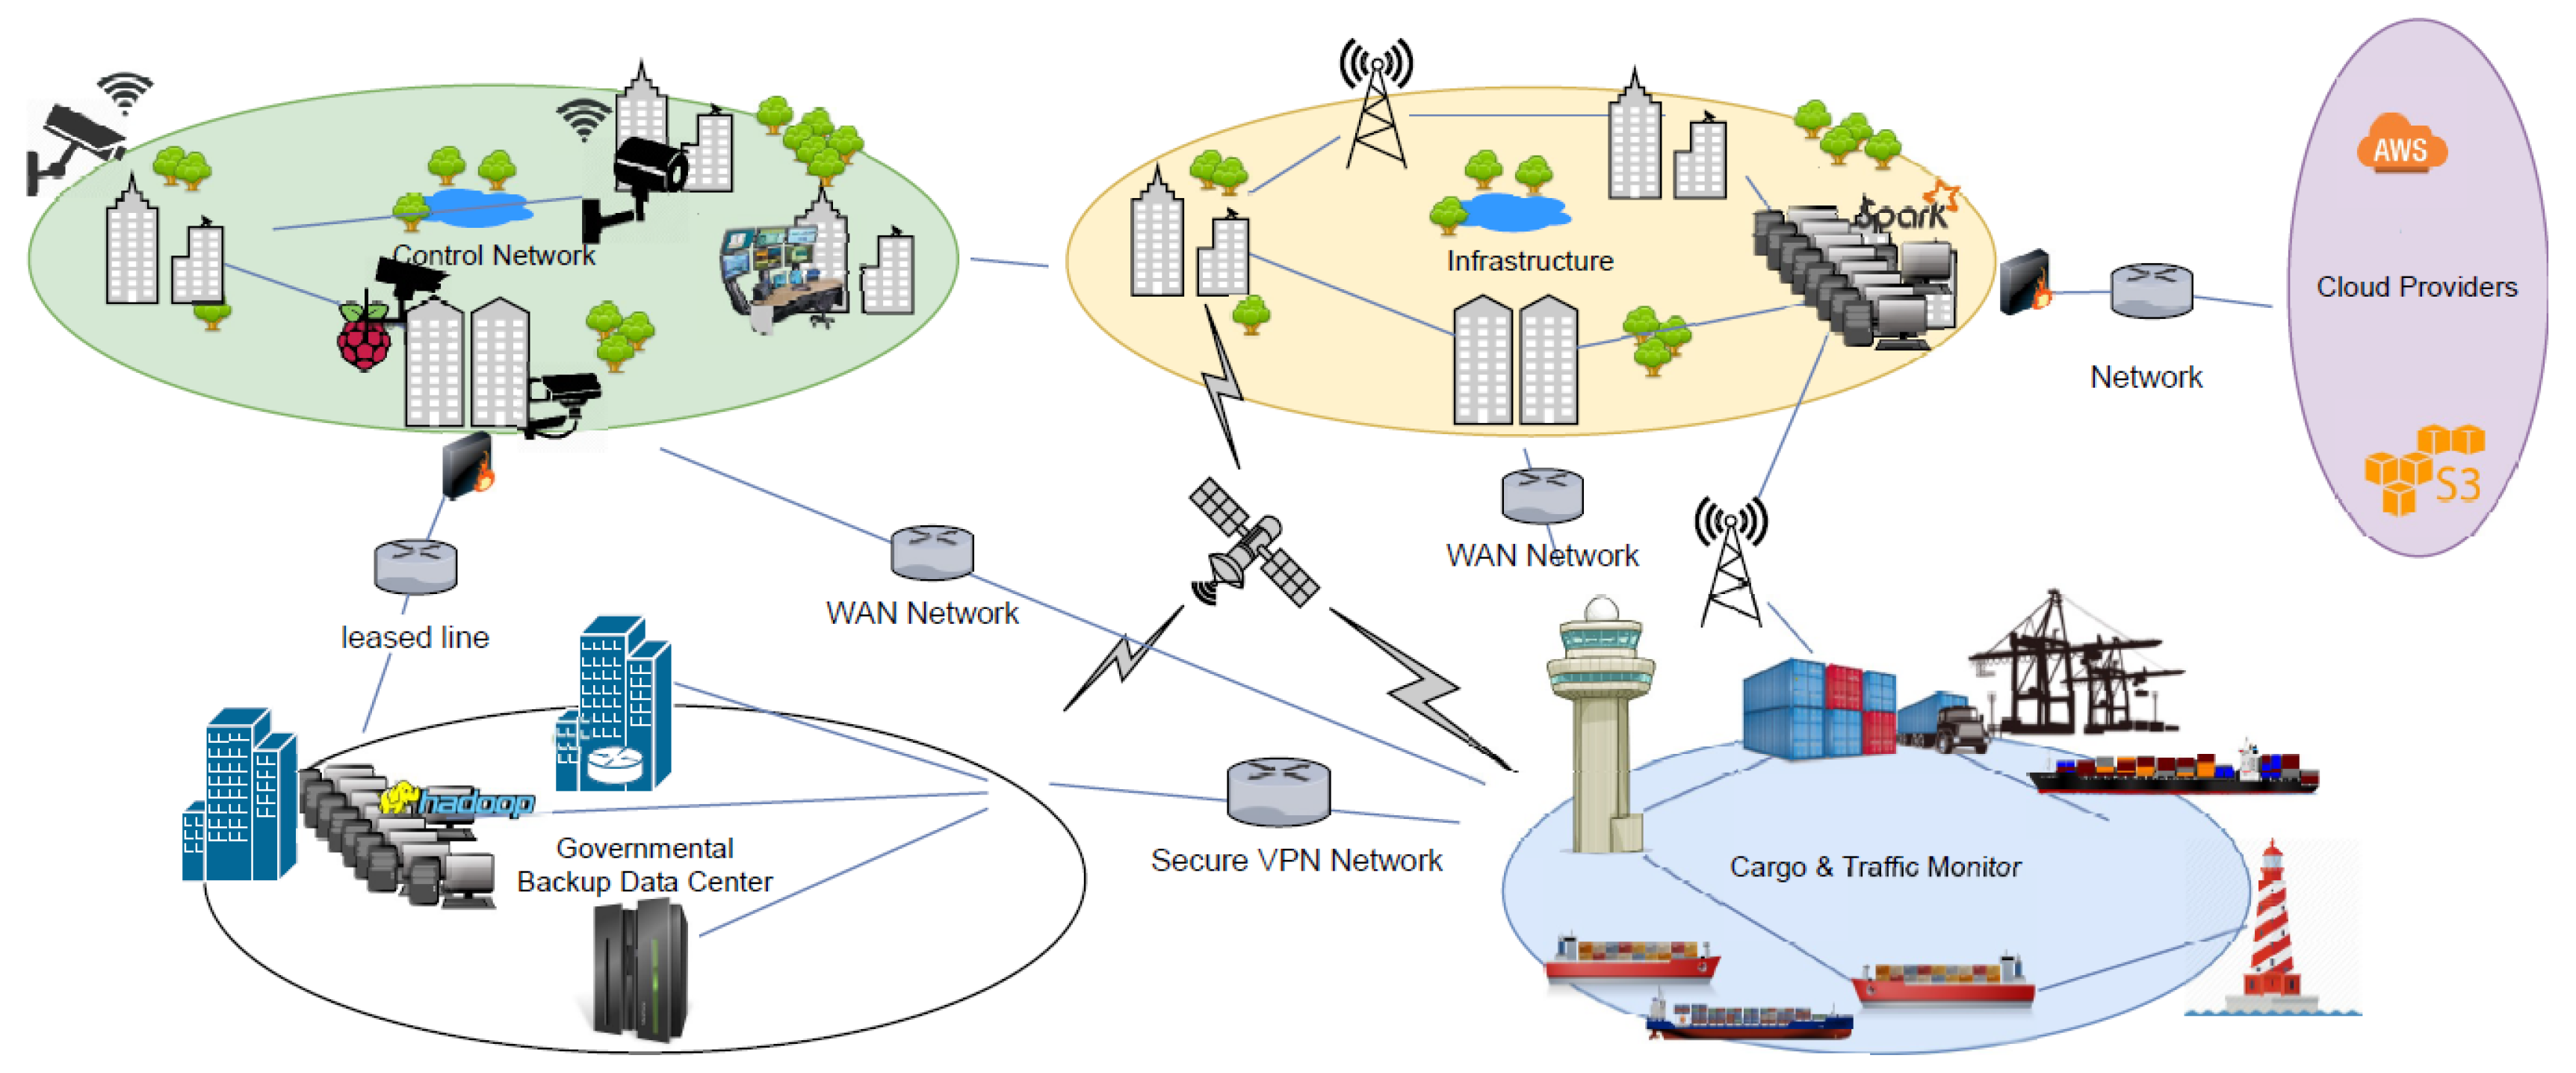
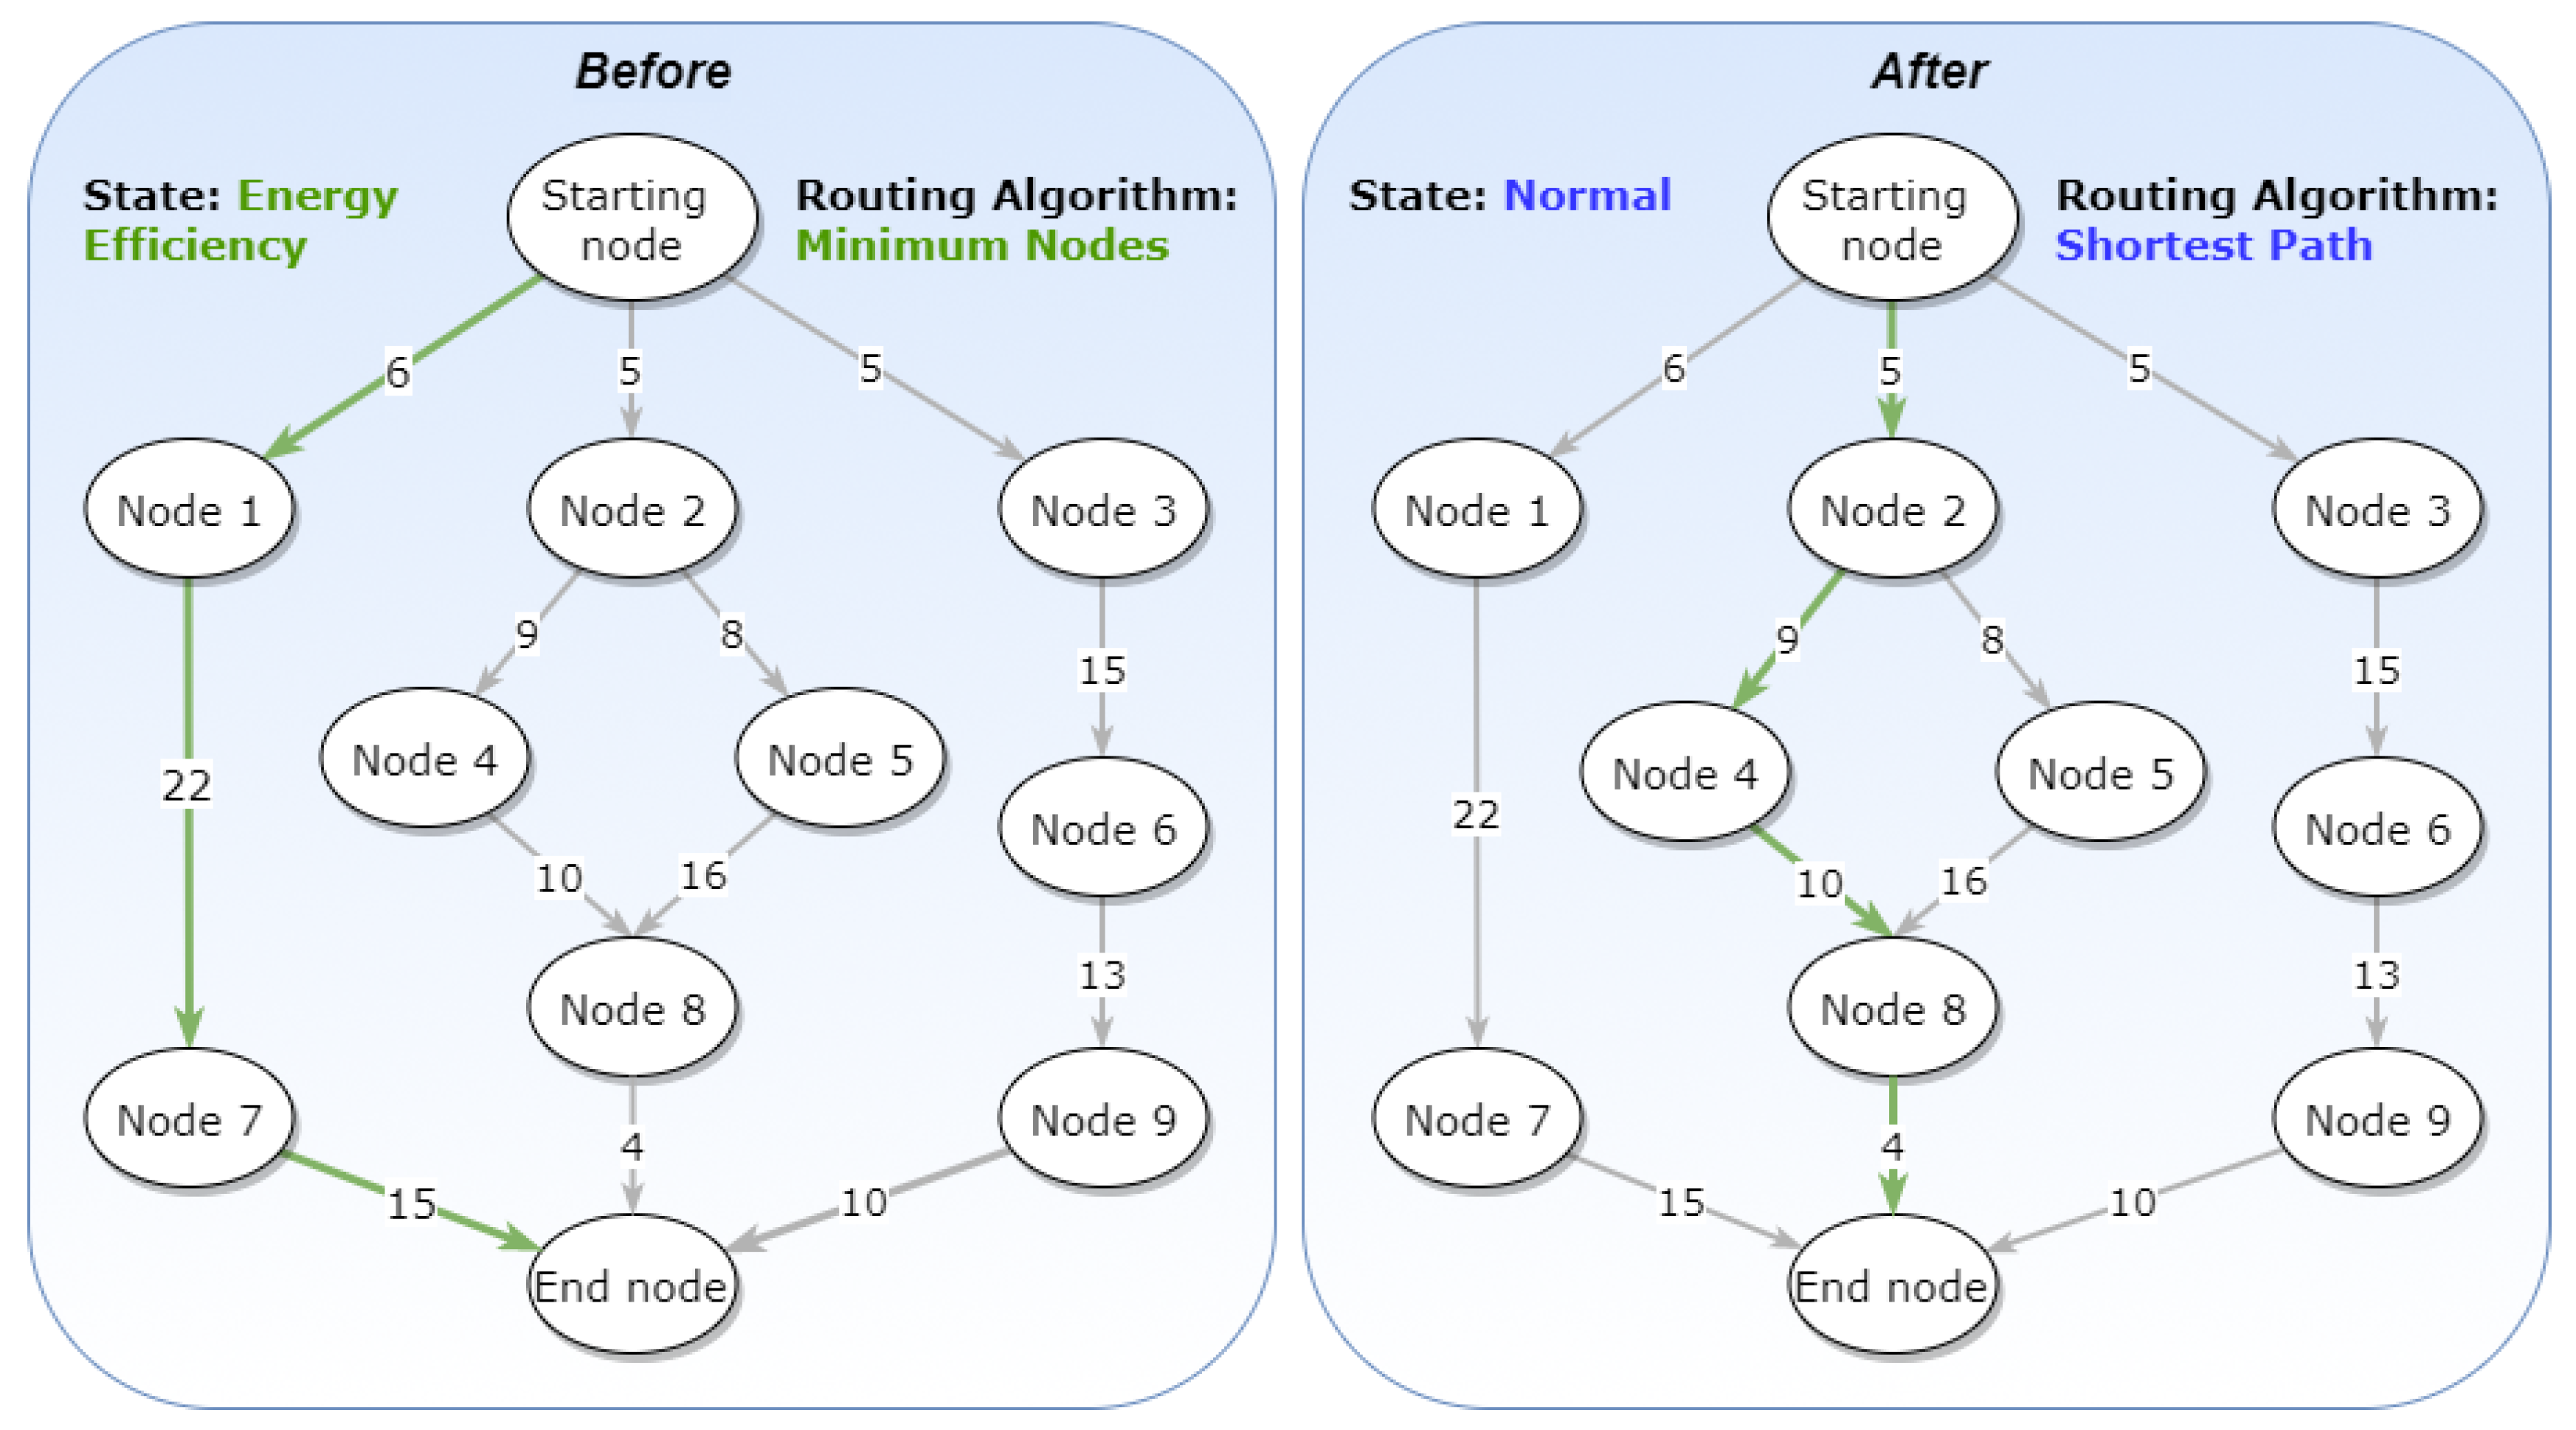
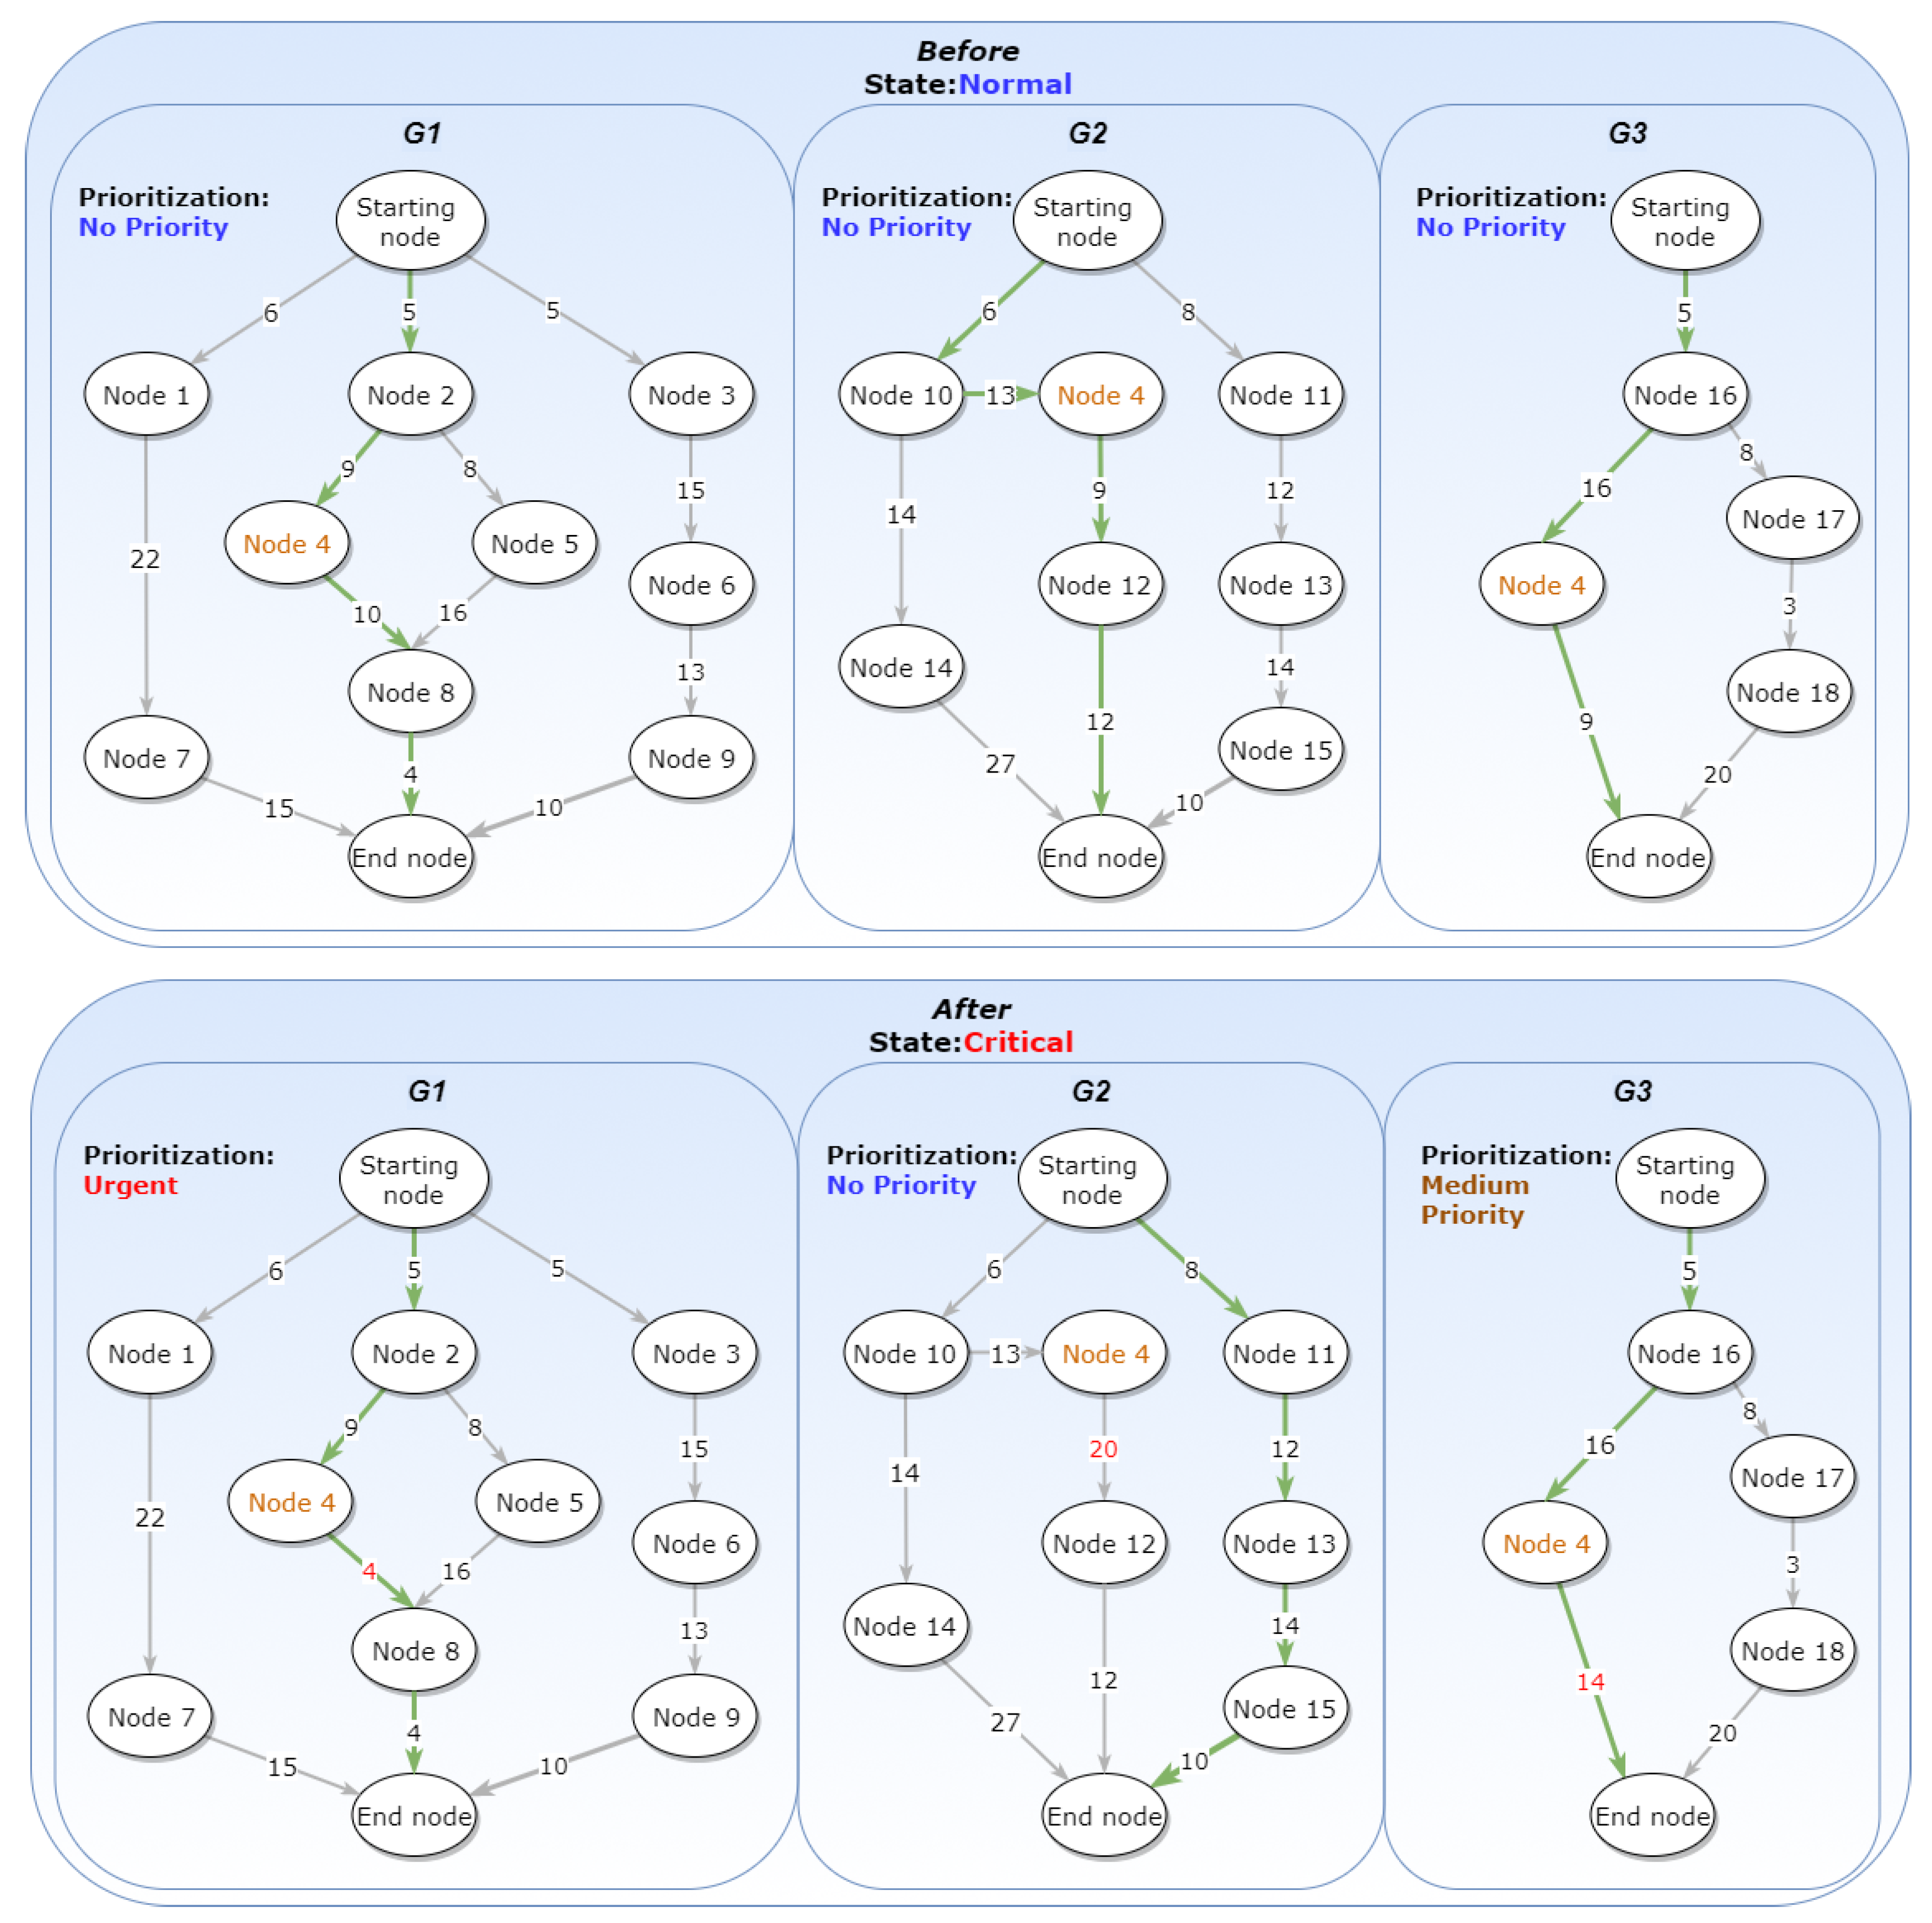
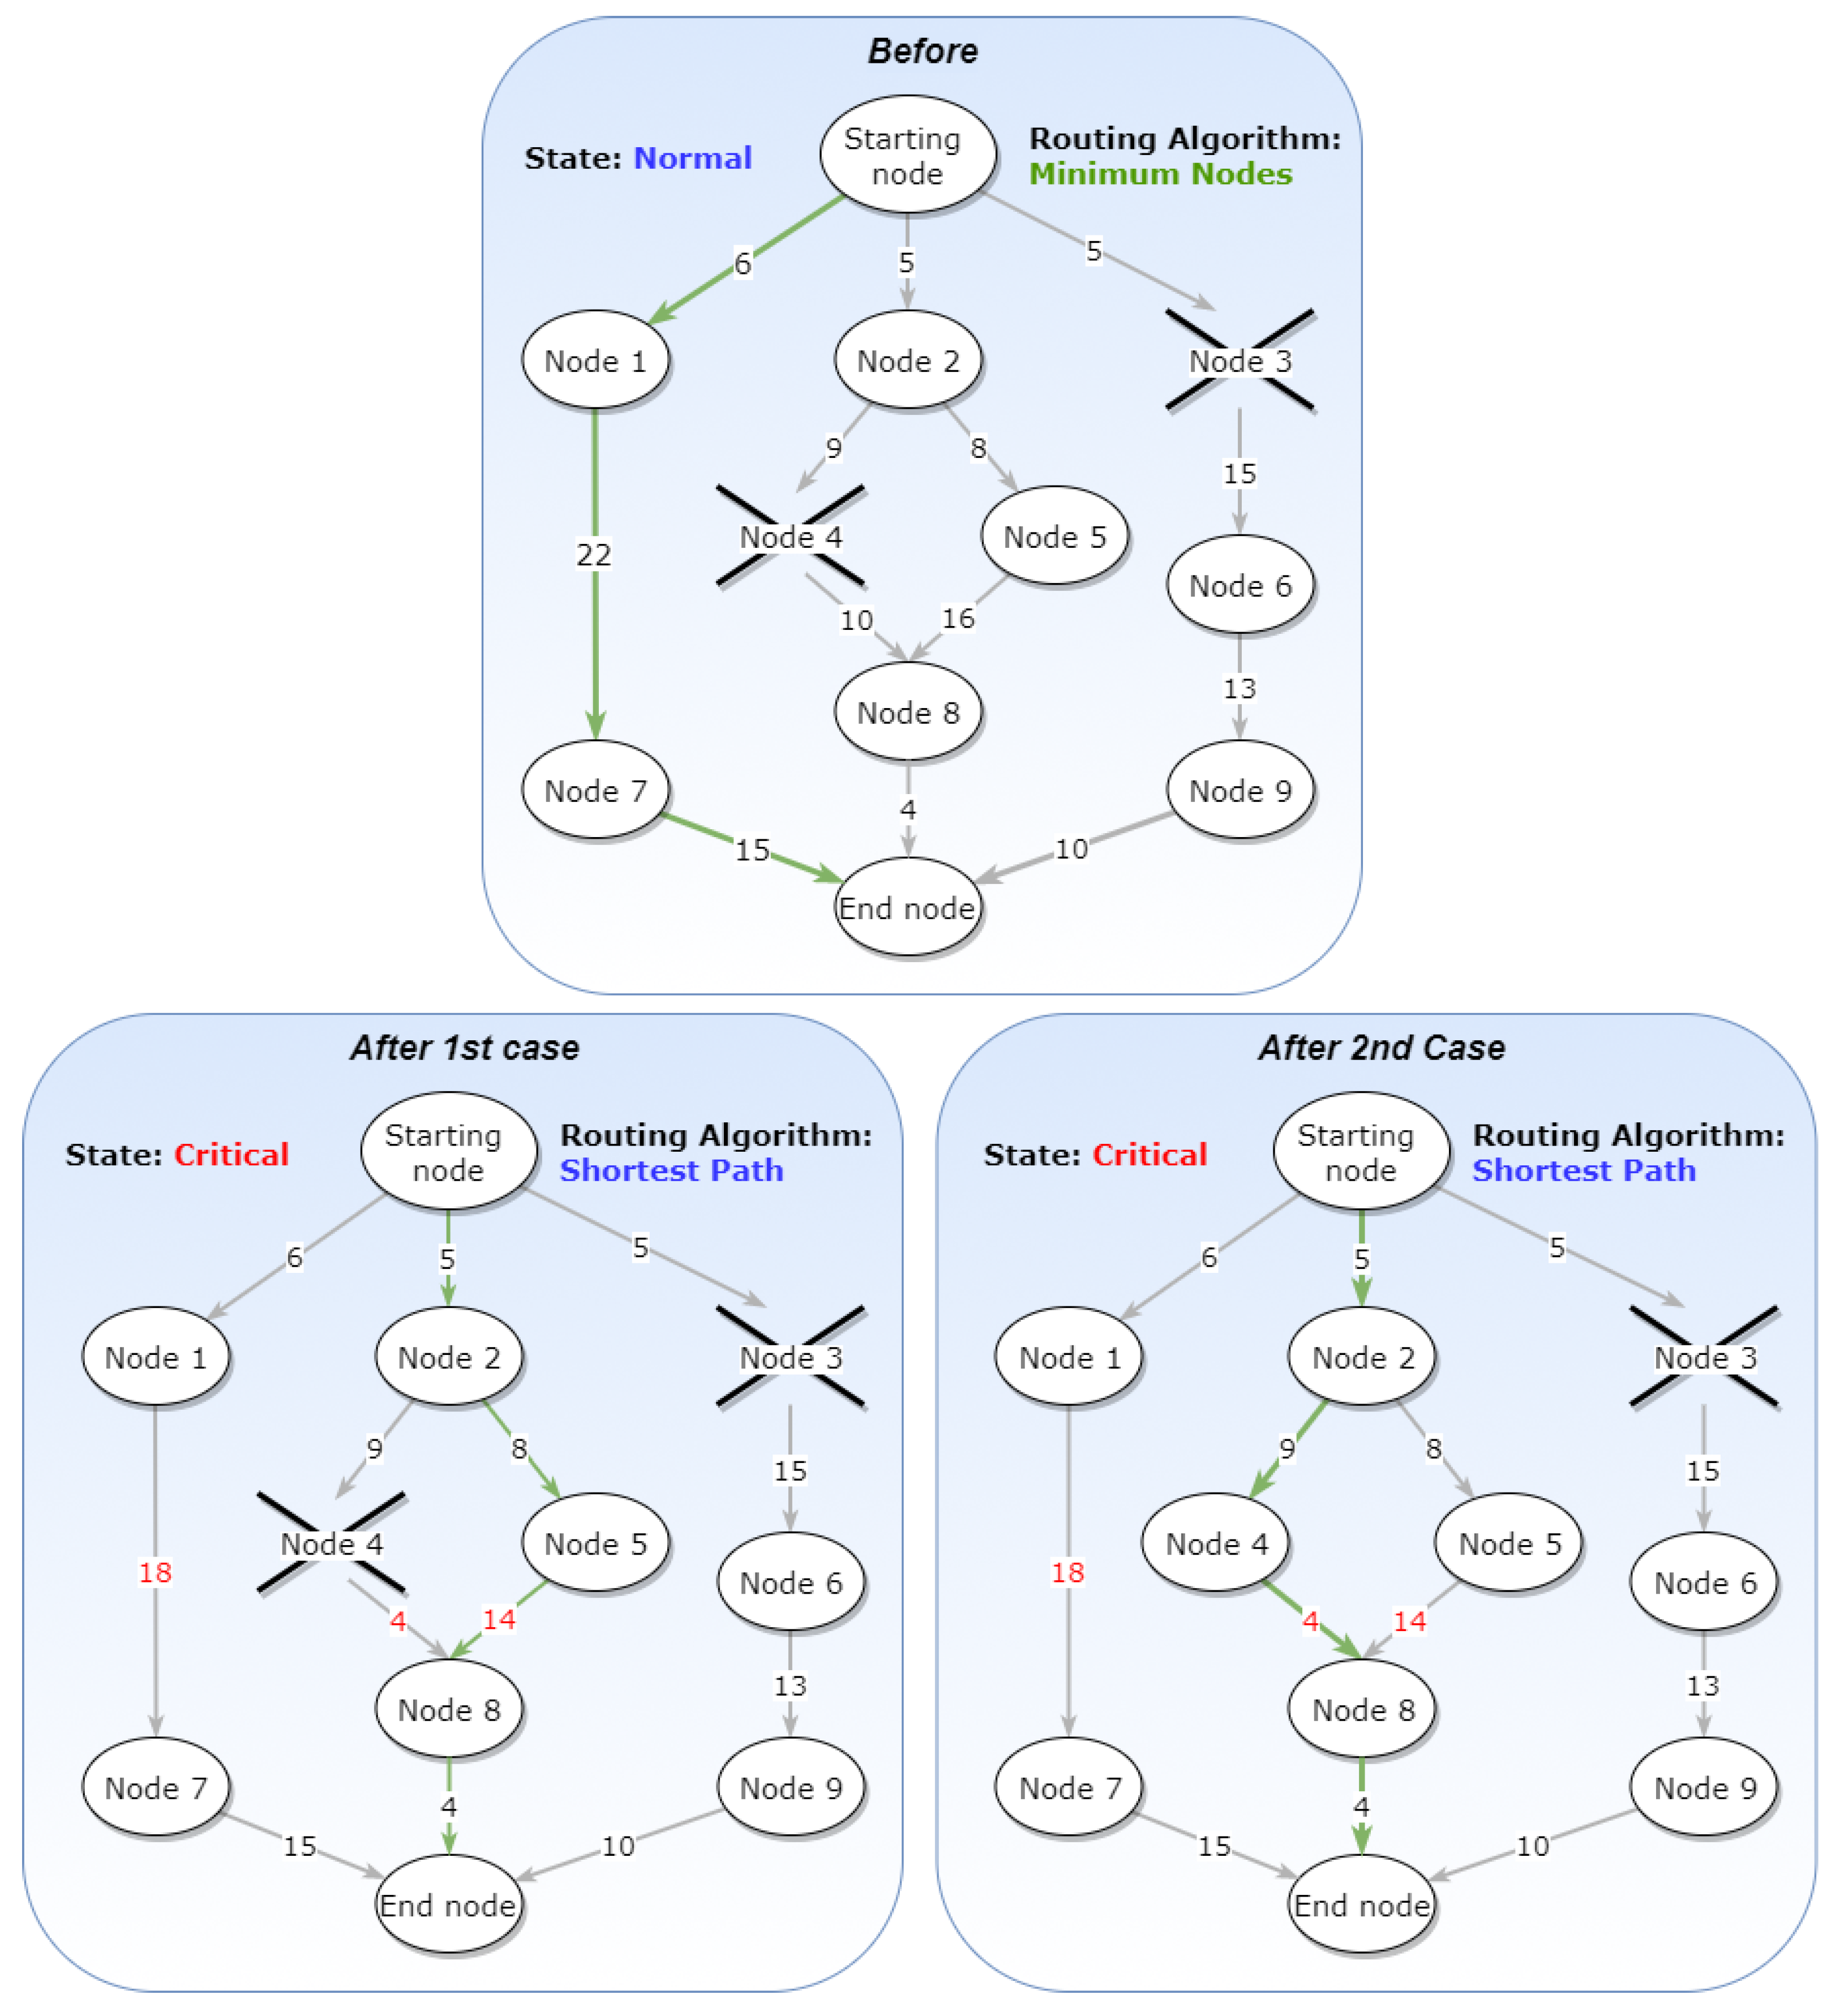
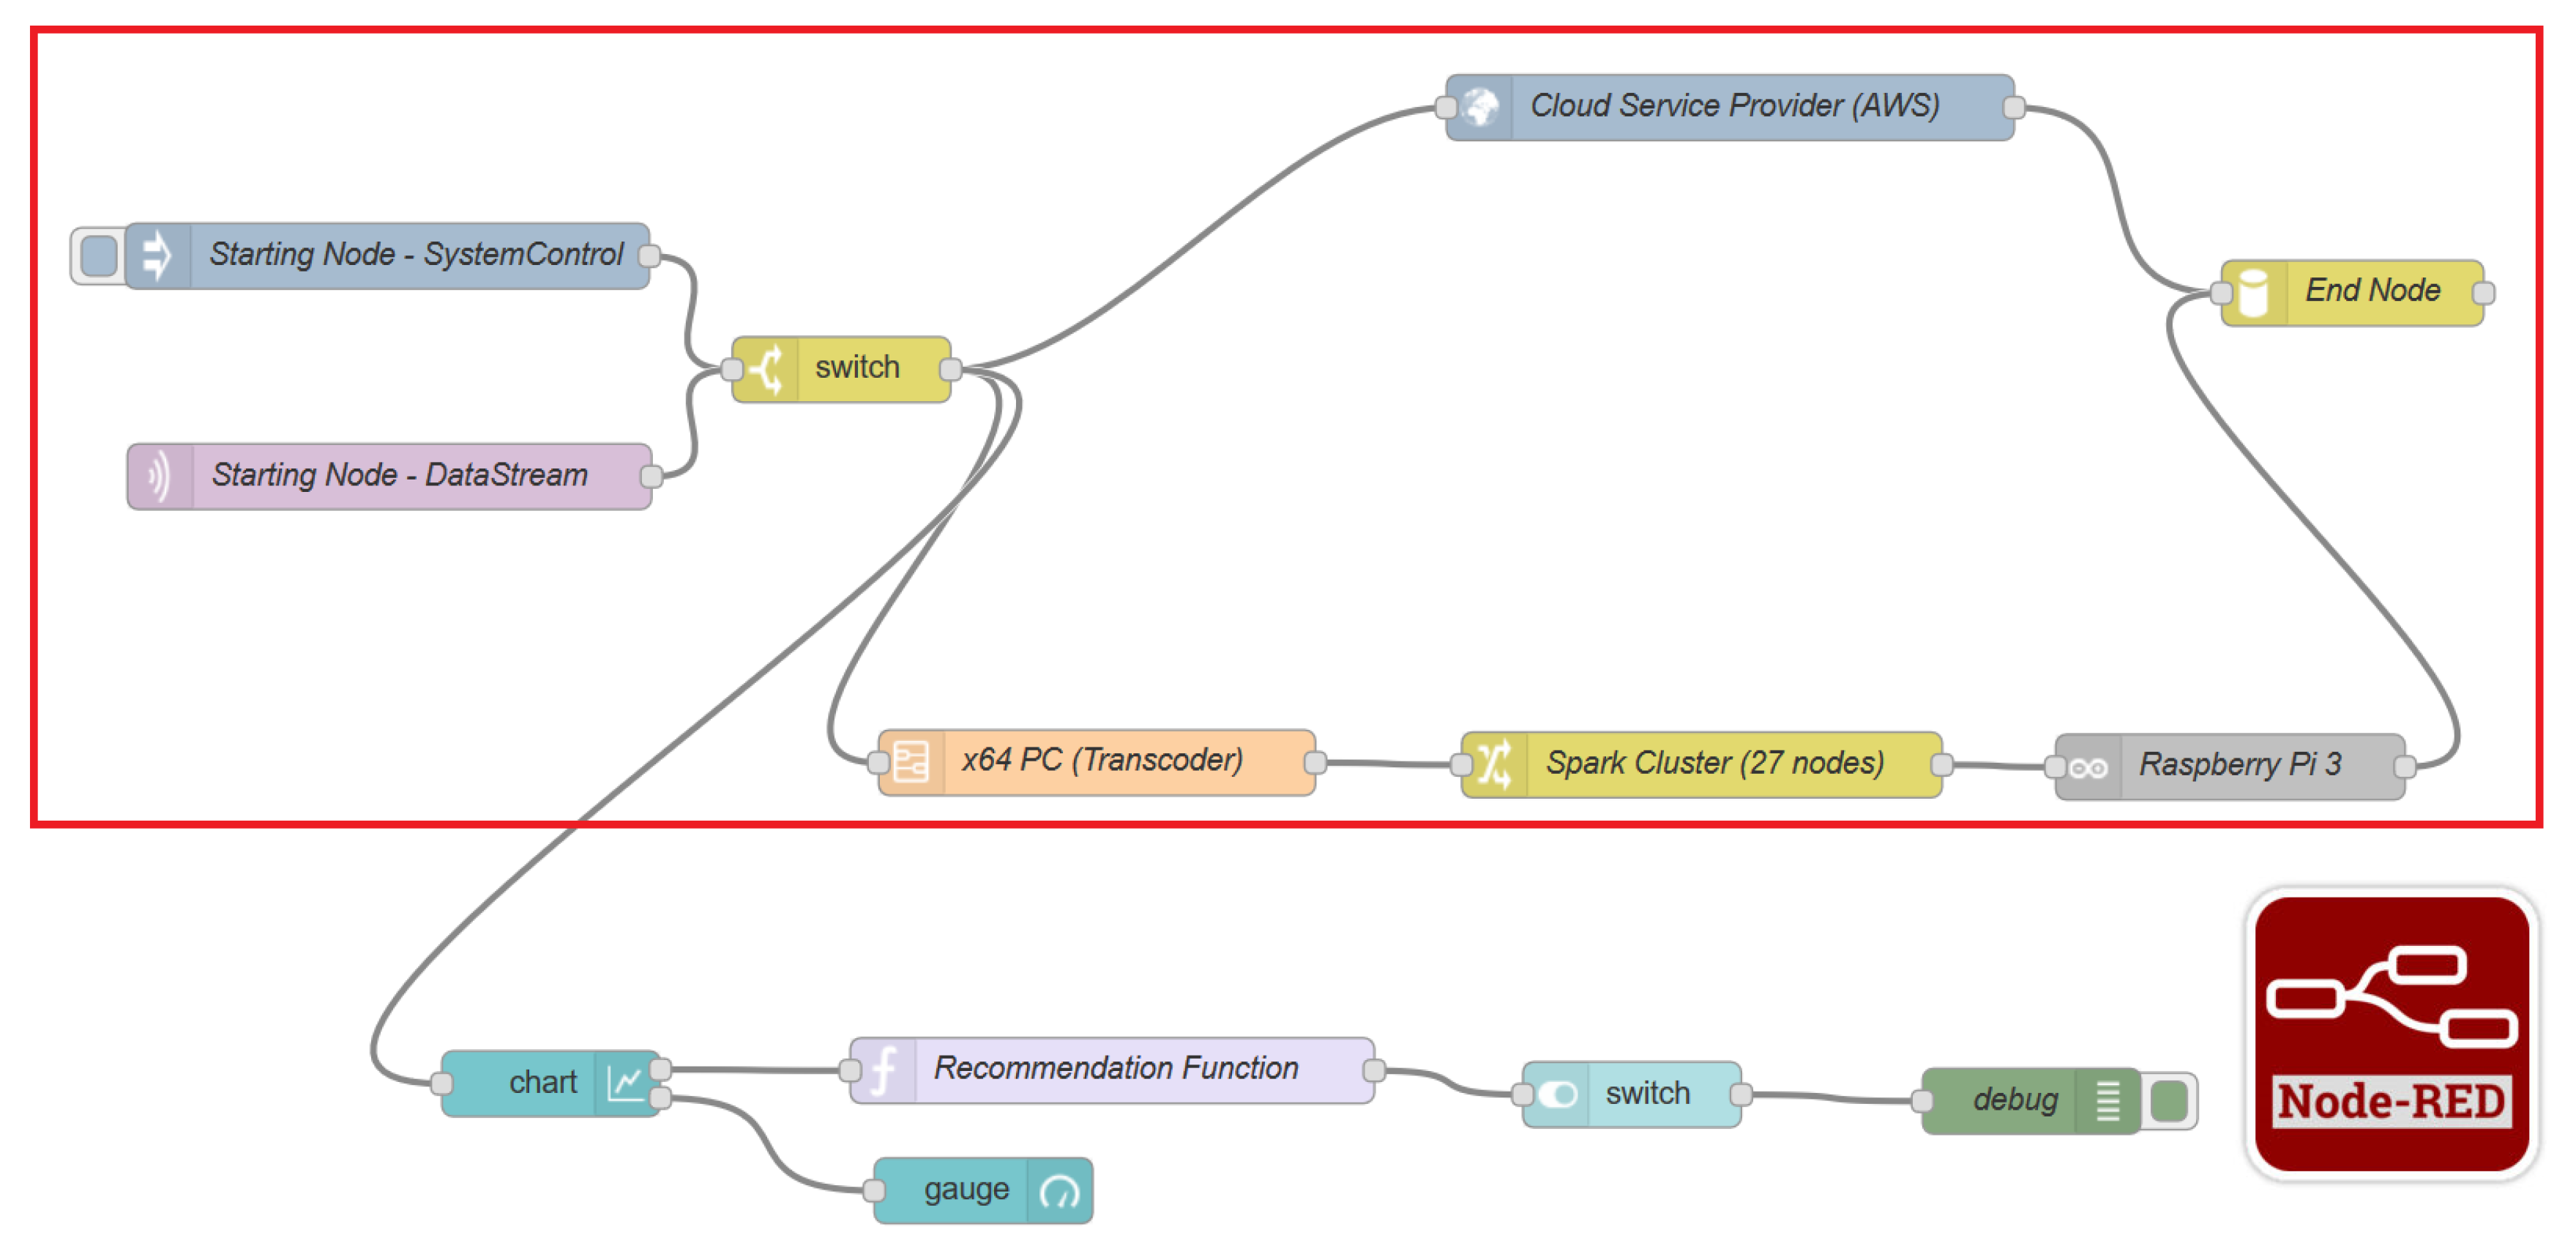
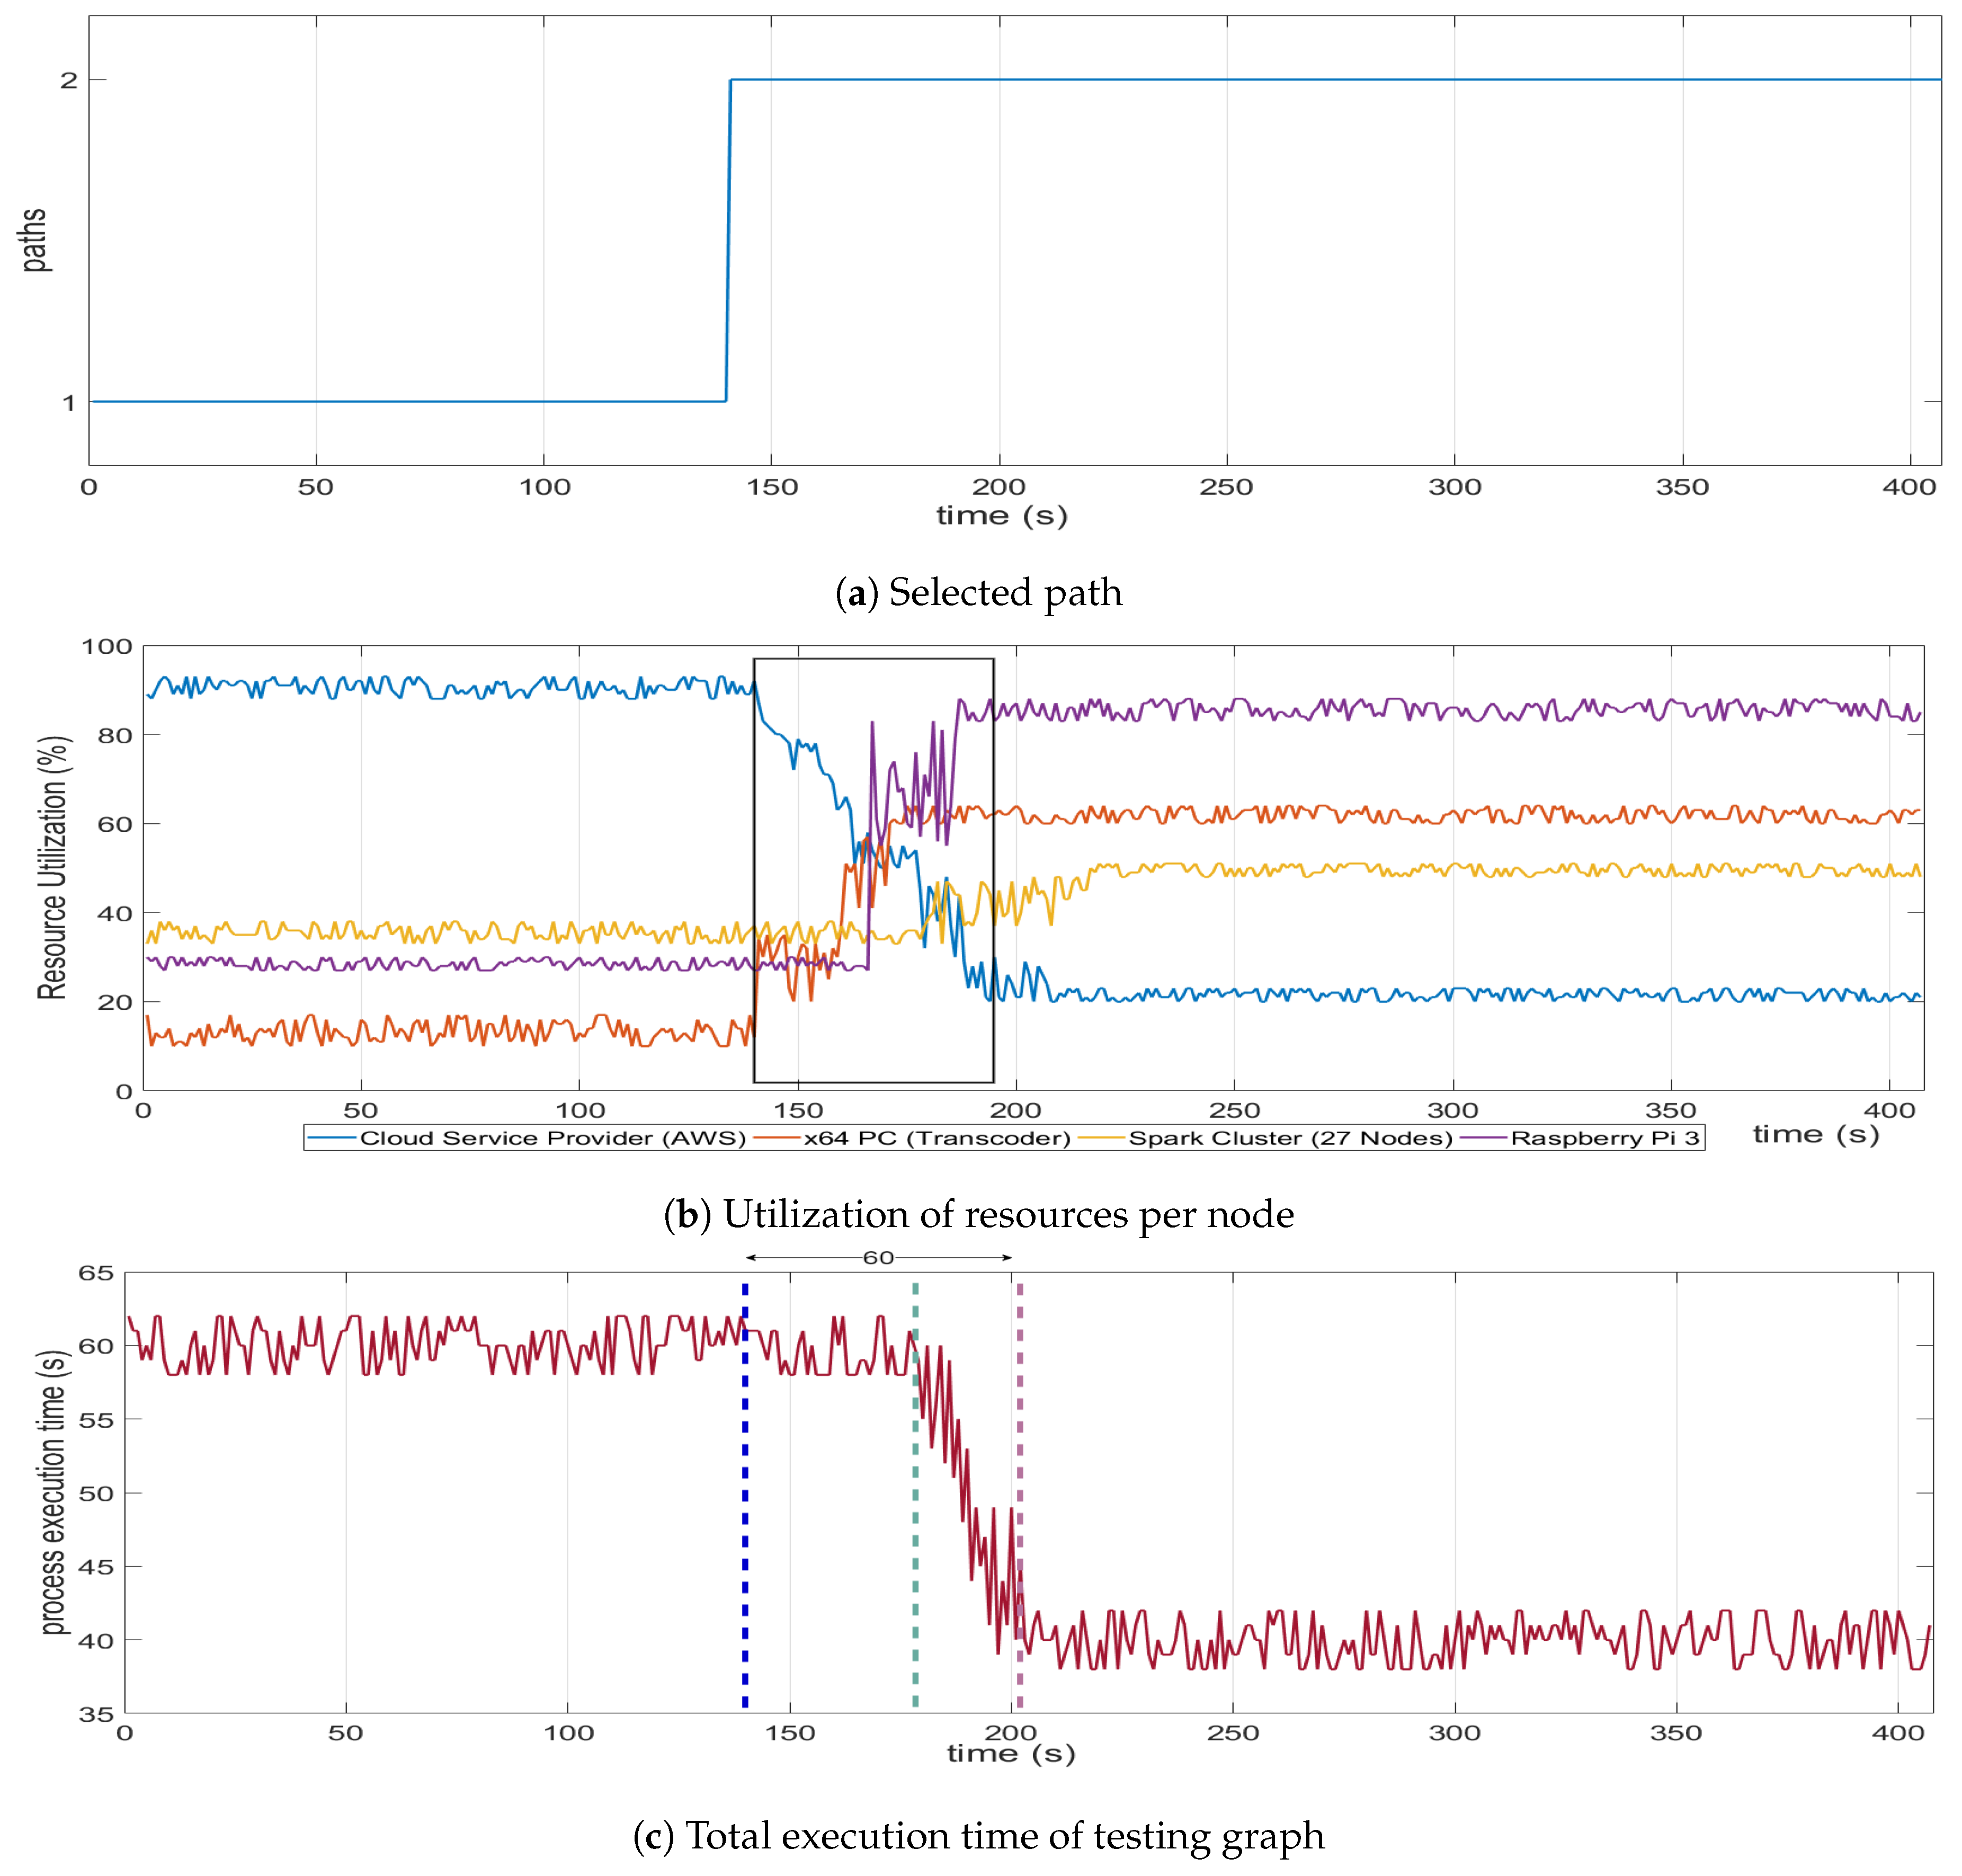
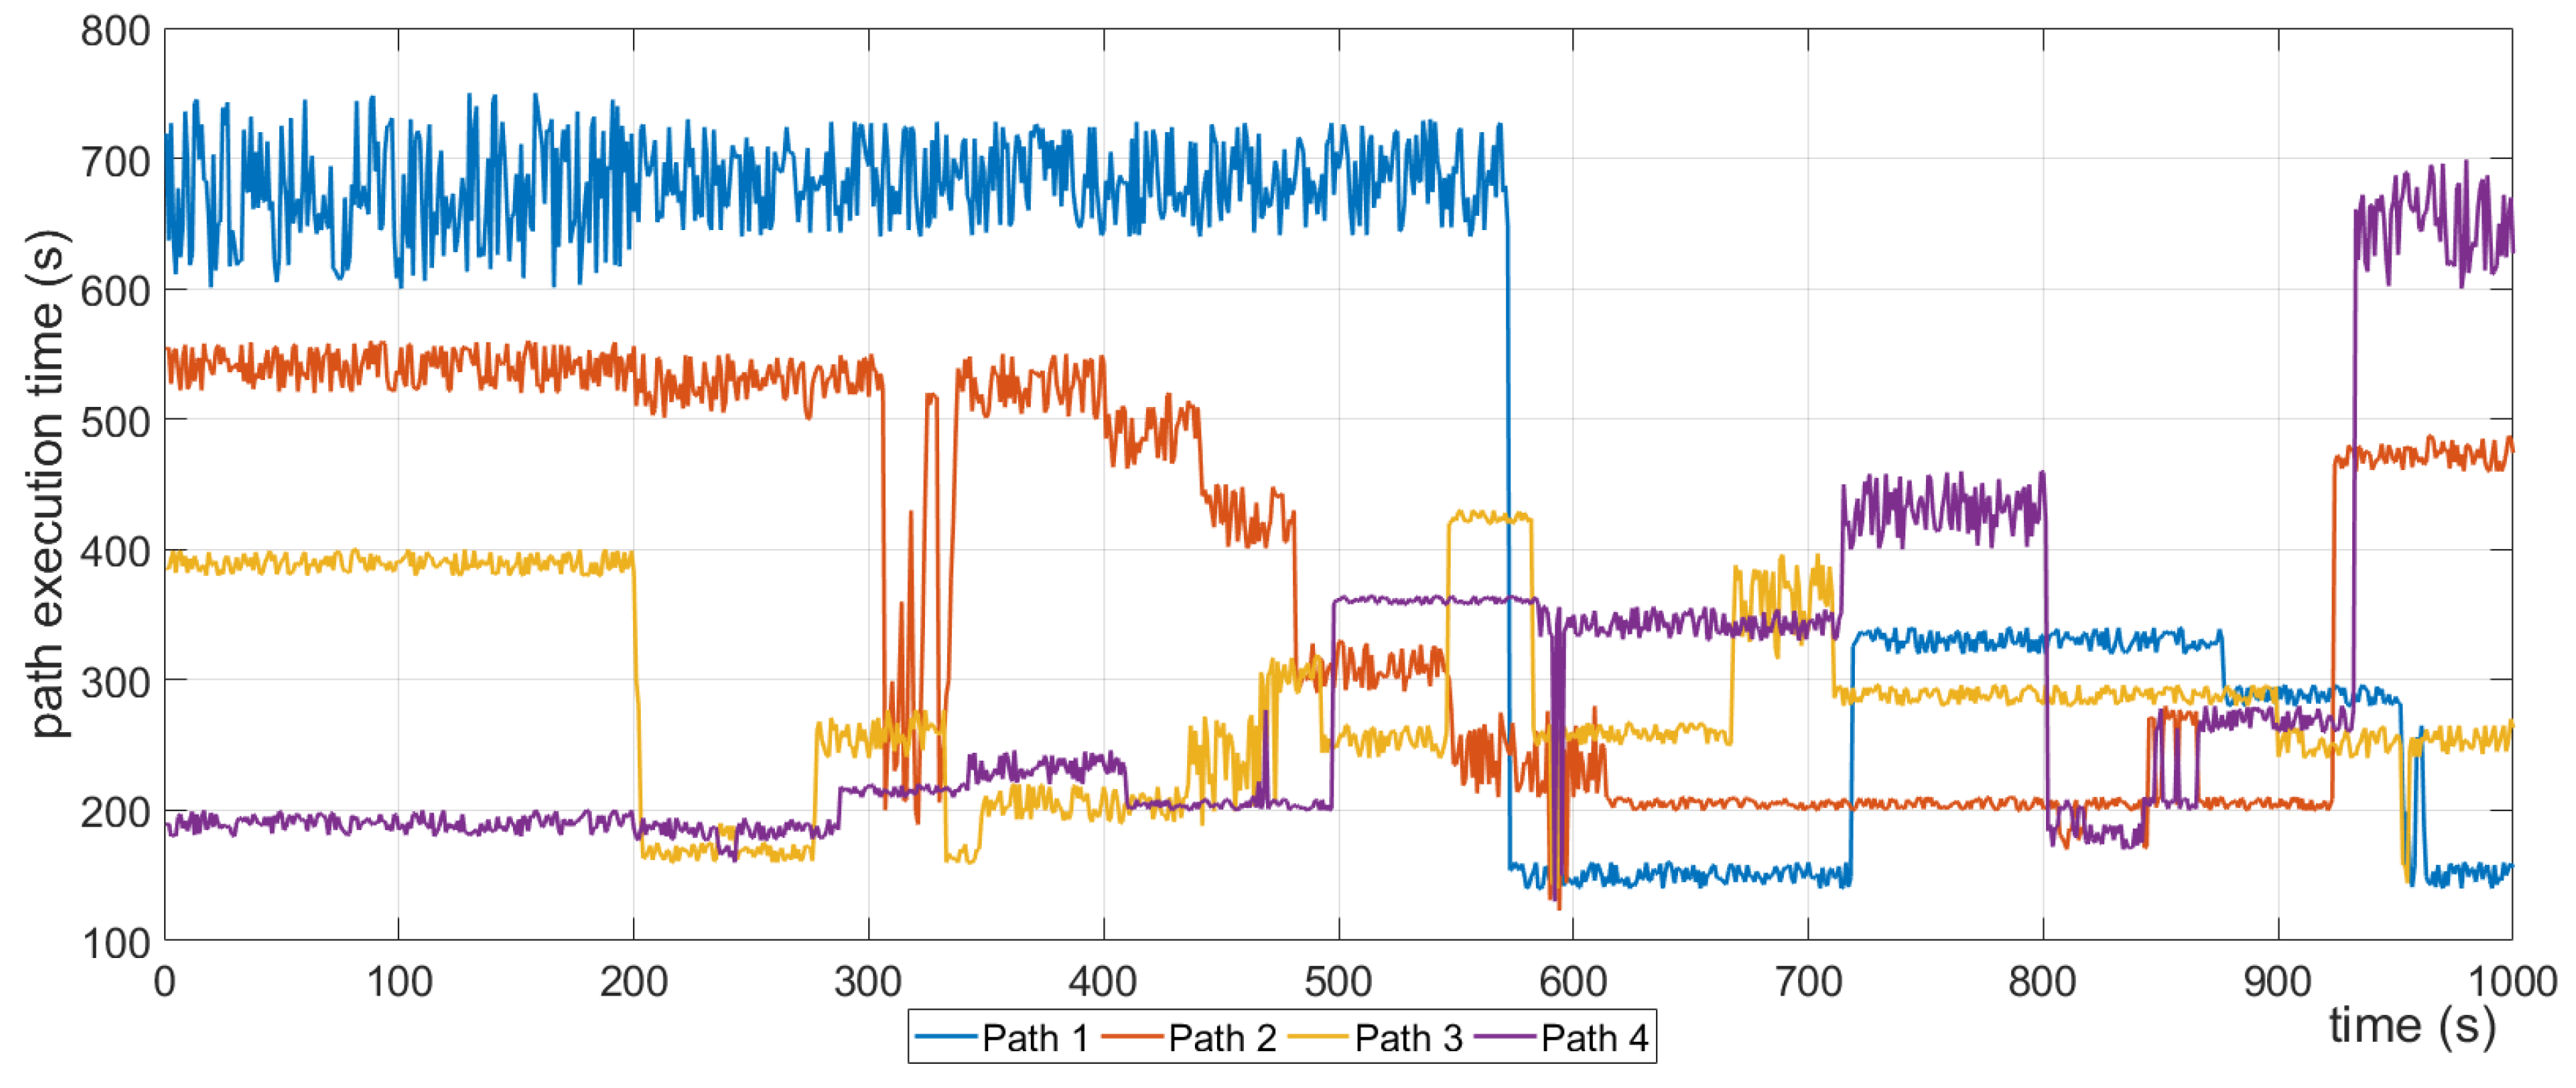
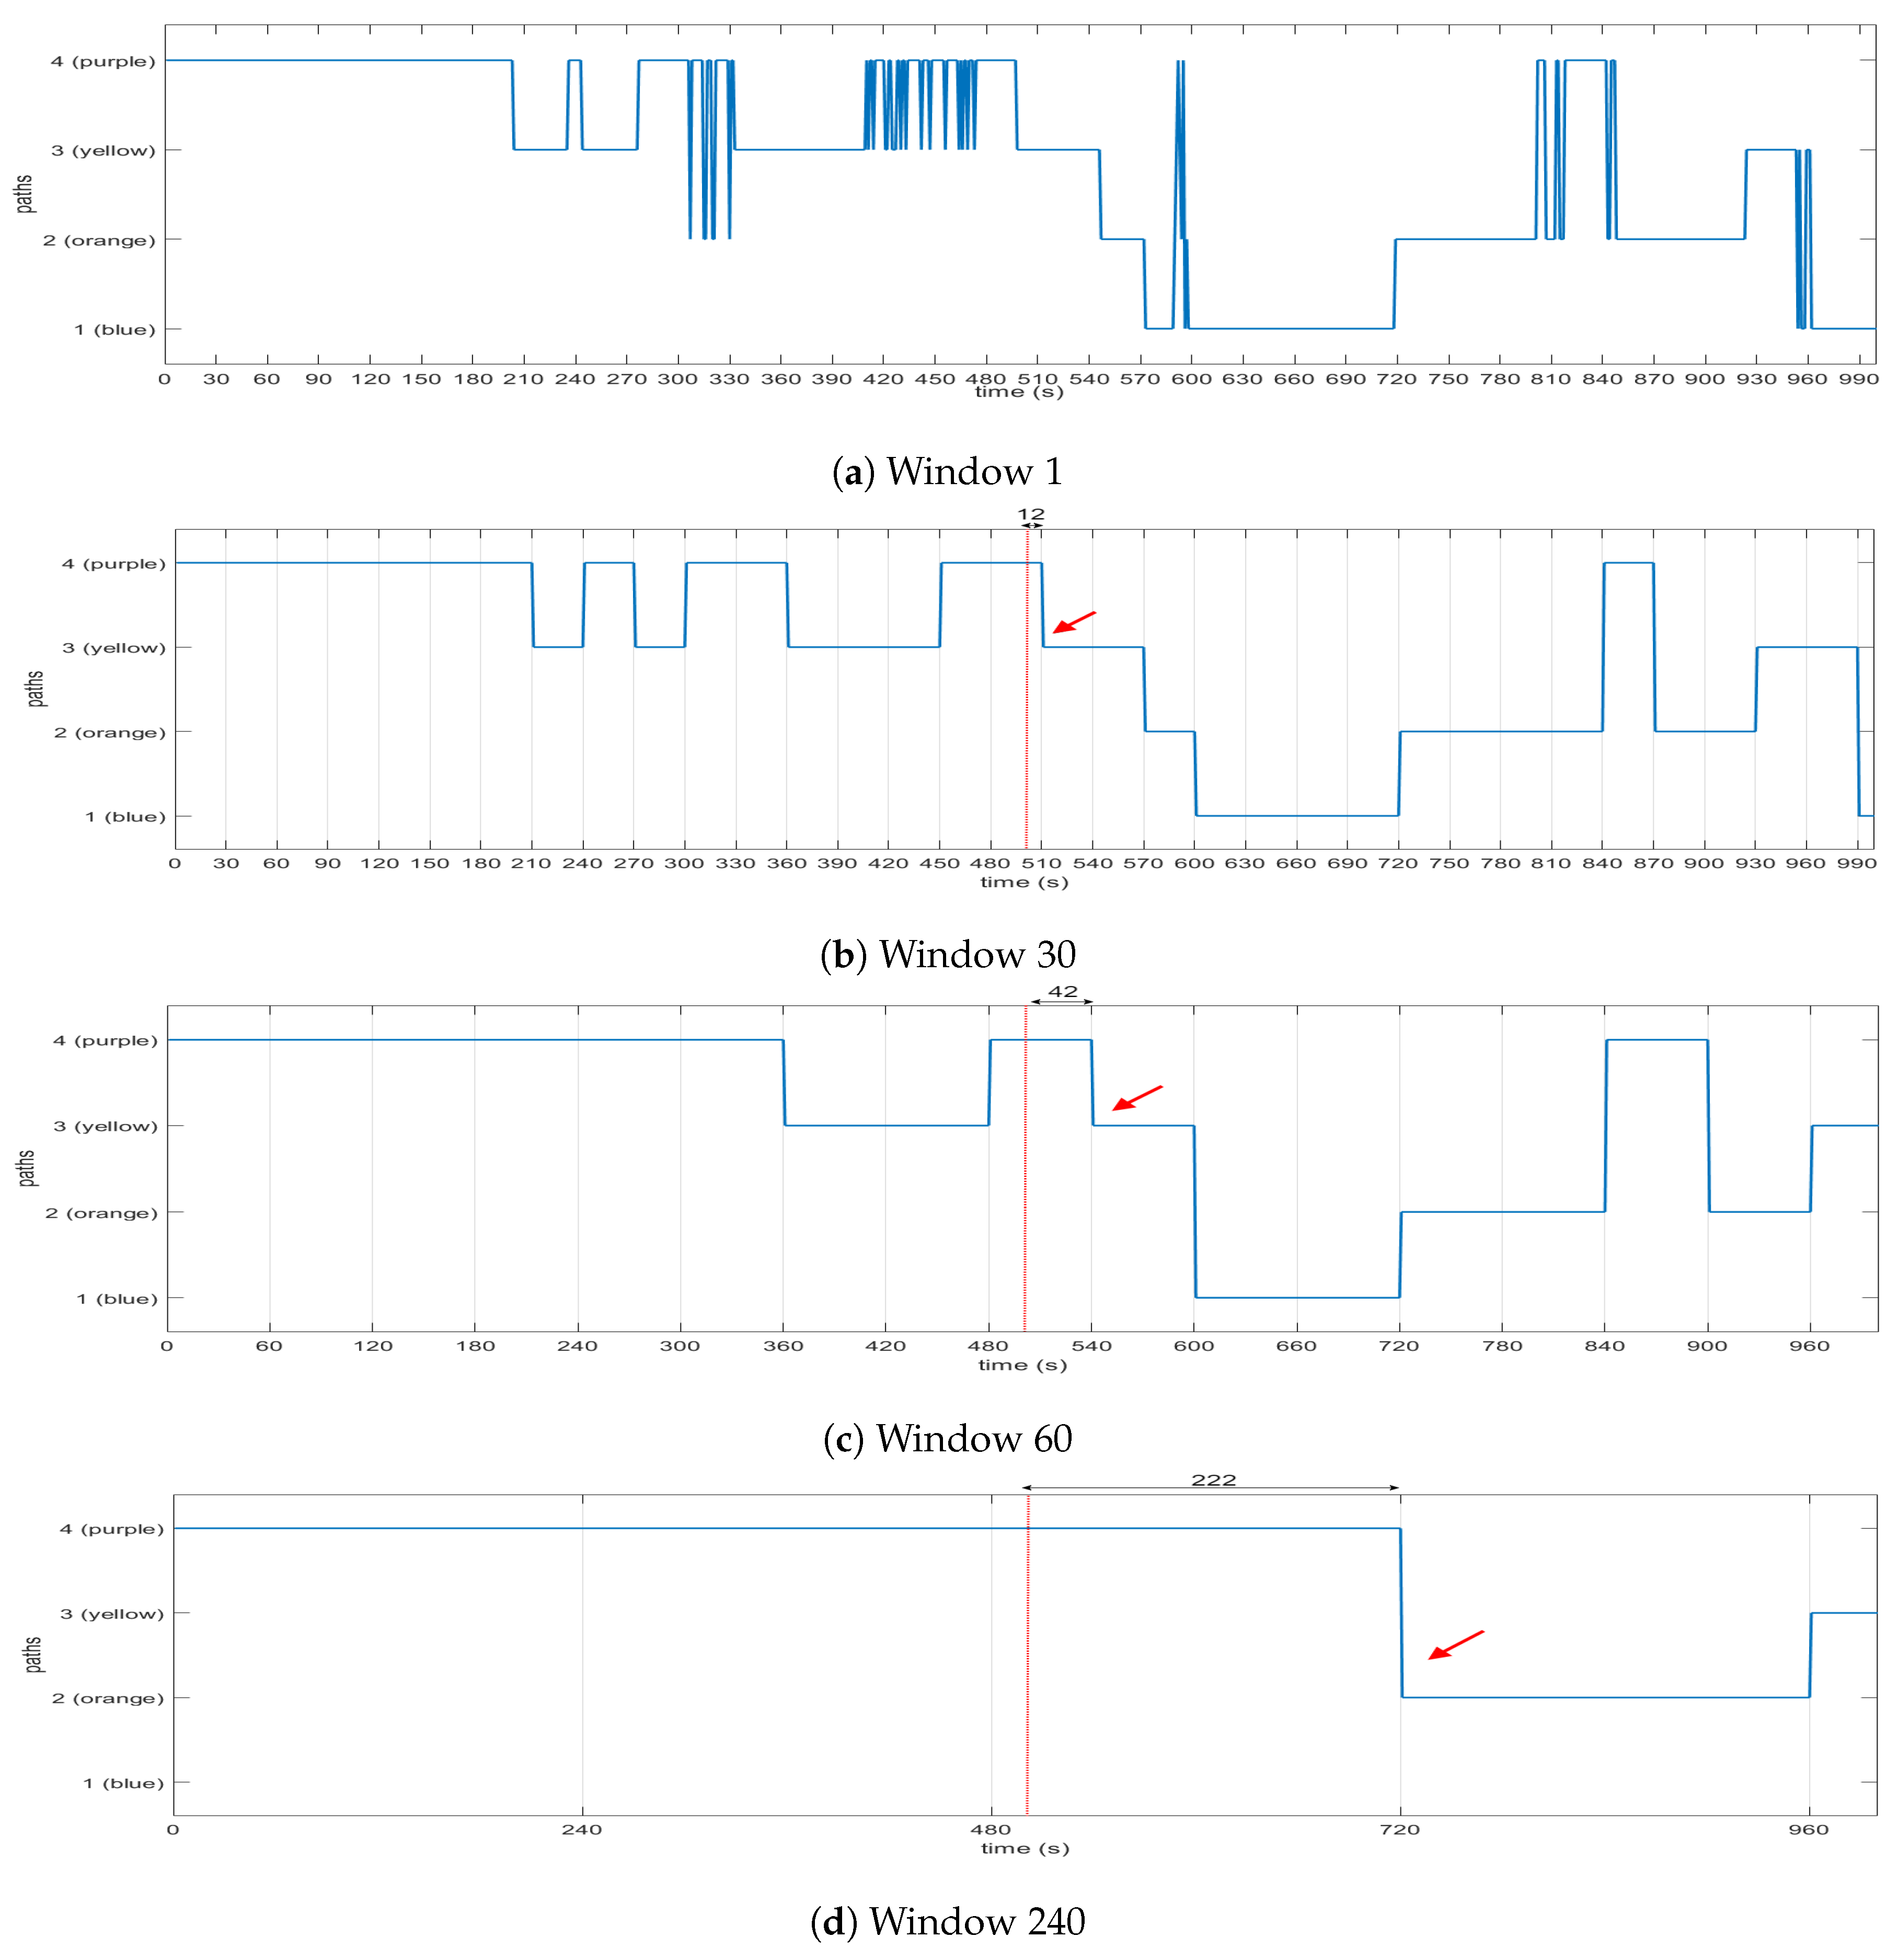
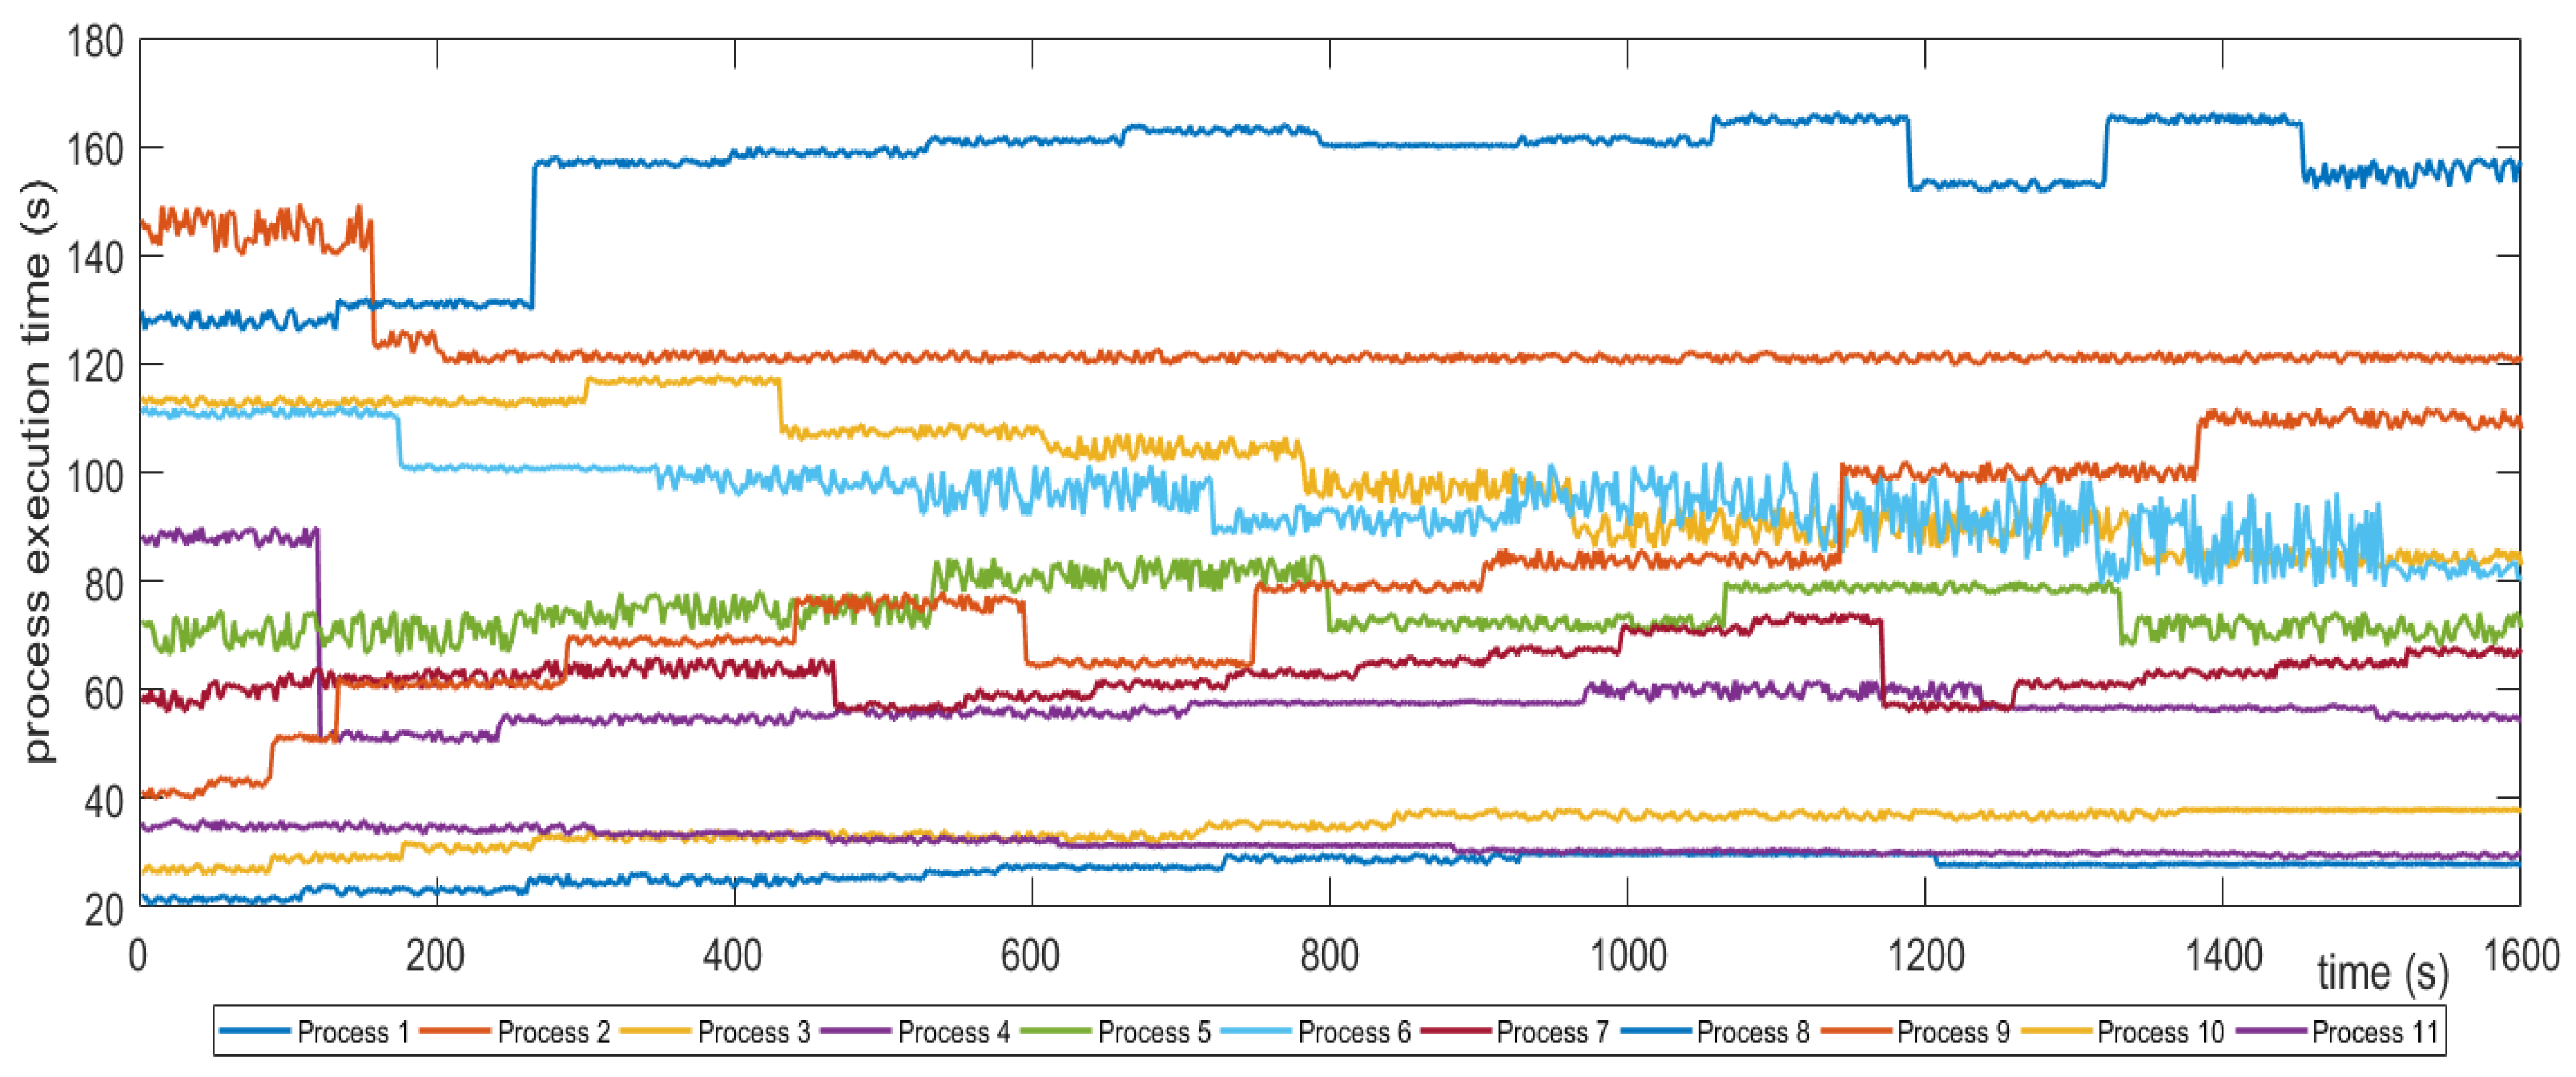
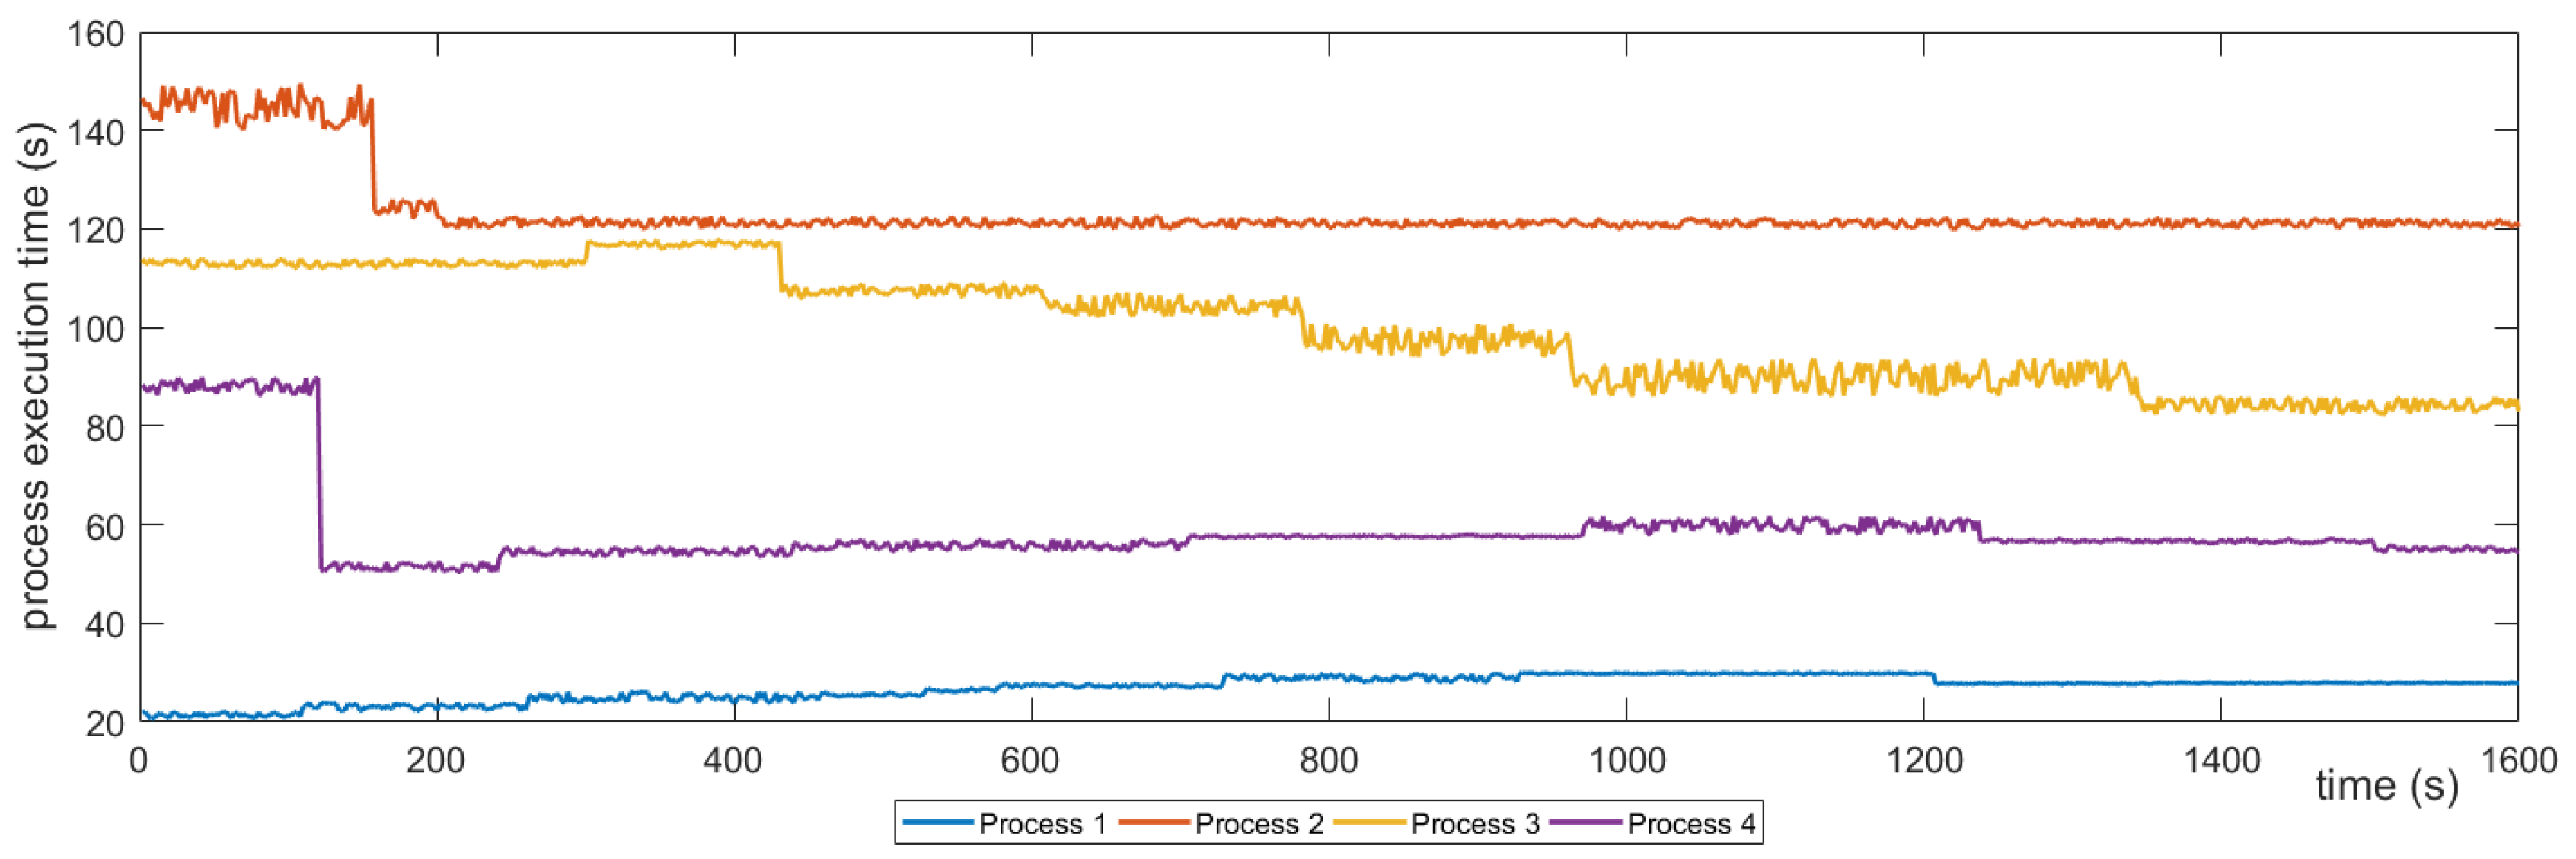
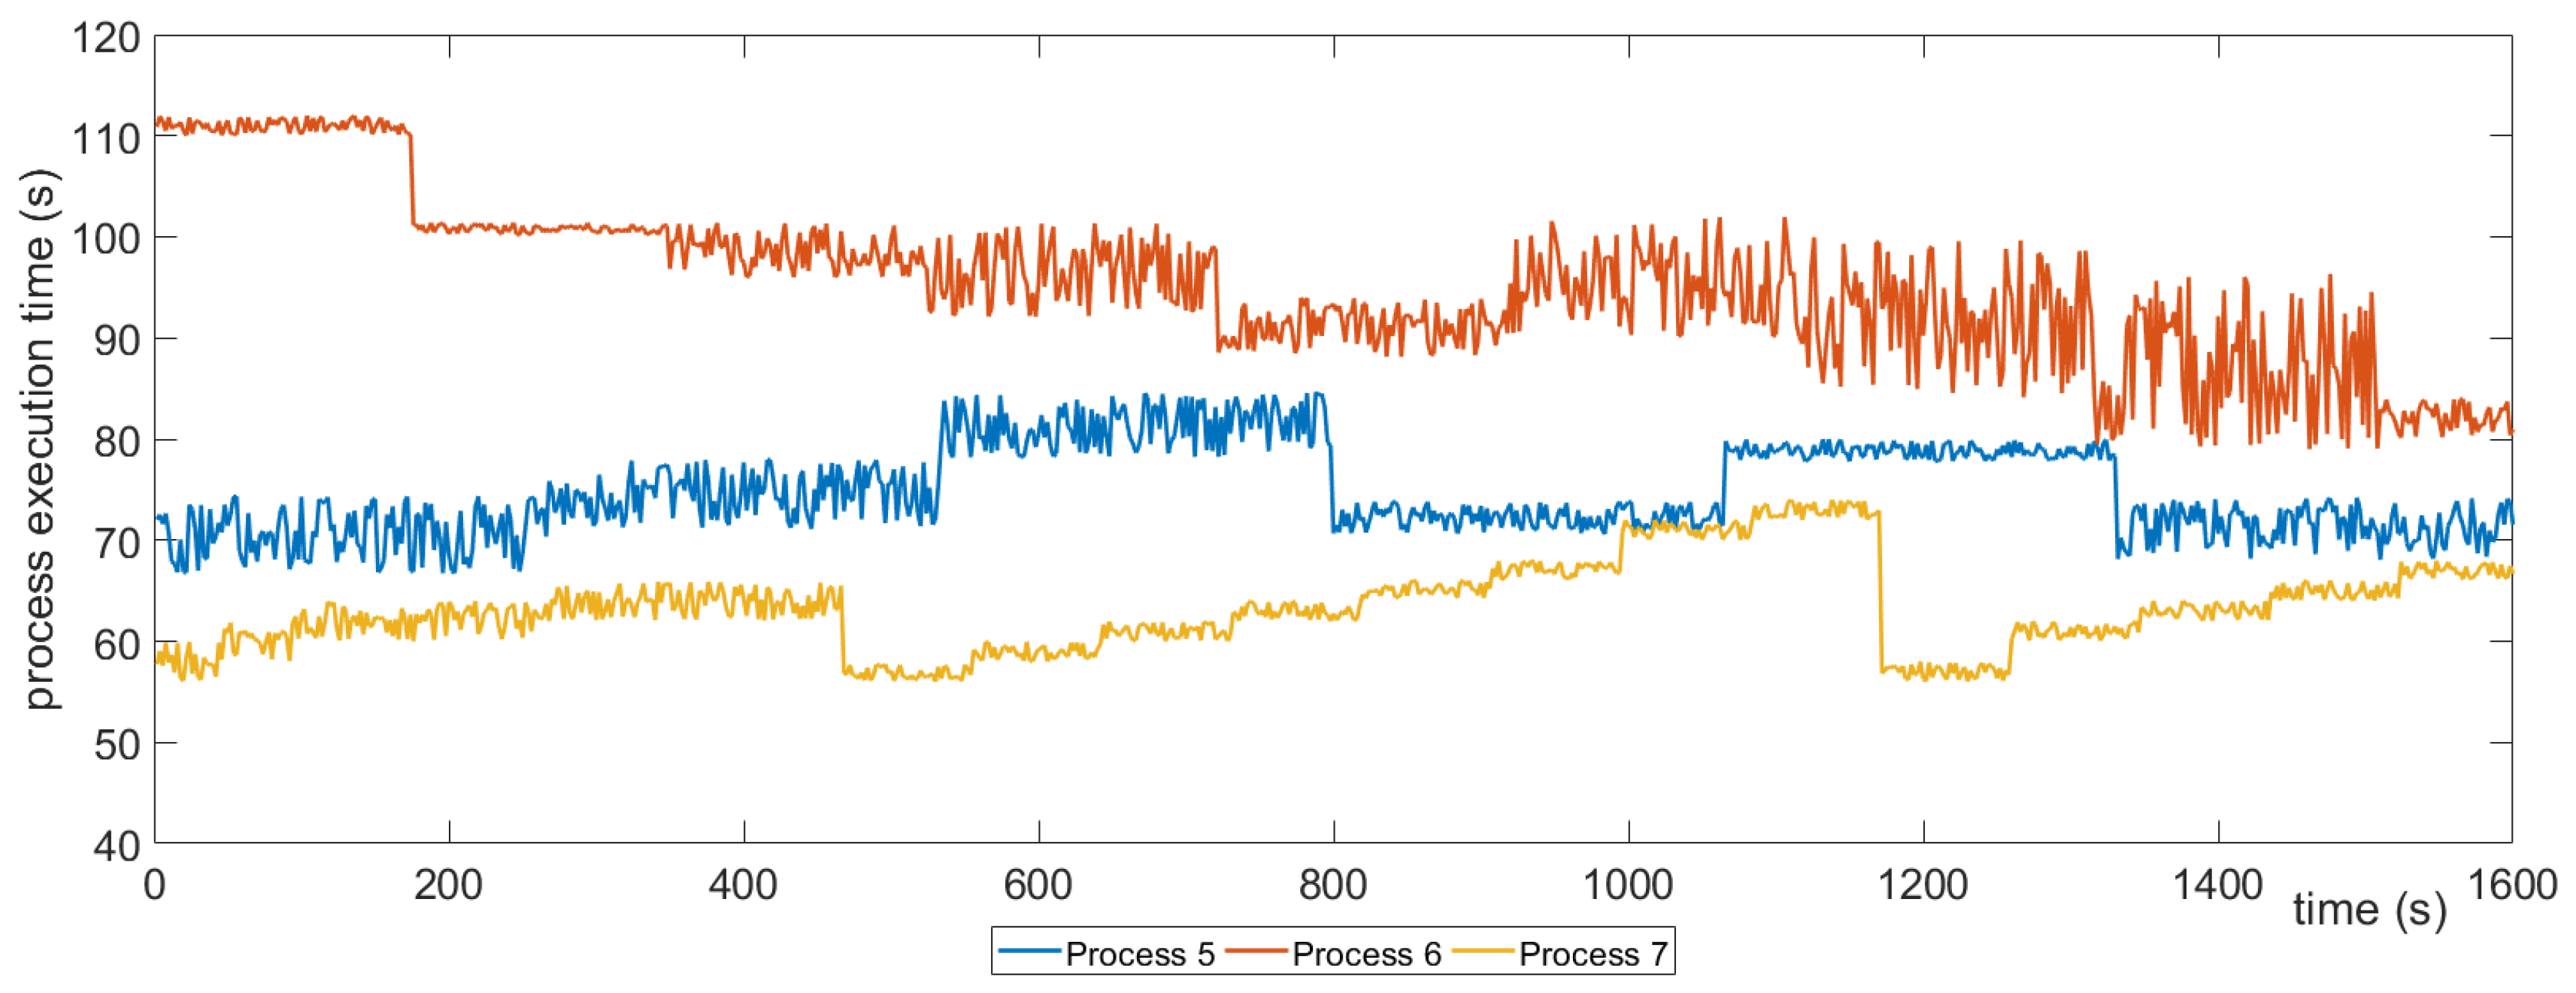
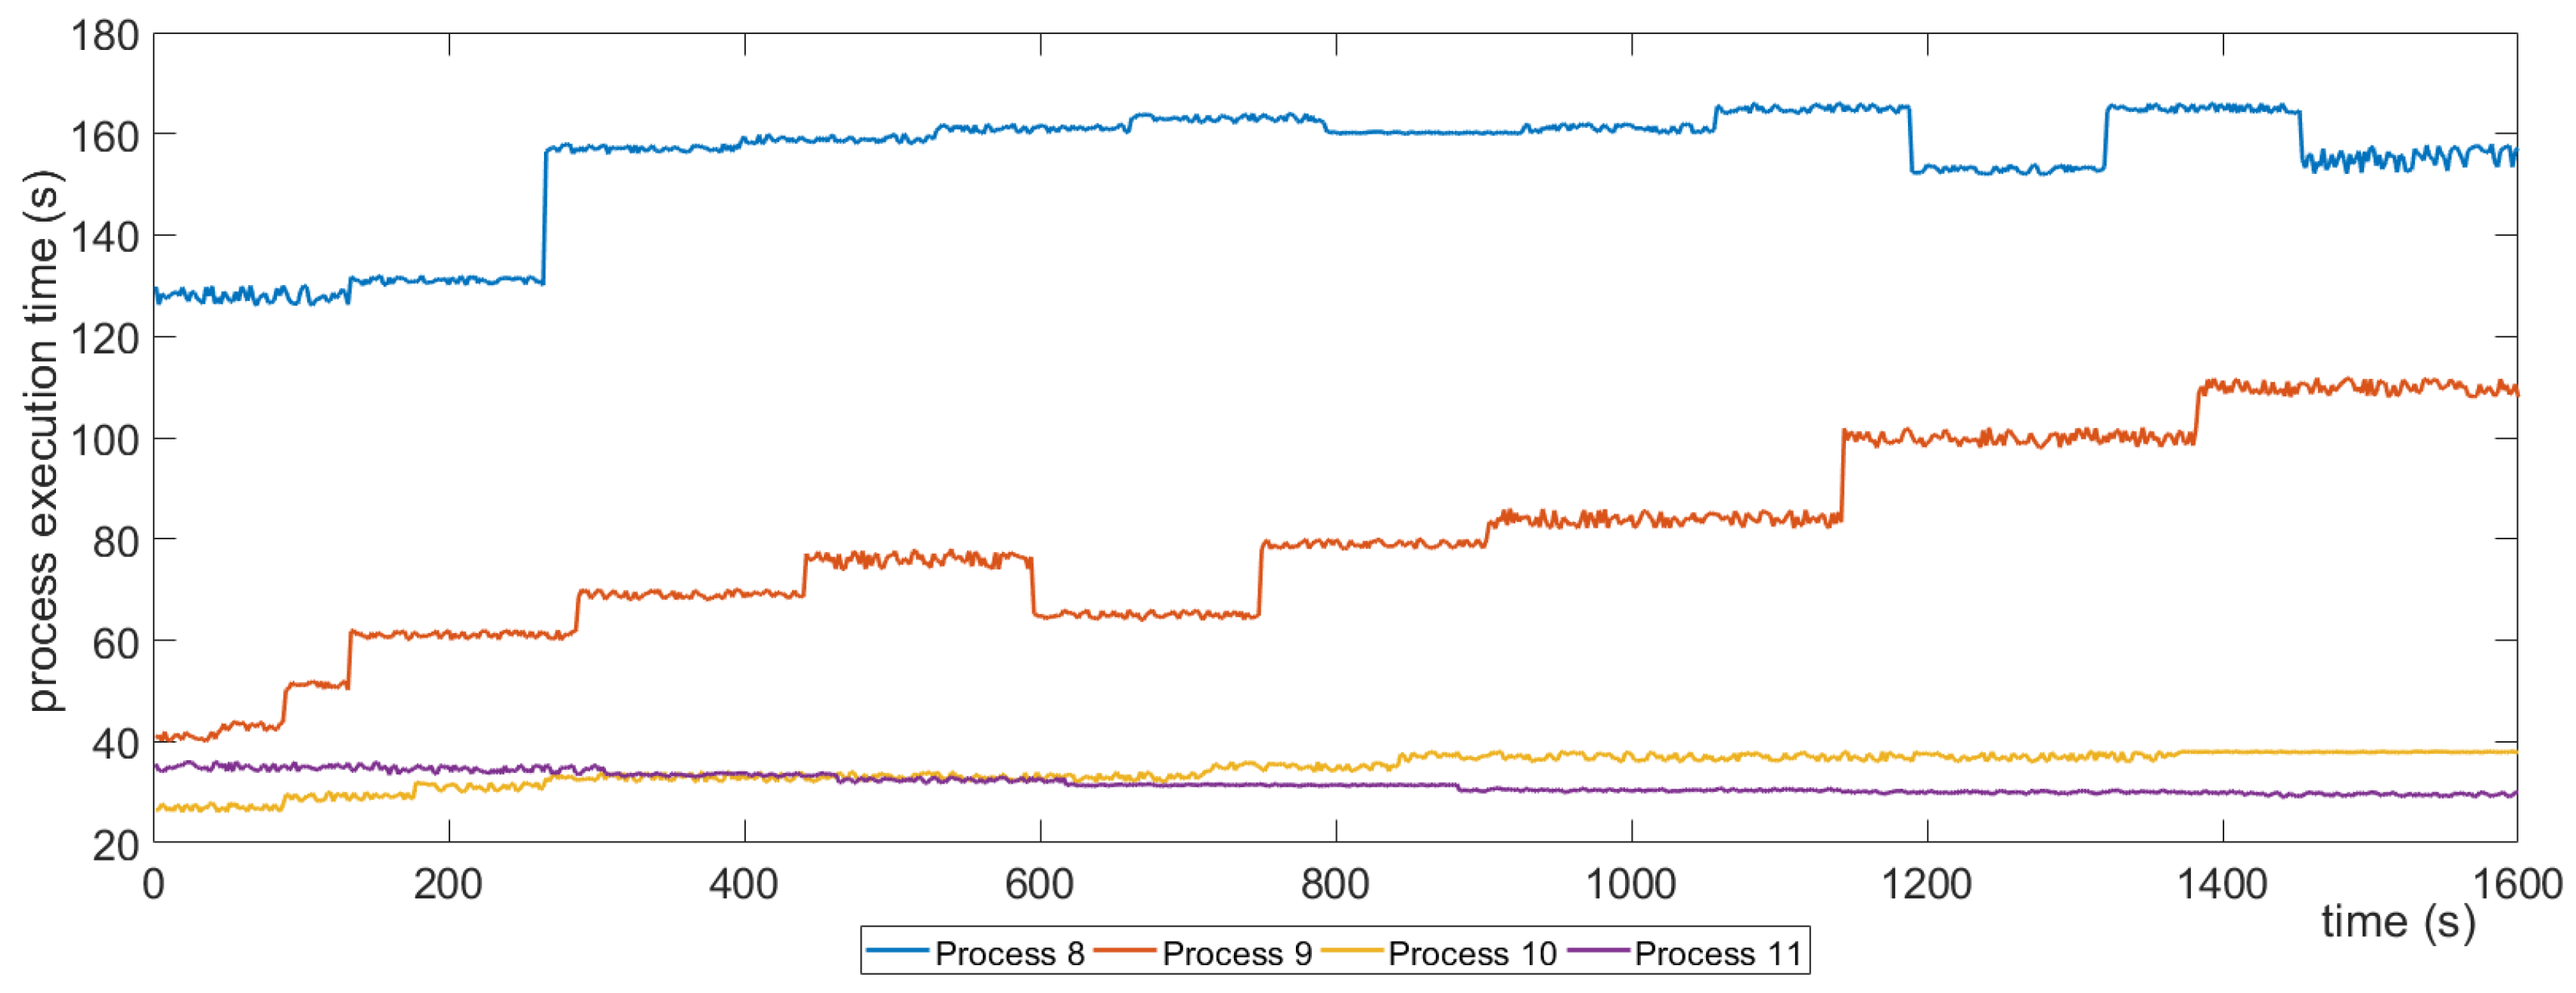
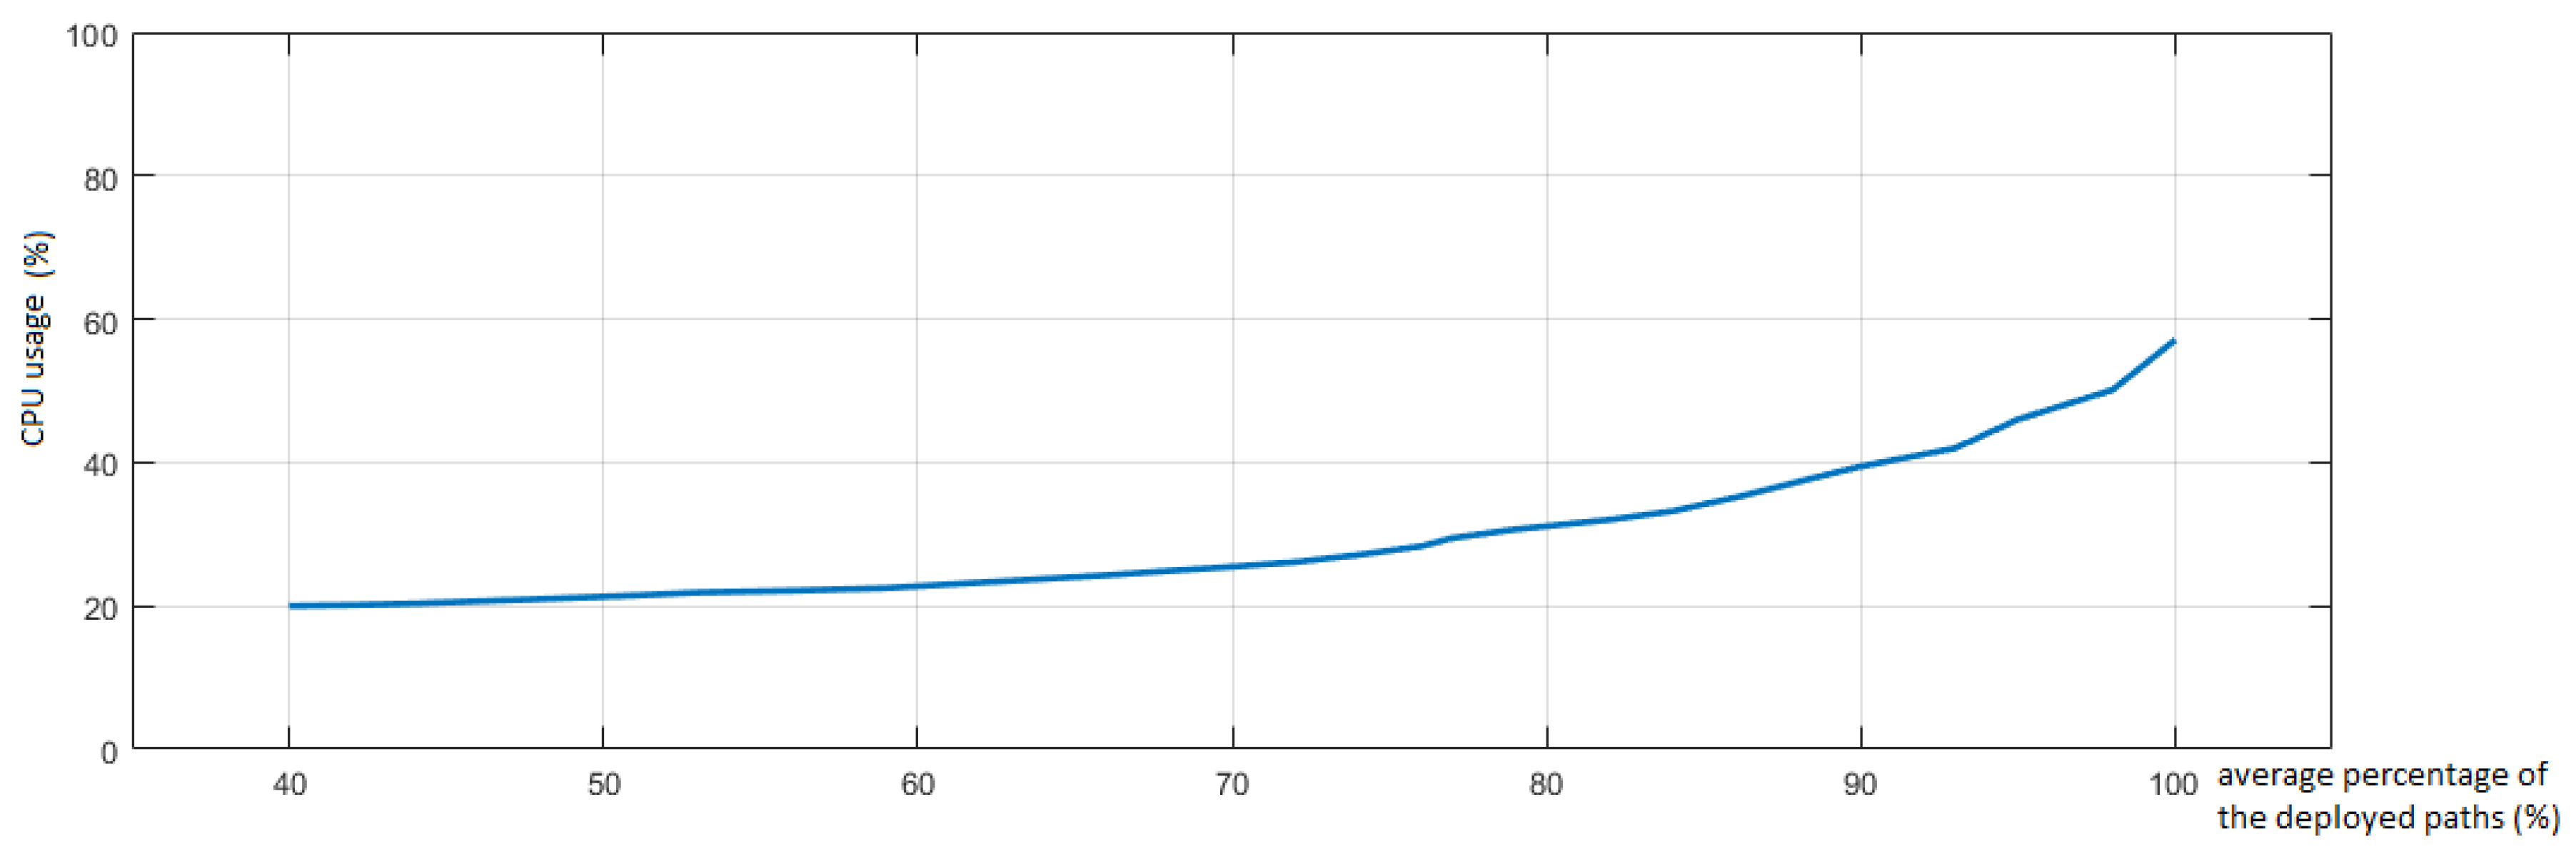