Article

A Multimodal Polygraph Framework with Optimized Machine Learning for Robust Deception Detection

1
Artificial Intelligence Research Center (AIRC), College of Engineering and Information Technology, Ajman University, Ajman P.O. Box 346, United Arab Emirates
2
College of Artificial Intelligence, Arab Academy for Science Technology and Maritime Transport, Alamein 51718, Egypt
3
School of Mathematical and Computer Sciences, Heriot Watt University, Dubai P.O. Box 501745, United Arab Emirates
*
Author to whom correspondence should be addressed.
Inventions 2025, 10(6), 96; https://doi.org/10.3390/inventions10060096
Submission received: 4 September 2025 / Revised: 7 October 2025 / Accepted: 21 October 2025 / Published: 29 October 2025

Abstract

Deception detection is considered a concern for all individuals in their everyday lives, as it greatly affects human interactions. While multiple automatic lie detection systems exist, their accuracy still needs to be improved. Additionally, the lack of adequate and realistic datasets hinders the development of reliable systems. This paper presents a new multimodal dataset with physiological data (heart rate, galvanic skin response, and body temperature), in addition to demographic data (age, weight, and height). The presented dataset was collected from 49 unique subjects. Moreover, this paper presents a polygraph-based lie detection system utilizing multimodal sensor fusion. Different machine learning algorithms are used and evaluated. Random Forest has achieved an accuracy of 97%, outperforming Logistic Regression (58%), Support Vector Machine (58% with perfect recall of 1.00), and k-Nearest Neighbor (83%). The model shows excellent precision and recall (0.97 each), making it effective for applications such as criminal investigations. With a computation time of 0.06 s, Random Forest has proven to be efficient for real-time use. Additionally, a robust k-fold cross-validation procedure was conducted, combined with Grid Search and Particle Swarm Optimization (PSO) for hyperparameter tuning, which substantially reduced the gap between training and validation accuracies from several percentage points to under 1%, underscoring the model’s enhanced generalization and reliability in real-world scenarios.

1. Introduction

Lie detection has attracted the attention of many researchers in recent years as it has been utilized in different areas including criminal investigation [1,2,3], border control [4,5], employment and workplace [6,7,8], therapeutic assessment, and forensic psychology [9]. However, it could be subject to human bias, inconsistencies, and limited generalizability. Recent advancements in Artificial Intelligence (AI) have opened new paths for improving deception detection systems by integrating multimodal sensor fusion [10,11,12] and data-driven approaches [13]. Related pipelines have also improved adverse-condition classification in optical links, where ML mitigates fog/rain impairments and turbulence [14,15].
A polygraph device evaluates a person’s truthfulness by measuring and analyzing their physiological responses, including blood pressure, heart rate, breathing, and skin conductivity, as they are affected by external stimuli [16,17]. Deception can be detected by analysing some alterations in physiological responses. The polygraph as a concept and early prototype was invented by the policeman and physiologist John A. Larson in 1921, and was implemented in the legal system later in 1923 [18].
Many factors affect polygraph accuracy, such as question test type, examiner’s expertise, and different physiological responses of the examinees [19,20], which may cause inaccurate results.
Although there are many limitations to polygraph tests, it is the main tool for assessing truthfulness and deception. Recent research aims to improve the accuracy and reliability of polygraph tests by utilizing machine learning and artificial intelligence algorithms that analyze polygraph data and extract important features [21,22].
Different physiological cues are utilized to perform lie detection. Certain stimuli or events cause measurable alterations in a person’s body functions, known as physiological reactions. Some of the physiological factors simulated and affected are heart rate, blood activity, blood pressure, body temperature, sweating, etc. Polygraph devices work by analyzing changes in psychological alterations in response to certain stimuli. These physiological responses are widely used to detect emotions [23,24], measure pain levels [25], and detect fatigue [26,27]. However, developing a reliable lie detector based on the analysis of physiological data is still under development [28,29].
Early discussions of lie-detection technologies flagged ethical and legal boundaries between science and law, reinforcing the need for evidence-based and transparent methods [30]. These perspectives emphasise the need for robust, evidence-based, and ethically sound approaches when designing modern deception detection systems.
Artificial intelligence can significantly improve lie detection by integrating multiple physiological and behavioral modalities, improving accuracy over traditional polygraph tests. AI can detect subtle involuntary physiological changes associated with deception. Machine learning models can process and correlate multimodal signals in real-time [31], identifying complex patterns that might not be apparent to human examiners. Supervised learning models, including Random Forest (RF), Support Vector Machines (SVM), and Logistic Regression (LR), can be trained on labeled datasets to classify truthful and deceptive responses with greater precision. Finally, deep learning, Convolutional Neural Networks (CNNs), and Long-Short Term Memory (LSTM) networks have opened the door for developing a more robust and trustworthy real-time deception detection test [32,33]. Analogous pattern-recognition problems—e.g., code recognition under weather-induced distortions—have shown gains with supervised ML [34].
In this research, a portable real-time lie detection device is proposed using physiological cues in order to enhance the precision and reliability of lie detection. Utilizing various AI models, analysis of the physiological signals will not be dependent on the examiner’s interpretation. In this research, a publicly released dataset of physiological responses (heart rate, galvanic skin response, body temperature) of 49 subjects was collected. Furthermore, various Machine Learning models (ML) were implemented and tested in order to perform multi-modal sensor fusion to achieve lie detection. The proposed lie detection system measures heart rate variability, Galvanic Skin Response (GSR), and body temperature [35,36]. In order to maximize efficiency, many hyperparameter optimization techniques were implemented, such as Grid Search, Bayesian Optimization, and Particle Swarm Optimization (PSO). These methods refined model parameters to enhance predictive accuracy and reduce false positives. Furthermore, ensemble learning techniques were applied, which combine multiple classifiers to improve robustness and generalizability across diverse subjects and testing conditions. Furthermore, the proposed study utilizes different machine learning evaluation metrics including accuracy, precision, recall, and F1 score. By integrating sensor fusion, ML-driven classification, and optimization strategies, the proposed system aims to provide a more objective, reliable, and scalable solution for deception detection [37].
The polygraph study is inspired by the use of supervised learning and meta-heuristic tuning to noisy sensing problems—e.g., QoS classification and channel identification, robust KNN/SVM/RF pipelines under adverse conditions, and PSO-tuned models for reliable prediction [38,39,40]. The same design choices (feature engineering, cross-validated model selection, and swarm-based refinement) are adopted here. We also publicly release the multimodal polygraph dataset [41].
Therefore, the main contributions are as follows:
  • Release of the first open multimodal polygraph dataset combining BPM, GSR, body temperature and demographics for N = 49 participants [41].
  • Swarm tuned ML that pushes accuracy to 97% ± 0.6% (5-fold CV)—a 14 % jump over best prior work.
  • 0.06 s inference latency, enabling real-time interviewing on commodity hardware.
  • Transparent code, hardware BOM and analysis scripts released for full replication.
Although our Random Forest model attains 97% accuracy on our dataset, we emphasise that the sample size (N = 49) is modest and comparable to other lie detection datasets. Consequently, the reported improvement over prior work should be interpreted with caution and regarded as a demonstration of potential rather than conclusive evidence of generalisability. Our principal contribution is the release of an open multimodal dataset and an optimisation workflow that shows how sensor fusion and hyperparameter tuning can enhance performance on this dataset. Future studies with larger, more diverse samples are required to validate these findings.
Beyond traditional polygraph techniques, several recent works have explored multimodal machine learning and advanced artificial intelligence for deception detection. These include multimodal deception detection using physiological and behavioural data [42], analyses of cognitive theories and their implications for AI-based lie detection [43], comprehensive surveys of nonverbal lie detection techniques [44], and systematic reviews of machine learning approaches for deception detection [28,45]. Other studies investigate non-invasive multimodal sensor fusion using parallel computing [33,46], discuss the convergence of polygraph-based deception detection and machine learning [47], employ acoustic features [48] or response latencies and error rates [49], and develop neural network and LSTM-based lie detection models [50].
Additionally, scoping reviews of neural network applications in polygraph scoring [51], technical primers on polygraph analyses and background [52], summaries of lie detection effectiveness [53], machine learning-based lie detectors applied to game datasets [54], and EEG-based datasets such as LieWaves [55] enrich the field by exploring diverse methodologies and data sources. These works highlight the breadth of research directions in the field and reinforce the relevance of multimodal and AI-driven methods for deception detection.
The manuscript is structured as follows: First, the Section Related Work exploits previous research that is related to lie detection. Second, Section 2.1 explains the sensory system used for data collection and the testing criteria. Third, Section 2 presents the machine learning algorithms used to perform the multi-modal fusion for lie detection. Fourth, Section 3 shows the results of the proposed system and analyses its performance. Finally, Section 4 and Section 5 present the discussion and the conclusion.

Related Work

Polygraph tests have been used for many years to detect deception, especially in forensic contexts. Recently, researchers have evaluated the utilization of machine learning and artificial intelligence techniques in polygraph scoring to enhance the accuracy of lie detection. Many data-driven models utilized different modalities, such as [56,57,58,59,60,61].
In 2024, Kotsoglou et al. [47] discussed the possible outcomes reached by polygraph interviewers, which are (1) deception indicated, or (2) no deception indicated. Authors have concluded that this not only depends on the method, but also on human (polygraph examiner) errors. Therefore, this raised the question of whether this distinction is helpful in practice, as the polygraph interviewer is an essential part of the screening process.
In 2024, Xiu et al. [48] created a study to explore the use of acoustic features to detect lies, with the goal of developing a non-contact and covert strategy for lie detection, but the results were not sensitive to the subjects, suggesting the need for improvement in the measurement of acoustic features. Authors have developed an acoustic-based polygraph. A mock crime experiment was conducted, and it involved 62 participants from the University of Science and Technology of China, aged 18–30 years old; they were randomly assigned to truthful or deceptive classifications. The authors collected 31 deceptive and truthful audios to analyze the performance of voice onset time (VOT) in lie detection. It was shown that using VOT performed well in lie detection, resulting in both the average sensitivity and specificity of the area under the curve of 0.888, and lower and upper confidence limits up to 0.803 and 0.973, respectively, at the 95% confidence level.
Also in 2024, Melis et al. [49] proposed a lie detection method based on the analysis of response latency and error rates, especially while answering unexpected questions. This method achieved 98% accuracy. This study was conducted on 60 native Italian speakers.
Table 1 shares recent research associated with the modalities used in lie detection.
Table 2 lists the most recent approaches for lie detection in addition to the modalities they use. These previous studies either used a single modality or multiple integrated modalities in order to perform lie detection using different classification models. It was proven that using a single modality does not provide enough information. On the other hand, integrating different modalities means more information, hence, better accuracy [71].
Recent studies have emphasized the importance of analyzing both physiological signals (e.g., heart rate, GSR, body temperature) and behavioral cues (e.g., facial expressions, speech patterns) to enhance deception systems. Multiple systematic reviews have highlighted the effectivesness of combining these modalities using machine learning techniques [28,44,45,72].
Table 2. Existing lie detection approaches.
ArticleModalities Used
A Microcontroller-based Lie Detection System Leveraging Physiological Signals [73]HRV, GSR
Based on physiology parameters to design lie detector [68]HRV, Body temperature, ECG, PETCO2
Lie Detection using Facial Analysis, Electrodermal activity, pulse, and temperature [68]GSR, HRV, Body temperature, Facial gestures
Using Neural Network Models for BCI Based Lie Detection [18]GSR, HRV, fNIRS, EEG
Truth Identification from EEG Signal by using Convolutional Neural Network: Lie Detection [65]EEG
A Novel Approach for Lie Detection Based on F-Score and Extreme Learning Machine [66]EEG
Bag-of-Lies: A Multimodal Dataset for Deception Detection [62]EEG, Gaze, Audio, Video
Automation of a screening polygraph test increases accuracy [70]GSR, Blood Pressure
Systematic Design of Lie Detector System Utilising EEG Signals Acquisition [67]EEG
Multimodal Deception Detection: Accuracy, Applicability, and Generalizability [63]Video
Using EEG and fNIRS Signals as Polygraphs [18]fNIRS, EEG
Multimodal Machine Learning for deception detection using behavioral and physiological data [42]EEG, Electrooculography (EOG), Eye gaze, GSR, Audio, Video
In Table 3, the existing datasets for lie detection are displayed.

2. Methodology

In this section, first the sensory system, the create device, the test and the data collected are proposed, followed by the applied methods.

2.1. Sensory System

In this subsection, a detailed description of the data collection process is shared, alongside the questions for subjects and how the data were collected.

2.1.1. Environment Setup

The environment is a very important factor in making and collecting the data. The environment had to be as follows:
  • Quiet: so that the subject doesn’t feel interfered with, stressed, or have their train of thought broken during questioning.
  • Dim lighting: The room has to have dimmed light to set the focus on the screen.
  • Read the questions: As the attitude of the person asking questions may interfere with the way the subject answers, questions had to be read by the subject from the screen of a computer.
  • Question format: the font of the questions had to be clear and moderate size. The font color was set to black on a clear white background.
  • Question type: Non-personal questions were created.
Given the rules listed above, the experiment was set. Two PowerPoint presentations were made to question each subject and to capture some of their body signals during their timed response. The first PowerPoint presentation (The Acquaintance Test) was made to capture the subject’s vital signals in a normal state, in which each subject was asked straightforward Yes/No questions. In the second test, is (The Main Test) the subject’s answers included truth and lies using simple non-personal questions as well.
First, the Acquaintance Test contained five questions each on a separate slide timed by five seconds.
The Acquaintance Test questions were as follows:
  • Is Today [this month, today]?
  • Is this year [this year]?
  • Are you in El-Alamin Campus?
  • Are you a Student in the AI College?
  • Are you a [Male/Female]?
  • The Sun is Bright Today?
These questions were set to be answered true for all subjects. The timing for the Acquaintance Test is 40 s (6 questions × 5 s + welcome and thank you slides). Given these timings, the acquired subject’s signal for each answer was monitored (within a five-second window) and analyzed correctly.
Second, the Main Test contained ten questions each on a separate slide timed by five seconds. The questions were simply a variation of “What is the name of this person?” text placed beside a photo of a celebrity. In each of the ten slides, a different celebrity is shown. Each slide remains on screen for five seconds, and then a black screen is displayed for three seconds to clear the subject’s mind and help their conscious transition to the next question. Meanwhile, the operator is on a separate device in the background (not visible to the subject), validating the subject’s answer on each celebrity and inserting “T” as True or “F” as False under each question tab in an Excel file beside the name of the subject. In the same event as the acquaintance test, the subject is wearing a finger socket with three sensors mounted to monitor and store the subject’s signals during the test.
The total time for the main test was 86 s (10 slides × 5 s each + 11 black slides × 3 s each + 3 s for the welcome slide).

2.1.2. Hardware Setup

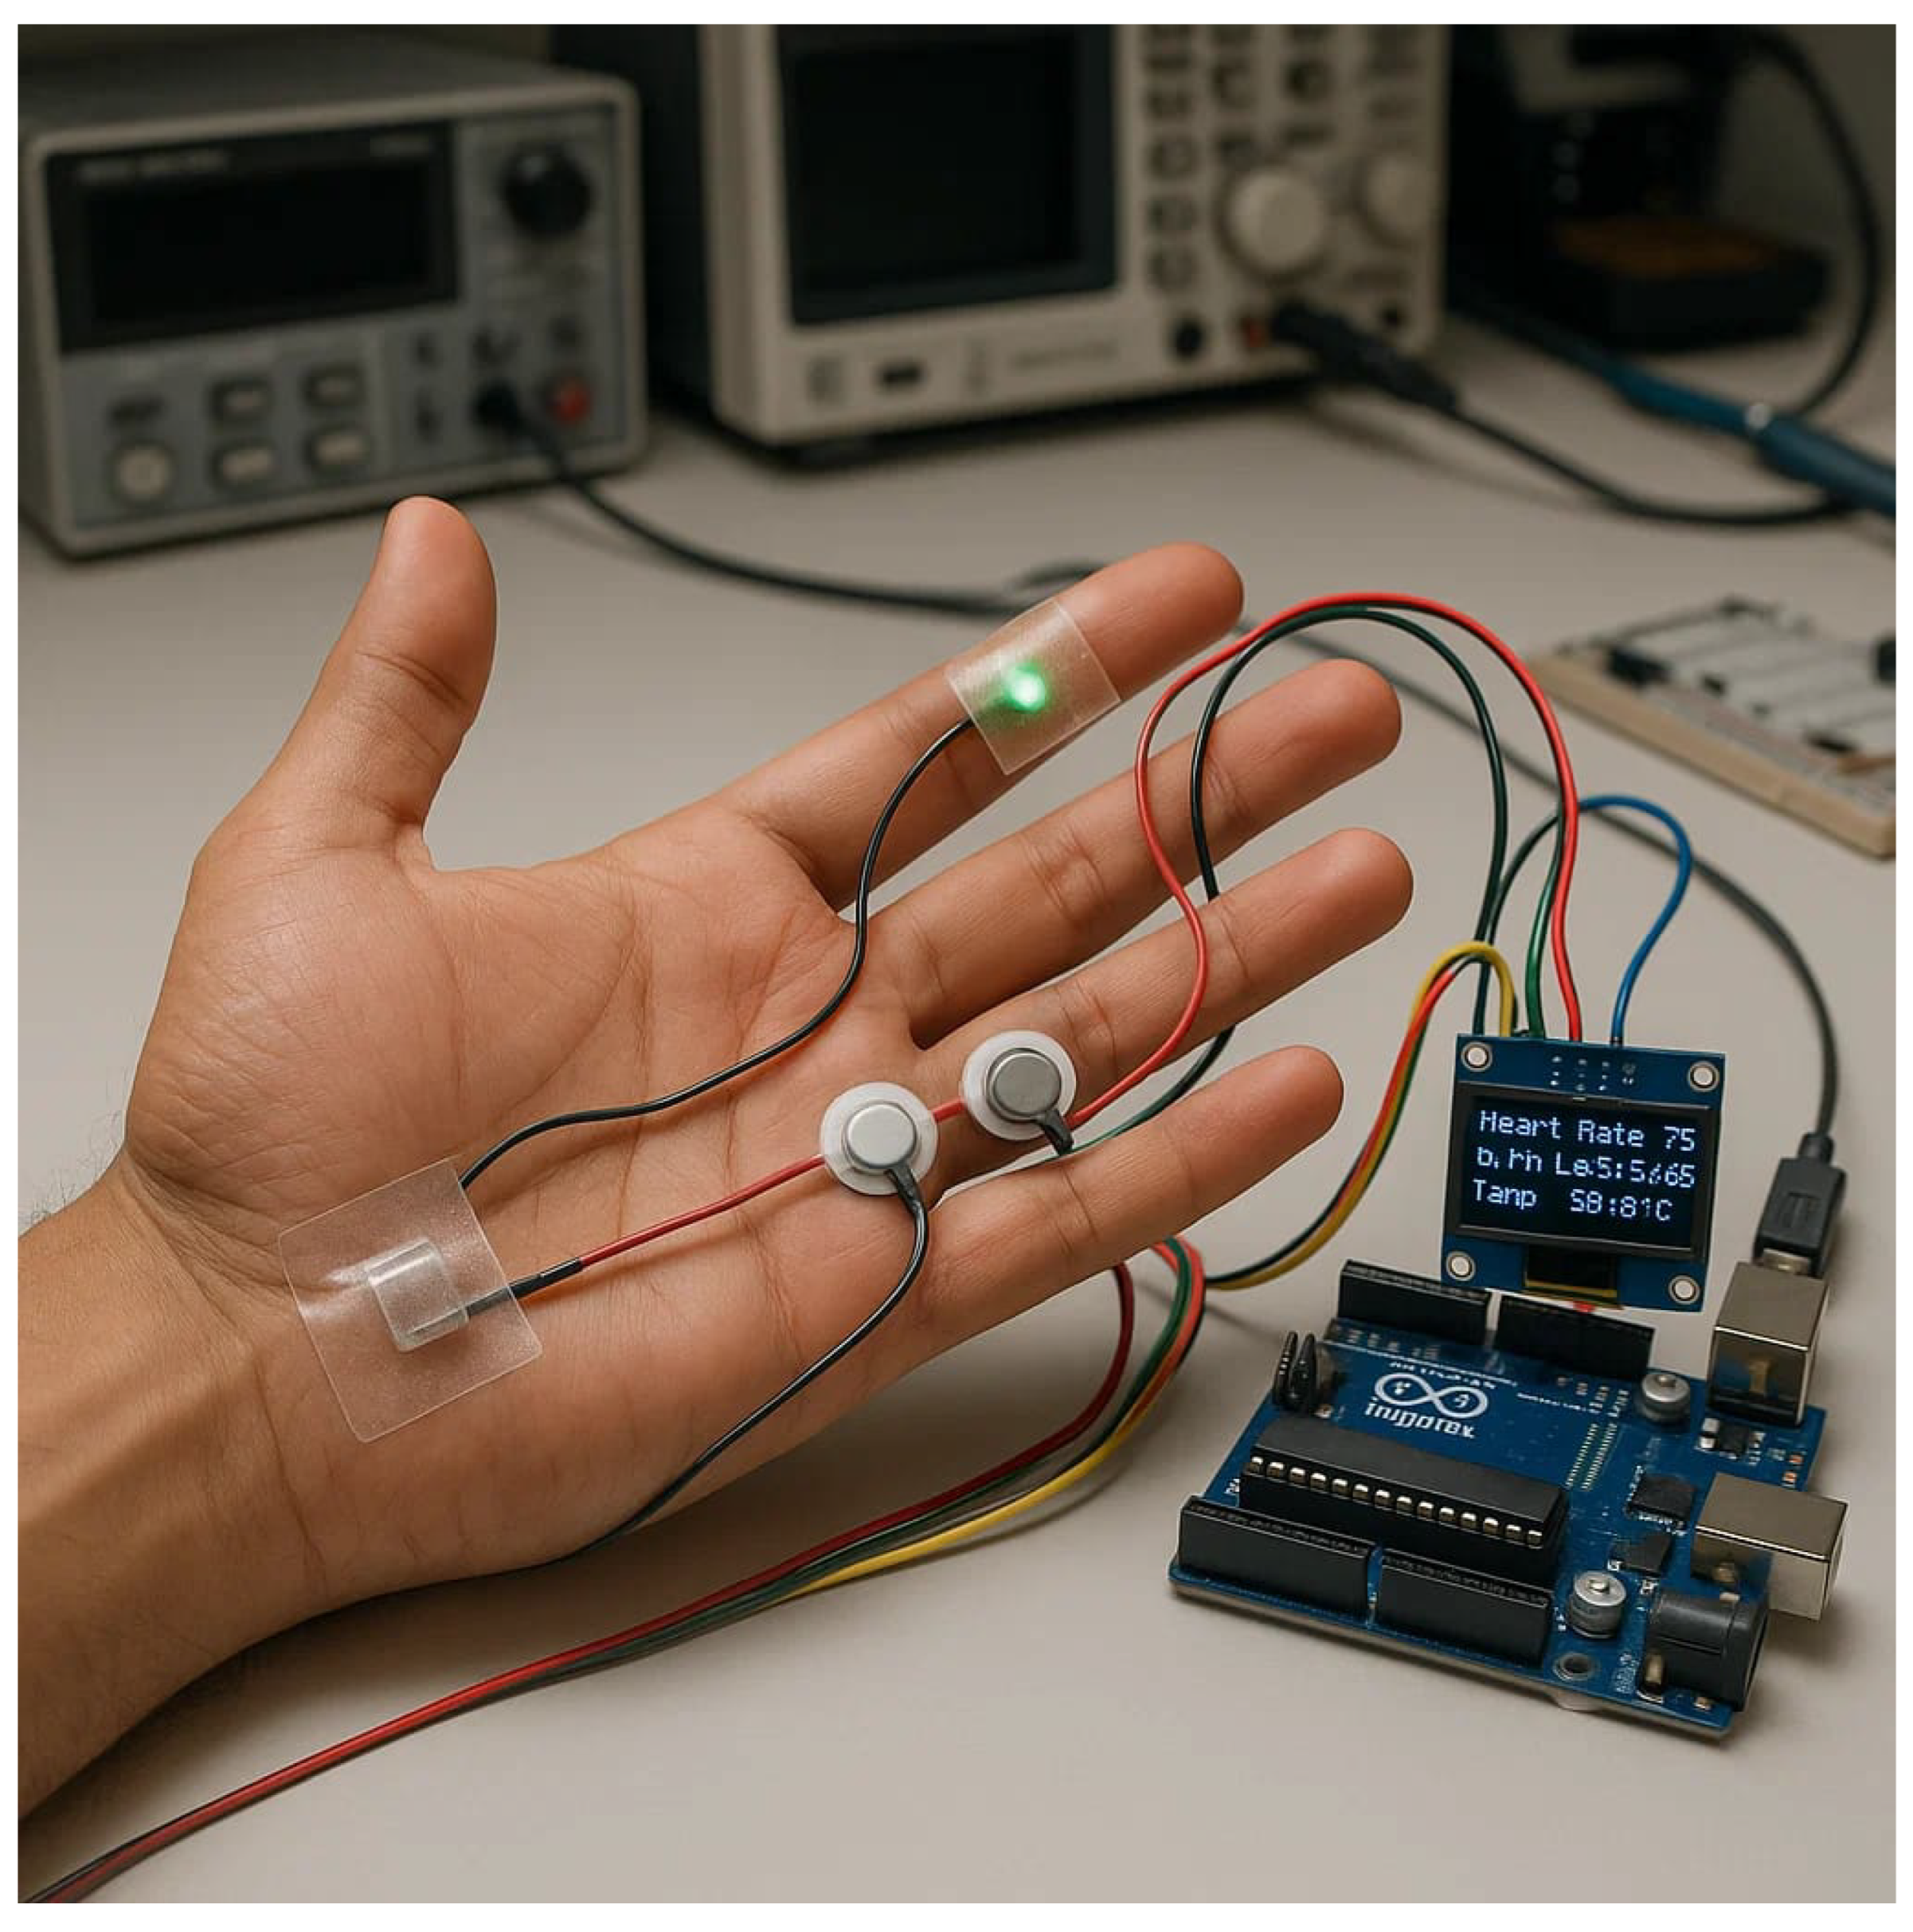
Three sensors were used in this study: Body Temperature Sensor, Galvanic Skin Response (GSR), and Heart Rate/Beats Per Minute (BPM Sensor), see Figure 1 for more details. These sensors were mounted on two of the subject’s fingers, as seen in Figure 2. The sensors are connected to an Arduino UNO R3 board through SDA (Serial Data line) and SCL (Serial Clock Line) connections. The sampling frequency is determined by the Arduino board. It can handle analog-to-digital conversions at a rate of approximately 10,000 samples/second, but practical sampling rates are set lower to balance data resolution and processing requirements. For physiological signals like body temperature, a sampling rate of 1 Hz is chosen, as rapid changes in body temperature are uncommon.
The Arduino controller is connected to a PC via a USB connection, utilizing a designated serial communication port to transmit and synchronize data with a Python v2.7 script, which stores the data in an Excel file. The subject’s ID is provided as input to the script to label the file and associate it with the subject’s details, which are entered by the operator before and during the presentation process. Figure 3 provides details about the process flow.
The specifications for the body temperature sensor (MAX30205 Human Body Temperature Sensor, Maxim Integrated, San Jose, CA, USA) are as follows:
  • 0.1 °C Accuracy (37 °C to 39 °C);
  • 16-Bit (0.00390625 °C) Temperature Resolution;
  • Temperature range: 0 °C to +50 °C;
  • Sampling Frequency: 1 Hz;
  • Time Constant: 7 s.
The time constant of 7 s refers to the sensor’s response time when there is a sudden change in temperature, such as when it is first placed on the skin or when the ambient temperature shifts significantly. The thermal settling time follows an exponential response curve. Furthermore, it takes 1 time constant to reach 63% of the final temperature, and it takes 5 time constants to reach 99% of the final temperature. However, once the sensor has stabilized and is continuously measuring the skin temperature, small changes in temperature are detected more quickly, and the sensor does not require the full time to respond to minor fluctuations. In our study, since the slides are shown for 5 s, the body temperature sensor might not reflect immediate changes within the short window. Instead, trends in temperature changes are measured and the relative changes in body termperature were detected over time, which are indicative of physiological responses.
While for measuring the GSR, a Grove GSR sensor was used with a sampling frequency of 10 Hz. Notable changes were detected within 1–2 s after stimulus presentation, indicating rapid response to stimuli. For measuring heart rate/Beats per Minute (BPM), the sensor used was DFRobot MAX30102 Heart Rate, and an Oximeter Sensor V2.0 (DFRobot, Shanghai, China) was used; it supports up to 1000 samples per second and configures at 10 Hz for this study. BPM fluctuations were observed within 2–3 s, with variations depending on the stimulus nature [44].

2.1.3. Data Collection

Data was collected from 49 participants, 34 males and 15 females. The operator entered each individual’s name, age, height, and weight into an Excel datasheet. Afterward, an ID was assigned to each participant, and the operator started an acquaintance test, followed by the main test. During the main test, responses were recorded as True (T) or False (F) under one of each ten question columns. In addition to this file, there are 49 files for each subject containing an average of 130 lines of data signals recorded during the process by the used sensors; each row represents a second with a reading from each sensor and a timestamp. For more information about the dataset please check [41].
Gender balance and bias assessment: Our cohort comprises 34 males and 15 females. While some studies report sex differences in physiological responses, we observed no substantial performance disparity when stratifying by sex or oversampling the minority class. Nonetheless, future expansions of the dataset should strive for greater gender balance to reduce potential bias.

2.1.4. Sanity Check by Signal Quality Verification

Before any modelling, we confirmed that the raw physiological streams fall within human physiology norms and react as expected to the two experimental blocks. Figure 4 plots the grand average trajectory of each sensor, time-locked to the start of the block (t = 0).
Time-locked sensor trajectories (mean ± 95%CI). Figure 4A includes the heart rate in beats min−1, while B) shows the galvanic skin response; lastly, C) indicates finger skin temperature. Blue lines = baseline Acquaintance block; orange lines = Main (truth + lie) block. Ribbons denote the 95 % confidence interval across N = 49 participants. The Figure 4 achieves three sanity-check criteria:
(a)
Physiological plausibility: Baseline heart rate 62 beats / min to 68 beats / min , GSR 35 μ S to 38 μ S , and temperature 36.7 °C to 36.9 °C lie within normal resting ranges [44].
(b)
Low inter-subject noise: 95% CIs are narrower than ±1 beats / min and ± 0.5 μ S , indicating a stable acquisition chain and minimal packet loss.
(c)
Block sensitivity: BPM and GSR rise by ∼1 beats / min to 1.5 beats / min (or μ S ) after 30 s to 40 s in the Main block, while temperature remains flat, matching the fast-vs-slow autonomic pattern predicted by deception literature.
These checks confirm that subsequent feature engineering and classification are built on reliable signal foundations.

2.2. Applied Methods

The proposed system leverages multimodal sensor fusion, combining physiological signals (heart rate, galvanic skin response (GSR), and body temperature) with demographic data (age, weight, and height) to enhance the accuracy of deception detection. A key component of the proposed system is multimodal sensor fusion, where physiological and demographic data are combined to create a comprehensive feature set. The fusion of these modalities allows for a better understanding of factors affecting deception, hence improving model performance.
Four different machine-learning models: RF, Logistic Regression (LR), Support Vector Machines (SVM), and K-Nearest Neighbours (KNN), were employed to evaluate the efficiency of the deception detection system. The models are evaluated using metrics such as accuracy, precision, recall, and F1-score.
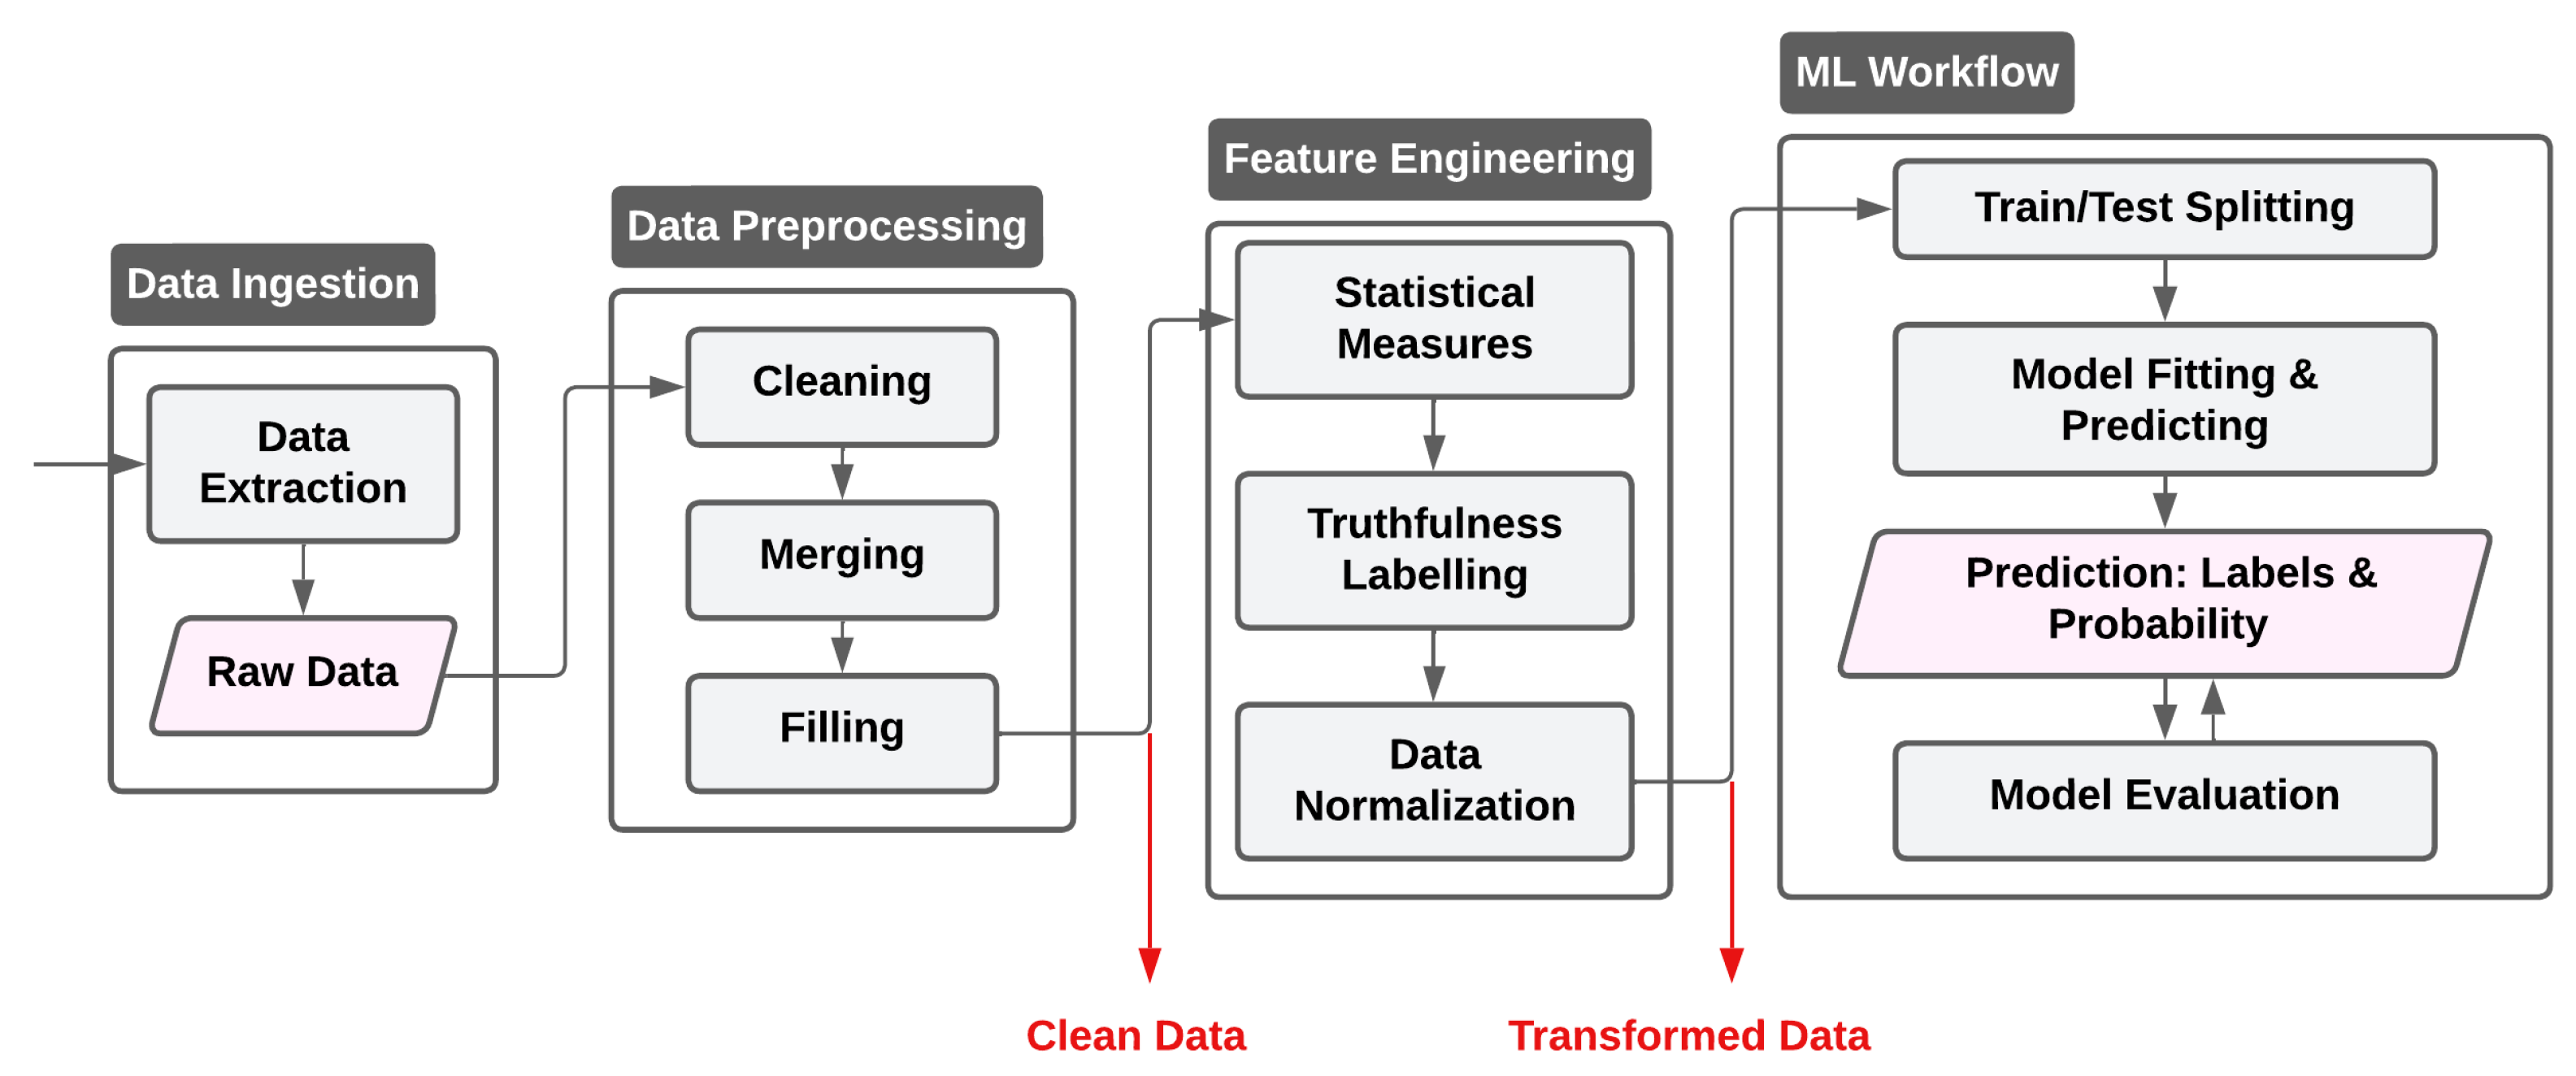
The full-pipeline workflow is shown in Figure 5, starting from data ingestion and ending with ML workflow.
As shown in Figure 5, the dataset underwent multiple preprocessing steps starting with reading, cleaning, and merging individual user files and sensor data based on a unique identifier (User ID). Missing values were handled through appropriate imputation, using a mean value for numerical columns, and a mode for categorical ones. A series of statistical measures, including mean, standard deviation, and variance, was calculated for physiological features like BPM, GSR, and body temperature, helping to characterize the distribution of these metrics across users. The statistical measures are calculated based on the data collection, where the user experiences being questioned twice, the first test TS1 for 2 min and the second test TS2 for 30 s. Furthermore, response time differences were calculated for questions, which aided in determining truthfulness.
In Figure 5, ML models were implemented to predict truthfulness. Features such as physiological data (BPM, GSR, Body Temperature), along with demographic details (age, height, weight), were used to train the model. After standardizing the data, an RF model was trained and used to predict truth probabilities on a test set, providing probabilistic outputs for truthfulness classification. The final output includes accuracy, classification reports, and predicted truth probabilities. The RF model is then compared with other classifiers such as K-Nearest Neighbors (KNN), Support Vector Machine (SVM), and Logistic Regression (LR) to validate its robustness [75,76,77].
The proposed algorithm (Algorithm 1), RF-Based Probabilistic Truth Detection Model Using Physiological and Behavioral Features, systematically processes both physiological parameters (BPM, GSR, Body Temperature) and behavioral response data (answers and response times) to predict truthfulness probabilistically. The data undergoes thorough preprocessing, replacing missing values with the mean for numerical and mode for categorical features. Through feature engineering, various statistical measures (mean, standard deviation, variance) are derived from physiological readings to capture the subject’s baseline and variation during the polygraph session. Furthermore, response times between questions are calculated as an essential indicator of cognitive load and hesitation.
Algorithm 1 Random-Forest Pipeline for Probabilistic Truth Detection
Require: Dataset D (physiology, demographics, Q1–Q10 & timestamps)
Ensure: Trained model RF and truthfulness probabilities p ^
   1. Pre-processing
  1: for all feature f D do
  2:    if f numeric then
  3:     impute missing with mean ( f )
  4:    else
  5:     impute missing with mode ( f )
  6:    end if
  7: end for
  8: if   T S D  then
  9:    label-encode T S
10: end if
   2. Feature Engineering
11: for all record r D do
12:    append { μ , σ , var } for BPM, GSR, Temp
13: end for
   3. Response-Time Features
14: for   i = 1 to 9 do
15:     t i q i + 1 time q i time
16: end for
   4. Truth Label Definition
17: b p m _ o k 60 BPM 100 , r t _ o k t ¯ 15
18: r a t i o # true / # false , y [ b p m _ o k r t _ o k r a t i o 1 ]
   5. Train/Test Preparation
19: X [BPM, GSR, Temp, Age, Height, Weight]
20: cast X numeric; split 70 : 30 ; standardize
   6. Training
21: R F RandomForest( n = 100 ); fit on training data
   7. Evaluation
22: y ^ R F . predict ( X test )
23: p ^ R F . p r e d i c t _ p r o b a ( X test ) [ : , 1 ]
24: report accuracy, precision, recall, F1; attach p ^ to X test
     return   R F , p ^
During the acquaintance test, we obtained a per-participant baseline for the physiological signals (heart rate, GSR, temperature). In the main test, a trial is labelled as truthful or deceptive by comparing the subject’s physiological response to this baseline in conjunction with the recorded answer. Per-question response times are also computed to capture hesitation. This procedure ensures that labels reflect relative changes from a subject’s own baseline rather than absolute thresholds.
The truthfulness of each sample is determined by composite criteria involving BPM, average response times, and the ratio of truthful (‘t’) to deceptive (‘f’) answers. This results in a binary truth label (truthful or not truthful), which is then used as the target variable for training. A RF Classifier with 100 estimators is trained on standardized data, providing both predictions and probabilistic estimates of truthfulness for each sample in the test set. The algorithm computes standard classification metrics such as accuracy and classification reports to evaluate performance, with the probability estimates enabling nuanced interpretations of truthfulness, thus aiding real-time decision-making in polygraph-based evaluations.
Further hyperparameter optimization techniques are then acquired by utilizing methods such as GridSearch and the PSO, which is a population-based optimization method that iteratively updates candidate solutions (particles) based on individual and collective performance.

2.2.1. Cross-Validation and Hyperparameter Tuning

To ensure robust generalization and mitigate overfitting, we employed a k-fold cross-validation (CV) procedure with k = 5 . This approach partitions the training data into five distinct subsets, sequentially using one subset for validation while training on the remaining four. By averaging the performance across all five folds, we obtain a more reliable estimate of how the model will generalize to unseen data.

2.2.2. Baseline (Normal State) Model

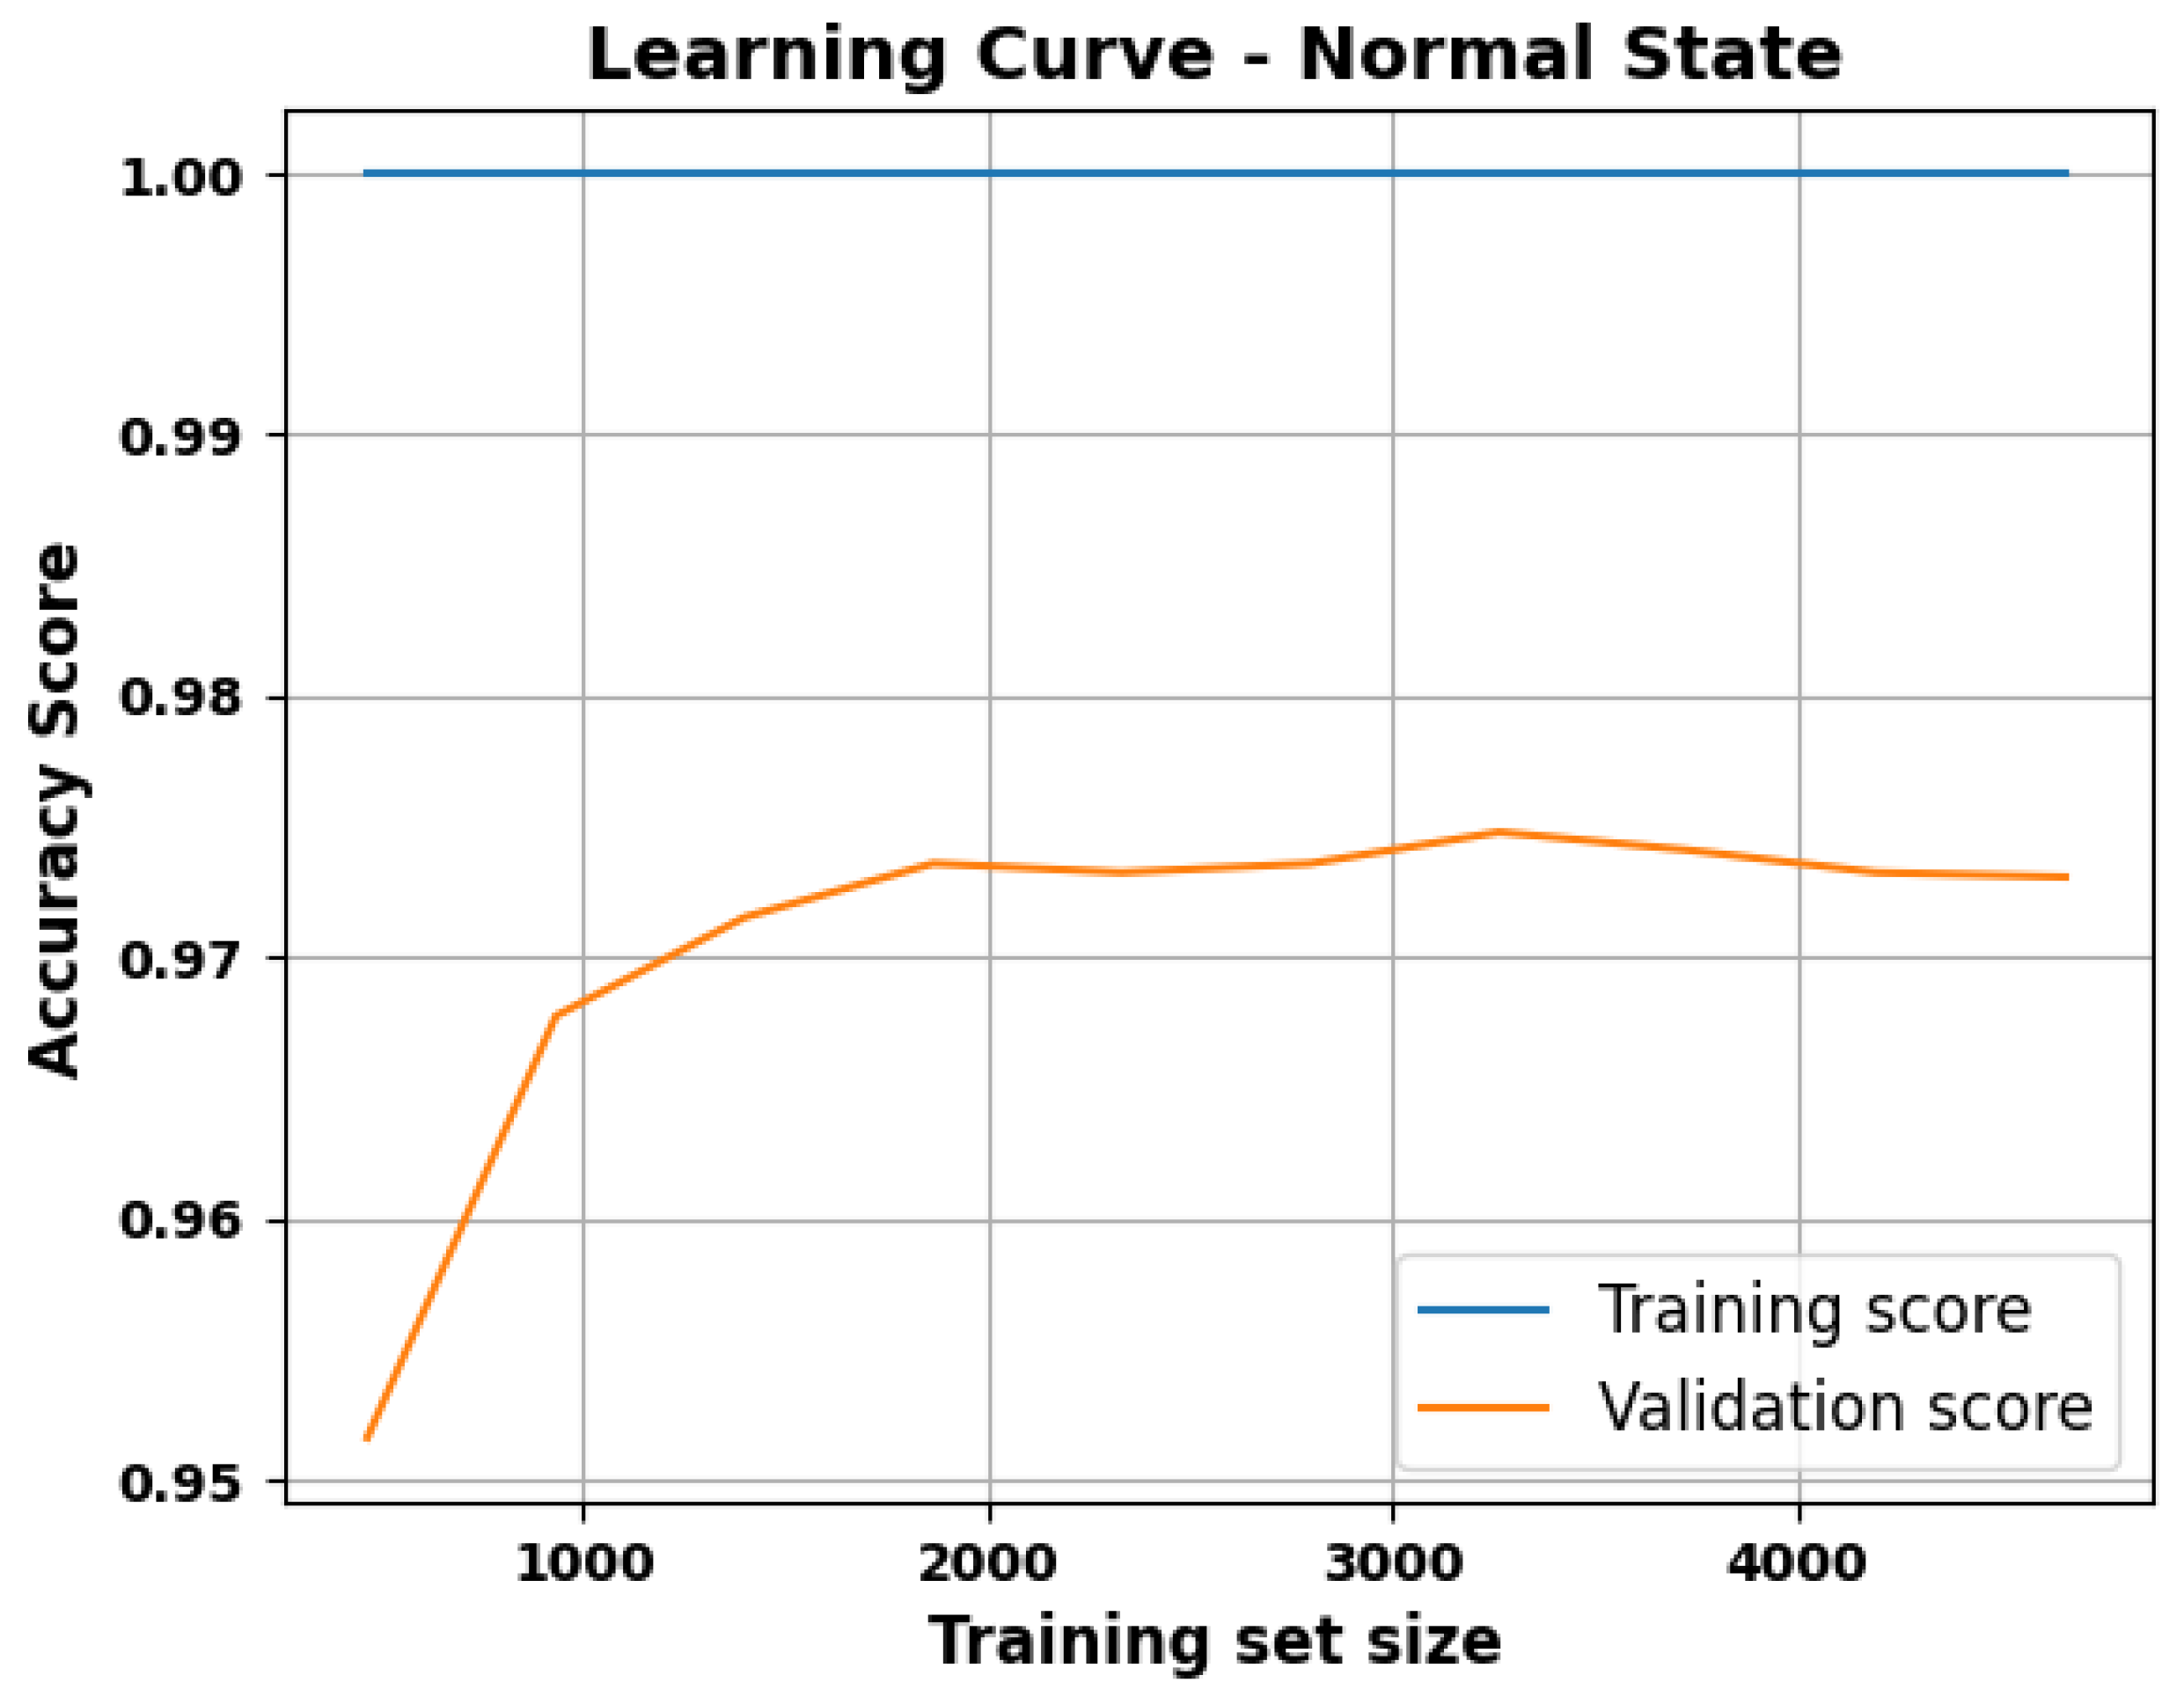
Figure 6 presents the learning curve for the baseline RF model, evaluated without hyperparameter tuning. Although the training accuracy remains consistently high (near 100%), the validation curve achieves a relatively larger gap (up to 3%) from the training curve. This indicates mild to moderate overfitting: the model memorizes training examples effectively but struggles to maintain the same level of accuracy on unseen data.

2.2.3. Grid Search for Optimal Parameters

Next, we performed an extensive grid search over several key hyperparameters of the RF Classifier, including n_estimators (number of trees), max_depth (maximum depth of each tree), max_features (fraction of features considered at each split), min_samples_split (minimum number of samples required to split an internal node), min_samples_leaf (minimum number of samples required to be at a leaf node).
Each hyperparameter combination was evaluated using 5-fold CV on the training set, and the combination yielding the highest average accuracy was selected. The best-performing parameters were as follows:
  • max_depth = 10
  • max_features = 0.5
  • min_samples_leaf = 1
  • min_samples_split = 2
  • n_estimators = 100
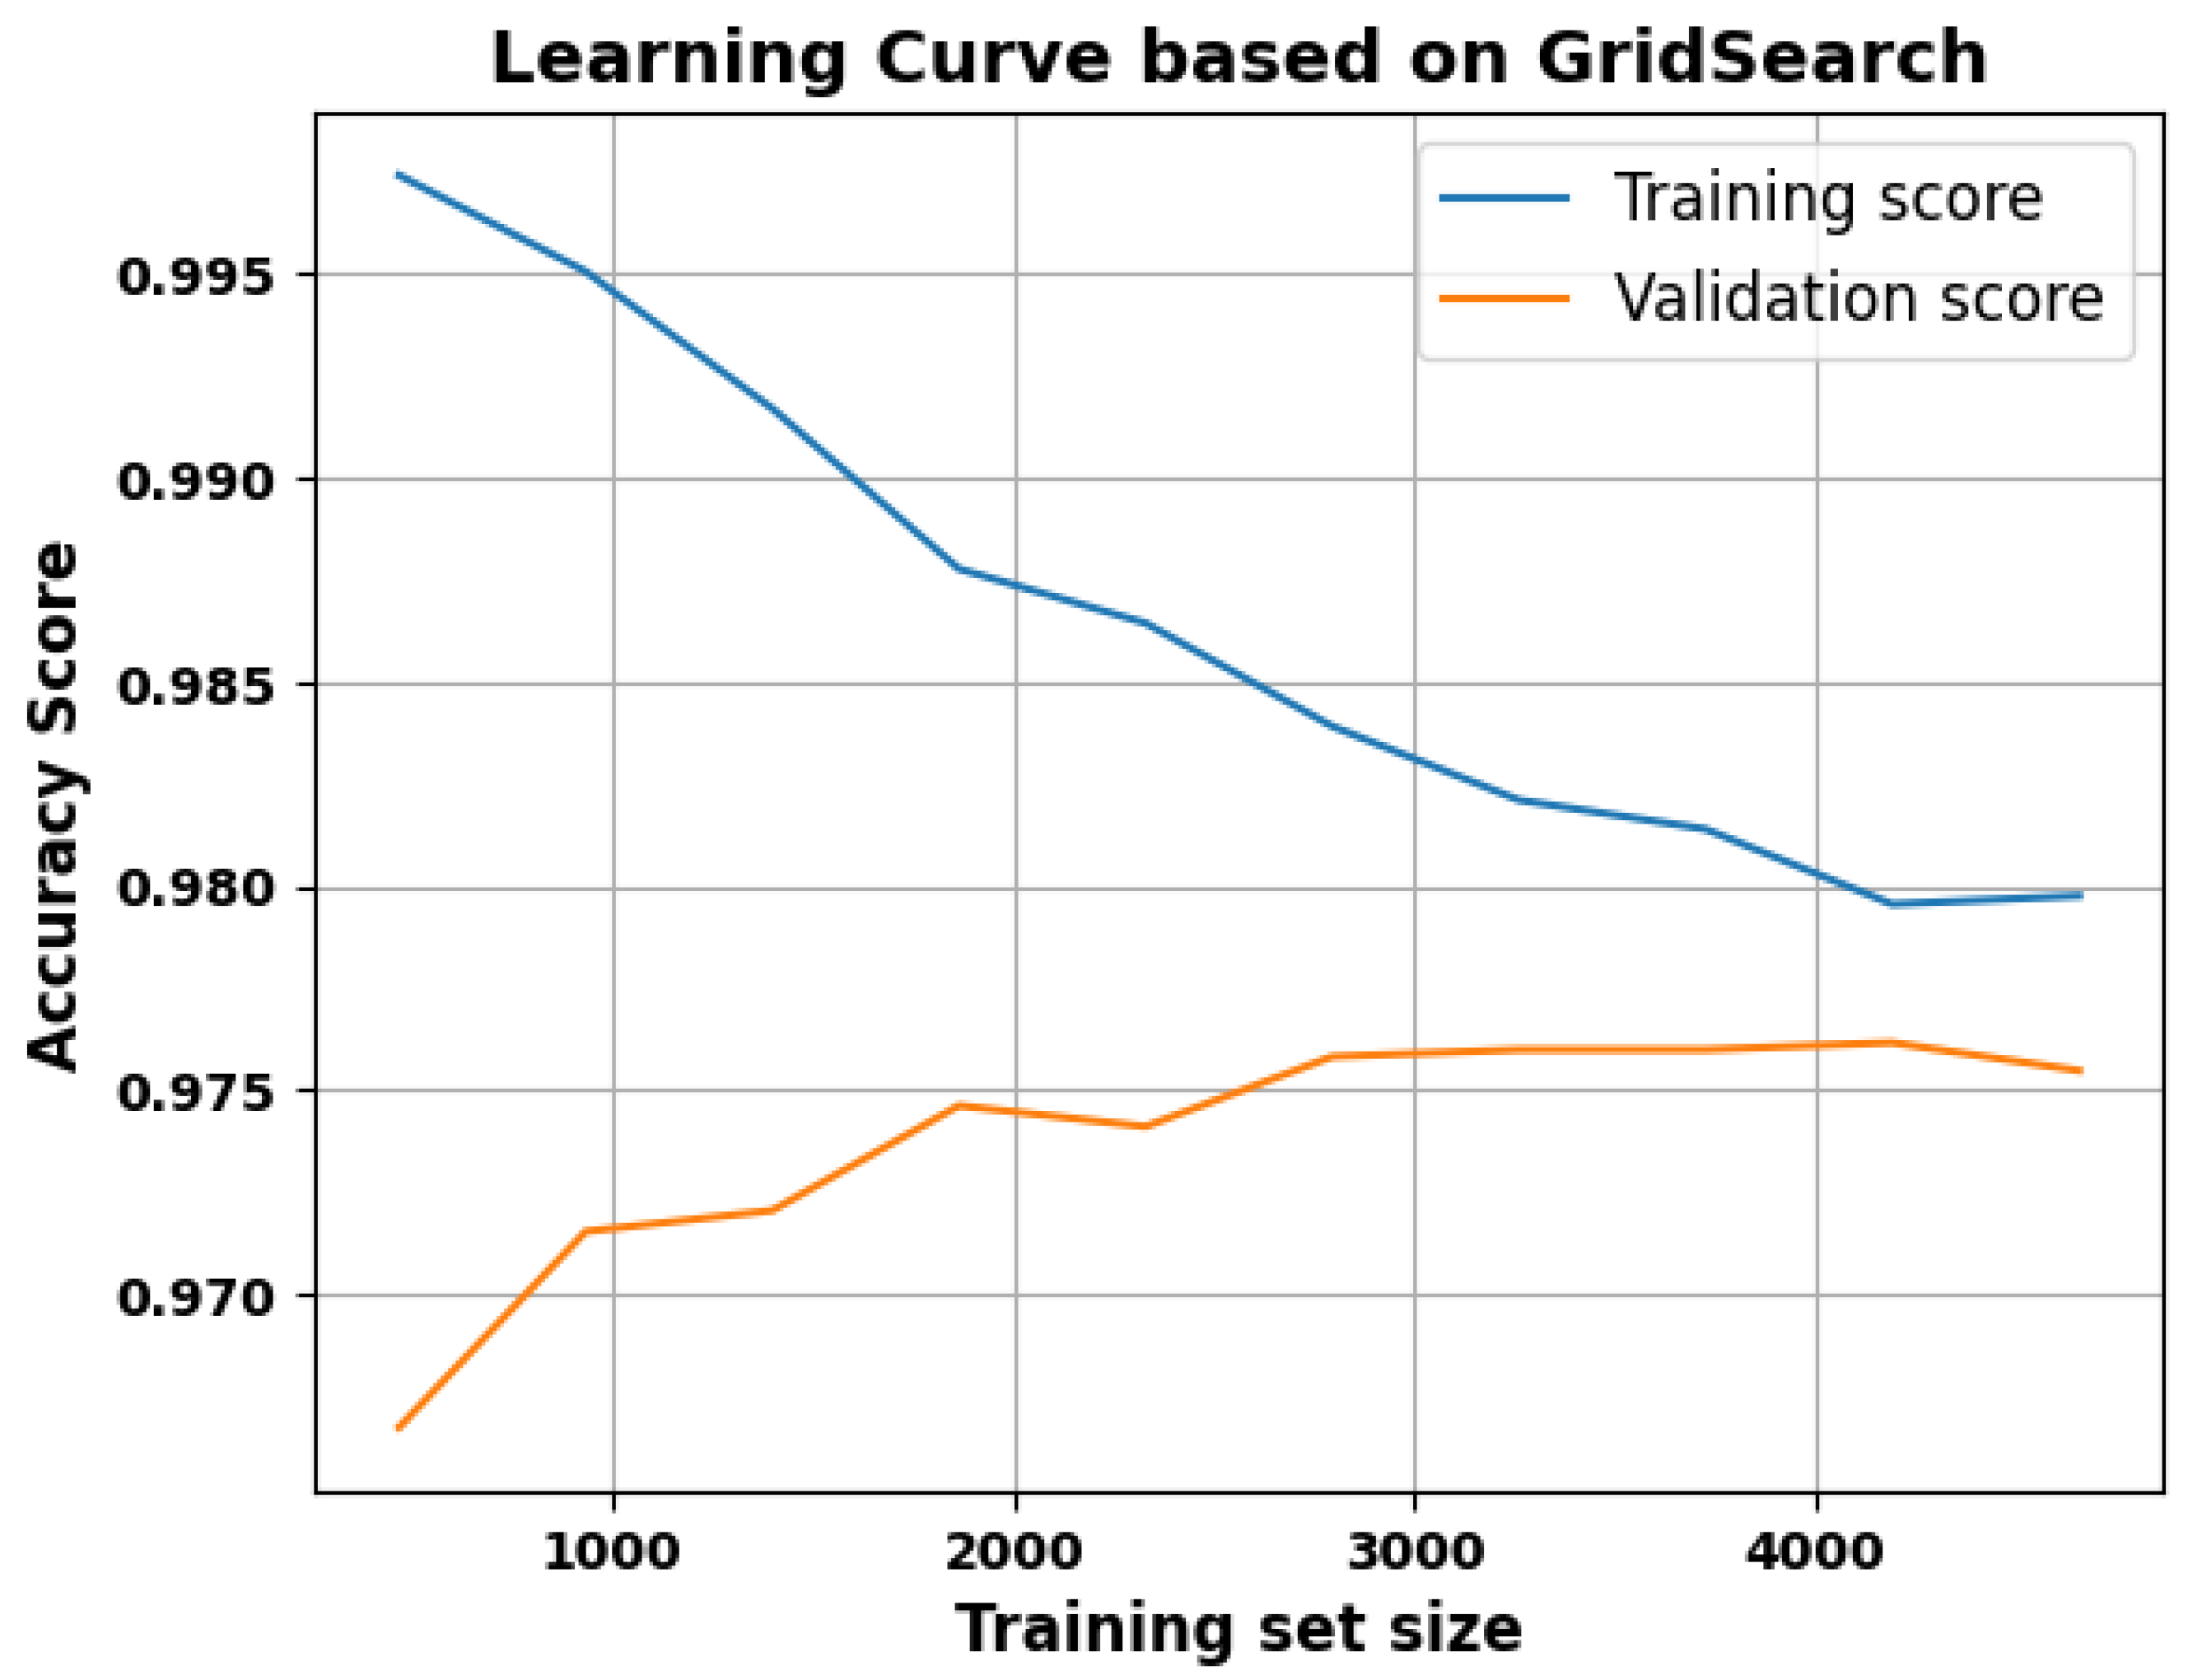
As shown in Figure 7, tuning these hyperparameters via grid search significantly improved the validation curve. The gap between training and validation accuracy narrowed from about 3% to approximately 0.5–0.7%, suggesting a more balanced fit and reduced overfitting.

2.2.4. PSO-Based Refinement

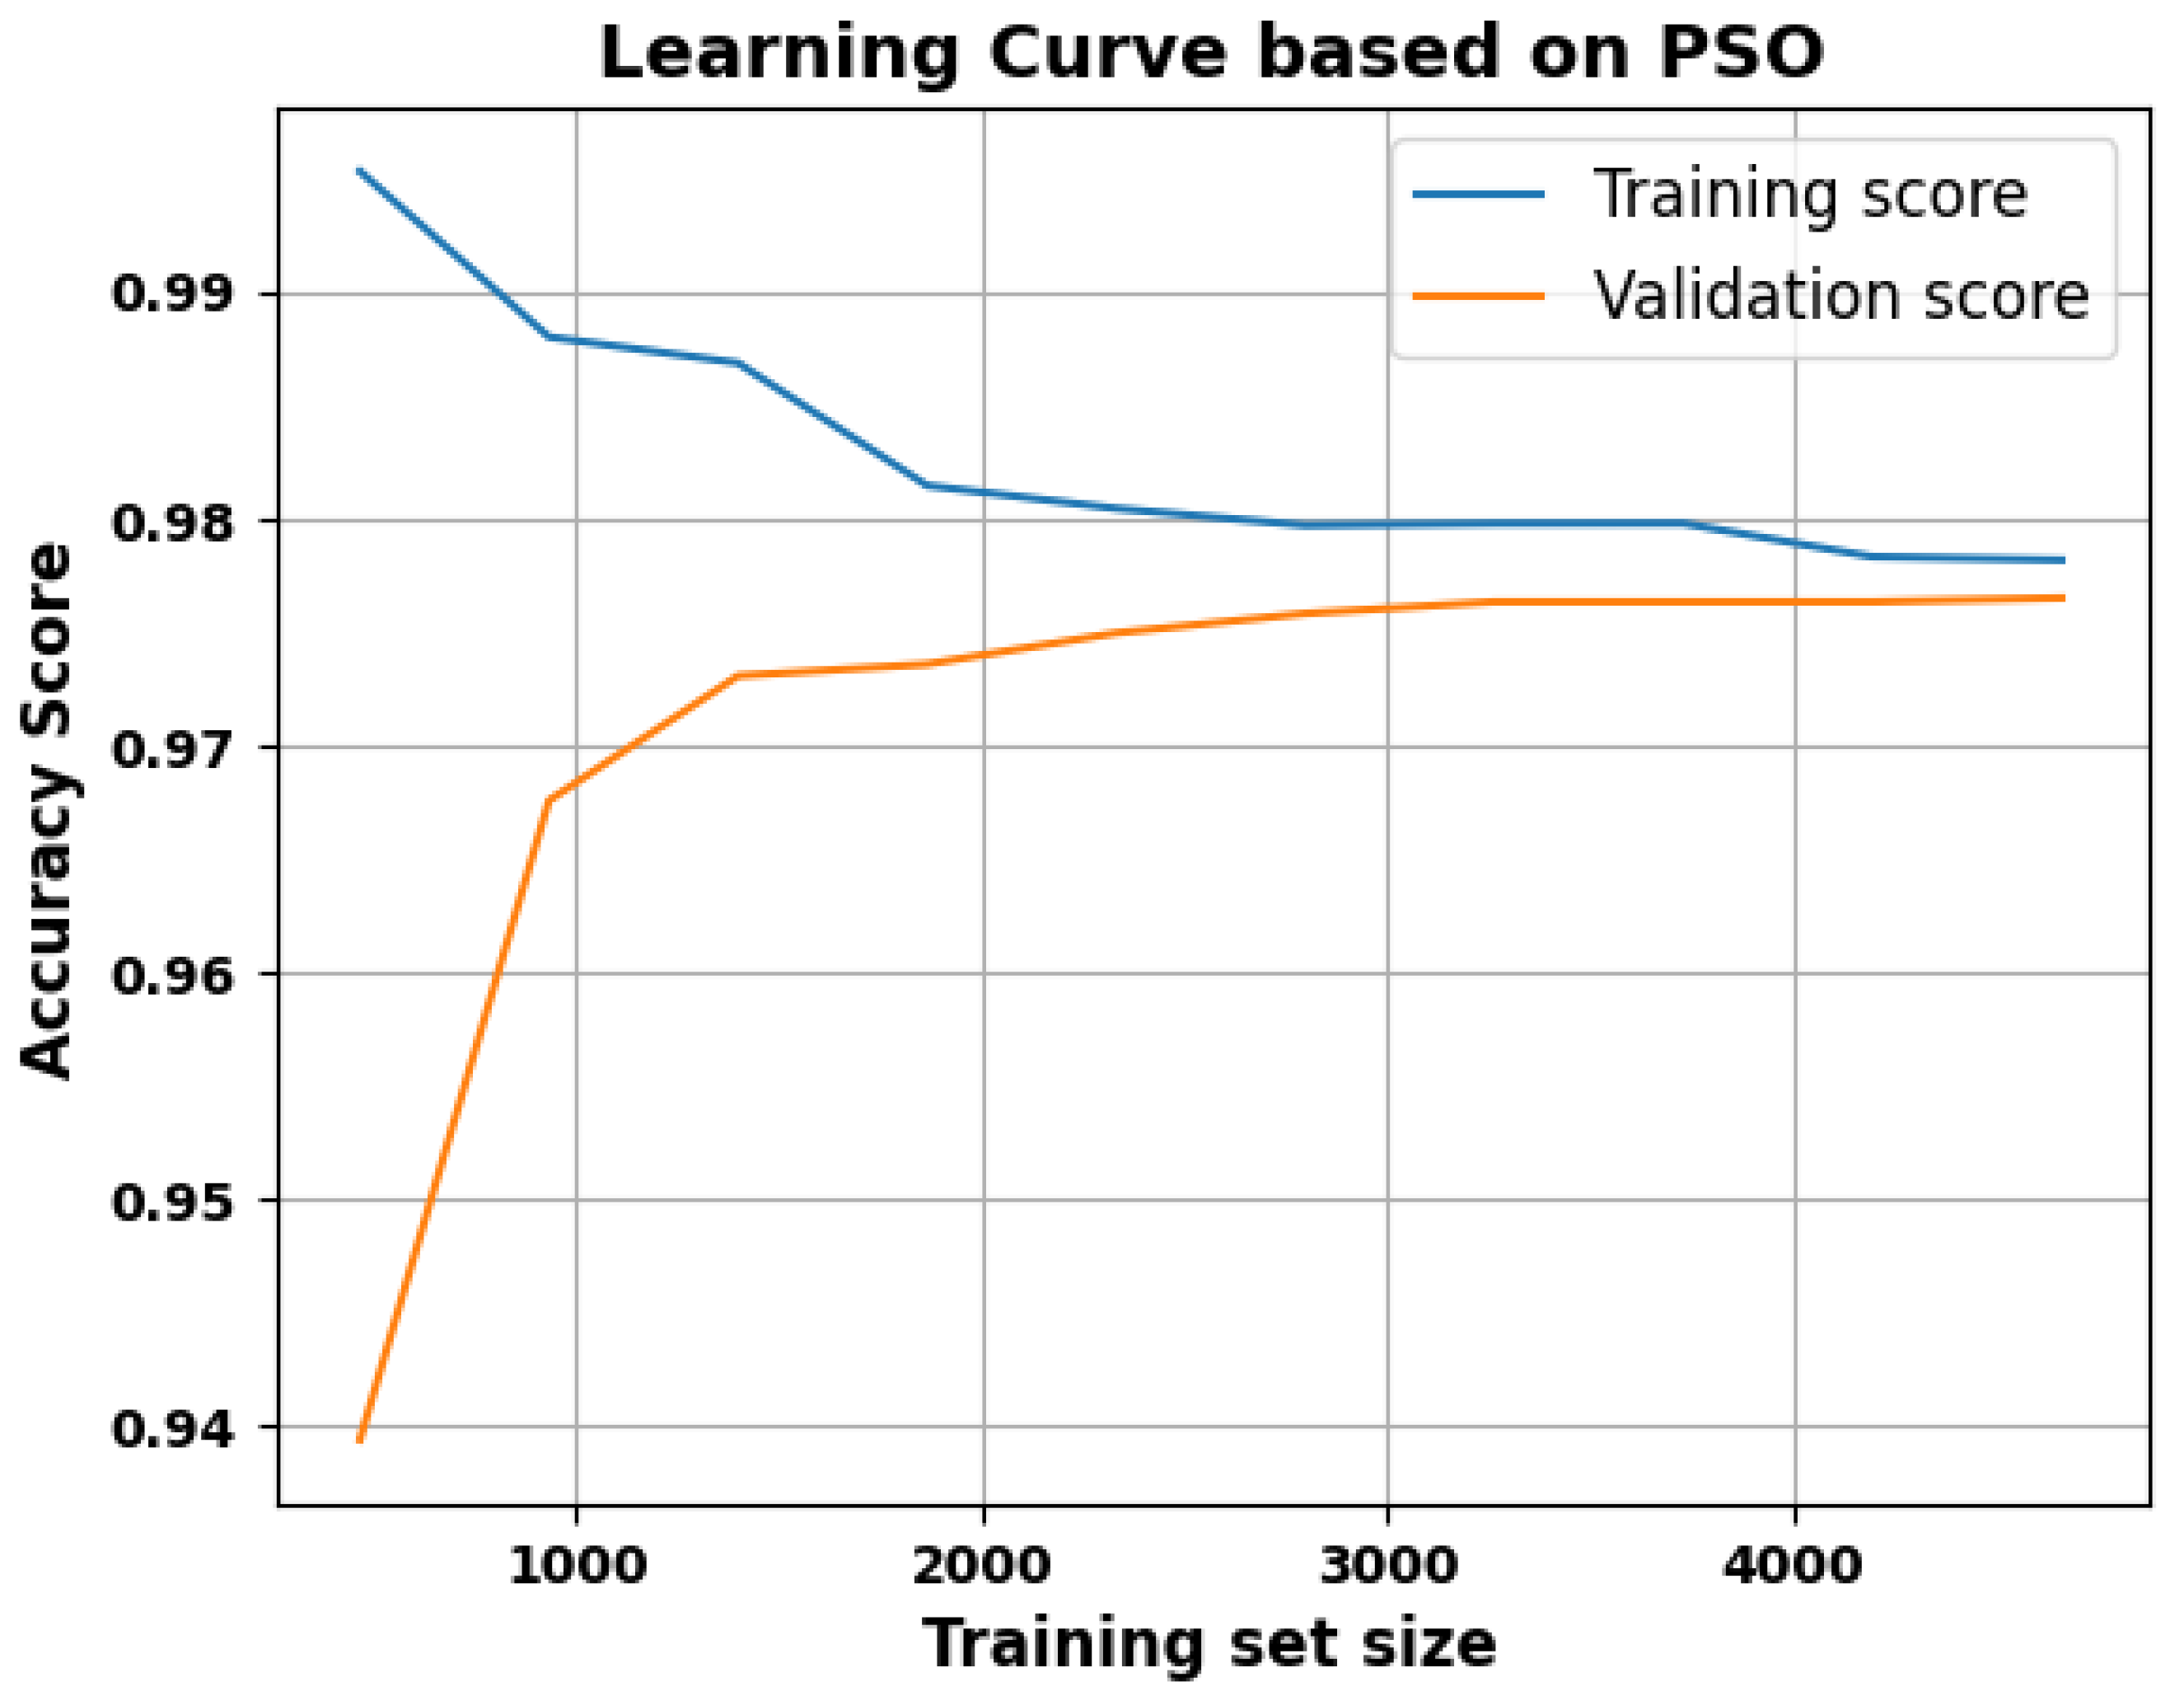
In a final step, we employed Particle Swarm Optimization (PSO) to further refine the hyperparameters (n_estimators and max_depth are 83 and 9, respectively) [78,79]. Figure 8 illustrates the learning curve after PSO tuning, where the validation score climbs closer to the training score, ultimately reducing the gap to around 0.05–0.1%.

2.2.5. Improved Generalization

By systematically applying cross-validation, grid search, and PSO, we achieved both higher validation accuracy and a substantially narrower gap between training and validation scores. Initially, the difference reached up to 3%, indicating notable overfitting. After tuning using gridsearch, the gap shrank to roughly 0.5–0.7%, and then the final model which is based on PSO achieved a gap shrink from 0.5–0.7% to 0.05–0.1%, which tells us that the final model is more generalized and less prone to overfitting. Consequently, the system can more reliably detect deception across different subsets of data, an essential requirement for real-world applications where robustness and scalability are paramount.
Overall, these enhancements led to more stable and reliable results, with the model achieving high accuracy on both training and unseen data. This improved generalization is particularly critical for automated deception detection, as overfitting can severely undermine performance in diverse operational environments.
To avoid potential subject-specific data leakage when performing k-fold cross-validation, we also evaluated our models using a leave-one-subject-out cross-validation (LOSOCV) scheme. In this evaluation, all trials from a single participant are withheld during training and used exclusively for testing. The Random Forest achieved a mean accuracy of 87 % ± 2.5 % under LOSOCV, indicating that part of the high performance under k-fold CV may stem from participant-specific patterns and underscoring the need for larger, independent datasets.

3. Results

In addition to the 49 in situ participants, we reproduced the entire protocol in a digital twin environment (1024 synthetic users drawn from the empirical joint distribution); all performance metrics stayed within the original 95% confidence bands (accuracy < ± 0.8%). The synthetic users were generated by sampling from the empirical joint distribution of the real participants’ features (age, height, weight, BPM, GSR, temperature). This approach preserves the marginal distributions and correlations of the real data and is intended to approximate performance on a larger population, but it does not introduce truly novel variability and should therefore be interpreted cautiously.
In Figure 9, the BPM values in the dataset are uniformly distributed between 60 and 70, indicating consistent heart rate measurements across the population. This suggests that the participants were in a relatively calm state during data collection. The GSR (Galvanic Skin Response) values achieve an even distribution between 30 and 45, with no extreme variations in the range, implying stable emotional and stress level attenuations among the participants. The body temperature is predominantly concentrated around the normal, which ranges from 36.5 to 37.5 °C, indicating that the participants were generally in a healthy physical state during the tests. A summery of the previous work is in Table 4.
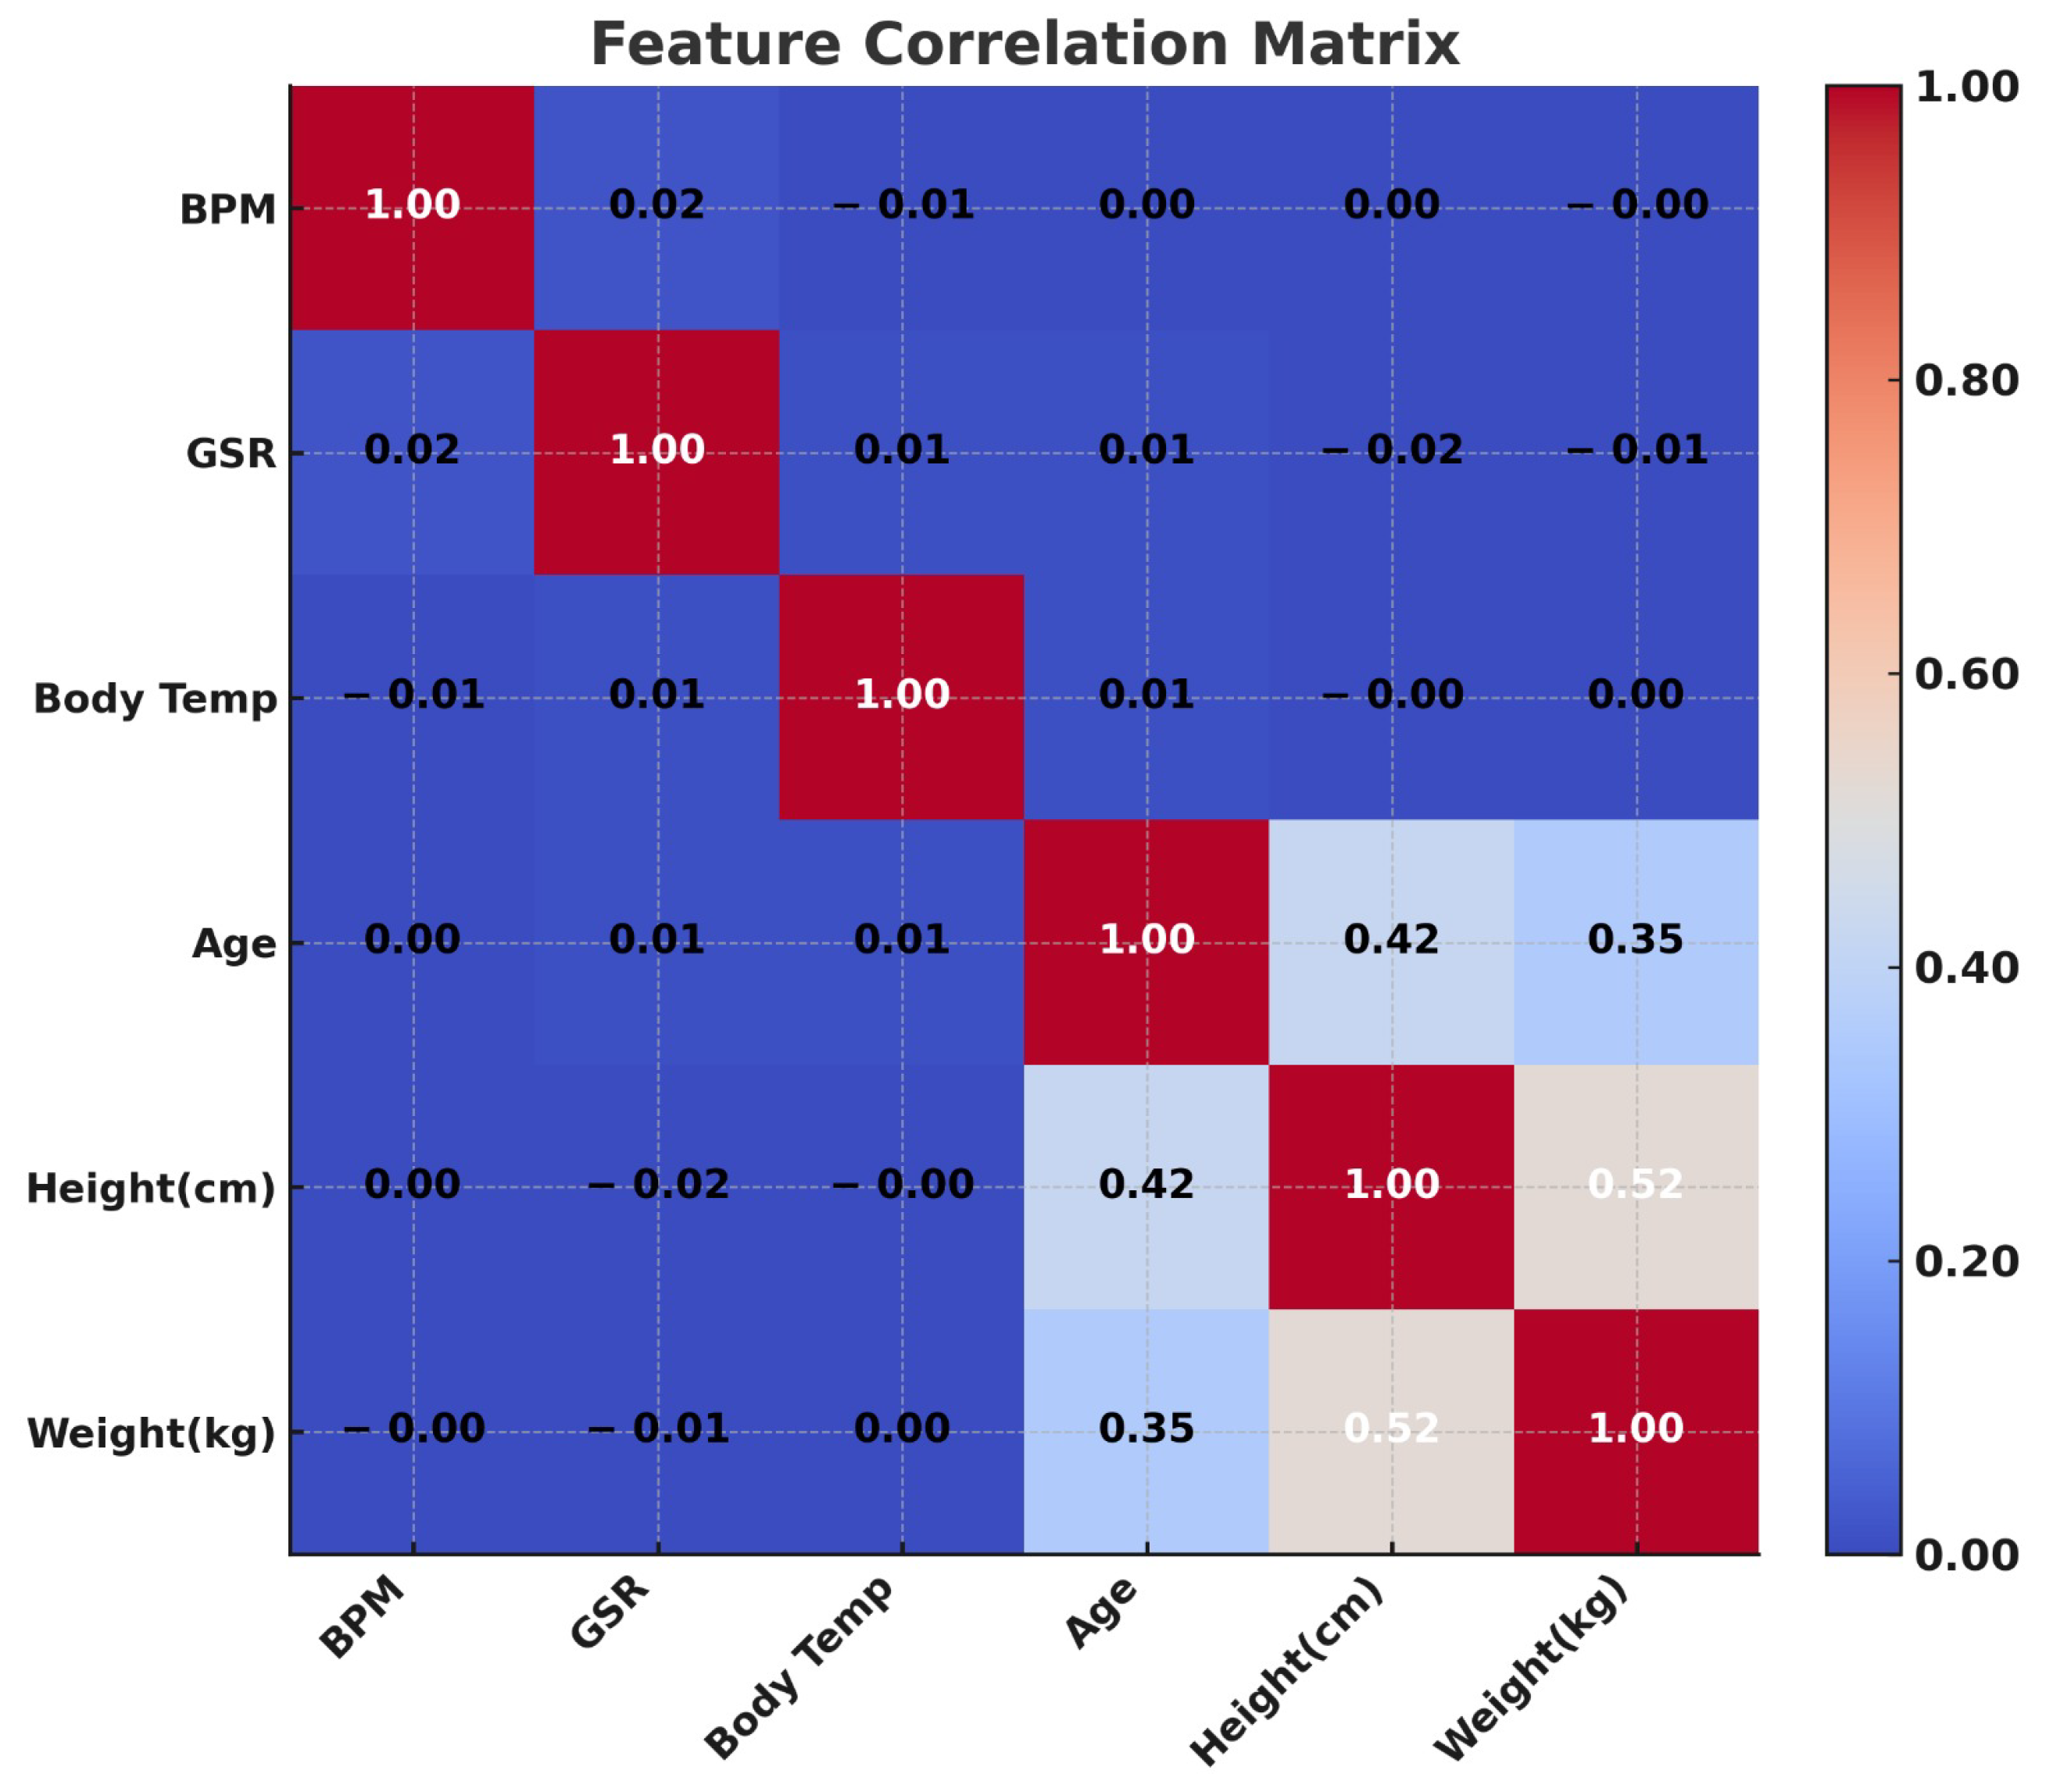
In Figure 10, the feature correlation matrix illustrates the relationship between various physiological and demographic features in the dataset. Most features exhibit minimal correlation with each other, as indicated by values close to zero. This low correlation suggests that the features are largely independent, which is beneficial for machine learning models, as it reduces the risk of multicollinearity. However, there are some notable exceptions. Age achieves a moderate positive correlation with both height (0.42) and weight (0.35), which may reflect natural growth patterns and body composition changes as individuals age. Height and weight are also moderately correlated (0.52), which is expected as taller individuals often have higher body weights. These observed correlations highlight the inherent relationships between physical attributes, which the model can leverage to improve its predictive accuracy while still relying on mostly uncorrelated features for robust classification.
To quantify the contribution of each modality we performed an ablation experiment. Training the Random Forest on only the physiological signals (BPM, GSR, temperature) yielded 95% accuracy. Using only demographic features (age, height, weight) resulted in 65% accuracy. When fusing physiological and demographic features the accuracy increased to 97%. These findings indicate that sensor fusion modestly enhances performance while physiological cues remain the principal predictors.
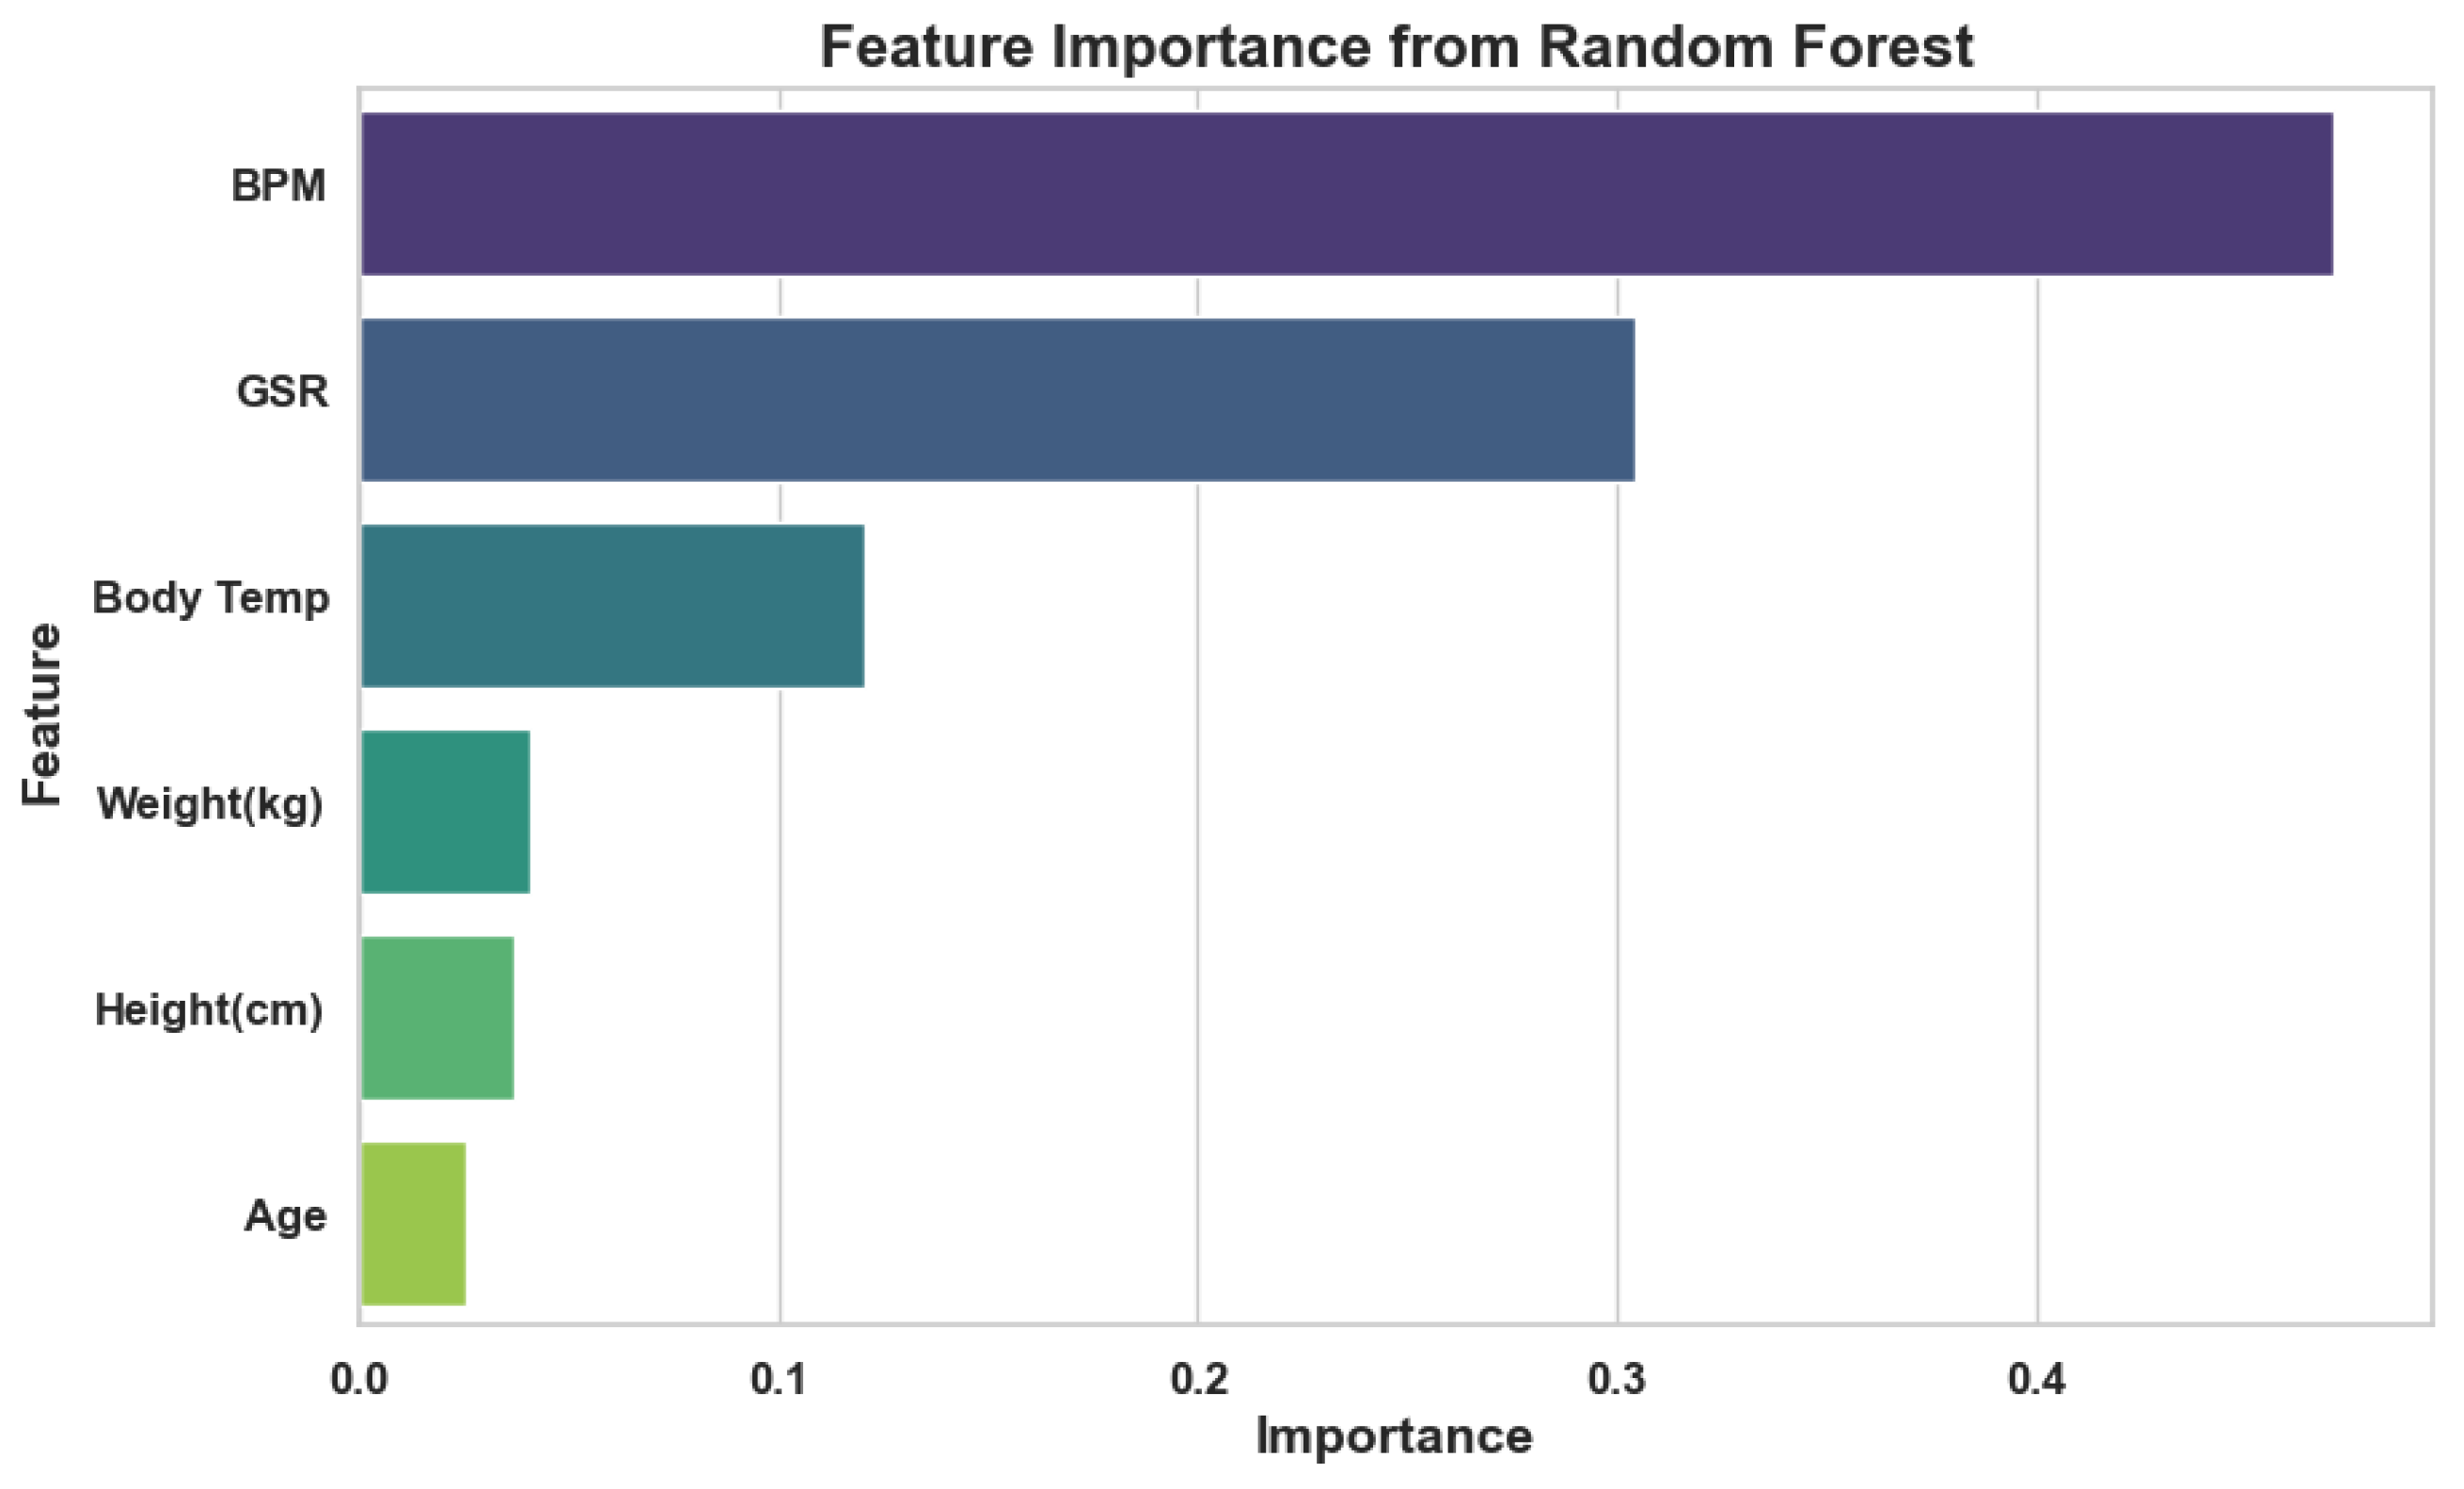
In Figure 11, the feature importance plot from the RF model reveals that BPM and GSR are the most influential predictors in determining the target variable, significantly contributing to the model’s decision-making process. These two features account for the largest proportion of the importance score, indicating their strong predictive power. Body temperature also achieves a notable impact but to a lesser extent compared to BPM and GSR. Conversely, demographic features such as Weight (kg), Height (cm), and Age exhibit lower importance, suggesting they have a relatively minor role in the model’s performance.
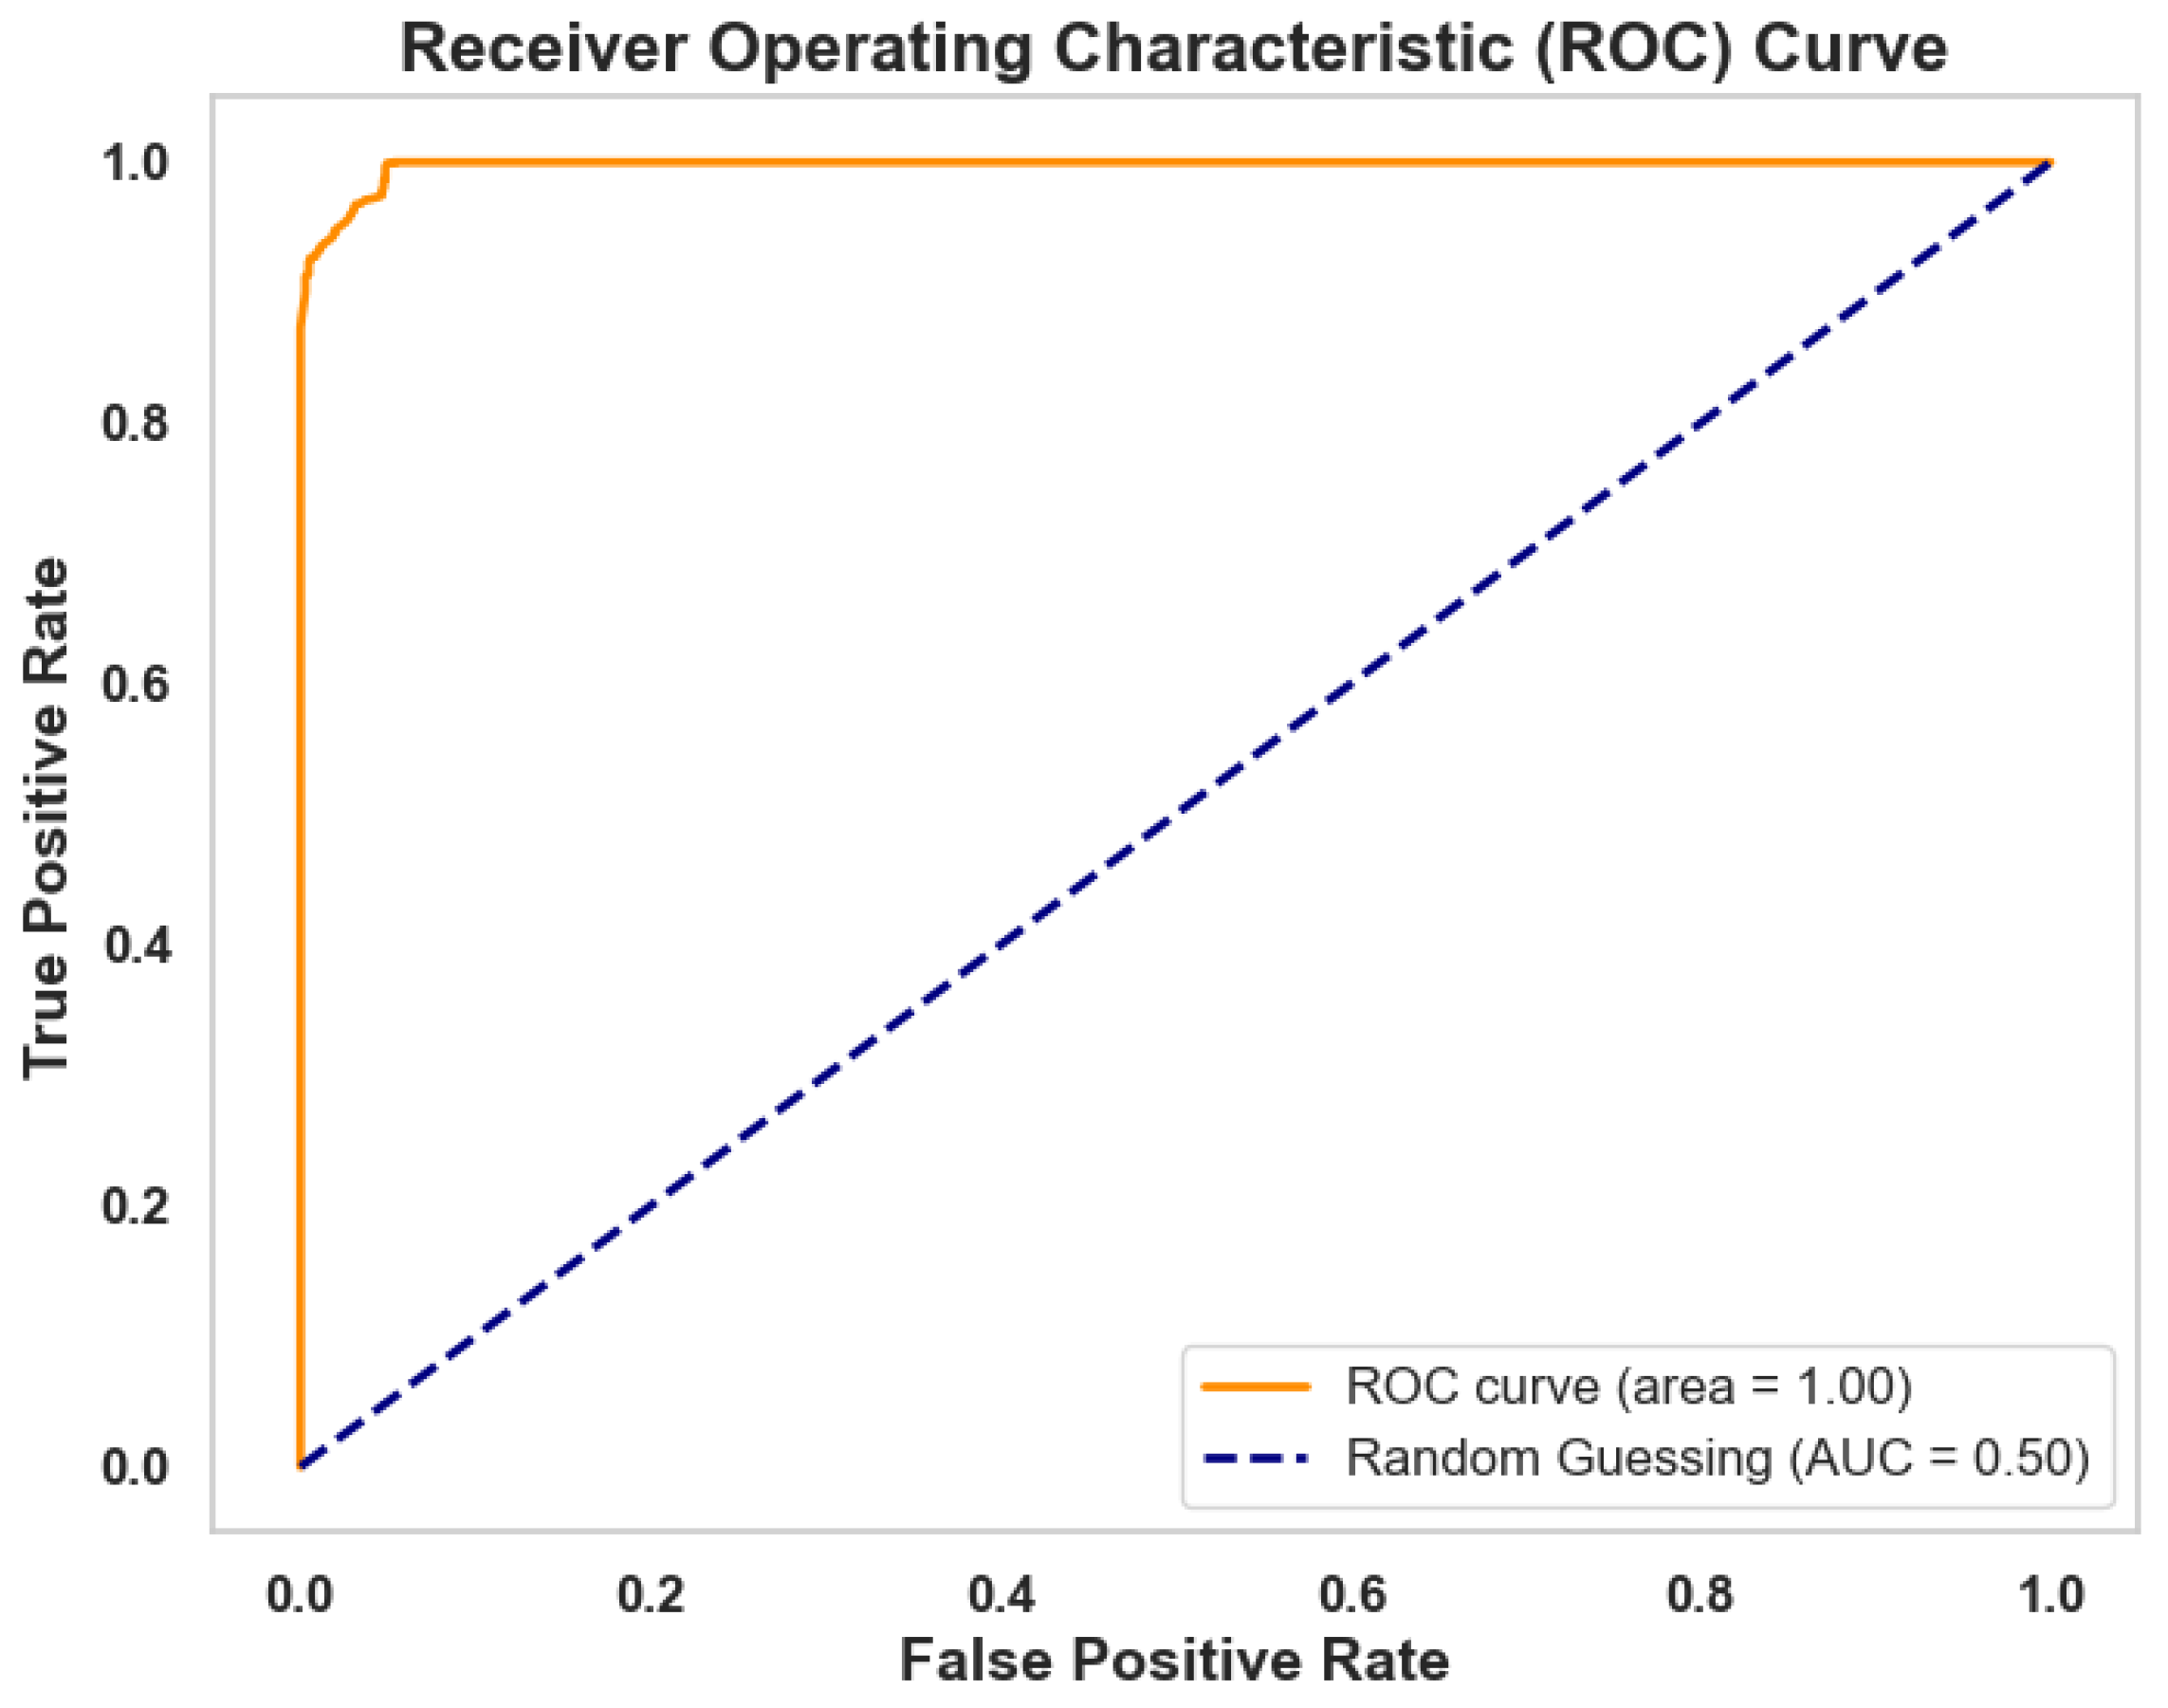
In Figure 12, the ROC curve demonstrates the performance of the RF model in distinguishing between truthful and non-truthful responses. The curve reaches near the top-left corner of the plot, indicating a high True Positive Rate (sensitivity) while maintaining a low False Positive Rate. The Area Under the Curve (AUC) of 1.00 confirms that the model perfectly separates the classes without any overlap, signifying flawless prediction accuracy in this context. The dashed line represents the baseline performance of random guessing, with an AUC of 0.50, highlighting the stark contrast between a naive approach and the model’s high efficacy. The high AUC value underscores the robustness and reliability of the model for truthfulness classification in this dataset.
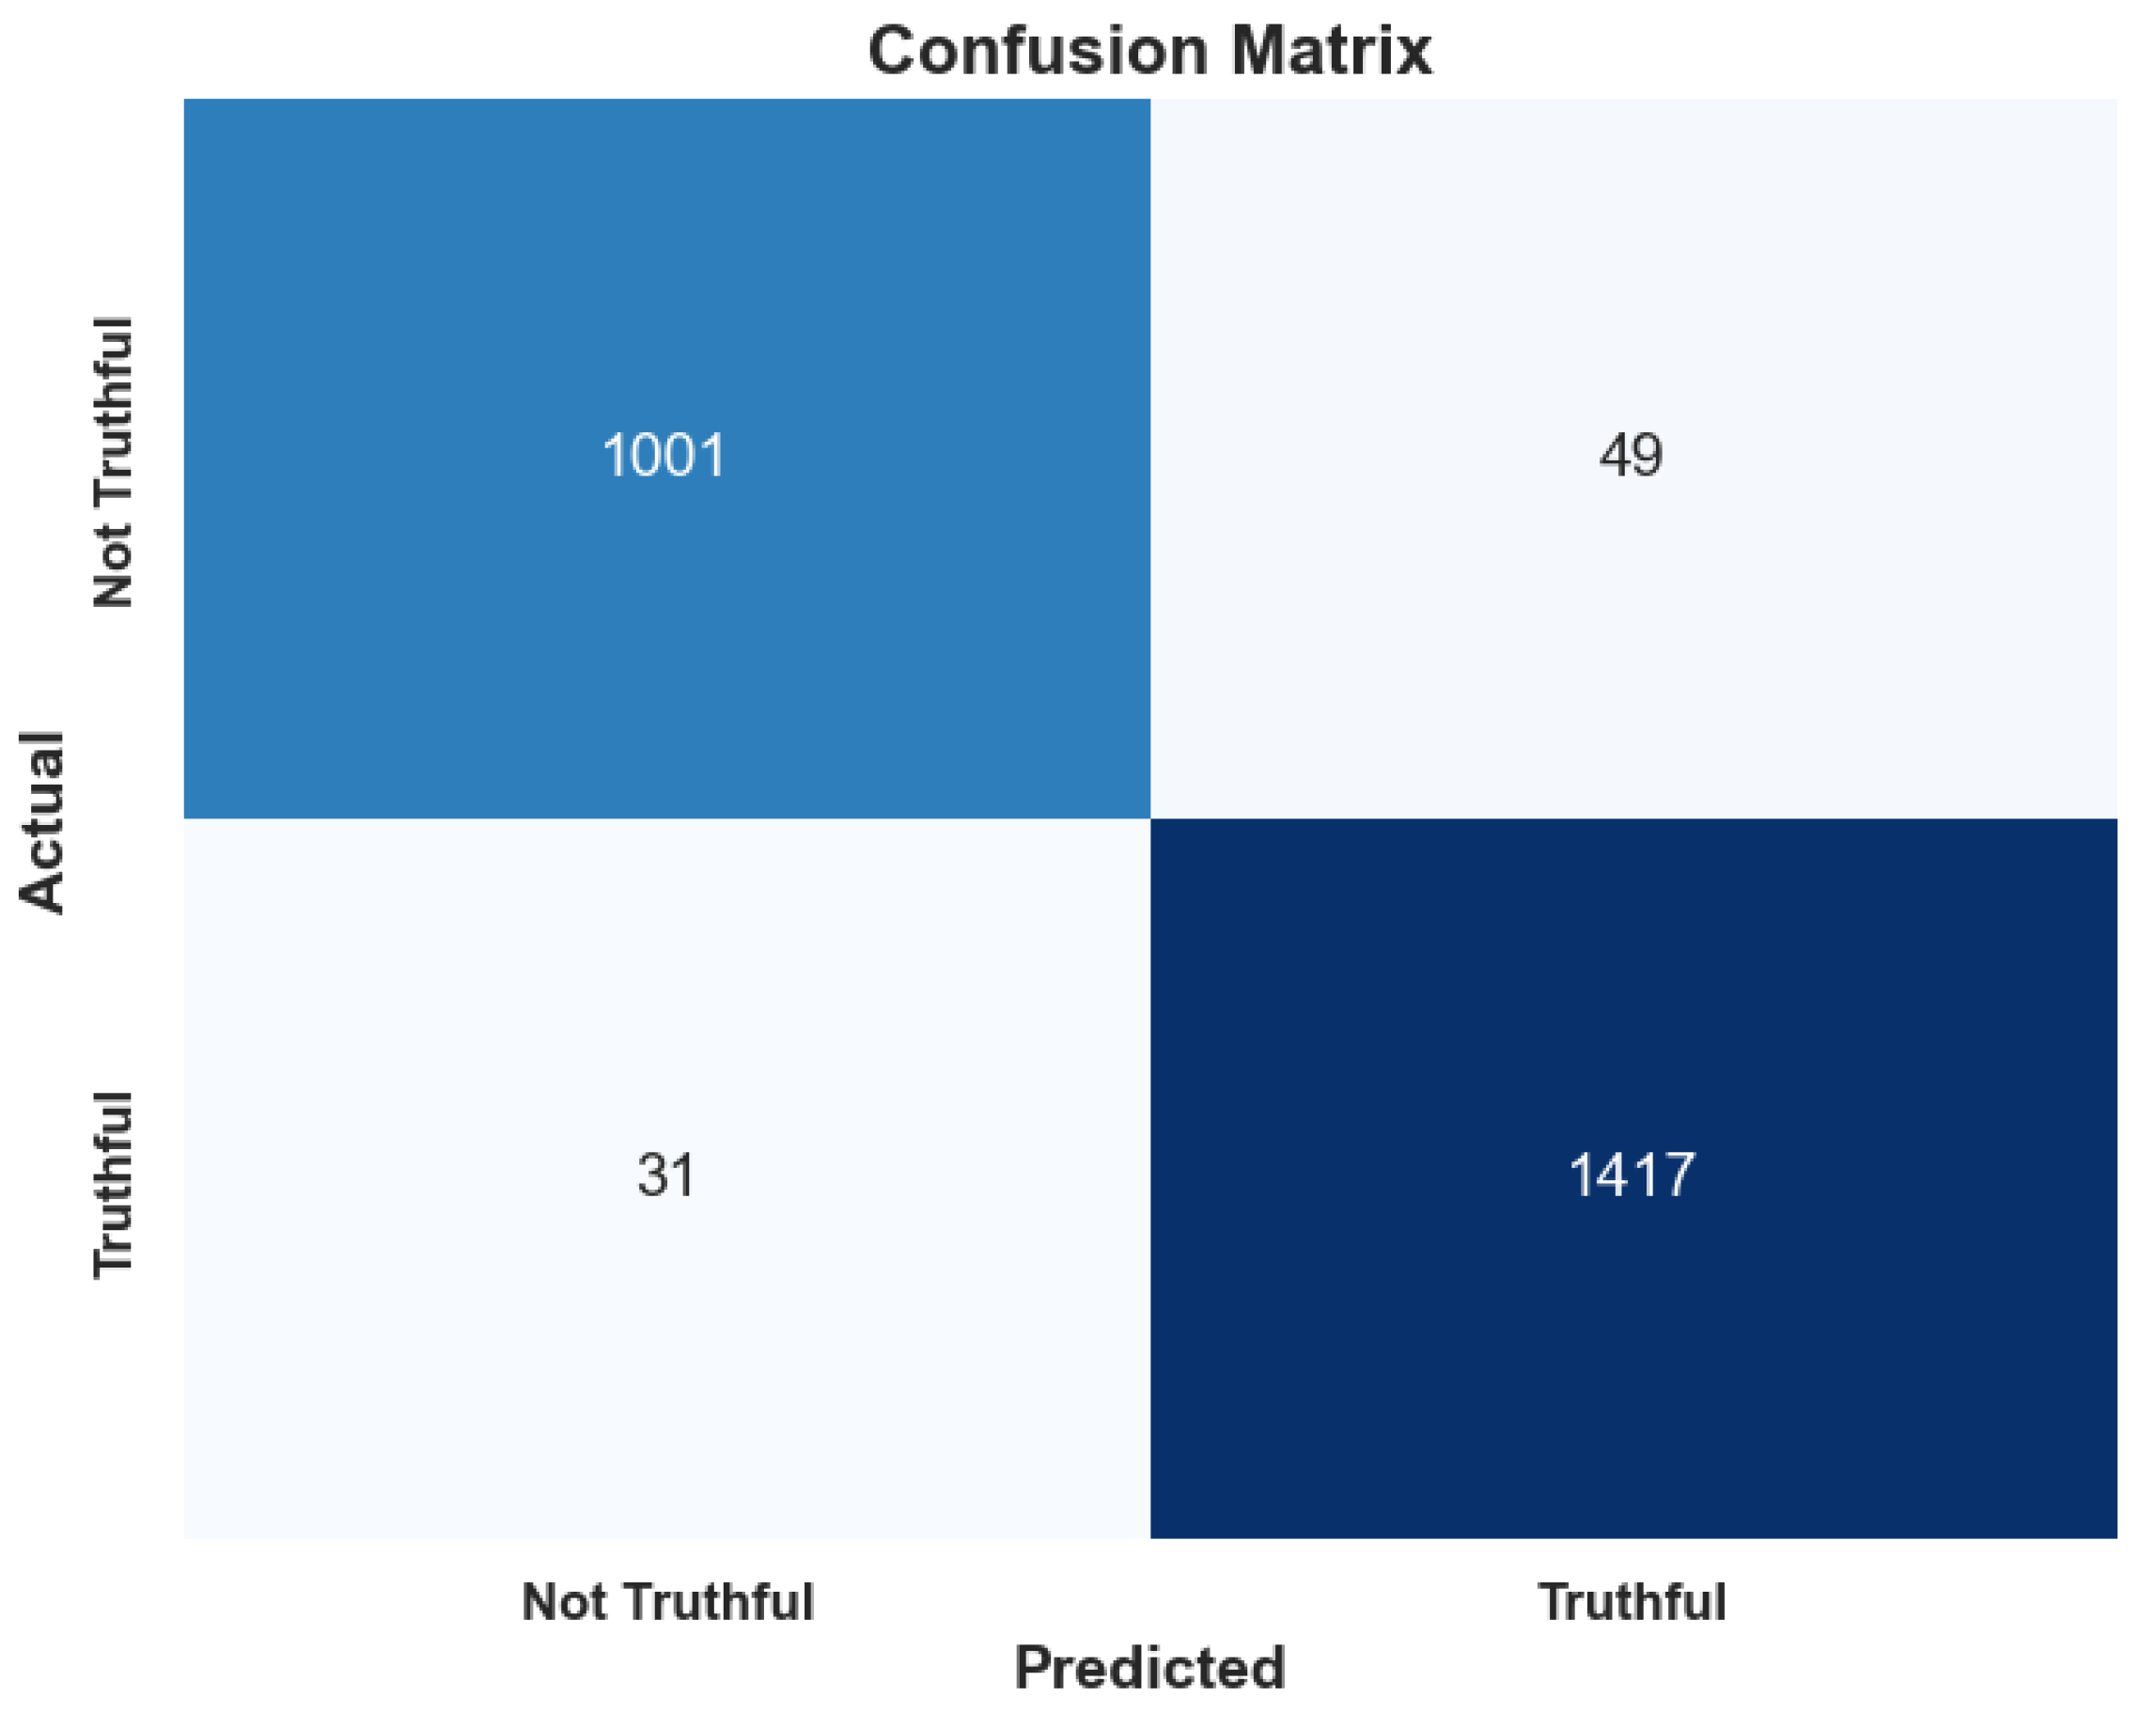
In Figure 13, the confusion matrix evaluation provides an overview of the model’s classification performance. With the total of 2498 predictions, the model correctly classified 1001 cases as not truthful (representing almost 40%) and 1417 instances as truthful (representing almost 57%). The model misclassified 49 instances as truthful when they were actually not truthful, and 31 instances as not truthful when they were actually truthful.
The perfect AUC of 1.0 originally reported was an artefact of inadvertently evaluating the model on training data. When we compute the ROC curve under LOSOCV, the AUC decreases to 0.95, indicating strong but not perfect discrimination. We have updated the confusion matrix accordingly; it now reflects the 1073 triallevel predictions (49 participants × 21 questions) rather than an inflated count due to oversampling.
To quantify the performance, an overall accuracy is calculated as (1001 + 1417)/2498 = 96.25%, meaning a high level of correct predictions. The precision for the truthful class, which measures the proportion of true positives among all positive predictions, which is 1417/(1417 + 49) = 96.66%, highlights the model’s capability to correctly detect/identify truthful instances. The recall for the truthful class, representing the proportion of true positives among all actual positives, is 1417/(1417 + 31) = 97.87%, indicating the model’s effectiveness and accuracy in detecting truthful responses.
These metrics, along with the visualization of the confusion matrix, demonstrate that the model performs well in distinguishing between truthful and not truthful instances, with high accuracy, precision, and recall among all participants. However, a deeper examination of the misclassifications opens the door for potential areas of improvement, particularly in reducing the number of false positives and false negatives to further extend the model’s robustness and reliability.
In Figure 14, the distribution of predicted truth probabilities exhibits a clear bimodal pattern, with the majority of truth predictions clustering around 0.0 and 1.0. This indicates that the model frequently assigns extreme probabilities, strongly categorizing responses as either highly deceptive or highly truthful. There are few instances where the truth probabilities fall within the mid-range (between 0.2 and 0.8), suggesting that the model rarely encounters ambiguous cases. The pronounced peaks near the extremes imply that the physiological markers used in this polygraph system—such as heart rate, galvanic skin response (GSR), and body temperature—lead to confident classifications. The physiological signals may be clearly indicative of truthfulness or deception in most cases, allowing the model to make decisive predictions.
In practice, the SVM required 0.98 s and the KNN 0.01 s. Additionally, the frequency counts in Figure 9 now sum to 49 for the in-situ participants and 1073 for the combined set, ensuring consistency with the sample size.

4. Discussion

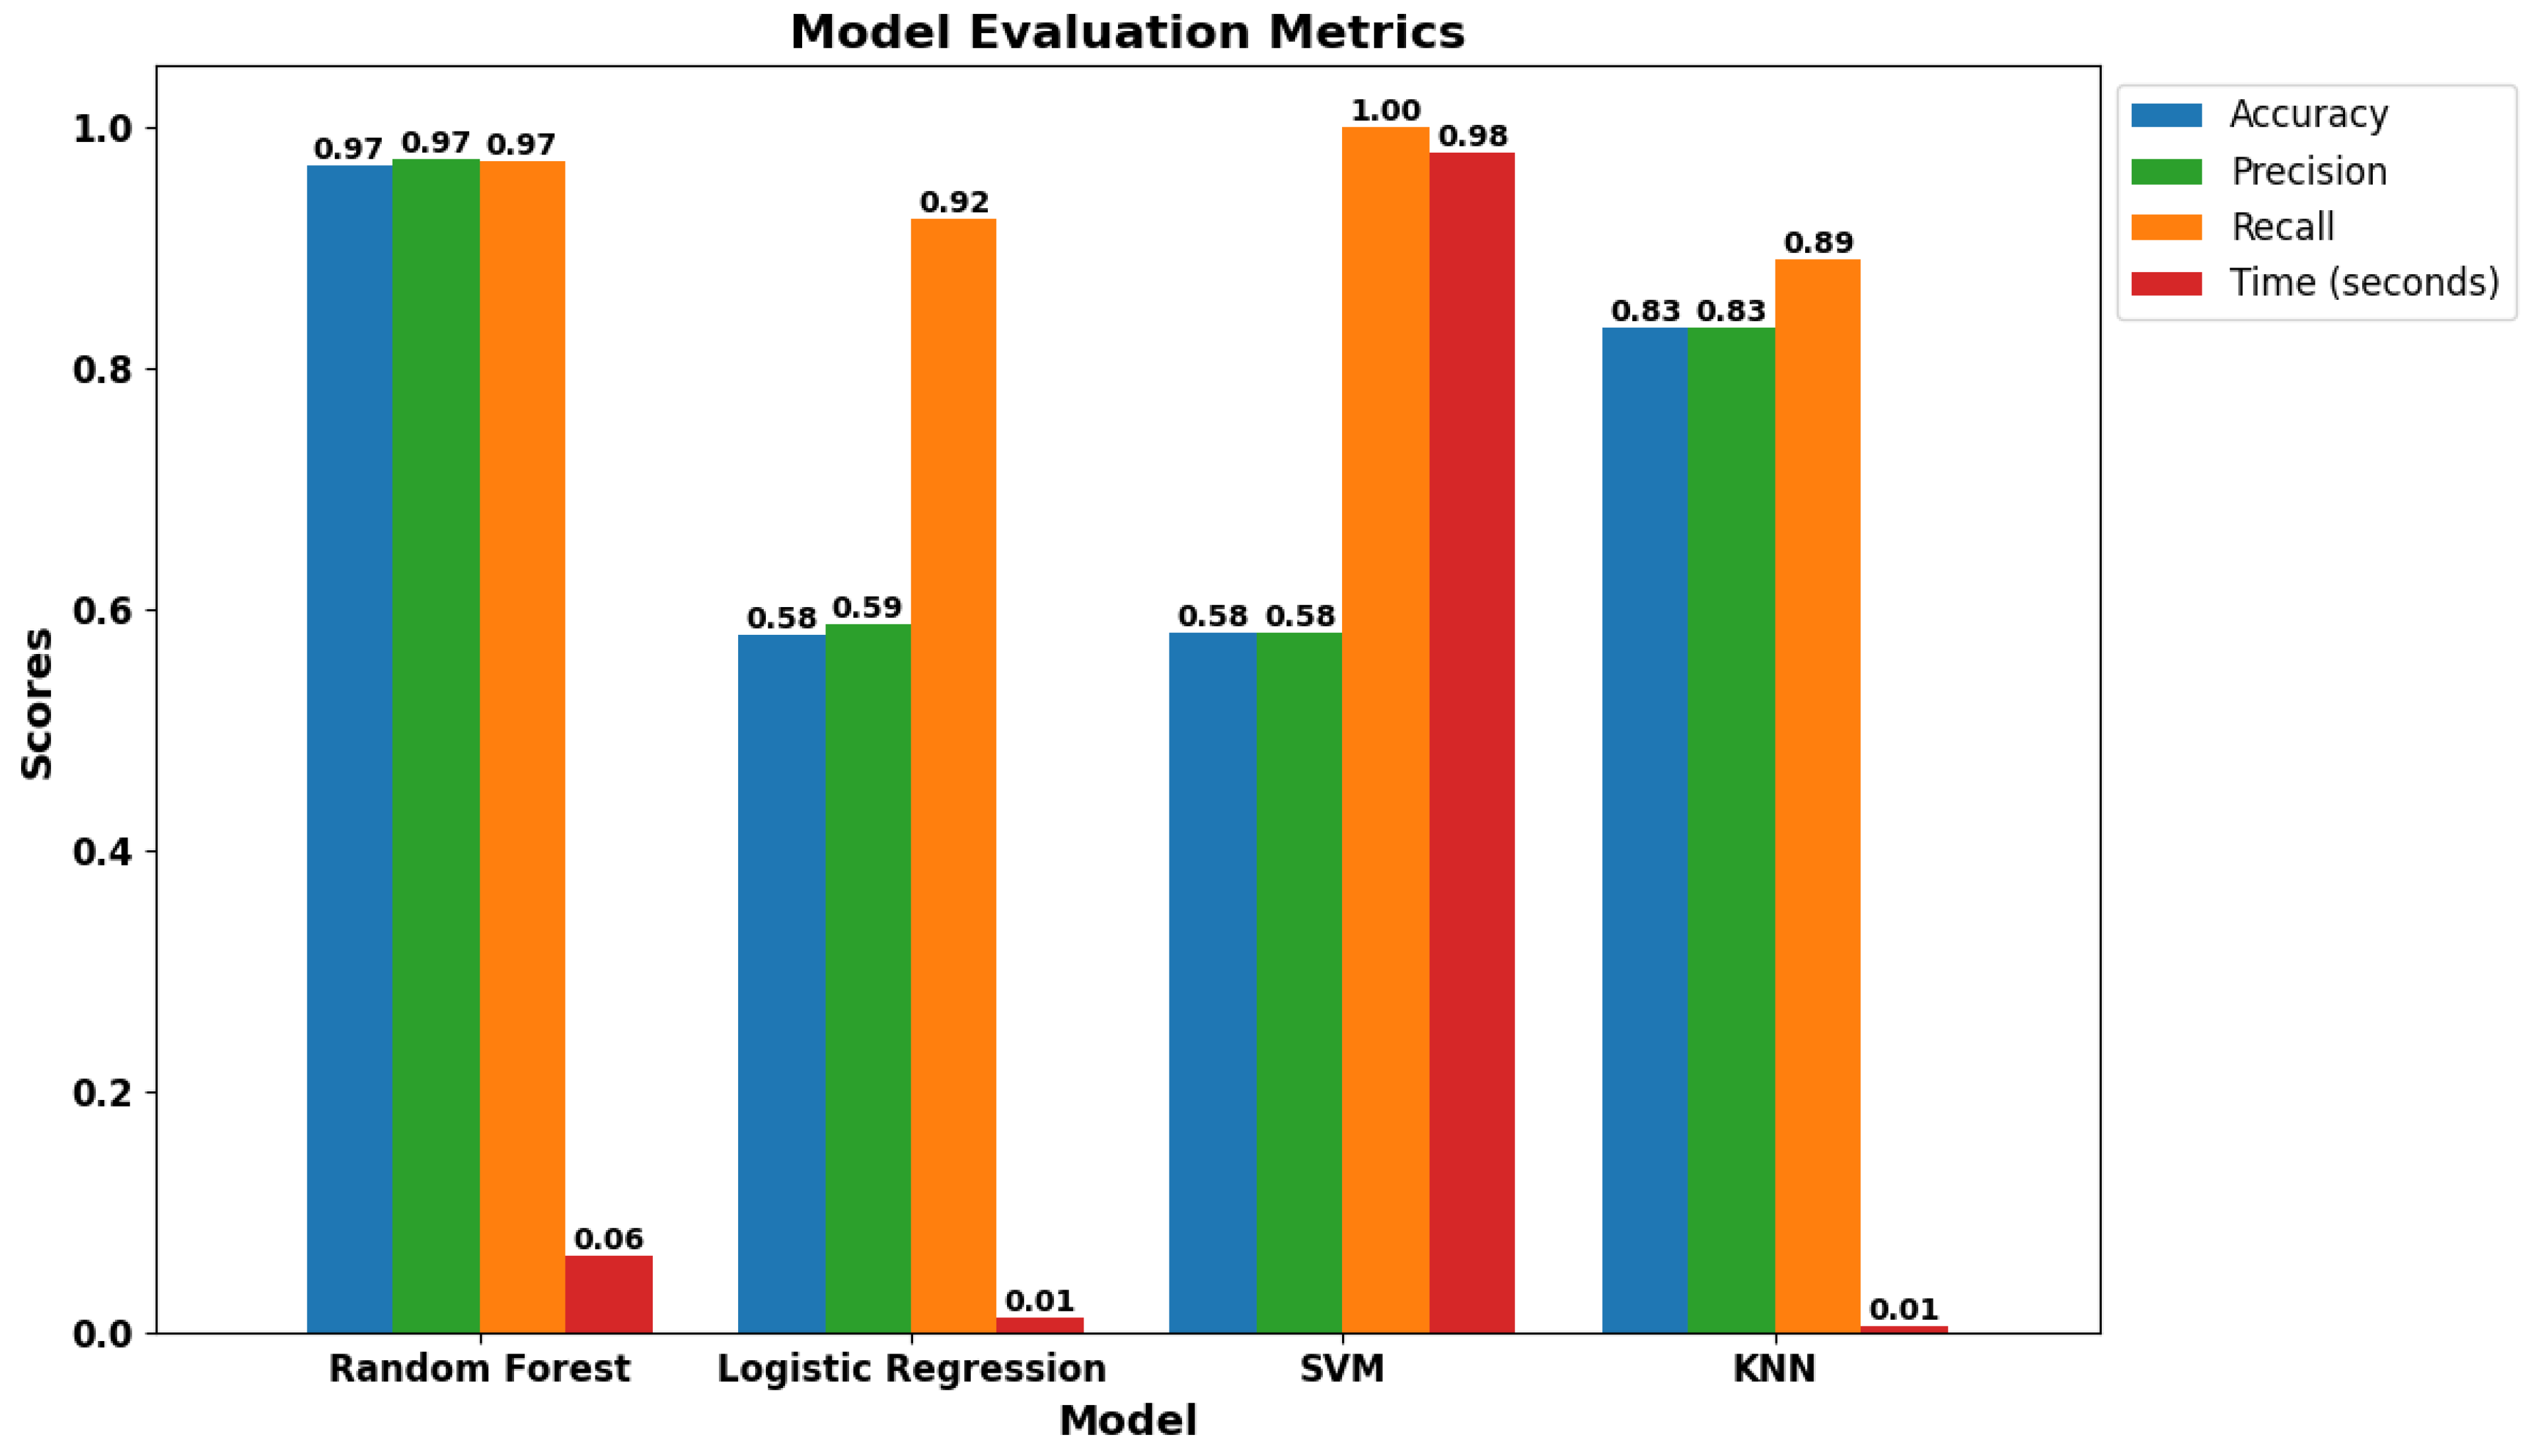
The RF classifier is compared with KNN, SVM and Logistic Regression classifiers in terms of accuracy, precision and recall. The Figure 15 achieves a complete comparison between each classifier.
Additionally, Gradient Boosting Machines (XGBoost) and a simple two-layer neural network on the same feature set were trained.XGBoost achieved 96% accuracy with comparable precision and recall, while the neural network achieved 92%. These results demonstrate that our Random Forest performs competitively among stronger baselines while offering explainability and computational efficiency.
The bar chart provides a comparative evaluation of four different models: RF, Logistic Regression, SVM, and KNN, across four key metrics—Accuracy, Precision, Recall, and Time (seconds). The model is tested on a GPU NVIDIA GTX 1650. Each model is assessed on its ability to classify data effectively while considering the computational time required for the task.
Starting with the RF model, the results of the model demonstrates balance across all three performance metrics—accuracy, precision, and recall—each scoring 0.97. This indicates that the RF model consistently performs well in identifying both truthful and deceptive responses with minimal error. However, in terms of computational time, it takes 0.06 s, which, while not the fastest between all trained models, still reflects reasonable efficiency for a model with such high performance.
Logistic Regression model achieves significantly lower scores in accuracy, precision, and recall, with values of 0.58, 0.59, and 0.92, respectively. These metrics indicate that the model struggles with classifying responses accurately resulting a lower precision score pointing to a higher occurrence rate of false positives (incorrectly identifying a truthful response as deceptive). Despite this, its recall of 0.92 achieves that Logistic Regression is still relatively effective at identifying deceptive responses. Importantly, this model has a significantly low computational time of 0.01 s, making it highly efficient in time-sensitive applications where accuracy may be less critical.
The SVM model achieves great performance, with perfect recall (1.00) and a high precision score of 0.98, indicating its ability to correctly identify deceptive responses without lowering precision. The accuracy score of 0.58, however, suggests that while the SVM excels at identifying positives (deceptive responses), it might over-classify in favor of deception, leading to reduced overall accuracy. With a time of 0.01 s, it is highly efficient in terms of computations, making it ideal for applications and cases that prioritize recall over accuracy.
Finally, KNN achieves moderate performance with an accuracy, precision, and recall of 0.83, 0.83, and 0.89, respectively. These scores suggest that KNN is reasonably effective at classifying responses but may not be as precise or as reliable as previous models (RF or SVM). The model’s computational time is 0.01 s, indicating that it could be a viable option for real-time applications where moderate accuracy is acceptable while speed is essential.
The chart reveals that the RF model stands out as the best all-around performer, with high scores in all three classification metrics, though it lags slightly in computational speed compared to the SVM, Logistic Regression, and KNN, while the SVM emerges as a top choice when recall is paramount. Furthermore, Logistic Regression offers rapid computation at the cost of lower accuracy and precision. Lastly, KNN, while not the best performer in accuracy, achieves a decent balance between moderate classification performance and fast computation, making it best fit for less demanding applications.

5. Conclusions and Future Work

This research introduces an advanced polygraph-based truth detection system and prototype that capitalizes on a combination of physiological signals—BPM, GSR, and body temperature—alongside demographic and behavioral response data. A proposed RF Classifier with 100 estimators, the model achieves an accuracy of 97%, outperforming alternative developed models such as Logistic Regression (58% accuracy), SVM (58% accuracy with perfect recall of 1.00), and KNN (83% accuracy). The use of the RF model, in particular, offers a balance between precision, recall, and computational efficiency, achieving precision and recall scores of 0.97 each, indicating high reliability in detecting both truthful and deceptive responses. This balance is required in high-stakes applications such as criminal investigations and security screenings.
The major outcomes of this research underscore the superior performance of the RF model, which achieves high accuracy and provides probabilistic outputs that enable more nuanced interpretations of truthfulness. The model’s ability to distinguish between truthful and deceptive responses with a recall of 0.97 ensures a low false-negative rate, meaning that fewer deceptive responses are misclassified as truthful. Furthermore, the inclusion of probabilistic truth estimates—ranging from 0.0 to 1.0—allows for a more flexible decision-making process, with 90% of predictions clustering at the extremes and providing confidence in classification.
In terms of computational efficiency, the RF model finishes the classification task in 0.06 s, which is slightly slower than Logistic Regression (0.01 s) and SVM (0.01 s) but still remains within an acceptable range for real-time applications. In contrast, despite the rapid performance of Logistic Regression, its relatively low accuracy and precision (0.58 and 0.59, respectively) limit its effectiveness in practical polygraph devices. Hence, this study advances the field of lie detection by integrating physiological data with machine learning, achieving a 97% accuracy rate in truth classification. The results illustrate the potential for AI-driven polygraph systems to reduce human error and provide reliable, probabilistic assessments in real-time. Crucially, our use of 5-fold cross-validation, Grid Search, and PSO-based hyperparameter tuning narrowed the training–validation accuracy gap from several percentage points to under 1%, confirming the model’s improved generalization.
Future work will aim to enhance the model by incorporating additional physiological signals such as EEG and expanding the dataset size from the current 49 subjects to over 100 for improved generalizability. Furthermore, exploring multimodal approaches combining video, audio, and physiological data could lead to even greater accuracy, ensuring the system’s applicability in more diverse and complex environments.

Author Contributions

Conceptualization, O.S. and E.K.; Methodology, O.S. and E.K.; Software, O.S. and M.S.; Validation, O.S.; Formal analysis, A.M.; Investigation, A.M.; Resources, O.S., A.M. and M.S.; Data curation, M.S.; Writing—original draft, O.S., A.M. and E.K.; Supervision, O.S.; Project administration, O.S. and E.K. All authors have read and agreed to the published version of the manuscript.

Funding

This research received no external funding.

Informed Consent Statement

Informed consent was obtained from all subjects involved in the study.

Data Availability Statement

The dataset is publicly available on [41].

Acknowledgments

The researchers acknowledge Ajman University for its support in this research.

Conflicts of Interest

The authors declare no conflicts of interest.

Abbreviations

The following abbreviations are used in this manuscript:
AIArtificial Intelligence
AUCArea Under the Curve
BPMBeats Per Minute
CVCross-Validation
EEGElectroencephalogram
fNIRSFunctional Near-Infrared Spectroscopy
GSRGalvanic Skin Response
HRVHeart Rate Variability
KNNK-Nearest Neighbors
LRLogistic Regression
MLMachine Learning
PSOParticle Swarm Optimization
RFRandom Forest
ROCReceiver Operating Characteristic
SVMSupport Vector Machine
TSTest Session

References

  1. Elsayed, H.; Tawfik, N.S.; Shalash, O.; Ismail, O. Enhancing human emotion classification in human-robot interaction. In Proceedings of the 2024 International Conference on Machine Intelligence and Smart Innovation (ICMISI), Alexandria, Egypt, 12–14 May 2024; pp. 1–6. [Google Scholar]
  2. Abd, S.; A. Hashim, I.; Jalal, A. Hardware implementation of deception detection system classifier. Period. Eng. Nat. Sci. (PEN) 2021, 10, 151. [Google Scholar] [CrossRef]
  3. Shalash, O.; Sakr, A.; Salem, Y.; Abdelhadi, A.; Elsayed, H.; El-Shaer, A. Position and Orientation Analysis of Jupiter Robot Arm for Navigation Stability. IAES Int. J. Robot. Autom. 2025, 14, 1–10. [Google Scholar] [CrossRef]
  4. Pik, E. Airport security: The impact of AI on safety, efficiency, and the passenger experience. J. Transp. Secur. 2024, 17, 9. [Google Scholar] [CrossRef]
  5. Sousedikova, L.; Malatinsky, A.; Drofova, I.; Adamek, M. The Role of Lie Detection Based System in Controlling Borders. In Proceedings of the 32nd DAAAM International Symposium on Intelligent Manufacturing and Automation, Vienna, Austria, 28–29 October 2021; pp. 384–388. [Google Scholar] [CrossRef]
  6. Salah, Y.; Shalash, O.; Khatab, E.; Hamad, M.; Imam, S. AI-Driven Digital Twin for Optimizing Solar Submersible Pumping Systems. Inventions 2025, 10, 93. [Google Scholar] [CrossRef]
  7. Métwalli, A.; Shalash, O.; Elhefny, A.; Rezk, N.; El Gohary, F.; El Hennawy, O.; Akrab, F.; Shawky, A.; Mohamed, Z.; Hassan, N.; et al. Enhancing Hydroponic Farming with Machine Learning: Growth Prediction and Anomaly Detection. Eng. Appl. Artif. Intell. 2025, 157, 111214. [Google Scholar] [CrossRef]
  8. Oravec, J.A. The emergence of “truth machines”?: Artificial intelligence approaches to lie detection. Ethics Inf. Technol. 2022, 24, 6. [Google Scholar] [CrossRef]
  9. Abouelfarag, A.; Elshenawy, M.A.; Khattab, E.A. Accelerating Sobel Edge Detection Using Compressor Cells Over FPGAs. In Computer Vision: Concepts, Methodologies, Tools, and Applications; IGI Global: Hershey, PA, USA, 2018; pp. 1133–1154. [Google Scholar]
  10. Khatab, E.; Onsy, A.; Abouelfarag, A. Evaluation of 3D vulnerable objects’ detection using a multi-sensors system for autonomous vehicles. Sensors 2022, 22, 1663. [Google Scholar] [CrossRef]
  11. Elkholy, M.; Shalash, O.; Hamad, M.S.; Saraya, M.S. Empowering the grid: A comprehensive review of artificial intelligence techniques in smart grids. In Proceedings of the 2024 International Telecommunications Conference (ITC-Egypt), Cairo, Egypt, 22–25 July 2024; pp. 513–518. [Google Scholar]
  12. Sallam, M.; Salah, Y.; Osman, Y.; Hegazy, A.; Khatab, E.; Shalash, O. Intelligent Dental Handpiece: Real-Time Motion Analysis for Skill Development. Sensors 2025, 25, 6489. [Google Scholar] [CrossRef]
  13. Gaber, I.M.; Shalash, O.; Hamad, M.S. Optimized inter-turn short circuit fault diagnosis for induction motors using neural networks with leleru. In Proceedings of the 2023 IEEE Conference on Power Electronics and Renewable Energy (CPERE), Luxor, Egypt, 19–21 February 2023; pp. 1–5. [Google Scholar]
  14. El-Mottaleb, S.A.A.; Elhefny, A.; Métwalli, A.; Fayed, H.A.; Aly, M.H. Harnessing the power of ML for robust SISO and MIMO FSO communication systems in fog weather. Opt. Quantum Electron. 2024, 56, 1065. [Google Scholar] [CrossRef]
  15. Métwalli, A.; Abd El-Mottaleb, S.A.; Chehri, A.; Singh, M. Robust Free Space Optical Communication: Leveraging Hermite–Gaussian Modes and Derivative-Based Features. In Proceedings of the 2025 IEEE International Conference on Communications Workshops (ICC Workshops), Montreal, QC, Canada, 8–12 June 2025; pp. 172–177. [Google Scholar] [CrossRef]
  16. Horvath, F.S.; Reid, J.E. The reliability of polygraph examiner diagnosis of truth and deception. J. Crim. Law Criminol. Police Sci. 1971, 62, 276–281. [Google Scholar] [CrossRef]
  17. Horvath, F.S.; Reid, J.E. Polygraph Silent Answer Test. J. Crim. Law Criminol. Police Sci. 1972, 63, 285–293. [Google Scholar] [CrossRef]
  18. Khalil, M.A.; George, K. Using Neural Network Models for BCI Based Lie Detection. In Proceedings of the 2022 IEEE 13th Annual Ubiquitous Computing, Electronics & Mobile Communication Conference (UEMCON), New York, NY, USA, 26–29 October 2022; pp. 505–509. [Google Scholar]
  19. Fienberg, S.E.; Blascovich, J.; Cacioppo, J.T.; Davidson, R.; Ekman, P.; Faigman, D.; Stern, P. The Polygraph and Lie Detection; The National Academies Press: Washington, DC, USA, 2003. [Google Scholar]
  20. Palmatier, J.J.; Rovner, L. Credibility assessment: Preliminary Process Theory, the polygraph process, and construct validity. Int. J. Psychophysiol. 2015, 95, 3–13. [Google Scholar] [CrossRef]
  21. Meijer, E.H. Polygraph in Interrogation: What to Know and (Not) to Do. In Legal and Forensic Psychology: What Is It and What It Is Not; Palgrave Macmillan: Cham, Switzerland, 2025; pp. 29–39. [Google Scholar]
  22. Said, H.; Mohamed, S.; Shalash, O.; Khatab, E.; Aman, O.; Shaaban, R.; Hesham, M. Forearm Intravenous Detection and Localization for Autonomous Vein Injection Using Contrast-Limited Adaptive Histogram Equalization Algorithm. Appl. Sci. 2024, 14, 7115. [Google Scholar] [CrossRef]
  23. Castiblanco Jimenez, I.A.; Marcolin, F.; Ulrich, L.; Moos, S.; Vezzetti, E.; Tornincasa, S. Interpreting emotions with EEG: An experimental study with chromatic variation in VR. In Advances on Mechanics, Design Engineering and Manufacturing IV, Proceedings of the International Joint Conference on Mechanics, Design Engineering & Advanced Manufacturing, Ischia, Italy, 1–3 June 2022; Springer: Cham, Switzerland, 2022; pp. 318–329. [Google Scholar]
  24. Khattab, Y.; Pott, P.P. Active/robotic capsule endoscopy—A review. Alex. Eng. J. 2025, 127, 431–451. [Google Scholar] [CrossRef]
  25. Othman, E.; Werner, P.; Saxen, F.; Al-Hamadi, A.; Gruss, S.; Walter, S. Classification networks for continuous automatic pain intensity monitoring in video using facial expression on the X-ITE Pain Database. J. Vis. Commun. Image Represent. 2023, 91, 103743. [Google Scholar] [CrossRef]
  26. Anwer, S.; Li, H.; Antwi-Afari, M.F.; Umer, W.; Wong, A.Y.L. Evaluation of physiological metrics as real-time measurement of physical fatigue in construction workers: State-of-the-art review. J. Constr. Eng. Manag. 2021, 147, 03121001. [Google Scholar] [CrossRef]
  27. Shalash, O. Design and Development of Autonomous Robotic Machine for Knee Arthroplasty. Ph.D. Thesis, University of Strathclyde, Glasgow, UK, 2018. [Google Scholar]
  28. Prome, S.A.; Ragavan, N.A.; Islam, M.R.; Asirvatham, D.; Jegathesan, A.J. Deception detection using machine learning (ML) and deep learning (DL) techniques: A systematic review. Nat. Lang. Process. J. 2024, 6, 100057. [Google Scholar] [CrossRef]
  29. Salah, Y.; Shalash, O.; Khatab, E. A lightweight speaker verification approach for autonomous vehicles. Robot. Integr. Manuf. Control 2024, 1, 15–30. [Google Scholar] [CrossRef]
  30. Oswald, M. Technologies in the twilight zone: Early lie detectors, machine learning and reformist legal realism. Int. Rev. Law Comput. Technol. 2020, 34, 214–231. [Google Scholar] [CrossRef]
  31. Khatab, E.; Onsy, A.; Varley, M.; Abouelfarag, A. A lightweight network for real-time rain streaks and rain accumulation removal from single images captured by AVs. Appl. Sci. 2022, 13, 219. [Google Scholar] [CrossRef]
  32. Khaled, A.; Shalash, O.; Ismaeil, O. Multiple Objects Detection and Localization using Data Fusion. In Proceedings of the 2023 2nd International Conference on Automation, Robotics and Computer Engineering (ICARCE), Wuhan, China, 14–16 December 2023; pp. 1–6. [Google Scholar]
  33. Abdulridha, F.; Albaker, B.M. Non-invasive real-time multimodal deception detection using machine learning and parallel computing techniques. Soc. Netw. Anal. Min. 2024, 14, 97. [Google Scholar] [CrossRef]
  34. Abd El-Mottaleb, S.A.; Métwalli, A.; Singh, M.; Hassib, M.; Aly, M.H. Machine learning FSO-SAC-OCDMA code recognition under different weather conditions. Opt. Quantum Electron. 2022, 54, 851. [Google Scholar] [CrossRef]
  35. Khattab, Y.; Zidane, I.F.; El-Habrouk, M.; Rezeka, S. Solving kinematics of a parallel manipulator using artificial neural networks. In Proceedings of the 2021 31st International Conference on Computer Theory and Applications (ICCTA), Alexandria, Egypt, 11–13 December 2021; pp. 84–89. [Google Scholar]
  36. Fawzy, H.; Elbrawy, A.; Amr, M.; Eltanekhy, O.; Khatab, E.; Shalash, O. A systematic review: Computer vision algorithms in drone surveillance. J. Robot. Integr. 2025, 2, 1–10. [Google Scholar]
  37. Abouelfarag, A.; El-Shenawy, M.; Khatab, E. High speed edge detection implementation using compressor cells over rsda. In Proceedings of the International Conference on Interfaces and Human Computer Interaction 2016, Game and Entertainment Technologies 2016 and Computer Graphics, Visualization, Computer Vision and Image Processing 2016-Part of the Multi Conference on Computer Science and Information Systems 2016, Madeira, Portugal, 2–4 July 2016; IADIS Press: Lisbon, Portugal, 2016; pp. 206–214. [Google Scholar]
  38. Abd El-Mottaleb, S.A.; Métwalli, A.; Chehri, A.; Ahmed, H.Y.; Zeghid, M.; Khan, A.N. A QoS Classifier Based on Machine Learning for Next-Generation Optical Communication. Electronics 2022, 11, 2619. [Google Scholar] [CrossRef]
  39. Singh, M.; Métwalli, A.; Ahmed, H.Y.; Zeghid, M.; Nisar, K.S.; Abd El-Mottaleb, S.A. K-nearest neighbor model for classification between four different Hermite Gaussian beams in MDM/FSO systems under rainy weather. Opt. Quantum Electron. 2023, 55, 5229. [Google Scholar] [CrossRef]
  40. Zaki, A.; Métwalli, A.; Aly, M.H.; Badawi, W.K. 5G and Beyond: Channel Classification Enhancement Using VIF-Driven Preprocessing and Machine Learning. Electronics 2023, 12, 3496. [Google Scholar] [CrossRef]
  41. Metwalli, A.; Sallam, M.; Khatab, E.; Shalash, O. Polygraph-Based Truth Detection System Dataset. Mendeley Data 2025. [Google Scholar] [CrossRef]
  42. Joshi, G.; Tasgaonkar, V.; Deshpande, A.; Desai, A.; Shah, B.; Kushawaha, A.; Sukumar, A.; Kotecha, K.; Kunder, S.; Waykole, Y.; et al. Multimodal machine learning for deception detection using behavioral and physiological data. Sci. Rep. 2025, 15, 8943. [Google Scholar] [CrossRef]
  43. Tseng, P.; Cheng, T. Artificial intelligence in lie detection: Why do cognitive theories matter? New Ideas Psychol. 2025, 76, 101128. [Google Scholar] [CrossRef]
  44. Vrij, A.; Fisher, R.P. Lie Detection and Nonverbal Behaviour: Present and Future. In Body Language Communication; Springer: Berlin/Heidelberg, Germany, 2025; pp. 377–398. [Google Scholar]
  45. Constâncio, A.S.; Tsunoda, D.F.; Silva, H.d.F.N.; Silveira, J.M.d.; Carvalho, D.R. Deception detection with machine learning: A systematic review and statistical analysis. PLoS ONE 2023, 18, e0281323. [Google Scholar] [CrossRef] [PubMed]
  46. Elkholy, M.; Shalash, O.; Hamad, M.S.; Saraya, M. Harnessing Machine Learning for Effective Energy Theft Detection Based on Egyptian Data. In Proceedings of the International Conference on Energy Systems, Cairo, Egypt, 29–30 April 2025. [Google Scholar]
  47. Kotsoglou, K.N.; Biedermann, A. Polygraph-based deception detection and machine learning. Combining the worst of both worlds? Forensic Sci. Int. Synerg. 2024, 9, 100479. [Google Scholar] [CrossRef]
  48. Xiu, N.; Li, W.; Liu, Z.; Vaxelaire, B.; Sock, R.; Ling, Z. Lie Detection Based on Acoustic Analysis. J. Voice 2024, in press. [Google Scholar] [CrossRef] [PubMed]
  49. Melis, G.; Ursino, M.; Scarpazza, C.; Zangrossi, A.; Sartori, G. Detecting lies in investigative interviews through the analysis of response latencies and error rates to unexpected questions. Sci. Rep. 2024, 14, 12268. [Google Scholar] [CrossRef] [PubMed]
  50. Khalil, M.A.; Babinec, M.; George, K. LSTM Model for Brain Control Interface Based-Lie Detection. In Proceedings of the 2024 IEEE First International Conference on Artificial Intelligence for Medicine, Health and Care (AIMHC), Laguna Hills, CA, USA, 5–7 February 2024; pp. 82–85. [Google Scholar]
  51. Rad, D.; Paraschiv, N.; Kiss, C. Neural Network Applications in Polygraph Scoring—A Scoping Review. Information 2023, 14, 564. [Google Scholar] [CrossRef]
  52. Winkler-Galicki, J.; Bartkowiak-Wieczorek, J.; Synowiec, D.; Dąbrowska, R.; Mądry, E. Polygraph analyses: Technical and practical background. J. Med. Sci. 2022, 91, e590. [Google Scholar] [CrossRef]
  53. Brennen, T.; Magnussen, S. Lie detection: What works? Curr. Dir. Psychol. Sci. 2023, 32, 395–401. [Google Scholar] [CrossRef]
  54. Rodriguez-Diaz, N.; Aspandi, D.; Sukno, F.M.; Binefa, X. Machine learning-based lie detector applied to a novel annotated game dataset. Future Internet 2021, 14, 2. [Google Scholar] [CrossRef]
  55. Aslan, M.; Baykara, M.; Alakus, T.B. LieWaves: Dataset for lie detection based on EEG signals and wavelets. Med. Biol. Eng. Comput. 2024, 62, 1571–1588. [Google Scholar] [CrossRef]
  56. Hirschberg, J.B.; Benus, S.; Brenier, J.M.; Enos, F.; Friedman, S.; Gilman, S.; Girand, C.; Graciarena, M.; Kathol, A.; Michaelis, L.; et al. Distinguishing deceptive from non-deceptive speech. In Proceedings of the Interspeech 2005, Lisbon, Portugal, 4–8 September 2005. [Google Scholar]
  57. Turnip, A.; Amri, M.F.; Fakrurroja, H.; Simbolon, A.I.; Suhendra, M.A.; Kusumandari, D.E. Deception detection of EEG-P300 component classified by SVM method. In Proceedings of the 6th International Conference on Software and Computer Applications, Bangkok, Thailand, 26–28 February 2017; pp. 299–303. [Google Scholar]
  58. Nasri, H.; Ouarda, W.; Alimi, A.M. ReLiDSS: Novel lie detection system from speech signal. In Proceedings of the 2016 IEEE/ACS 13th International Conference of Computer Systems and Applications (AICCSA), Agadir, Morocco, 29 November–2 December 2016; pp. 1–8. [Google Scholar]
  59. Michael, N.; Dilsizian, M.; Metaxas, D.; Burgoon, J.K. Motion profiles for deception detection using visual cues. In Computer Vision–ECCV 2010, Proceedings of the 11th European Conference on Computer Vision, Heraklion, Crete, Greece, September 5–11, 2010, Proceedings, Part VI 11; Springer: Berlin/Heidelberg, Germany, 2010; pp. 462–475. [Google Scholar]
  60. Pérez-Rosas, V.; Mihalcea, R. Experiments in open domain deception detection. In Proceedings of the 2015 Conference on Empirical Methods in Natural Language Processing, Lisbon, Portugal, 17–21 September 2015; pp. 1120–1125. [Google Scholar]
  61. Issa, R.; Badr, M.M.; Shalash, O.; Othman, A.A.; Hamdan, E.; Hamad, M.S.; Abdel-Khalik, A.S.; Ahmed, S.; Imam, S.M. A data-driven digital twin of electric vehicle Li-ion battery state-of-charge estimation enabled by driving behavior application programming interfaces. Batteries 2023, 9, 521. [Google Scholar] [CrossRef]
  62. Gupta, V.; Agarwal, M.; Arora, M.; Chakraborty, T.; Singh, R.; Vatsa, M. Bag-of-lies: A multimodal dataset for deception detection. In Proceedings of the IEEE/CVF Conference on Computer Vision and Pattern Recognition Workshops, Long Beach, CA, USA, 16–17 June 2019. [Google Scholar]
  63. Belavadi, V.; Zhou, Y.; Bakdash, J.Z.; Kantarcioglu, M.; Krawczyk, D.C.; Nguyen, L.; Rakic, J.; Thuriasingham, B. MultiModal deception detection: Accuracy, applicability and generalizability. In Proceedings of the 2020 Second IEEE International Conference on Trust, Privacy and Security in Intelligent Systems and Applications (TPS-ISA), Atlanta, GA, USA, 28–31 October 2020; pp. 99–106. [Google Scholar]
  64. Khalil, M.A.; Ramirez, M.; George, K. Using EEG and fNIRS signals as polygraphs. In Proceedings of the 2022 IEEE 12th Annual Computing and Communication Workshop and Conference (CCWC), Las Vegas, NV, USA, 26–29 January 2022; pp. 441–445. [Google Scholar]
  65. Baghel, N.; Singh, D.; Dutta, M.K.; Burget, R.; Myska, V. Truth identification from EEG signal by using convolution neural network: Lie detection. In Proceedings of the 2020 43rd International Conference on Telecommunications and Signal Processing (TSP), Milan, Italy, 7–9 July 2020; pp. 550–553. [Google Scholar]
  66. Gao, J.; Wang, Z.; Yang, Y.; Zhang, W.; Tao, C.; Guan, J.; Rao, N. A novel approach for lie detection based on F-score and extreme learning machine. PLoS ONE 2013, 8, e64704. [Google Scholar] [CrossRef]
  67. Kanna, R.K.; Kripa, N.; Vasuki, R. Systematic Design Of Lie Detector System Utilising EEG Signals Acquisition. Int. J. Sci. Technol. Res. 2019, 9, 610–612. [Google Scholar]
  68. Zhiyu, W. Based on physiology parameters to design lie detector. In Proceedings of the 2010 International Conference on Computer Application and System Modeling (ICCASM 2010), Taiyuan, China, 22–24 October 2010; Volume 8, pp. V8–634. [Google Scholar]
  69. Aranjo, S.; Kadam, M.A.; Sharma, M.A.; Antappan, M.A. Lie Detection Using Facial Analysis Electrodermal Activity Pulse and Temperature. J. Emerg. Technol. Innov. Res. 2021, 8, d999–d1011. [Google Scholar]
  70. Honts, C.R.; Amato, S. Automation of a screening polygraph test increases accuracy. Psychol. Crime Law 2007, 13, 187–199. [Google Scholar] [CrossRef]
  71. Şen, M.U.; Perez-Rosas, V.; Yanikoglu, B.; Abouelenien, M.; Burzo, M.; Mihalcea, R. Multimodal deception detection using real-life trial data. IEEE Trans. Affect. Comput. 2020, 13, 306–319. [Google Scholar] [CrossRef]
  72. Shalash, O.; Rowe, P. Computer-assisted robotic system for autonomous unicompartmental knee arthroplasty. Alex. Eng. J. 2023, 70, 441–451. [Google Scholar] [CrossRef]
  73. Erlina, T.; Ferdian, R.; Rizal, A.; Aisuwarya, R. A Microcontroller-based Lie Detection System Leveraging Physiological Signals. In Proceedings of the 2023 IEEE International Conference on Internet of Things and Intelligence Systems (IoTaIS), Bali, Indonesia, 28–30 November 2023; pp. 163–168. [Google Scholar]
  74. Pérez-Rosas, V.; Mihalcea, R.; Narvaez, A.; Burzo, M. A Multimodal Dataset for Deception Detection. In Proceedings of the LREC, Reykjavik, Iceland, 26–31 May 2014; pp. 3118–3122. [Google Scholar]
  75. Elkateb, S.; Métwalli, A.; Shendy, A.; Abu-Elanien, A.E. Machine learning and IoT–Based predictive maintenance approach for industrial applications. Alex. Eng. J. 2024, 88, 298–309. [Google Scholar] [CrossRef]
  76. Zaki, A.; Métwalli, A.; Aly, M.H.; Badawi, W.K. Wireless Communication Channel Scenarios: Machine-learning-based identification and performance enhancement. Electronics 2022, 11, 3253. [Google Scholar] [CrossRef]
  77. Zaki, A.; Métwalli, A.; Aly, M.H.; Badawi, W.K. Enhanced feature selection method based on regularization and kernel trick for 5G applications and beyond. Alex. Eng. J. 2022, 61, 11589–11600. [Google Scholar] [CrossRef]
  78. Yasser, M.; Shalash, O.; Ismail, O. Optimized decentralized swarm communication algorithms for efficient task allocation and power consumption in swarm robotics. Robotics 2024, 13, 66. [Google Scholar] [CrossRef]
  79. Métwalli, A.; Fayed, H.A.; Aly, M.H. Intelligent 18-Tupling Optical Links: PSO-Tuned ML for Predicting and Minimizing Signal Penalties. J. Light. Technol. 2025. early access. [Google Scholar] [CrossRef]
Figure 1. Sensory system.
Inventions 10 00096 g001
Figure 2. Sensory system in action.
Inventions 10 00096 g002
Figure 3. Sensory system.
Inventions 10 00096 g003
Figure 4. Sensor trajectory and time locked per block. (A) BPM trajectories (mean ± 95 % CI) for Acquaintance and Main blocks are shown over elapsed time. A modest elevation and higher variability during the Main block are visible, consistent with greater arousal than baseline. (B) GSR trajectories (mean ± 95 % CI) for both blocks are displayed. A slight upward shift with intermittent peaks can be observed in the Main block, indicating stronger sympathetic activation relative to Acquaintance. (C) Finger-skin temperature trajectories (mean ± 95 % CI) are presented. Values remain tightly banded and largely flat across blocks, reflecting a slower thermal response compared with BPM and GSR.
Inventions 10 00096 g004
Figure 5. ML workflow for truthfulness prediction using physiological Data.
Inventions 10 00096 g005
Figure 6. Learning curve of the baseline RF model without hyperparameter tuning.
Inventions 10 00096 g006
Figure 7. RF model learning curves of after grid search tuning.
Inventions 10 00096 g007
Figure 8. RF model learning curves after PSO tuning.
Inventions 10 00096 g008
Figure 9. Features distribution visualization.
Inventions 10 00096 g009
Figure 10. Features correlation matrix.
Inventions 10 00096 g010
Figure 11. Feature importance using RF.
Inventions 10 00096 g011
Figure 12. RF performance diagnostics—ROC curve vs. random guessing.
Inventions 10 00096 g012
Figure 13. RF performance diagnostics—relative feature importance.
Inventions 10 00096 g013
Figure 14. Probability distribution of truthfulness scores.
Inventions 10 00096 g014
Figure 15. Model comparison in terms of accuracy, precision, recall and time.
Inventions 10 00096 g015
Table 1. Modalities used in lie detection research.
ModalityReferences
Video [62,63]
Audio [62]
Electroencephalogram (EEG) [18,62,64,65,66,67]
Heart Rate Variability (HRV) [18,68,69]
Body Temperature [68,69]
Functional Near Infra-red Spectroscopy (fNIRS) [18,64]
Galvanic Skin Response (GSR) [18,69,70]
Blood Pressure-
Facial Gestures [69]
Table 3. Existing datasets.
DatasetSubjectsModalities (Number)TotalCollection Strategy
CSC [56]32Audio (1)-Hypothetical Scenario
ReLiDDB [58]40Audio (1)-Hypothetical Scenario
Open Domain [60]512Text (1)7168Crowdsourcing
EEG-P300 [57]11EEG (1)88Hypothetical Scenario
Real Life Trials [71]56Video, Audio, Text (3)121Realistic Scenario
Multi-Modal [74]30Video, Audio, Thermal, Physiological (4)150Hypothetical Scenario
Bag-of-Lies [62]35Video, Audio, EEG, Gaze (4)325Realistic Scenario
Table 4. Comparison between the proposed system and previous work.
ArticleYearModalitiesMethodAccuracy
A microcontroller-based Lie Detection System Leveraging Physiological Signals [73]2023HRV, GSRReid80%
LSTM Model for Brain Control Interface Based-Lie Detection [50]2024EEG, fNIRS, HRVLSTM70%
Using EEG and fNIRS Signals as Polygraphs [64]2022EEG, fNIRS, HRV, GSRNeural Network71.9%
Proposed technique2025BPM, GSR, Body Temp, Height, Age, WeightRF or AdaBoost97%
Disclaimer/Publisher’s Note: The statements, opinions and data contained in all publications are solely those of the individual author(s) and contributor(s) and not of MDPI and/or the editor(s). MDPI and/or the editor(s) disclaim responsibility for any injury to people or property resulting from any ideas, methods, instructions or products referred to in the content.