Article

Development of a Heating Block as an Aid for the DNA-Based Biosensing of Plant Pathogens

by
Bertrand Michael L. Diola
1,
Adrian A. Borja
1,
Paolo Rommel P. Sanchez
1,
Marynold V. Purificacion
2 and
Ralph Kristoffer B. Gallegos
1,*
1
Institute of Agricultural and Biosystems Engineering, University of the Philippines Los Baños, College, Los Baños 4031, Laguna, Philippines
2
Institute of Plant Breeding, University of the Philippines Los Baños, College, Los Baños 4031, Laguna, Philippines
*
Author to whom correspondence should be addressed.
Inventions 2025, 10(6), 94; https://doi.org/10.3390/inventions10060094 (registering DOI)
Submission received: 3 September 2025 / Revised: 12 October 2025 / Accepted: 15 October 2025 / Published: 26 October 2025

Abstract

Deoxyribonucleic acid (DNA)-based biosensors are rapid, cost-effective, and portable devices for monitoring crop pathogens. However, their on-field operations rely on a laboratory-bound heating block, which controls temperature during sample preparation. This study aimed to develop a field-deployable heating block to assist in the DNA hybridization protocol of DNA-based biosensors. It should maintain 95   ° C , 55   ° C , and 20   ° C for 5, 10, and 5 min, respectively. It had aluminum bars, positive thermal coefficient ceramic heaters, a Peltier thermoelectric module, and DS18B20 thermistors, serving twelve 0.2 mL polymerase chain reaction (PCR) tubes. An Arduino microcontroller employing a proportional–integral–derivative (PID) algorithm with a solid-state relay was utilized. Machine performance for distilled water-filled PCR tubes showed a maximum 10   ° C thermal variation. The machine maintained ( 96.00 ± 0.97 )   ° C , ( 55.15 ± 2.17 )   ° C , and ( 17.75 ± 0.71 )   ° C with root mean square errors (RMSEs) of 1.40   ° C , 2.18   ° C , and 2.36   ° C , respectively. The average thermal rates were ( 0.16 ± 0.11 )   ° C / s , ( 0.29 ± 0.11 )   ° C / s , and ( 0.14 ± 0.07 )   ° C / s from ambient to 95   ° C , 95   ° C to 55   ° C , and 55   ° C to 20   ° C , respectively. Overall, the low standard deviations and RMSEs demonstrate thermostable results and robust temperature control.

1. Introduction

Crop losses from plant diseases can be mitigated through early diagnosis. Traditional methods for plant disease detection include polymerase chain reaction (PCR), enzyme-linked immunosorbent assays (ELISAs), spectroscopy, fluorescence in situ hybridization (FISH), gel electrophoresis, volatile organic compound (VOC) analysis, and agar culture methods [1,2,3,4,5]. These techniques typically involve complex protocols operated by experts in the laboratory.
Biosensors are a popular alternative due to their rapid, low-cost, simple operation, high sensitivity, and high-selectivity features with point-of-care (POC) testing or on-site diagnosis [6]. Their process involves the recognition of a biochemical analyte from diseased samples, such as deoxyribonucleic acid (DNA), enzymes, or antibodies, whose binding with the sensor is converted by a transducer into an optical or electrical signal. These sensors have been used to detect bacterial, fungal, and viral pathogens, such as Escherichia coli, Salmonella spp., Staphylococcus aureus, Pseudomonas aeruginosa, Avian influenza virus, Penicillium digitatum, Ralstonia solanacearum, and Plum pox virus [7,8,9,10,11,12,13,14,15,16]. They also detected pathogens in crops such as Prunus domestica, Zea mays, Juglans regia, Saccharum officinarum, Theobroma cacao, and Citrus spp. [2,17,18,19,20,21].
Biosensors can be classified as piezoelectric, electrochemical, and optical, based on the signal produced [22,23,24]. Piezoelectric biosensors transform mechanical or pressure inputs into electrical signals. Meanwhile, electrochemical biosensors use electrodes as electrochemical reaction sites to detect biochemical analytes. Lastly, optical biosensors create visual changes, such as color, upon binding with target samples. For optical biosensors, surface plasmon resonance (SPR) is commonly used to study the binding of the analytes with the thin metallic film for disease recognition. The polarized light hitting the metal changes its refractive index based on the binding interactions of the recognizing metallic element.
Nanobiosensors, which are more advanced biosensors employing nanotechnology, present improved sensitivity, selectivity, portability, and ease of use compared to conventional biosensors due to their miniature sizes [25]. Some nanomaterials used include gold nanoparticles, silver nanoparticles, nanofibers, nanowires, carbon nanotubes, and quantum dots [22,26]. However, they face challenges in toxicity, fabrication, cost, commerciality, expertise, and awareness.
Like nanotechnology, artificial intelligence (AI) is another disruptive technology that enhances biosensors. AI can be used to improve material selection and sensor design [27,28]. It helps elucidate the optimal biorecognition and signal conversion mechanisms. It also improves data analysis through signal processing. To achieve these, some AI algorithms include machine learning, artificial neural networks, and generative AI [29,30,31]. Research has shown that biosensors integrated with AI can provide personalized healthcare, remote disease monitoring, and suggested treatment strategies [32,33]. Aside from healthcare, it is also used for environmental monitoring and food safety. However, AI-enabled biosensors face developmental challenges in terms of sensitivity, hardware durability, and quality data sets. Their full application is also hindered by concerns on data security, privacy, standardization, and regulation [34].
The Biomaterials and Sensors Laboratory (BMSL) at the Institute of Crop Science (ICropS), University of the Philippines Los Baños (UPLB), is working on a DNA-based colorimetric biosensor, adopting the methods of Dester et al. [35]. In their paper, the sensor color indicator turns red when the pathogen is present and blue to purple when it is absent. However, these devices face challenges for in situ analysis due to barriers in field-deployable methods in hybridization or the binding of the DNA detector to the samples. Particularly, the protocol involves the use of a thermocycler, or a stationary laboratory device that can heat the samples to the desired temperatures. The operation includes denaturation or DNA splitting at 95   ° C for 5 min, followed by annealing or DNA hybridization at 55   ° C for 10 min, and then cooling to ambient temperatures for 5 min. The equipment is costly, bulky, and complex to use. Thus, the biosensor protocol must be complemented by a portable, cost-effective, and accurate DNA incubation device, such as a heating block, under controlled temperatures.
Existing machines that control hybridization temperatures typically use conductive or convective processes [36]. Some conductive machines use solid heating blocks, such as silver, to hold the samples, while convective studies use water pumps or oil as a heating medium [37,38,39]. Microfluidics is also sometimes incorporated through polymeric microchannels or acrylic chips [40,41,42,43,44,45,46]. In the studies, common heating elements include resistive heating pads, aluminum heaters, or Peltier modules. Meanwhile, cooling mechanisms use Peltier modules as well, aided by heat sinks, fans, or liquid coolers. Temperature can be controlled by an Arduino microcontroller using the proportional–integral–derivative (PID) algorithm with bang-bang control based on the readings of thermocouple or thermistor sensors. Their systems are powered by a 12 V power supply or a 5 V battery. Some machines use flasks, food containers, or acrylic for insulation.
Considering all mechanisms for temperature control, advanced technologies such as microfluidics involve complex manufacturing processes, which may not be readily available or scalable at the commercial level. For all the other technologies, a portable device is lacking that specifically controls the temperature at 95   ° C and 55   ° C only in one cycle for 5 and 10 min, respectively. Limiting the functionalities can lower the production costs and complexity. Additionally, there are limited studies ([40,42,47,48,49,50,51]) on field-deployable temperature controllers specifically designed for biosensors. Therefore, a device specifically tailor-fitted to these conditions is needed.
This study aimed to develop a field-deployable heating block to aid in the DNA-based biosensor detection of plant pathogens. Specifically, we aimed to include a thermal module with a temperature controller system for the DNA-based biosensing of pathogens. The performance of the heating block based on its thermal response over time must also be evaluated.
The creation of an in situ heating block can assist in the real-time and on-field monitoring of crop pathogens. The device can later be extended to other diseases in the environmental and human sectors. Rapid diagnosis can create early interventions to reduce the economic losses of producers and boost the food security of consumers. Overall, the study contributes to holistic human, animal, and environmental health enhancement.

2. Materials and Methods

2.1. Device Design

The following were the design considerations for the proposed DNA temperature controller:
  • The machine must control the temperature of the DNA to ( 95 ± 2 )   ° C for 5 min, ( 55 ± 2 )   ° C for 10 min, and ( 20 ± 2 )   ° C for 5 min, corresponding to the three DNA hybridization phases, namely denaturation, annealing, and cooling, respectively.
  • The machine must be user-friendly and easy to operate for farmers by having a single button that automatically sets the desired temperatures in sequence at the specified times.
  • The machine must be field-deployable and easy to carry in resource-limited areas.
After designing the machine, the choice of materials and components was evaluated based on their accuracy, reliability, usability, speed, market competitiveness, and cost. Specifically, the machine must have quick thermal rates, a low thermal mass, uniform temperature distribution, low power consumption, and small deviations from the desired temperature targets. Given these criteria, conductive heat transfer rather than convective heat transfer was employed due to the ease of manufacturing with accessible materials, faster heating rates, uniform thermal diffusion, predictable heating performance, ease of temperature control, and minimal use of fluids or other components.

2.2. Thermal Module Design and Fabrication

Based on the design considerations and criteria, Figure 1 presents the block diagram of the machine, with a thermal module, control module, and power module.
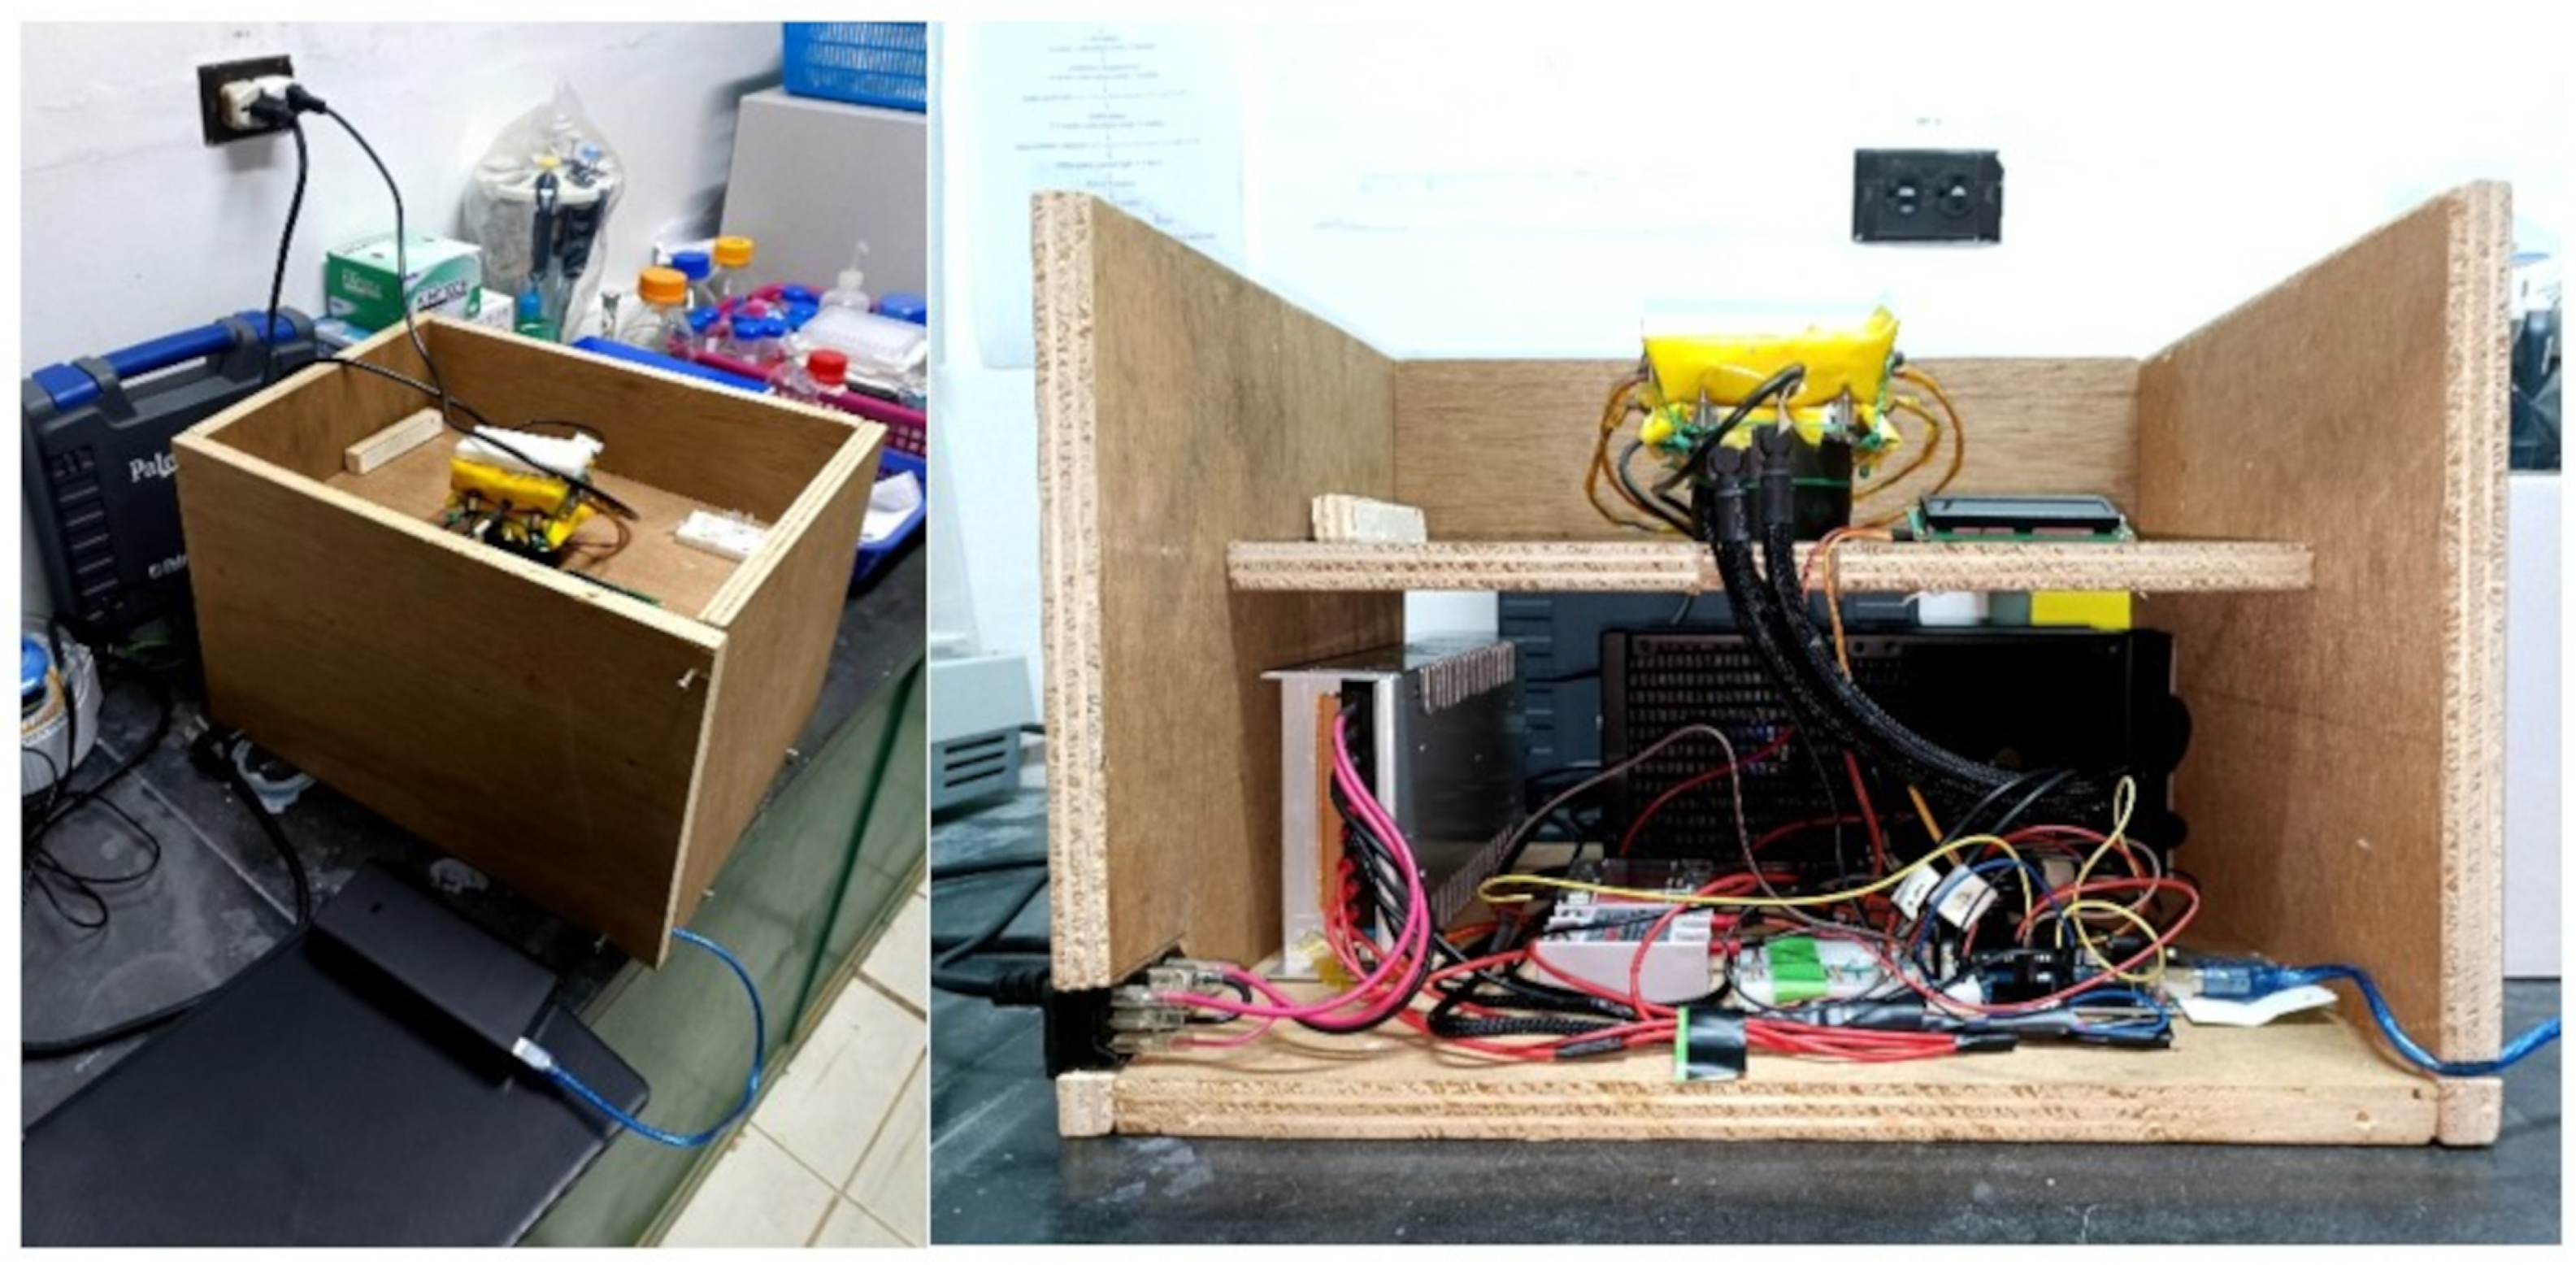
Figure A1 shows the actual fabricated machine.
For the thermal module, two 25 mm × 20 mm × 95 mm square aluminum bars held six 0.2 mL PCR tubes each; hence, the heating block can serve 12 PCR tubes. Two 35 mm × 21 mm × 5.1 mm positive thermal coefficient (PTC) ceramic heaters sandwiched between the aluminum blocks served as the heating element. For the cooling system, a TEC1-12715 40 mm × 40 mm × 3.3 mm Peltier thermoelectric cooler was placed below the heating block, aided by a liquid cooler (Cooler Master ML240L V2 ARGB) composed of a pump, radiator, and fans to effectively dissipate the heat. The heating block was insulated by a Teflon polytetrafluoroethylene (PFTE) cover and surrounded by ceramic wool covered with Kapton tape. The heaters, Peltier, and liquid cooling system were powered by a 12 VDC 40 A power supply.
These components were selected based on their cost, light weight, market availability, and ease of fabrication for a low sample throughput. Alternative materials include microfluidics, a silver heating block, resistance temperature detector sensors, thin-film heaters, and cartridge heaters. They can have more uniform thermal distributions, stronger power, faster thermal responses, and lower thermal fluctuations. However, these are used for commercial and high-throughput applications to justify costs and complex fabrication.
The materials and geometry of the proposed machine were iteratively modeled and optimized through finite element analysis simulations using Ansys Transient Thermal. The parameters tested were the temperature distribution over time and thermal rates across the heating block and PCR tubes. Heating and cooling performance were analyzed after 100 s to ensure that 95   ° C was reached during heating and 20   ° C was achieved during cooling. The block was initially set at 25   ° C during heating as a baseline ambient condition. The state of the system after 100 s during heating was used as the initial condition during cooling.

2.3. Temperature Controller Design and Fabrication

The block diagram in Figure 1 shows that the control system is composed of input, process, and output components through the thermistors, microcontroller, and solid-state relays, respectively.
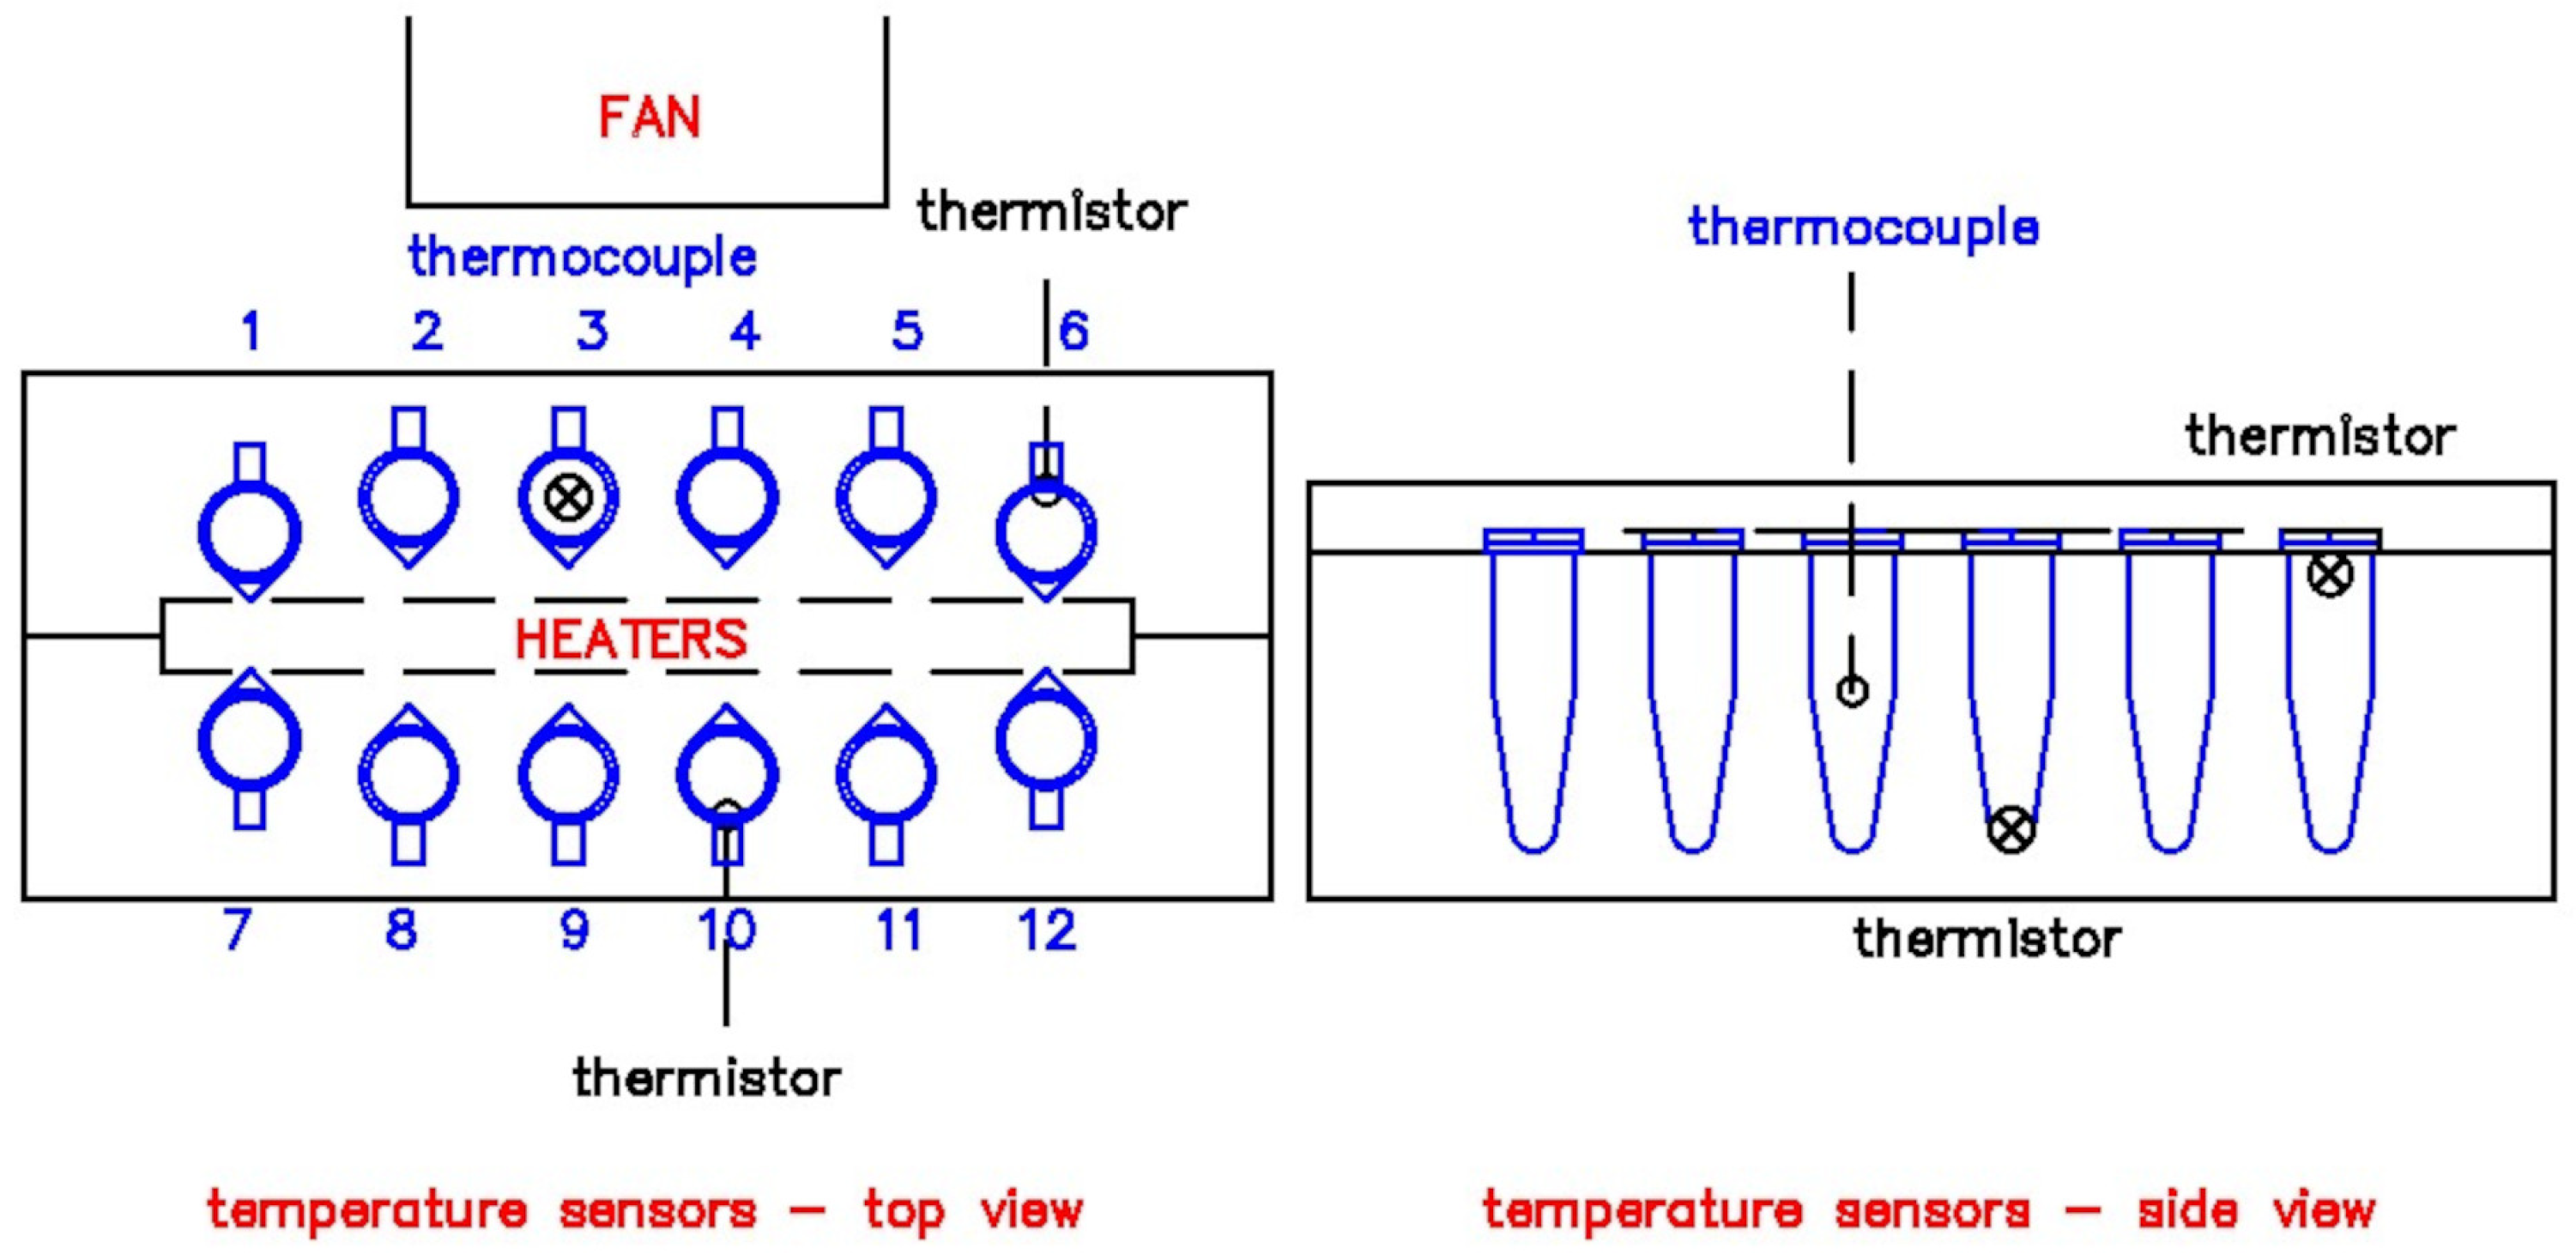
The temperature sensors were strategically placed horizontally, vertically, and by depth to ensure reliability across the heating block. Two DS18B20 thermistors collected the current temperature across the heating block. Their placements are presented in Figure 2. They were placed on the sides of the aluminum block and were in contact with the PCR tube walls. Their data served as the basis of the temperature control algorithm. A calibrated type K thermocouple from a handheld digital multimeter (RS PRO 14 max 10A) was drilled from the top of the block through the PCR tube in contact with the distilled water. It collected the temperature data within each tube, testing one sample at a time per operation.
The thermistors were randomly selected among six procured thermistors calibrated against the same reference type K thermocouple in a water bath from 15   ° C to 100   ° C . The temperature readings were fitted using a piecewise linear function from 15   ° C to 40   ° C , 40   ° C to 70   ° C , and 70   ° C to 100   ° C , covering the three DNA phases in the middle. The model RMSEs were minimized to guarantee accuracy with the lowest error possible. This also ensured that the maintained temperatures were within the tight tolerances required in DNA hybridization.
The temperature data were sent to the Arduino Uno microcontroller. The microcontroller was powered by a 5 VDC universal serial bus (USB) port. A PID algorithm controlled the desired temperature. The Zieger–Nichols method of PID tuning was iteratively used based on Sowmya et al. [52], yielding final Kp, Ki, and Kd values of 10, 0.01, and 0.1, respectively.
The average thermistor reading served as the PID algorithm input. It was displayed in a 16 × 2 I2C liquid crystal display (LCD). The algorithm output switched two 40 A DC-DC solid-state relays, one for the PTC heaters and the other for the Peltier module, on or off at certain time intervals for temperature control. The liquid cooling system was constantly opened throughout the operation.
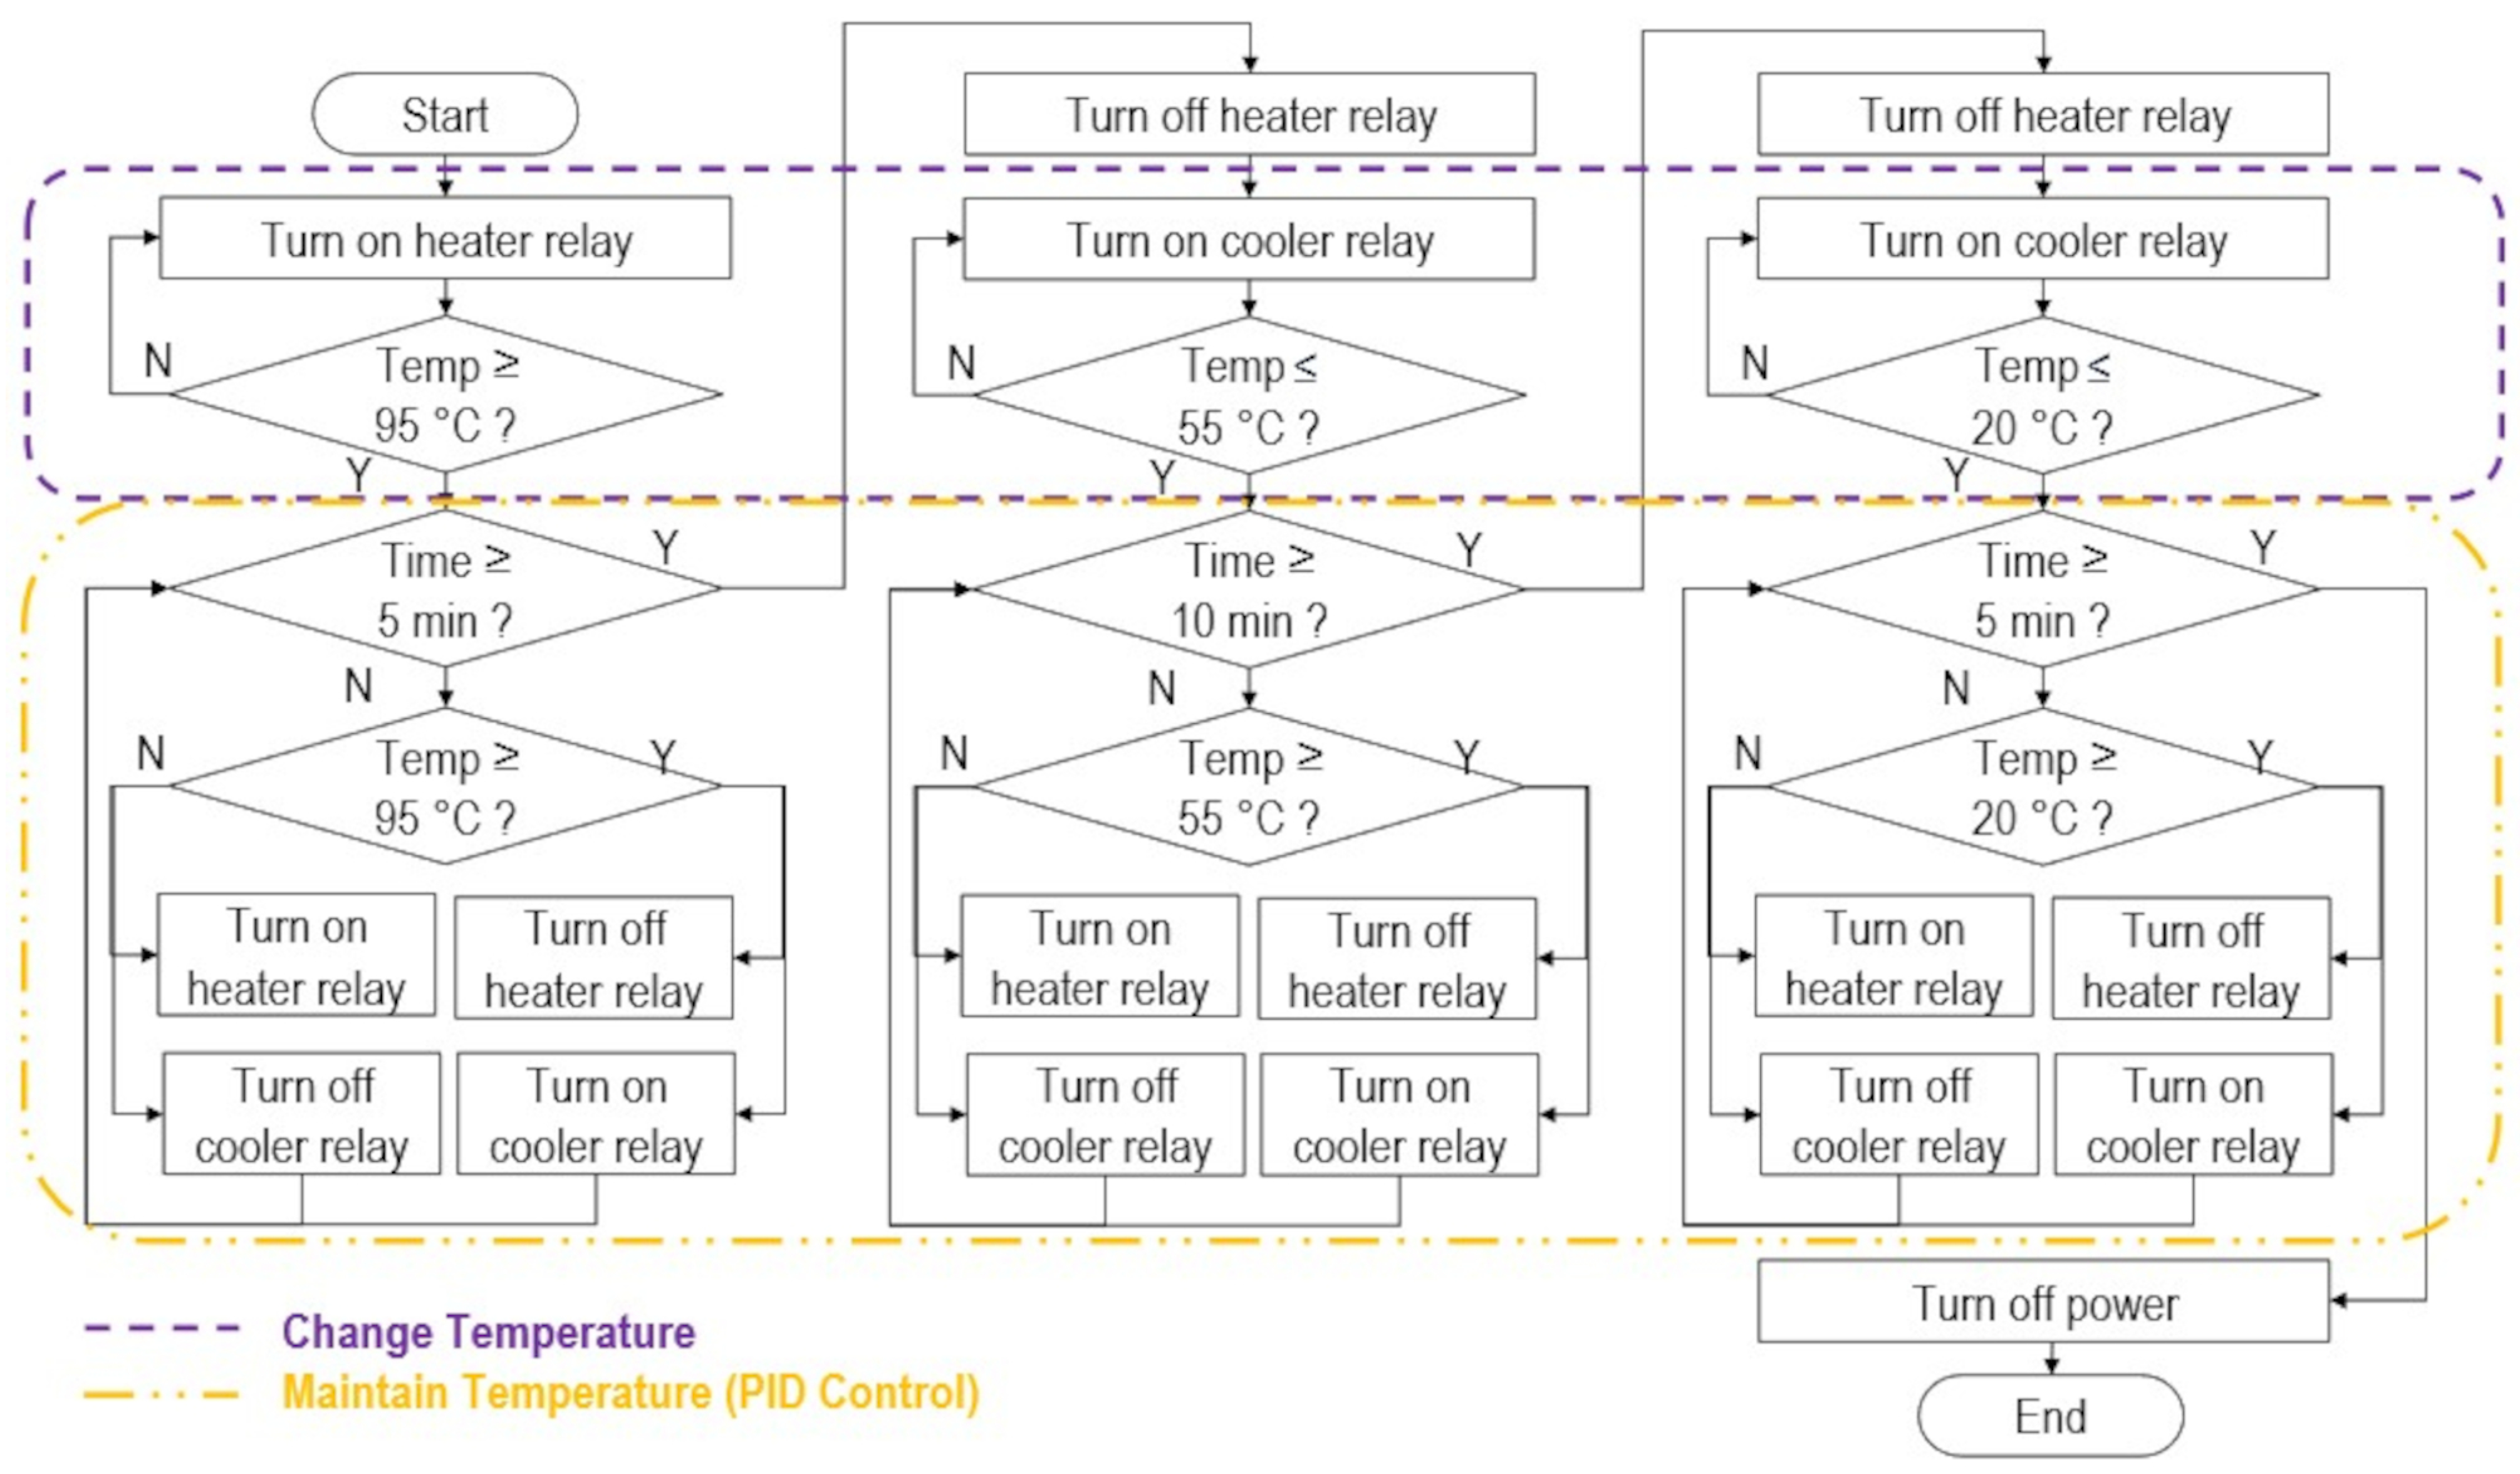
The control algorithm is summarized in Figure 3. For each DNA hybridization phase, the machine first heated or cooled the heating block to reach the target temperatures of 95   ° C , 55   ° C , and 20   ° C , consecutively. The PID algorithm only started maintaining the temperatures for 5 min, 10 min, and 5 min for denaturation, annealing, and cooling, respectively, once the temperature setpoints were reached.

2.4. Device Testing

To test the effectiveness of the device, twelve 0.2 mL PCR tubes with distilled water as thermal surrogate models were placed in the devised machine. These were heated at 95   ° C for 5 min, 55   ° C for 10 min, and then 20   ° C for 5 min. The temperature readings over time of the samples at Slots 3, 4, 9, and 10 were recorded in triplicate. These slot numbers are presented in Figure 2. The thermal distribution based on temperature differences across the heating block was evaluated. The average, standard deviation, and root mean square error (RMSE) of the temperatures were compared at 95   ° C , 55   ° C and 20   ° C , using one-sample t-tests (two-tailed, p < 0.05).
The average thermal rates in   ° C / s to reach the target setpoints were also determined. One-sample t-tests (two-tailed, p < 0.05) were conducted to compare the average thermal rates and the maintained temperatures between trials, PCR tubes, and DS18B20 thermistor values with type K thermocouple readings.

3. Results and Discussion

3.1. Simulated Device Performance

Figure 4 presents a temperature distribution simulation of the initial heating block design after 100 s. Most of the PCR tubes were along isothermal gradients. To improve temperature uniformity, the farthest tubes from the center of the block were repositioned during fabrication along the curved contours of the isothermal lines.
During heating, there was a symmetric distribution along the horizontal and vertical axes with respect to the top view. The maximum temperature was at the center of the heaters, while the minimum temperature was at the center of the PCR tubes. Their difference was 22   ° C . Across the aluminum block, there was a 10   ° C maximum temperature difference from the center to the sides. The center of the heaters and the DNA tube walls had a 7   ° C difference. Across the DNA samples, there was a 3   ° C maximum temperature difference between the PCR tubes closest and farthest from the center. For each PCR tube, the maximum temperature difference between the center of the PCR tube and its walls was 15   ° C , without stirring.
During cooling, there were both horizontal and vertical symmetric distributions from the top view. The maximum temperature was at the PCR tube centers, whereas the minimum temperature was at the Peltier modules. These had a 15   ° C difference. Across the aluminum block, when viewed from the side, there was almost no horizontal difference at the top, whereas a 5   ° C difference existed from top to bottom. The Peltier coolers and DNA tube walls had a 5   ° C temperature difference. Across the PCR tubes, the closest and farthest DNA samples from the block center had a 3   ° C maximum difference. Within the PCR tubes, there was a maximum 20   ° C difference from the center to the walls without stirring.
In both heating and cooling situations, while there was a maximum of 10   ° C variation across the aluminum block, there was only a maximum of 3   ° C between the DNA tubes. Thus, there were potentially low errors between the samples. As a practical course, it is recommended to place the tubes in the middle slots for more uniform temperatures. Despite the 10   ° C variation, all samples are still within tolerable limits ( ± 2   ° C ). The precision given by the standard deviation is close to 1   ° C , 2   ° C , and 1   ° C , while the accuracy from the RMSE is near 1.5   ° C , 2   ° C , and 2   ° C at 95   ° C , 55   ° C , and 20   ° C setpoints, respectively.
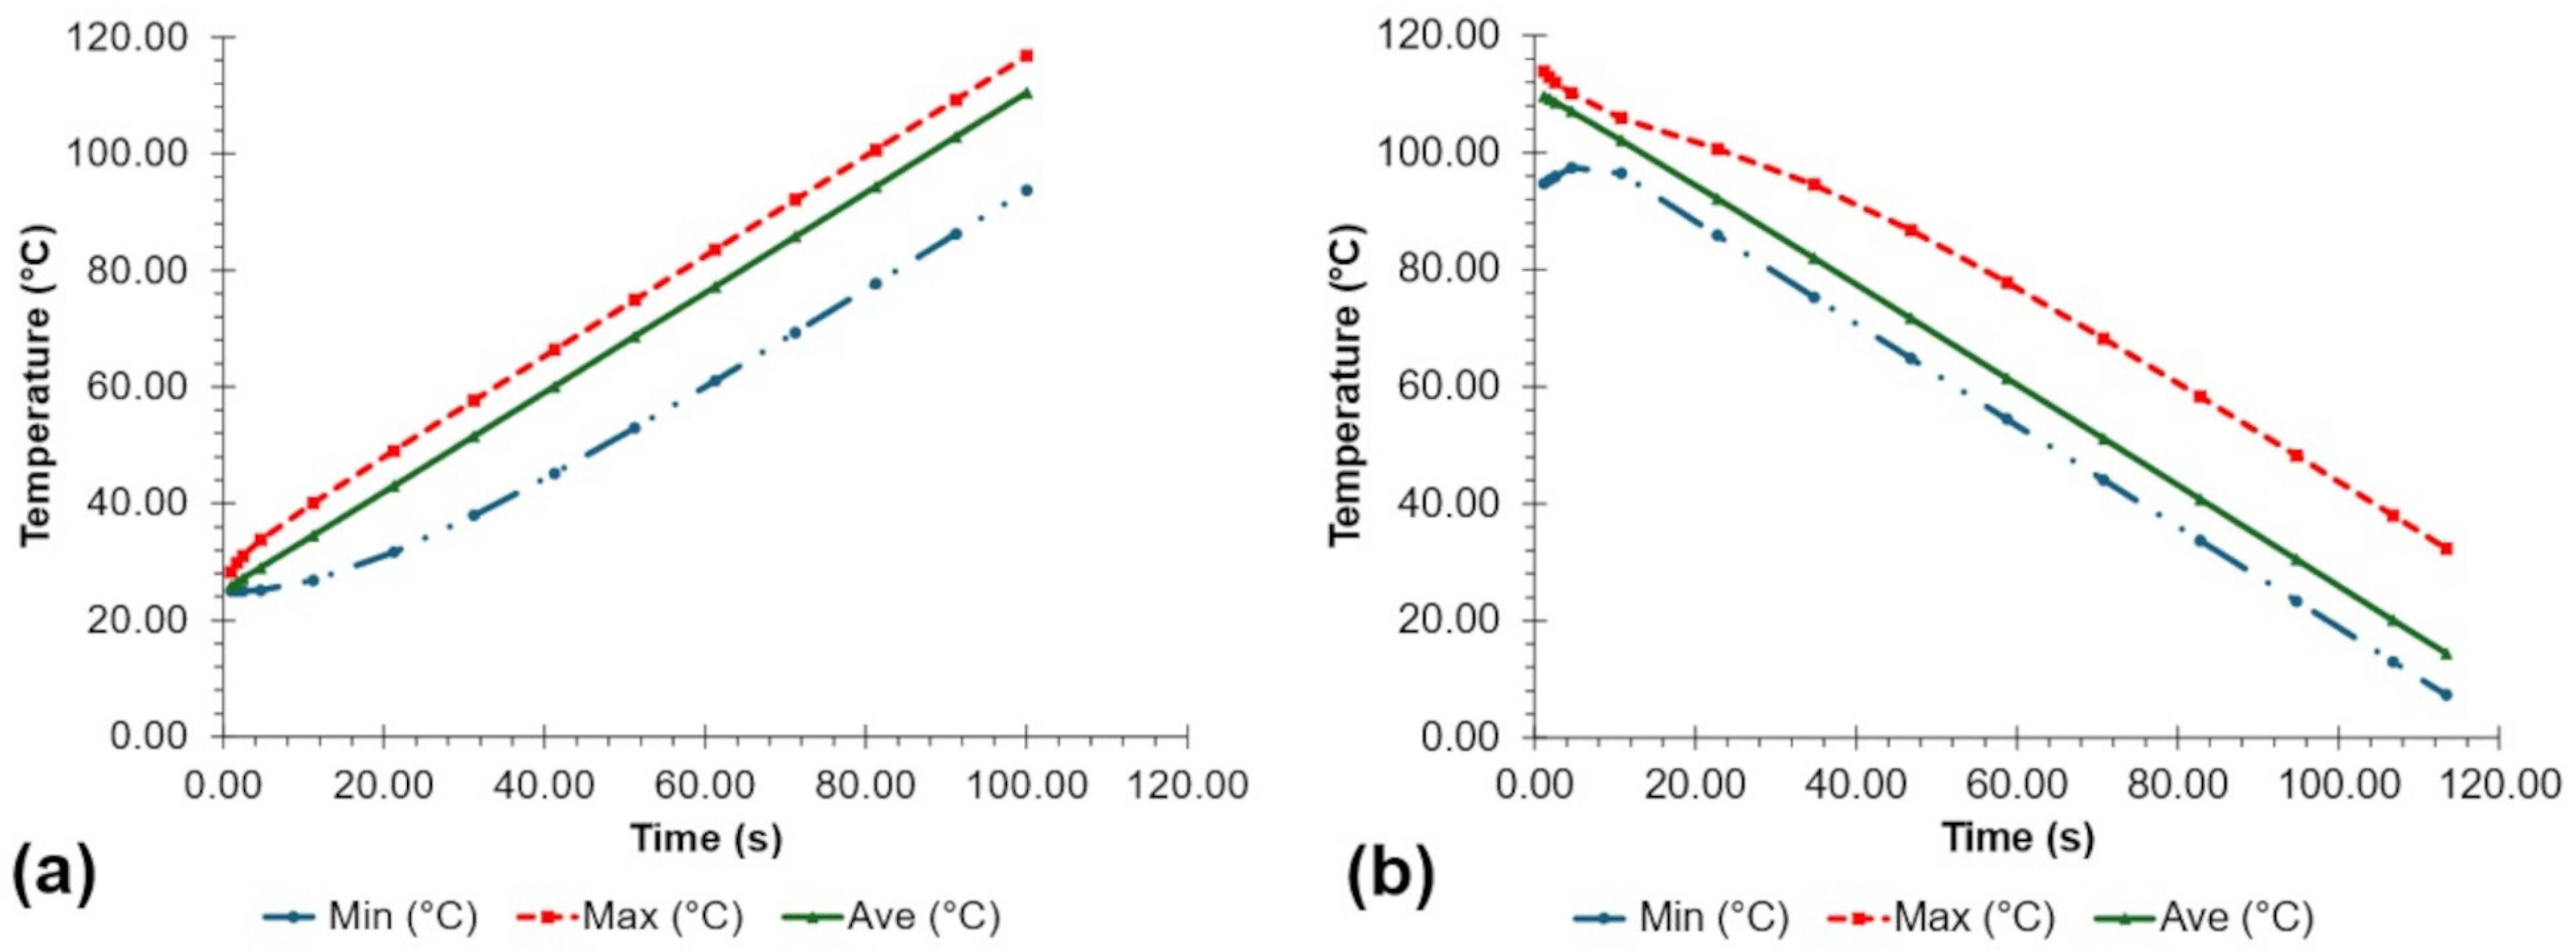
The simulated heating and cooling performance over time is shown in Figure 5. From ambient temperatures to 95   ° C , the samples in the PCR tube had an average heating rate of ( 0.86 ± 0.01 )   ° C / s for 99.82 s (1.66 min) based on the minimum temperature probe during heating. Meanwhile, the samples had an average cooling rate of ( 0.65 ± 0.14 )   ° C / s for 52.87 s (0.88 min) and ( 0.84 ± 0.01 )   ° C / s for 41.10 s (0.68 min) from 95   ° C to 55   ° C and 55   ° C to 20   ° C , respectively, based on the simulated maximum temperature during cooling. The rate from 95   ° C to 55   ° C was slower than that from 55   ° C to 20   ° C due to the thermal inertia caused by switching from heating to cooling conditions.

3.2. Actual Device Performance

Insights into temperature controller performance may be obtained from Table 1, which shows the thermistor calibration equations using a piecewise linear model. There was a low RMSE of 0.16 between 45   ° C and 75   ° C . Temperatures greater than 75   ° C had higher RMSEs, near 0.50, compared to temperatures below 40   ° C , which had an RMSE of 0.40.
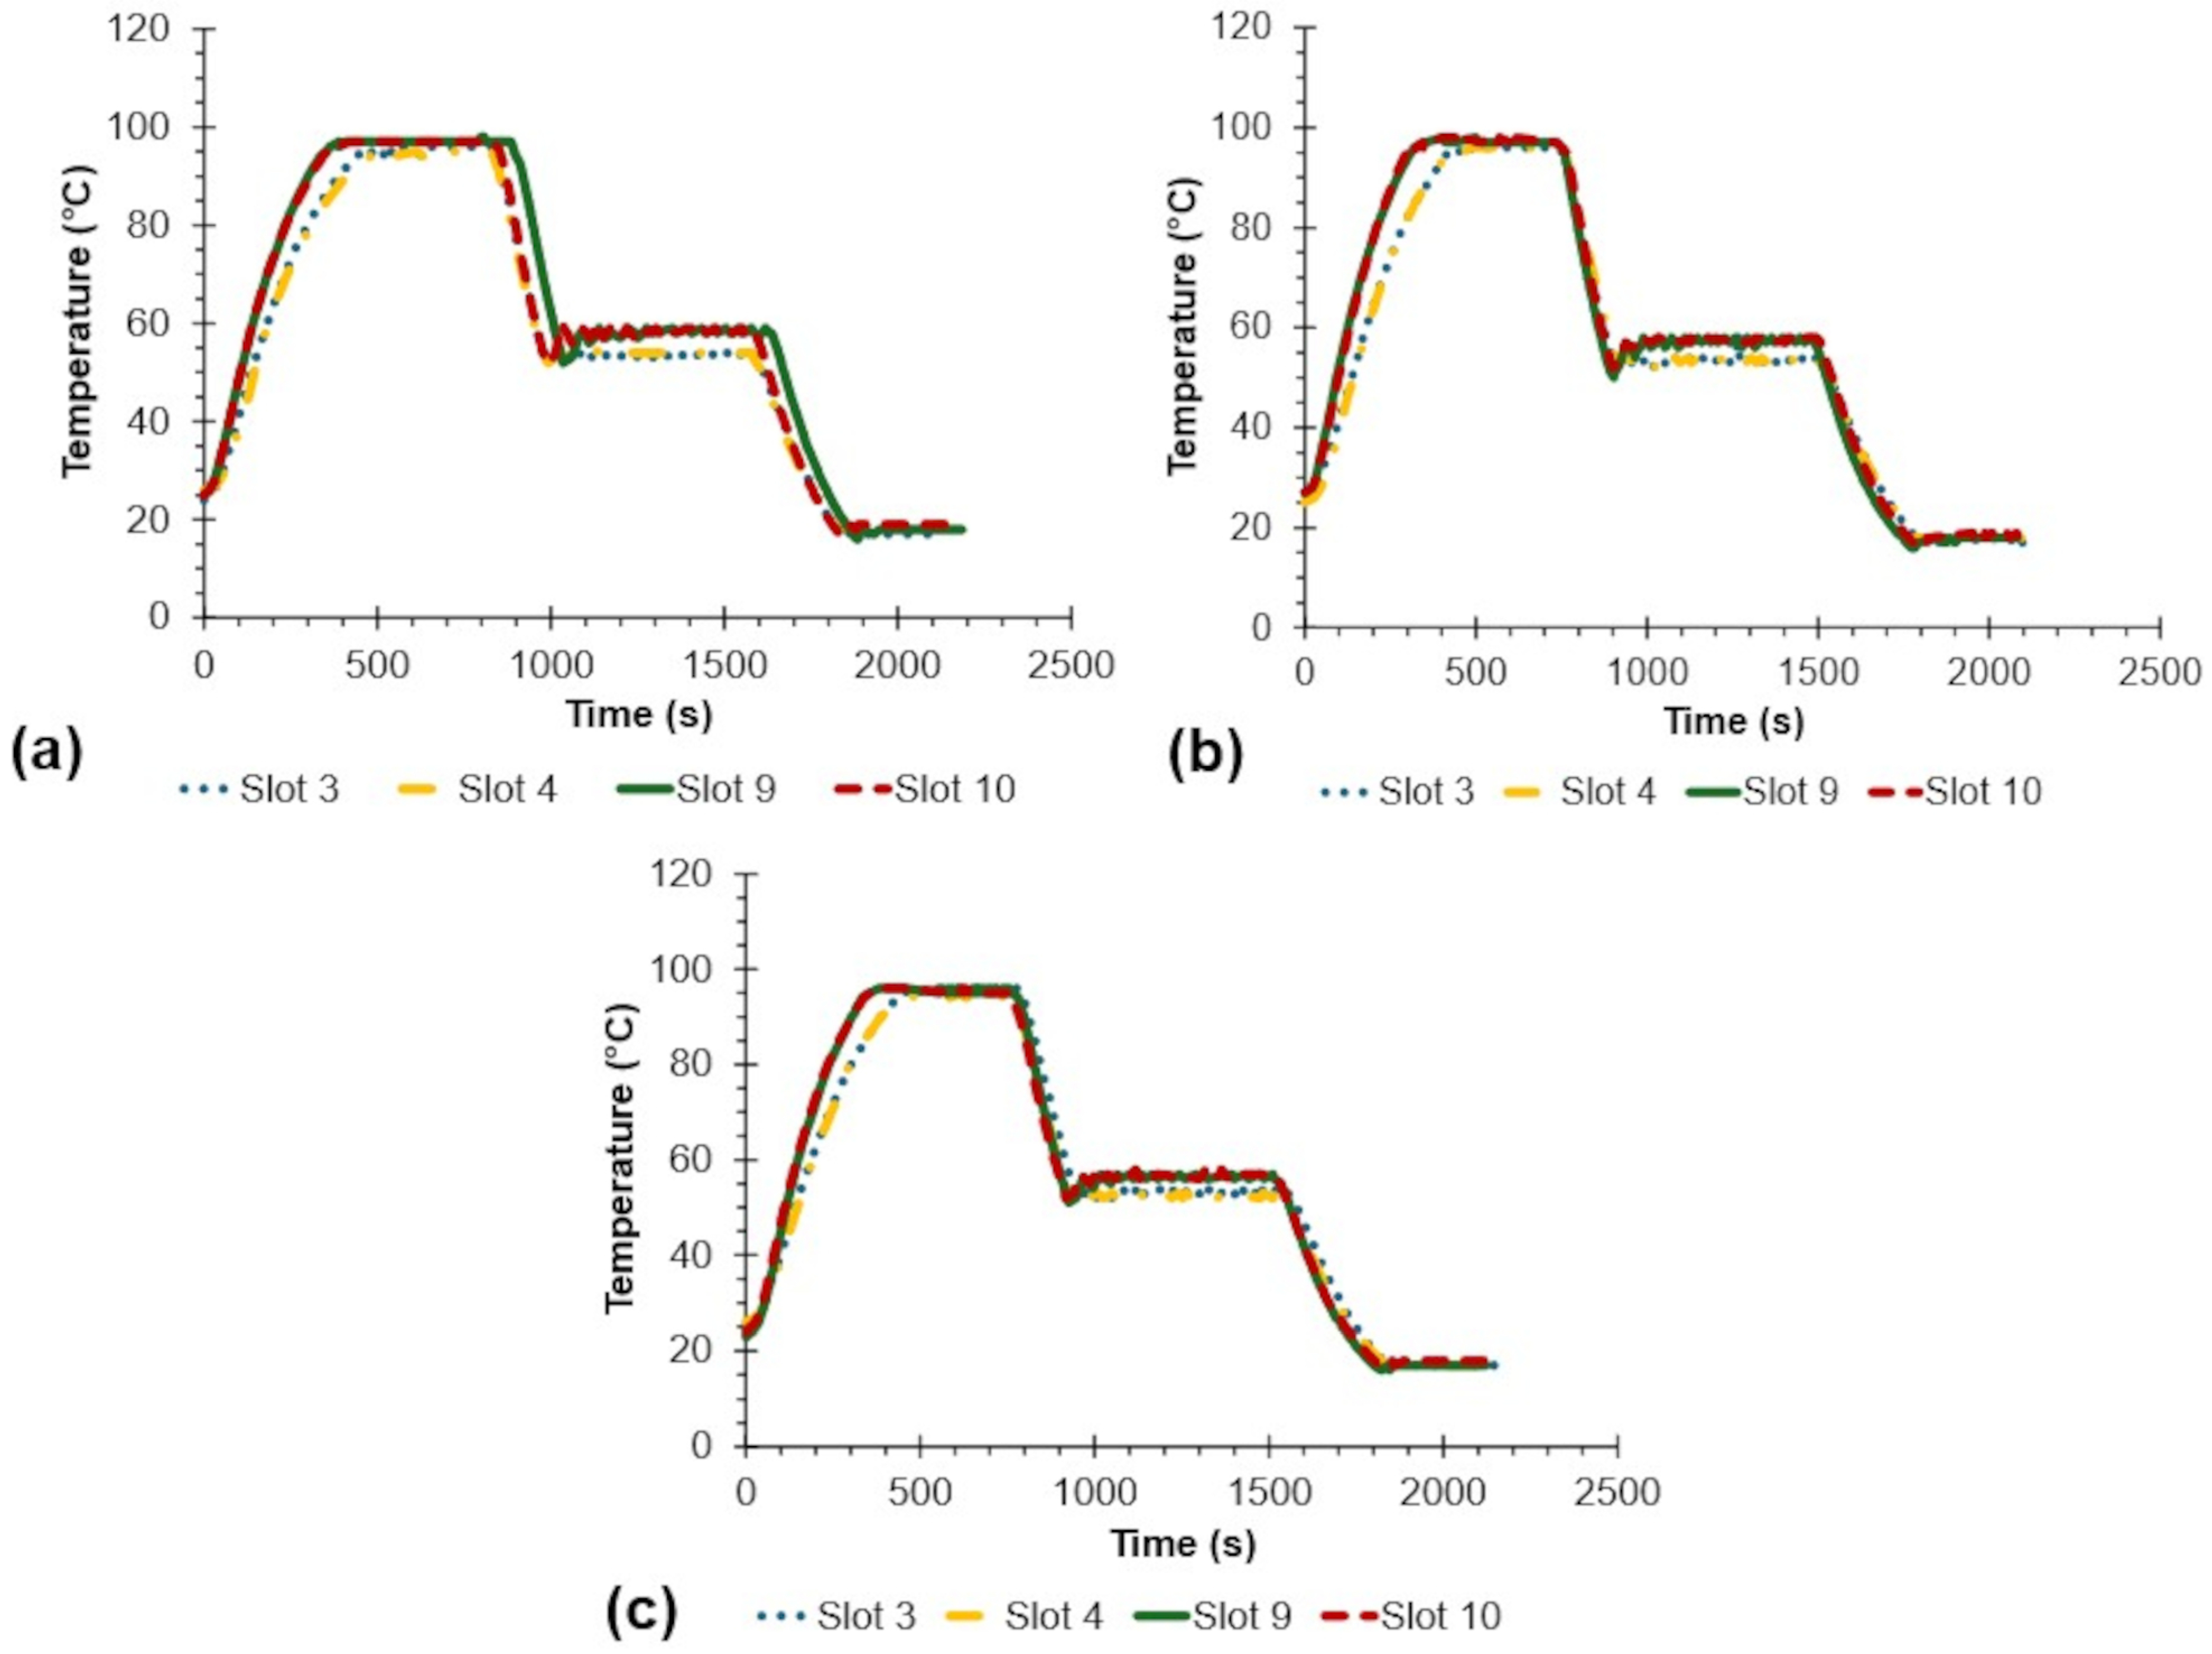
Figure 6 shows the full operation of the heating block for three trials, which takes nearly 2131 s or 35.5 min on average. Samples near the fan (Slots 9 and 10) were generally slightly hotter than those farther from the fan (Slots 3 and 4).
Table 2 summarizes the PID algorithm performance in maintaining the temperatures. The distilled water samples had average temperature readings of ( 96.00 ± 0.97 )   ° C , ( 55.15 ± 2.17 )   ° C , and ( 17.75 ± 0.71 )   ° C with an RMSE of 1.40   ° C , 2.18   ° C , and 2.36   ° C during denaturation, annealing, and cooling, respectively. Hence, precision is lowest during annealing based on the standard deviation, while cooling has the least accuracy based on the RMSE. Indeed, the device readings in the denaturation phase are not statistically different to the set point of 95   ° C . On the other hand, the cooling phase exhibited significantly lower values than the set point of 20   ° C .
The RMSE may be affected by the approaching thermal rates at the start of PID control, the sensor’s sensitivity to thermal changes, and the response time of the thermal elements to voltage changes. Meanwhile, the RMSE at the 20   ° C set point may not be critical for biosensing viability since its primary objective was to cool the samples to room temperature.
In terms of thermal distribution, the sensors exhibited a nearly 3   ° C difference between the maximum and minimum values during denaturation and cooling, whereas a 10   ° C difference was observed upon annealing. Statistical tests at each target temperature show that between the samples, there were no differences across the software temperature values, as recorded by the DS18B20 thermistors. There was a significant difference, however, between the actual water temperature values, as measured by the type K thermocouple. Despite these differences, in addition to the ± 10   ° C variation observed during the initial simulation, all samples were still close to the tolerable limits of ± 2   ° C , as expressed by the standard deviations and RMSE.
Portable heating blocks face several challenges in thermal control. Particularly, the use of batteries can lead to instabilities in power consumption and thermal output. Control algorithms may fail to correct these fluctuations under varying field conditions. Commercial laboratory thermocyclers, in comparison, provide more robust components. They contain more thermal gradient zones, user-defined temperature and time settings, and more expensive materials. This leads to more uniform thermal distributions, more accurately maintained temperatures, and faster thermal rates. Nonetheless, portable heating blocks can still maintain viable temperatures of DNA-based biosensing. Their low cost, point of care, and simplicity make them an attractive choice in resource-limited and low-throughput conditions.
Table 3 presents the average thermal rates. In general, the rates were similar across the water samples (slots). The samples had an average ( 0.16 ± 0.11 )   ° C / s heating rate from ambient to denaturation temperatures, a ( 0.29 ± 0.11 )   ° C / s cooling rate from denaturation to annealing, and a ( 0.14 ± 0.07 )   ° C / s cooling rate from the annealing to cooling phases. The thermal rate from 95   ° C to 55   ° C and 55   ° C was faster than the similar magnitudes from ambient to 95   ° C and 55   ° C and from 55   ° C to 20   ° C . In general, Peltier modules can cool more effectively at higher thermal gradients across their faces.
The actual thermal rates were roughly four, two, and six times slower than the simulated rates during the denaturation ( 0.86 ± 0.01 )   ° C / s , annealing ( 0.65 ± 0.14 )   ° C / s , and cooling ( 0.84 ± 0.01 )   ° C / s phases. This could be due to differences in configuration, material purity, heat transfer mechanisms at the boundary conditions, and delays in the sensor thermal response. Despite the maximum 10   ° C difference in the aluminum block, statistical tests show that there was no difference among the thermal rates. Thus, the samples had comparable heating and cooling performances.
The total cost for the fabricated device was USD $272. A comparison of the device performance and cost with similar portable thermocyclers can be found in Table 4. Notably, the maintained temperature errors, thermal rates, and total cost were similar to those of the other devices.

4. Conclusions and Future Work

The study successfully developed and tested a heating block with a temperature controller. The machine’s performance was evaluated based on its thermal distribution, its temperature maintenance, and the thermal rates of distilled water samples. There was a maximum 10   ° C difference between the samples during annealing, while there was a 3   ° C difference during denaturation and cooling. The heating block was able to maintain, on average, ( 96.00 ± 0.97 )   ° C , ( 55.15 ± 2.17 )   ° C , ( 17.75 ± 0.71 )   ° C for 5, 10, and 5 min, with an RMSE of 1.40   ° C , 2.18   ° C , and 2.36   ° C , respectively. Meanwhile, the average thermal rates were ( 0.16 ± 0.11 )   ° C / s , ( 0.29 ± 0.11 )   ° C / s , and ( 0.14 ± 0.07 )   ° C / s from ambient to 95  ∘ C , 95  ∘ C to 55  ∘ C , and 55  ∘ C to 20  ∘ C , respectively.
The thermal control RMSE and thermal rates could be improved by enhancing its insulation and casing. The heating block could be reconfigured using materials with lower thermal mass. Also, microfluidics may be employed to minimize thermal resistance. The quantity of heating elements and Peltier coolers could be increased for larger cooling and heating power. They can be placed at different positions across the heating block to add more temperature gradient zones and improve thermal distribution uniformity. Ramp-soak controllers and temperature sensors with faster response times can also further optimize the temperature control. Future work may also include material selection to improve the device’s portability without sacrificing durability.
The main focus of the study was to evaluate the temperature control performance of the device as an aid and a part of a bigger DNA-based biosensing protocol. The device used distilled water as a surrogate model since it is expected that diluted DNA samples would have similar thermal properties. Testing actual samples would require a separate study to test their biosensing viability under the programmed conditions. It could be difficult to distinguish if potential biosensing errors are due to the engineering design or the nature of DNA samples. Future work would test DNA samples under varying target temperatures, durations of temperature maintenance, types of species (e.g. virus, fungi, bacteria), and sample concentrations.

Author Contributions

B.M.L.D.: conceptualization, fund acquisition, methodology, data curation, investigation, formal analysis, writing—original draft and editing. A.A.B.: conceptualization, methodology, software, resources and validation. P.R.P.S.: conceptualization, methodology, resources and validation. M.V.P.: methodology, data curation, validation and supervision. R.K.B.G.: conceptualization, methodology, software, resources, writing—review and editing and supervision. All authors have read and agreed to the published version of the manuscript.

Funding

This research was supported by the CEAT Alumni Association under the Undergraduate Thesis Grant; DOST-SEI under the Undergraduate Merit Scholarship; and the Department of Agriculture through the University of the Philippines Los Baños and the Office of the Vice Chancellor for Student Affairs under the Agricultural and Rural Development Scholarship (ARDS)—Accelerating Growth to One Research and Extension in Action (AGORA) Thesis/Dissertation Grant.

Data Availability Statement

The raw data supporting the conclusions of this article will be made available by the authors on request.

Conflicts of Interest

The authors declare no conflicts of interest.

Abbreviations

The following abbreviations are used in this manuscript:
AGORAAccelerating Growth to One Research and Extension in Action
AIArtificial Intelligence
ANOVAAnalysis of variance
ARDSAgricultural and Rural Development Scholarship
BMSLBiomaterials and Sensors Laboratory
CEATCollege of Engineering and Agro-Industrial Technology
DCDirect current
DNADeoxyribonucleic Acid
DOST-SEIDepartment of Science and Technology-Science Education Institute
ELISAsEnzyme-Linked Immunosorbent Assays
FISHFluorescence In Situ Hybridization
ICropSInstitute of Crop Science
LCDliquid crystal display
PCRpolymerase chain reaction
PFTE        polytetrafluoroethylene
PIDproportional-integral-derivative
POCpoint-of-care
PTCpositive thermal 114 coefficient
RMSEroot mean square error
SPRsurface plasmon resonance
UPLBUniversity of the Philippines Los Baños
USBuniversal serial bus
VOCvolatile organic compound

Appendix A

Figure A1 shows the actual fabricated device.
Figure A1. Fabricated DNA temperature controller heating block.
Inventions 10 00094 g0a1

References

  1. Buja, I.; Sabella, E.; Monteduro, A.G.; Chiriacò, M.S.; De Bellis, L.; Luvisi, A.; Maruccio, G. Advances in plant disease detection and monitoring: From traditional assays to in-field diagnostics. Sensors 2021, 21, 2129. [Google Scholar] [CrossRef]
  2. Franco, A.J.D.; Merca, F.E.; Rodriguez, M.S.; Balidion, J.F.; Migo, V.P.; Amalin, D.M.; Alocilja, E.C.; Fernando, L.M. DNA-based electrochemical nanobiosensor for the detection of Phytophthora palmivora (Butler) Butler, causing black pod rot in cacao (Theobroma cacao L.) pods. Physiol. Mol. Plant Pathol. 2019, 107, 14–20. [Google Scholar] [CrossRef]
  3. Gautam, A.K.; Kumar, S. Techniques for the detection, identification, and diagnosis of agricultural pathogens and diseases. In Natural Remedies for Pest, Disease and Weed Control; Academic Press: Cambridge, MA, USA, 2020; pp. 135–142. [Google Scholar] [CrossRef]
  4. Sankaran, S.; Mishra, A.; Ehsani, R.; Davis, C. A review of advanced techniques for detecting plant diseases. Comput. Electron. Agric. 2010, 72, 1–13. [Google Scholar] [CrossRef]
  5. Sharief, S.A.; Caliskan-Aydogan, O.; Alocilja, E.C. Carbohydrate-coated nanoparticles for PCR-less genomic detection of Salmonella from fresh produce. Food Control 2023, 150, 109770. [Google Scholar] [CrossRef]
  6. Bankole, O.E.; Verma, D.K.; Chávez González, M.L.; Ceferino, J.G.; Sandoval-Cortés, J.; Aguilar, C.N. Recent trends and technical advancements in biosensors and their emerging applications in food and bioscience. Food Biosci. 2022, 47, 101695. [Google Scholar] [CrossRef]
  7. Choi, W.; Min, Y.W.; Lee, K.Y.; Jun, S.; Lee, H.G. Dielectrophoresis-based microwire biosensor for rapid detection of Escherichia coli K-12 in ground beef. LWT 2020, 132, 109230. [Google Scholar] [CrossRef]
  8. Fatema, K.N.; Liu, Y.; Cho, K.Y.; Oh, W.C. Comparative study of electrochemical biosensors based on highly efficient mesoporous ZrO2-Ag-G-SiO2 and In2O3-G-SiO2 for rapid recognition of E. coli O157:H7. ACS Omega 2020, 5, 22719–22730. [Google Scholar] [CrossRef]
  9. Soares, R.R.A.; Hjort, R.G.; Pola, C.C.; Parate, K.; Reis, E.L.; Soares, N.F.F.; McLamore, E.S.; Claussen, J.C.; Gomes, C.L. Laser-induced graphene electrochemical immunosensors for rapid and label-free monitoring of Salmonella enterica in chicken broth. ACS Sens. 2020, 5, 1900–1911. [Google Scholar] [CrossRef] [PubMed]
  10. Zhang, H.; Xue, L.; Huang, F.; Wang, S.; Wang, L.; Liu, N.; Lin, J. A capillary biosensor for rapid detection of Salmonella using Fe-nanocluster amplification and smart phone imaging. Biosens. Bioelectron. 2019, 127, 142–149. [Google Scholar] [CrossRef]
  11. Chen, L.; Leng, Y.K.; Liu, B.; Liu, J.; Wan, S.P.; Wu, T.; Yuan, J.; Shao, L.; Gu, G.; Fu, Y.Q.; et al. Ultrahigh-sensitivity label-free optical fiber biosensor based on a tapered singlemode- no core-singlemode coupler for Staphylococcus aureus detection. Sens. Actuators B Chem. 2020, 320, 128283. [Google Scholar] [CrossRef]
  12. Ozcan, S.M.; Sesal, N.C.; Sener, M.K.; Koca, A. An alternative strategy to detect bacterial contamination in milk and water: A newly designed electrochemical biosensor. Eur. Food Res. Technol. 2020, 246, 1317–1324. [Google Scholar] [CrossRef]
  13. Lee, T.; Park, S.Y.; Jang, H.; Kim, G.H.; Lee, Y.; Park, C.; Mohammadniaei, M.; Lee, M.; Min, J. Fabrication of electrochemical biosensor consisted of multi-functional DNA structure/porous au nanoparticle for avian influenza virus (H5N1) in chicken serum. Mater. Sci. Eng. C 2019, 99, 511–519. [Google Scholar] [CrossRef]
  14. Chalupowicz, D.; Veltman, B.; Droby, S.; Eltzov, E. Evaluating the use of biosensors for monitoring of Penicillium digitatum infection in citrus fruit. Sens. Actuators B Chem. 2020, 311, 127896. [Google Scholar] [CrossRef]
  15. Patkar, R.S.; Vinchurkar, M.; Ashwin, M.; Adami, A.; Giacomozzi, F.; Lorenzelli, L.; Baghini, M.S.; Rao, V.R. Microcantilever based dual mode biosensor for agricultural applications. IEEE Sens. J. 2019, 20, 6826–6832. [Google Scholar] [CrossRef]
  16. Berto, M.; Vecchi, E.; Baiamonte, L.; Condò, C.; Sensi, M.; Di Lauro, M.; Sola, M.; De Stradis, A.; Biscarini, F.; Minafra, A.; et al. Label free detection of plant viruses with organic transistor biosensors. Sens. Actuators B Chem. 2019, 281, 150–156. [Google Scholar] [CrossRef]
  17. Jarocka, U.; Wąsowicz, M.; Radecka, H.; Malinowski, T.; Michalczuk, L.; Radecki, J. Impedimetric immunosensor for detection of plum pox virus in plant extracts. Electroanalysis 2011, 23, 2197–2204. [Google Scholar] [CrossRef]
  18. Huang, X.; Xu, J.; Ji, H.F.; Li, G.; Chen, H. Quartz crystal microbalance based biosensor for rapid and sensitive detection of maize chlorotic mottle virus. Anal. Methods 2014, 6, 4530–4536. [Google Scholar] [CrossRef]
  19. Regiart, M.; Rinaldi-Tosi, M.; Aranda, P.R.; Bertolino, F.A.; Villarroel-Rocha, J.; Sapag, K.; Messina, G.A.; Raba, J.; Fernández-Baldo, M.A. Development of a nanostructured immunosensor for early and in situ detection of Xanthomonas arboricola in agricultural food production. Talanta 2017, 175, 535–541. [Google Scholar] [CrossRef] [PubMed]
  20. Wongkaew, P.; Poosittisak, S. Diagnosis of sugarcane white leaf disease using the highly sensitive DNA based voltammetric electrochemical determination. Am. J. Plant Sci. 2014, 5, 2256–2268. [Google Scholar] [CrossRef]
  21. Khater, M.; De La Escosura-Muñiz, A.; Quesada-González, D.; Merkoçi, A. Electrochemical detection of plant virus using gold nanoparticle-modified electrodes. Anal. Chim. Acta 2019, 1046, 123–131. [Google Scholar] [CrossRef] [PubMed]
  22. Castillo-Henríquez, L.; Brenes-Acuña, M.; Castro-Rojas, A.; Cordero-Salmerón, R.; Lopretti-Correa, M.; Vega-Baudrit, J.R. Biosensors for the detection of bacterial and viral clinical pathogens. Sensors 2020, 20, 6926. [Google Scholar] [CrossRef]
  23. Dyussembayev, K.; Sambasivam, P.; Bar, I.; Brownlie, J.C.; Shiddiky, M.J.; Ford, R. Biosensor technologies for early detection and quantification of plant pathogens. Front. Chem. 2021, 9, 636245. [Google Scholar] [CrossRef]
  24. Nesakumar, N.; Lakshmanakumar, M.; Srinivasan, S.; Jayalatha Jbb, A.; Balaguru Rayappan, J.B. Principles and recent advances in biosensors for pathogens detection. ChemistrySelect 2021, 6, 10063–10091. [Google Scholar] [CrossRef]
  25. Thakur, M.; Wang, B.; Verma, M.L. Development and applications of nanobiosensors for sustainable agricultural and food industries: Recent developments, challenges and perspectives. Environ. Technol. Innov. 2022, 26, 102371. [Google Scholar] [CrossRef]
  26. Bhalla, N.; Jolly, P.; Formisano, N.; Estrela, P. Introduction to biosensors. Essays Biochem. 2016, 60, 1–8. [Google Scholar] [CrossRef]
  27. Flynn, C.D.; Chang, D. Artificial intelligence in point-of-care biosensing: Challenges and opportunities. Diagnostics 2024, 14, 1100. [Google Scholar] [CrossRef] [PubMed]
  28. Nashruddin, S.N.A.B.M.; Salleh, F.H.M.; Yunus, R.M.; Zaman, H.B. Artificial intelligence—powered electrochemical sensor: Recent advances, challenges, and prospects. Heliyon 2024, 10, e37964. [Google Scholar] [CrossRef] [PubMed]
  29. Goumas, G.; Vlachothanasi, E.N.; Fradelos, E.C.; Mouliou, D.S. Biosensors, artificial intelligence biosensors, false results and novel future perspectives. Diagnostics 2025, 15, 1037. [Google Scholar] [CrossRef] [PubMed]
  30. Khan, A.A.; Laghari, A.A.; Alsafyani, M.; Baqasah, A.M.; Kryvinska, N.; Almadhor, A.; Alroobaea, R.; Gregus, M., Jr. A cost-effective approach using generative AI and gamification to enhance biomedical treatment and real-time biosensor monitoring. Sci. Rep. 2025, 15, 17305. [Google Scholar] [CrossRef]
  31. Ramola, A.; Shakya, A.K.; Bergman, A. Finite element method-based modeling of a novel square photonic crystal fiber surface plasmon resonance sensor with a Au–TiO2 interface and the relevance of artificial intelligence techniques in sensor optimization. Photonics 2025, 12, 565. [Google Scholar] [CrossRef]
  32. Akkaş, T.; Reshadsedghi, M.; Şen, M.; Kılıç, V.; Horzum, N. The role of artificial intelligence in advancing biosensor technology: Past, present, and future perspectives. Adv. Mater. 2025, 37, 2504796. [Google Scholar] [CrossRef] [PubMed]
  33. Etli, D.; Djurovic, A.; Lark, J. The future of personalized healthcare: AI-driven wearables for real-time health monitoring and predictive analytics. Curr. Res. Health Sci. 2024, 2, 10–14. [Google Scholar]
  34. Althobiti, M.; Nhung, T.T.T.; Verma, S.; Albugami, R.R.; Kumar, R. Artificial intelligence and biosensors: Transforming cancer diagnostics. Med. Nov. Technol. Devices 2025, 27, 100378. [Google Scholar] [CrossRef]
  35. Dester, E.; Kao, K.; Alocilja, E.C. Detection of Unamplified E. coli O157 DNA Extracted from Large Food Samples Using a Gold Nanoparticle Colorimetric Biosensor. Biosensors 2022, 12, 274. [Google Scholar] [CrossRef]
  36. Agrawal, N. Design and Characterization of Convective Thermal Cyclers for High-Speed DNA Analysis. Ph.D. Thesis, Texas A and M University, College Station, TX, USA, 2009. [Google Scholar]
  37. Atwood, J.G.; Fawcett, A.; Ferrara, K.S.; Hetherington, P.M.; Noreiks, R.W.; Olsen, D.E.; Widomski, J.R.; Wittmer, C.M. Thermal Cycler for PCR. U.S. Patent No. 8246243B2, 21 August 2012. [Google Scholar]
  38. Diep, T.T.; Bizley, S.; Ray, P.P.; Edwards, A.D. MicroMI: A portable microbiological mobile incubator that uses inexpensive lithium power banks for field microbiology. HardwareX 2021, 10, e00242. [Google Scholar] [CrossRef] [PubMed]
  39. Wight, J.; Varin, M.P.; Robertson, G.J.; Huot, Y.; Lang, A.S. Microbiology in the field: Construction and validation of a portable incubator for real-time quantification of coliforms and other bacteria. Front. Public Health 2020, 8, 607997. [Google Scholar] [CrossRef]
  40. Nasser, G.A.; Abdel-Mawgood, A.L.; Abouelsoud, A.A.; Mohamed, H.; Umezu, S.; El-Bab, A.M.F. New cost effective design of PCR heating cycler system using Peltier plate without the conventional heating block. J. Mech. Sci. Technol. 2021, 35, 3259–3268. [Google Scholar] [CrossRef]
  41. Zou, Q.; Miao, Y.; Chen, Y.; Sridhar, U.; Chong, C.S.; Chai, T.; Tie, Y.; Teh, C.H.L.; Lim, T.M.; Heng, C. Micro-assembled multi-chamber thermal cycler for low-cost reaction chip thermal multiplexing. Sens. Actuators A Phys. 2002, 102, 114–121. [Google Scholar] [CrossRef]
  42. Sun, H.; Olsen, T.; Zhu, J.; Tao, J.; Ponnaiya, B.; Amundson, S.A.; Brenner, D.J.; Lin, Q. A bead-based microfluidic approach to integrated single-cell gene expression analysis by quantitative RT-PCR. RSC Adv. 2015, 5, 4886–4893. [Google Scholar] [CrossRef]
  43. Priye, A.; Wong, S.; Bi, Y.; Carpio, M.; Chang, J.; Coen, M.; Cope, D.; Harris, J.; Johnson, J.; Keller, A.; et al. Lab-on-a-drone: Toward pinpoint deployment of smartphone-enabled nucleic acid-based diagnostics for mobile health care. Anal. Chem. 2016, 88, 4651–4660. [Google Scholar] [CrossRef]
  44. Kim, Y.T.; Chen, Y.; Choi, J.Y.; Kim, W.J.; Dae, H.M.; Jung, J.; Seo, T.S. Integrated microdevice of reverse transcription-polymerase chain reaction with colorimetric immunochromatographic detection for rapid gene expression analysis of influenza A H1N1 virus. Biosens. Bioelectron. 2012, 33, 88–94. [Google Scholar] [CrossRef]
  45. Bu, M.; Perch-Nielsen, I.R.; Sørensen, K.S.; Skov, J.; Sun, Y.; Bang, D.D.; Pedersen, M.E.; Hansen, M.F.; Wolff, A. A temperature control method for shortening thermal cycling time to achieve rapid polymerase chain reaction (PCR) in a disposable polymer microfluidic device. J. Micromech. Microeng. 2013, 23, 74002. [Google Scholar] [CrossRef]
  46. Sun, K.; Whiteside, B.; Hebda, M.; Fan, Y.; Zhang, Y.; Xie, Y.; Liang, K. A low-cost and hand-hold PCR microdevice based on water-cooling technology. Biomed. Microdevices 2023, 25, 12. [Google Scholar] [CrossRef]
  47. Luo, K.; Cheng, W.; Chen, Y.; Zhang, Q.; Liang, C.; Li, J.; Wang, W. A portable low-cost polymerase chain reaction device. HardwareX 2025, 21, e00635. [Google Scholar] [CrossRef] [PubMed]
  48. Pudasaini, S.; Thapa, G.; Marasini, B.P.; Giri, B. Smartphone-operated affordable PCR thermal cycler for the detection of antimicrobial resistant bacterial genes. PLoS Glob. Public Health 2023, 3, e0001120. [Google Scholar] [CrossRef]
  49. Kadja, T.; Liu, C.; Sun, Y.; Chodavarapu, V.P. Low-cost, real-time polymerase chain reaction system for point-of-care medical diagnosis. Sensors 2022, 22, 2320. [Google Scholar] [CrossRef] [PubMed]
  50. Yin, J.; Tong, J.; Li, J.; Shao, G.; Xie, B.; Zhuang, J.; Bi, G.; Mu, Y. A portable, high-throughput real-time quantitative PCR device for point-of-care testing. Anal. Biochem. 2023, 674, 115200. [Google Scholar] [CrossRef] [PubMed]
  51. Ferguson, J.; Duran, J.; Killinen, W.; Wagner, J.; Kulesza, C.; Chatterley, C.; Li, Y. A field-deployable and low-cost PCR (FLC-PCR) thermocycler for the rapid detection of environmental E. coli. In Proceedings of the 2020 42nd Annual International Conference of the IEEE Engineering in Medicine and Biology Society (EMBC), Montreal, QC, Canada, 20–24 July 2020; pp. 2209–2212. [Google Scholar] [CrossRef]
  52. Sowmya, V.S.; Dharsini, S.P.; Dharshini, R.P.; Aravind, P. Application of various PID controller tuning techniques for a temperature system. Int. J. Comput. Appl. 2014, 103, 32–34. [Google Scholar] [CrossRef]
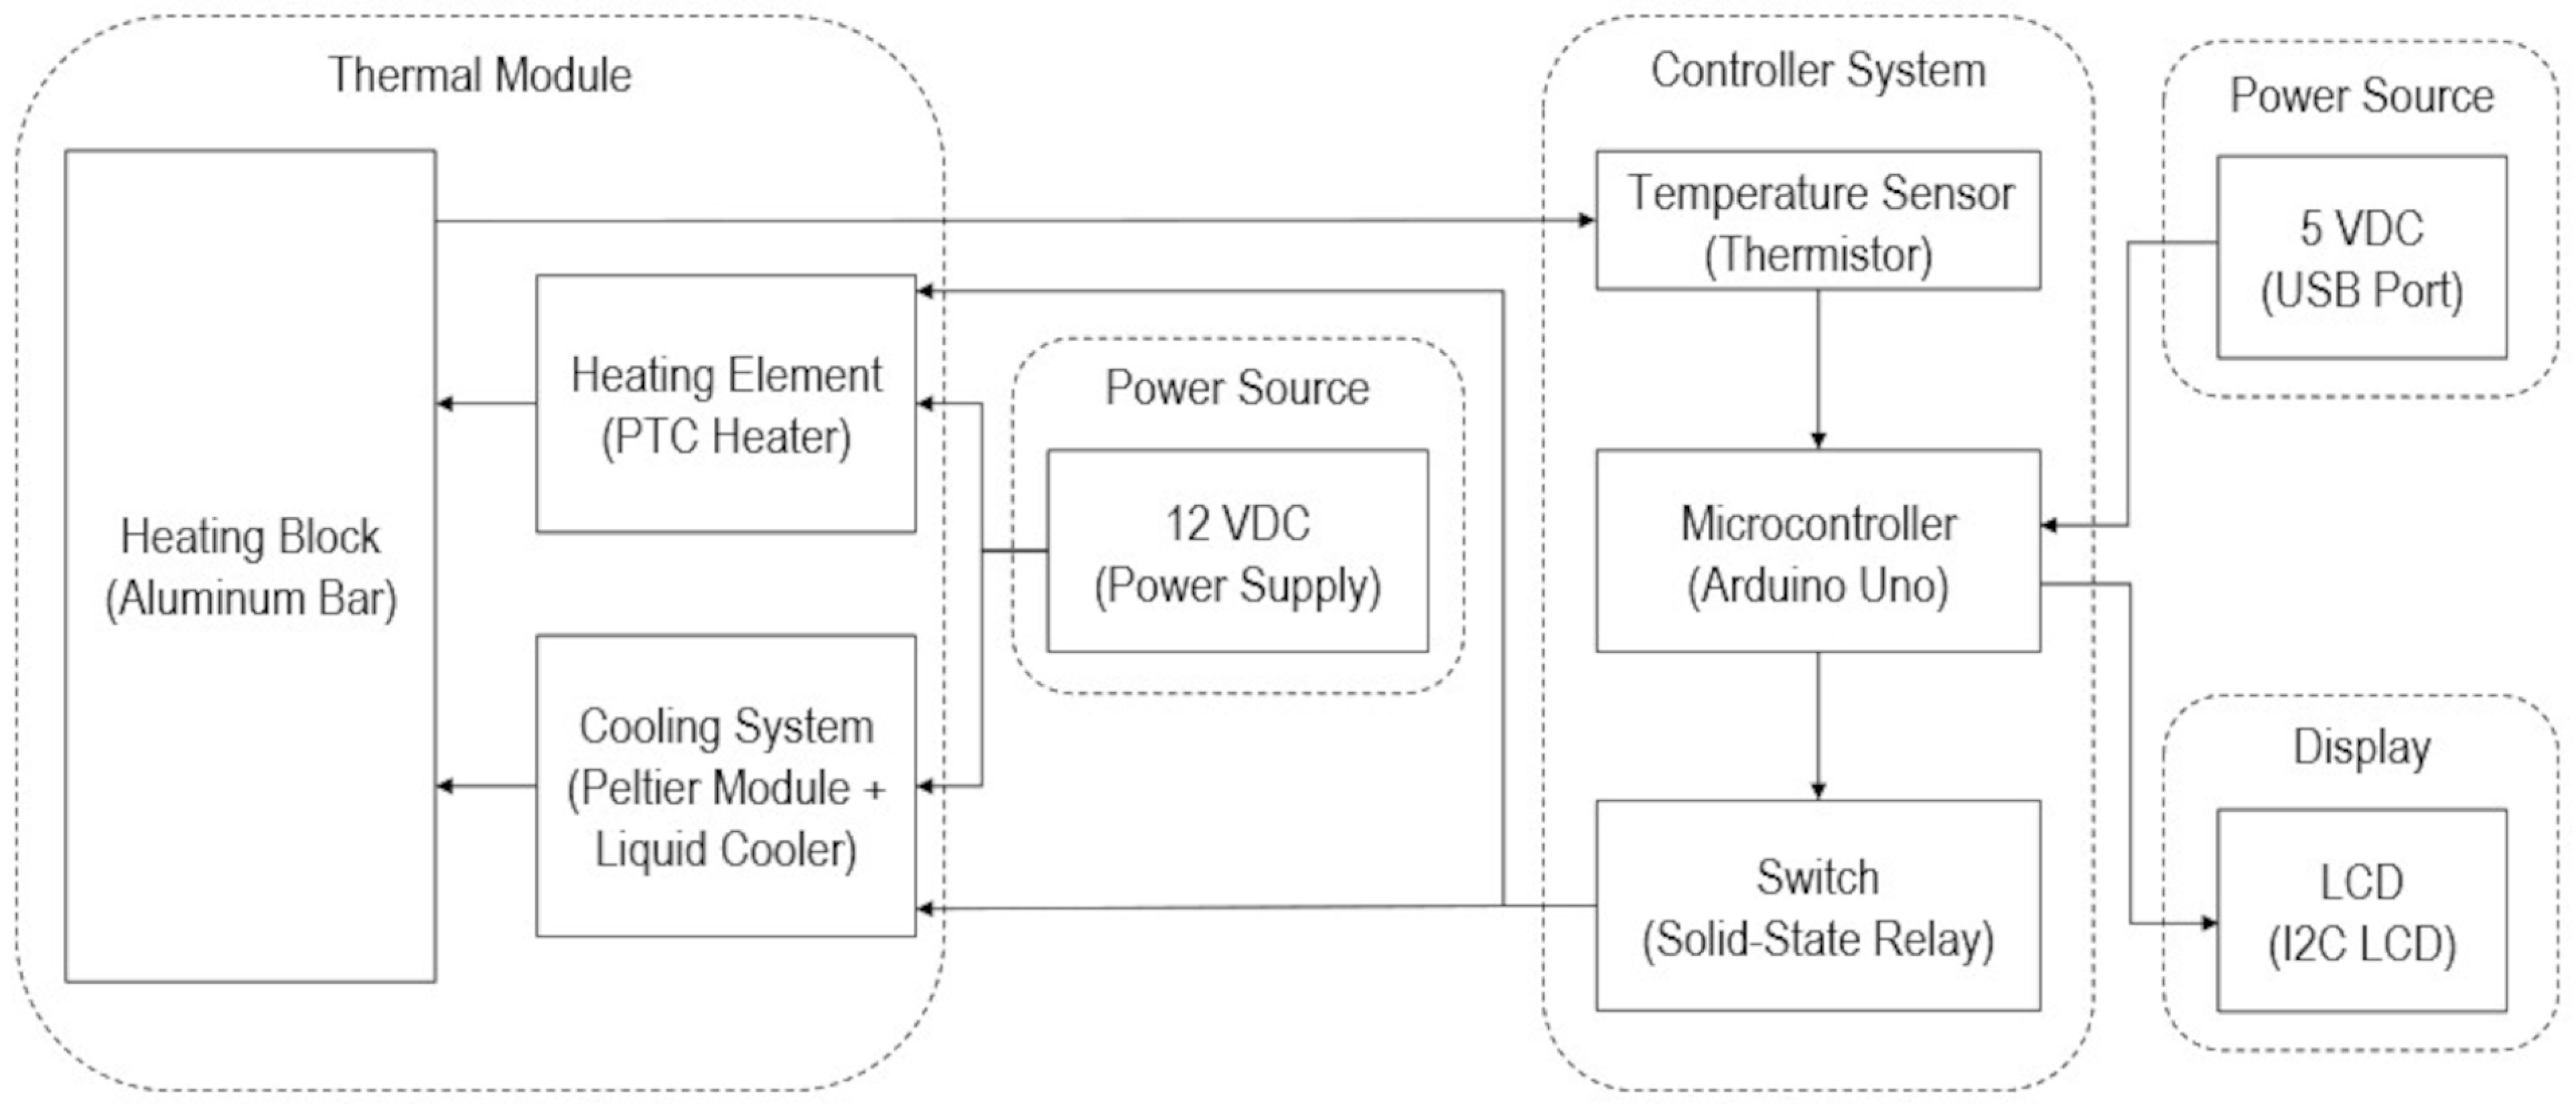
Figure 1. Block diagram of DNA temperature controller.
Inventions 10 00094 g001
Figure 2. Temperature sensor placements at the heating block. Sensors were placed at Slots 3, 4, 9 and 10.
Inventions 10 00094 g002
Figure 3. Control algorithm flowchart.
Inventions 10 00094 g003
Figure 4. Temperature simulation results after (a) heating and (b) cooling.
Inventions 10 00094 g004
Figure 5. Simulated (a) heating and (b) cooling over time results of the system.
Inventions 10 00094 g005
Figure 6. Full temperature over time performance of the heating block for three (ac) trials.
Inventions 10 00094 g006
Table 1. Linear thermistor calibration *.
TemperatureCalibration EquationRMSE
T o b s < 40   ° C T a d j = 0.9778 T o b s 1.0686 0.3956
40   ° C T o b s < 75   ° C T a d j = 0.9899 T o b s 0.5878 0.1639
T o b s > 75   ° C T a d j = 0.9581 T o b s + 1.9770 0.4964
* Note: T o b s = observed temperature. T a d j = adjusted temperature.
Table 2. PID control performance at target temperature setpoints.
SampleAverage (   ° C )SD (   ° C )RMSE (   ° C )Max (   ° C )Min (   ° C )Statistical Difference to Set Point *
95   ° C Setpoint (denaturation)
Slot 395.830.410.9296.0094.00ns
Slot 495.060.700.7096.0094.00ns
Slot 996.530.791.7398.0095.00ns
Slot 1096.590.981.8798.0095.00ns
Average96.000.971.4098.0094.00-
55   ° C Setpoint (annealing)
Slot 353.330.571.7659.0052.00s
Slot 453.250.701.8955.0052.00s
Slot 956.881.522.4259.0050.00ns
Slot 1057.161.322.5360.0052.00ns
Average55.152.172.1860.0050.00-
20   ° C Setpoint (cooling)
Slot 317.180.302.8318.0017.00s
Slot 417.940.772.2019.0017.00s
Slot 917.510.522.5418.0016.00s
Slot 1018.370.531.7219.0017.00s
Average17.750.712.3619.0016.00-
* Determined using one-sample, two-tailed t-test at p < 0.05. Note: s = significant; ns = not significant.
Table 3. Thermal rates between at different target temperature regimes.
SampleAverage * ( ° C / s )SD ( ° C / s )Time (s)Time (min)
Ambient to 95   ° C
Slot 30.16 a0.094898.15
Slot 40.15 a0.094848.06
Slot 90.15 a0.135058.42
Slot 100.16 a0.134808.00
Average0.160.114908.16
95   ° C to 55   ° C
Slot 3−0.29 b0.091562.61
Slot 4−0.28 b0.101572.61
Slot 9−0.30 b0.121582.63
Slot 10−0.29 b0.131562.61
Average−0.290.111572.61
55   ° C to 20   ° C
Slot 3−0.14 c0.052854.75
Slot 4−0.13 c0.052844.74
Slot 9−0.15 c0.082814.68
Slot 10−0.15 c0.082854.75
Average−0.140.072844.73
* For the same temperature change regime, means follwed by the same letter are not significantly different, based on p < 0.05, as determined using a Welch ANOVA test.
Table 4. Device performance comparison with similar portable thermocyclers.
PrototypeAverage Maintained Temperature,   ° C Average Thermal Rate,   ° C / s Estimated Cost * (USD $)
Fabricated device in
this study
96.00 ± 0.97 , 55.15 ± 2.17 , 17.75 ± 0.71 25   ° C to 95   ° C : 0.16 ± 0.11 , 95   ° C to 55   ° C : 0.29 ± 0.11 , 55   ° C to 20   ° C : 0.14 ± 0.07 272
Luo et al. (2025) [47] ± 0.55 heating: 1.78 , cooling: 1.52 120
Pudasaini et al. (2023) [48] ± 0.5 heating: 0.23 , cooling: 0.43 50
Kadja et al. (2022) [49]- 95   ° C to 55   ° C : 1 , 55   ° C to 72   ° C : 1.89 , 72   ° C to 95   ° C : 1.77 340
Yin et al. (2023) [50] ± 0.1 >2.5387
Ferguson et al. (2020) [51]-average: 1.11 ± 0.33 , 94   ° C to 60.5   ° C : 1.12 ± 0.01 , 60.5   ° C to 72   ° C : 0.49 ± 0.00 , 72   ° C to 94   ° C : 1.08 ± 0.01 <200
Nasser et al. (2021) [40] 94.97 ± 0.376 , 55.06 ± 0.370 , 74.70 ± 0.452 heating: 8.3 , cooling: 8125
Sun et al. (2023) [42] 97.56 ± 0.92 , 57.89 ± 0.62 , 72.95 ± 0.82 heating: 4.0 , cooling: 8.1 171
* Cost estimates may not be directly comparable due to different pricing assumptions and prevailing prices when the devices were developed.
Disclaimer/Publisher’s Note: The statements, opinions and data contained in all publications are solely those of the individual author(s) and contributor(s) and not of MDPI and/or the editor(s). MDPI and/or the editor(s) disclaim responsibility for any injury to people or property resulting from any ideas, methods, instructions or products referred to in the content.