Article

Enhanced Frequency Regulation of Islanded Airport Microgrid Using IAE-Assisted Control with Reaction Curve-Based FOPDT Modeling

1
Department of EECE, SSES, Sharda University, Greater Noida, Uttar Pradesh 201310, India
2
Department of EECE, GITAM School of Technology, Visakhapatnam 530045, India
3
Department of Electrical Engineering, Malaviya National Institute of Technology, Jaipur 302017, India
*
Author to whom correspondence should be addressed.
Inventions 2025, 10(5), 88; https://doi.org/10.3390/inventions10050088
Submission received: 21 August 2025 / Revised: 18 September 2025 / Accepted: 29 September 2025 / Published: 2 October 2025

Abstract

This paper investigates frequency regulation of an airport microgrid (AIM) through the application of an integral absolute error (IAE)-assisted control approach. The islanded AIM is initially captured using a linearized transfer function model to accurately reflect its dynamic characteristics. This model is then simplified using a first-order plus dead time (FOPDT) approximation derived via a reaction-curve-based method, which balances between model simplicity and accuracy. Two different proportional–integral–derivative (PID) controllers are designed to meet distinct objectives: one focuses on set-point tracking (SPT) to maintain the target frequency levels, while the other addresses load disturbance rejection (LDR) to reduce the effects of load fluctuations. A thorough comparison of these controllers demonstrates that the SPT-mode PID controller outperforms the LDR-mode controller by providing an improved transient response and notably lower error measures. The results underscore the effectiveness of combining IAE-based control with reaction curve modeling to tune PID controllers for islanded AIM systems, contributing to enhanced and reliable frequency regulation for microgrid operations.

1. Introduction

Smart cities represent a new paradigm in urban development, where cutting-edge technology [1], data-driven decision making [2], and integrated infrastructure solutions work together to enhance urban living, improve sustainability, and ensure efficient resource use [3]. A foundational element in smart city planning is the development of intelligent energy systems capable of providing reliable power [4] while adapting to changing consumption patterns and increasingly incorporating clean energy sources.
Among the most critical and energy-intensive components of smart cities are airport facilities, which require highly dependable and high-quality electricity to maintain safety, operational continuity, and passenger comfort. To meet these challenges, many airports are turning to airport microgrids, self-contained, local power networks optimized for their unique mix of loads, generation sources, and operational priorities [4]. These microgrids can seamlessly blend conventional power plants, renewable sources, and modern energy storage technologies, empowering airports to operate independently in islanded mode or collaborate with the main utility grid as needed.
A central aspect of effective airport microgrid (AIM) operation within a smart city framework is robust frequency regulation [5]. Since airports often experience wide-ranging variations in energy demand and supply, keeping the microgrid frequency stable is essential to protect sensitive equipment and maintain overall reliability. Advanced control techniques, including adaptive PID controllers [4], neural networks [6], and fuzzy logic systems [7], are increasingly used to maintain frequency stability despite fluctuations in load and generation. By ensuring effective frequency regulation, AIMs not only improve their own efficiency and resilience but also advance the broader objectives of smart cities for sustainable, adaptive, and secure urban energy management.
The current progress in microgrid systems centers on integrating a diverse mix of renewable energy sources such as wind turbines, solar photovoltaic systems, and biogas and biodiesel generators, along with advanced fuel cells [5]. Significant developments in energy storage, such as enhanced flywheel systems [8], next-generation batteries [9], ultra-capacitors [10], and superconducting magnetic storage [11], have become central to maintaining system reliability by effectively storing and delivering power during load changes and unexpected demand spikes. The emerging role of electric vehicles, with storage capacity and two-way charging features, also allows microgrids to manage frequency more flexibly. The addition of environmentally friendly distributed generation options continues to strengthen operational stability [12,13,14].
Leading-edge research now devotes substantial focus to robust frequency regulation strategies, utilizing adaptive solutions capable of addressing rapid demand shifts and the inherent variability in renewable energy production [15]. Micro-turbine technology is frequently deployed for immediate compensation during significant power swings, while frequency control is increasingly managed using enhanced PID and other intelligent control algorithms [16]. Practical tuning of these controllers is achieved through rule-based approaches well suited to the unique challenges posed by high-order, dynamically changing power networks. To streamline their implementation, contemporary practice often employs model order reduction, allowing for the creation of efficient control solutions that do not sacrifice system stability or performance [5,17].
AIMs possess unique operational requirements that have led to the development of several architectural configurations, including centralized, decentralized, and hybrid control frameworks [4,18]. Centralized architectures consolidate control functions within a single unit for streamlined management but may be vulnerable to single-point failures. Decentralized architectures distribute the control responsibilities across multiple localized units associated with individual energy resources, enhancing fault tolerance and scalability but necessitating efficient communication networks [19]. Hybrid architectures aim to combine the benefits of both, balancing control efficiency, robustness, and adaptability. Additionally, hierarchical control structures featuring primary, secondary, and tertiary layers are commonly adopted to handle real-time frequency regulation, energy management, and coordination with larger power systems. These architectural strategies enable airport microgrids to reliably integrate diverse energy sources and respond swiftly to fluctuating operational demands [20].
This study targets frequency regulation challenges within an islanded AIM [4] by applying an IAE-assisted PID control approach. The AIM system is initially modeled using a linearized transfer function, which is then diminished into a first-order plus dead time (FOPDT) model via a reaction curve technique [5]. Two distinct PID controllers are developed with focuses on set-point tracking (SPT) and load disturbance rejection (LDR) [21,22]. Comparative results are obtained and tabulated for an SPT-mode controller and an LDR-mode controller. The control strategy’s performance is validated through detailed assessments of the tuning parameters and time-domain system responses, evidencing its applicability for robust frequency regulation in AIM environments. The main contributions of this work are summarized as follows:
  • The derivation of a linearized transfer function model for an islanded AIM, followed by the design of an approximant in the form of an FOPDT representation using a reaction-curve-based approach to facilitate effective controller design;
  • The development of two PID controllers for set-point tracking and load disturbance rejection modes, addressing different aspects of frequency regulation;
  • The execution of a comparative evaluation demonstrating the superior transient response and frequency stabilization provided by the set-point tracking PID controller;
  • Validation of the proposed control scheme through a comprehensive analysis of the controller tuning parameters and system performance indicators;
  • The establishment of a practical framework for implementing IAE-assisted PID control in islanded AIM systems to enhance the accuracy and reliability of frequency regulation.
This paper is structured as follows: Section 2 provides an overview of the AIM architecture, including detailed modeling of the distributed generation units and energy storage devices, along with their equivalent transfer functions. This section also provides details of the design and tuning of PID controllers using rule-based methods. Section 3 details the derivation and approximation of the islanded AIM’s transfer function and presents experimental results comparing the controller performance with and without tuning. Finally, Section 4 concludes this study with summarizing remarks and future research directions.

2. Materials and Methods

2.1. Architecture of the Airport Microgrid

The schematic layout of an AIM featuring aircraft connectivity is illustrated in Figure 1. The AIM comprises various generation and energy storage components, such as a solar photovoltaic array (SPVA), a wind turbine system (WTS), an onboard aircraft system (OAS), an electric mobility unit (EMU), a diesel-based backup generator (DBG), a battery-based storage module (BSM), and a flywheel energy storage system (FESS) [23,24].
Among the generation sources, the SPVA, WTS, and DBG supply power to the AIM in a unidirectional manner. On the other hand, storage components like the BSM and FESS are capable of two-way power exchange based on the real-time grid requirements. The FESS, in particular, enhances the dynamic response due to its fast energy discharge capability and high cycling efficiency, making it suitable for mitigating rapid power fluctuations and maintaining the short-term energy balance. Special-purpose storage units, such as the EMU and OAS, are also integrated into the AIM architecture. These units contribute back to the grid during periods of energy deficit, especially when their internal battery charge levels are above predefined thresholds [24].
From a supply standpoint, renewable sources such as the SPVA and WTS are subject to high variability due to their dependence on environmental factors. Consequently, their output is non-uniform and difficult to predict. Simultaneously, the demand side also exhibits time-dependent fluctuations. This dual variability, irregular generation and a dynamic load, leads to frequent power imbalances and frequency instability, potentially compromising the resilience of the AIM. To manage these challenges effectively, each generation and storage unit integrated within the AIM is modeled independently, focusing on their energy input–output behavior. This unit-level modeling enables precise control strategies for a coordinated energy distribution, thus ensuring robust and stable microgrid operation in the airport environment [4].

2.2. Power Exchange and Frequency Deviation Within the AIM

In the islanded AIM, maintaining the system frequency within acceptable limits requires balancing the varying load demand and fluctuating output of renewable sources like wind and solar. This balance is achieved by modulating the power output of controllable distributed generation units (DGUs). The cumulative output from DGUs and energy storage devices (ESDs) constitutes the total available generation power, which must match the load demand.
The total generated power includes contributions from DGUs, likethe WTG, SPVA, DBG, OAS, and EMU, and the charge/discharge capabilities of storage elements like the FESS and BSM. This can be expressed as
P TOTAL = P WTG + P SPVA + P DBG + P OAS + P EMU ± P FESS ± P BSM
In (1), P TOTAL represents the total power. Meanwhile, P WTG , P SPVA , P DBG , P OAS , P EMU , P FESS , and P BSM denote, respectively, the power outputs from WTG, SPVA, DBG, OAS, EMU, FESS, and BSM units. The instantaneous power imbalance, or net power P net , is calculated as the difference between the total generation and the actual load variation, as given by
P net = Δ P WTG + Δ P SPVA + Δ P DBG + Δ P OAS + Δ P EMU ± Δ P FESS ± Δ P BSM Δ P L
In (2), Δ P L is the change in the load demand. Meanwhile, Δ P WTG , Δ P SPVA , Δ P DBG , Δ P OAS , Δ P EMU , Δ P FESS , and Δ P BSM are, respectively, the change in the power of the WTG, SPVA, DBG, OAS, EMU, FESS, and BSM units. This net power imbalance results in a deviation in the system frequency. The relationship between the frequency deviation and net power is governed by the following expression:
Δ f = 1 D G E N D + s M G E N D P net
where Δ f is the frequency deviation. However, M G E N D represents the system inertia constant, and D G E N D is the damping coefficient. To keep the frequency deviation Δ f within acceptable margins, the output from the ESDs and controllable DGUs is regulated accordingly. In this study, a PID-control-based approach is employed to ensure frequency stability within the AIM.

2.3. Mathematical Models of Different Units

The AIM contains various generation and storage units, including the SPVA, WTS, DBG, BSM, FESS, OAS, and EMU. While the SPVA, WTS, and DBG supply power in a unidirectional manner, storage units such as the BSM and FESS allow for a bidirectional power flow to balance supply and demand. The FESS particularly aids in a rapid response to power fluctuations. Special units like the OAS and EMU contribute back to the grid when their battery charges exceed defined thresholds. Each unit is modeled independently to enable precise control and to address variability in renewable generation and load fluctuations, ensuring stable frequency regulation and effective operation of the AIM. The detailed mathematical models of these units are given as follows.

2.3.1. Solar Photovoltaic Array

The SPVA is represented using a dynamic model in the form of a first-order transfer function to facilitate analysis and control within the AIM. The SPVA’s output, influenced by irradiance and temperature variations, is modeled as
T F S P V A ( s ) = K S P V A 1 + s T S P V A
where K S P V A and T S P V A are the gain and time constant, respectively.

2.3.2. Wind Turbine System

For the WTS, which is governed by the wind speed dynamics and turbine inertia, the system is represented by
T F W T S ( s ) = K W T S 1 + s T W T S
where K W T S and T W T S represent, respectively, the gain and time constant.

2.3.3. Onboard Aircraft System

The OAS, in mathematical form, is represented by
T F O A S ( s ) = K O A S 1 + s T O A S
where K O A S and T O A S denote the gain and time constant of the OAS, respectively.

2.3.4. Electric Mobility Unit

For the EMU, the system is represented by
T F E M U ( s ) = K E M U 1 + s T E M U
where K E M U and T E M U are the gain and time constant of the EMU system, respectively.

2.3.5. Diesel-Based Backup Generator

For the DBG, the transfer function is given by
T F D B G ( s ) = K G E N 1 + s T G E N K G O V 1 + s T G O V
where K G E N , T G E N , K G O V , and T G O V , respectively, represent the generator gain, generator time constant, governor gain, and governor time constant.

2.3.6. Battery-Based Storage Module

The BSM plays a critical role in enhancing the dynamic stability of the microgrid by delivering rapid power support during short-term disturbances [25]. Its dynamic behavior can be approximated using a first-order transfer function as
T F B S M ( s ) = K B S M 1 + s T B S M
where K B S M and T B S M are called the gain and time constant of the BSM, respectively.

2.3.7. Flywheel Energy Storage System

The FWESS functions by storing excess electrical energy in the form of kinetic energy when demand is low and releasing this energy back into the grid during high-demand periods. This capability allows for effective balancing of power fluctuations. The dynamic behavior of the FWESS can be captured by a first-order transfer function, expressed as
T F F W E S S ( s ) = K F W E S S 1 + s T F W E S S
where K F W E S S denotes the system gain, and T F W E S S is the time constant characterizing the response speed of the flywheel storage unit.

2.3.8. Dynamics of Generator

The equivalent dynamic model of the microgrid can be characterized by the following transfer function:
T F GEND ( s ) = 1 D G E N D + s M G E N D
where M G E N D denotes the aggregated inertia constant of the system, while D G E N D represents the overall damping factor. This formulation reflects the relationship between the system frequency dynamics and disturbances within the microgrid environment.
Nominal parameters [4,23,24] and their respective transfer function models for each energy source and storage component are listed in Table 1. The value of the regulation coefficient, R, is taken as 3 for the considered AIM.

2.4. Block Diagram of AIM

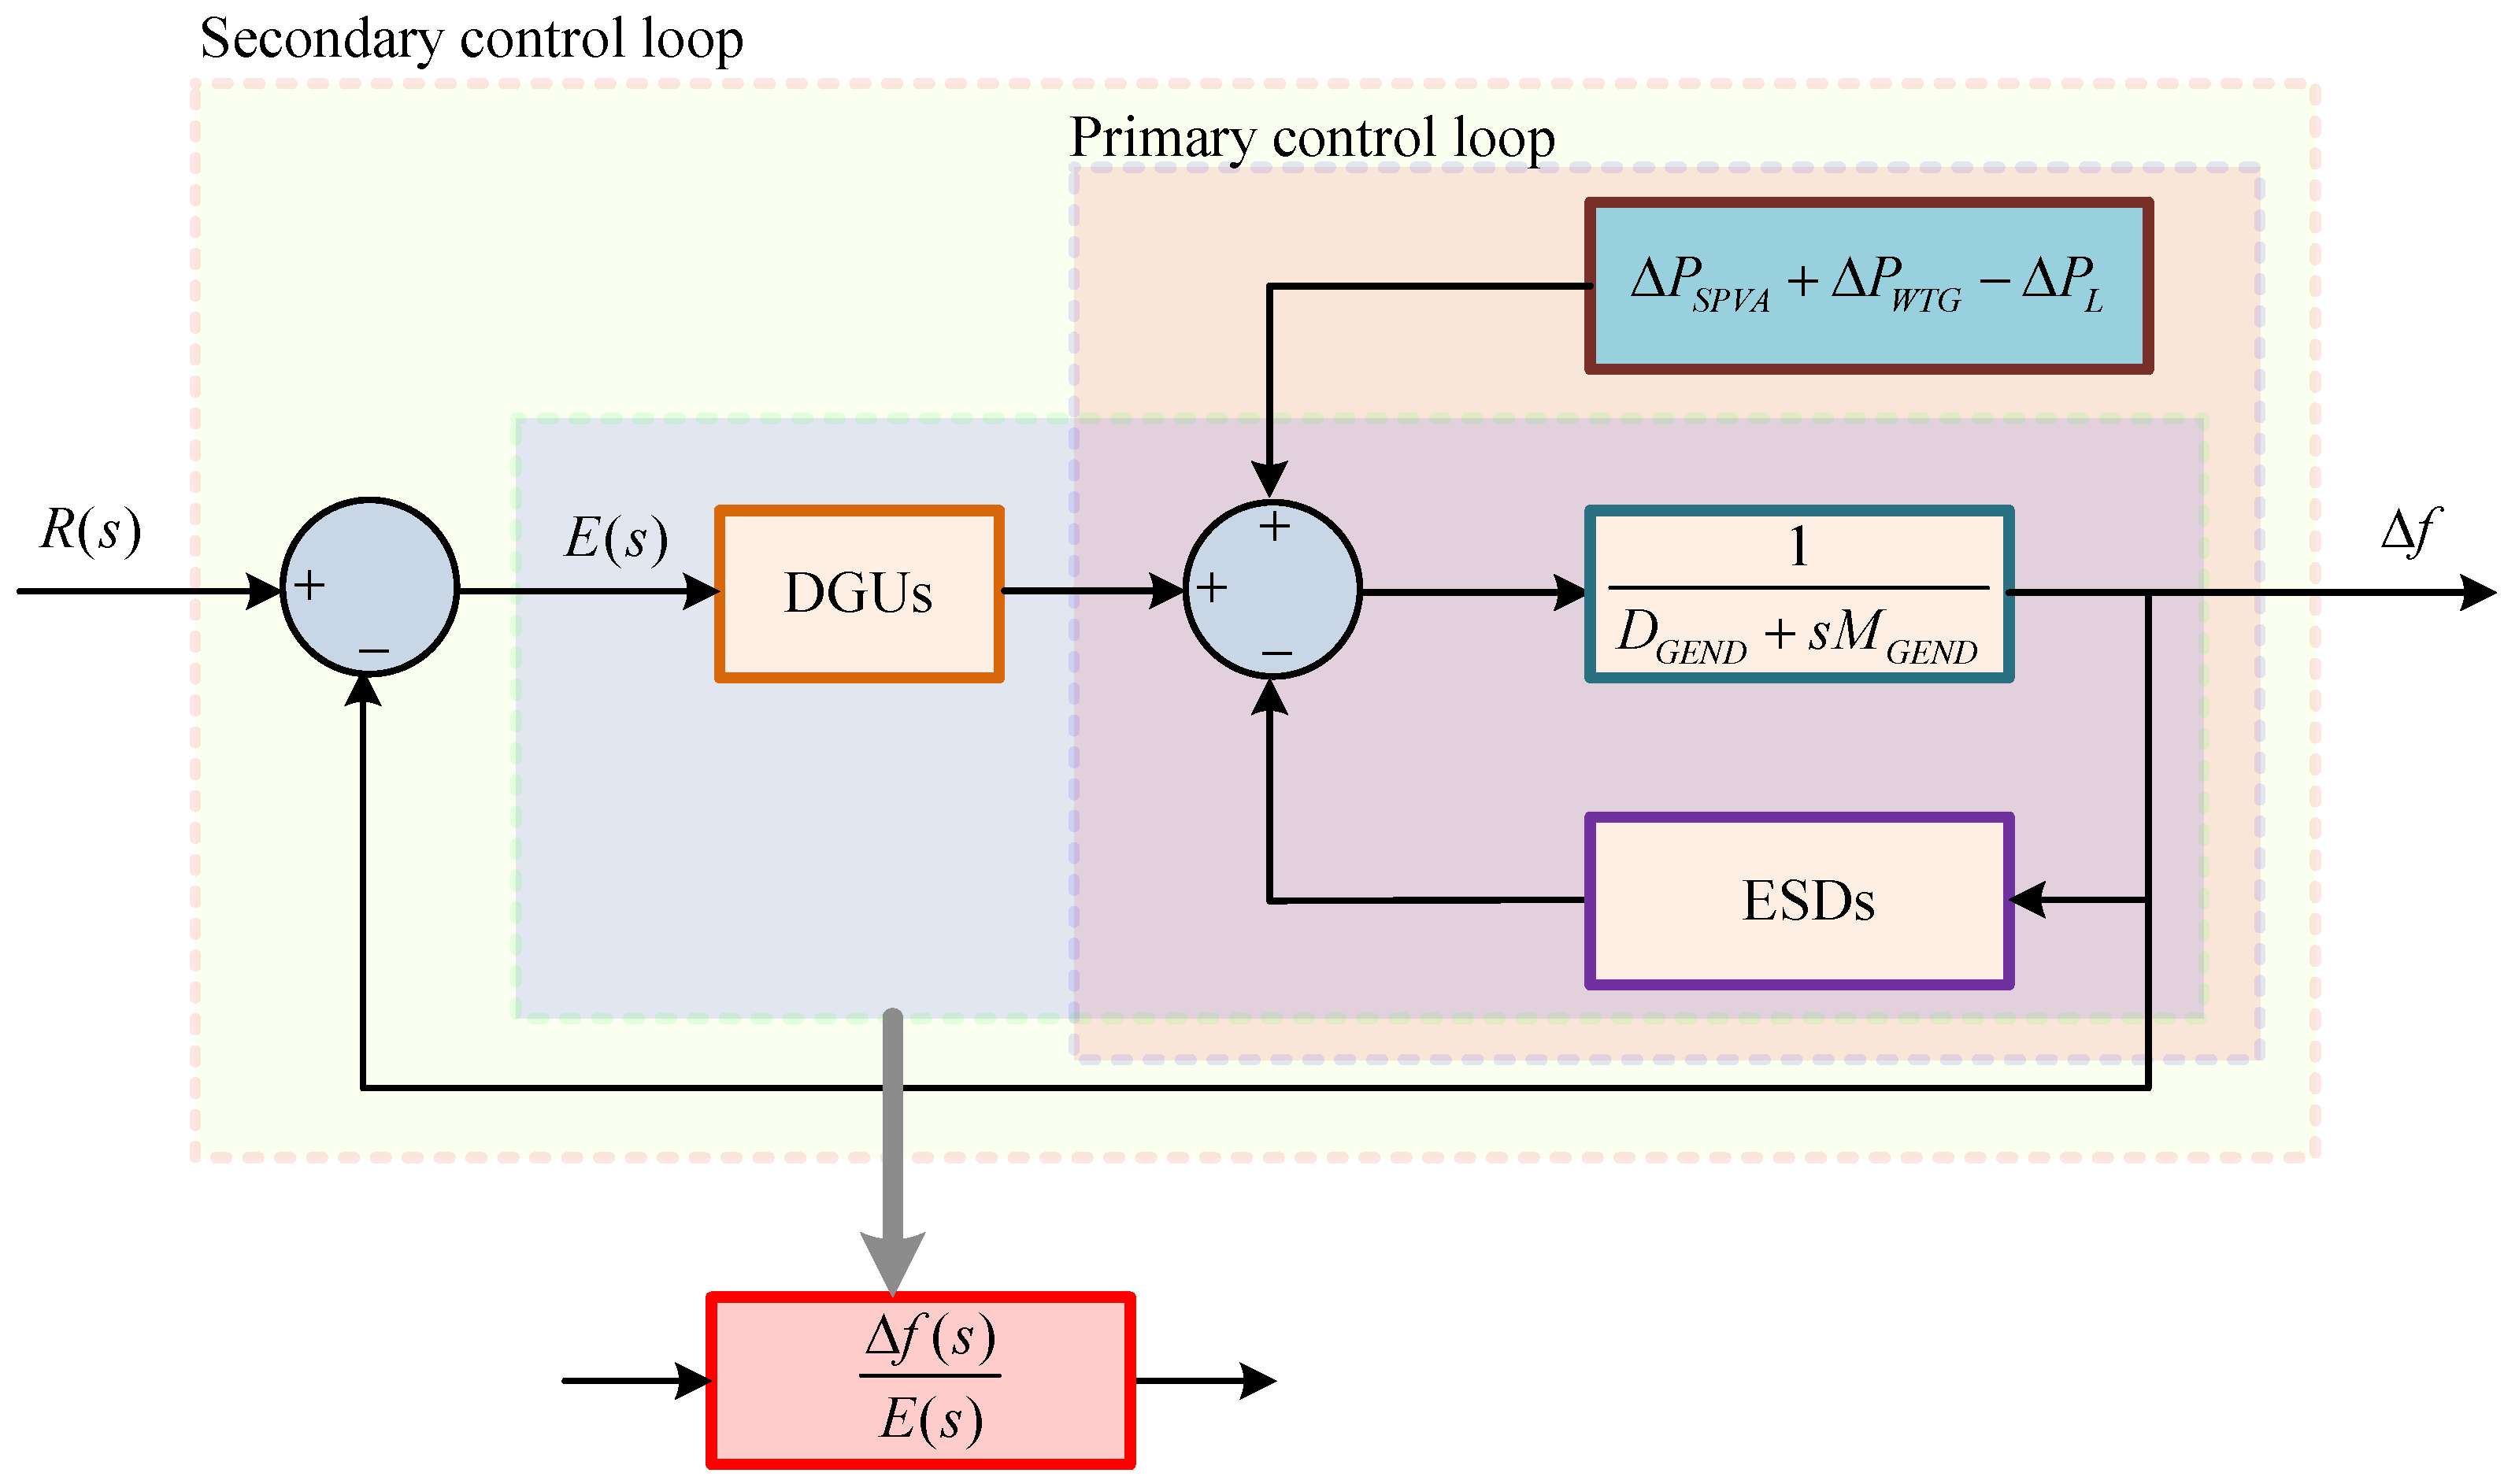
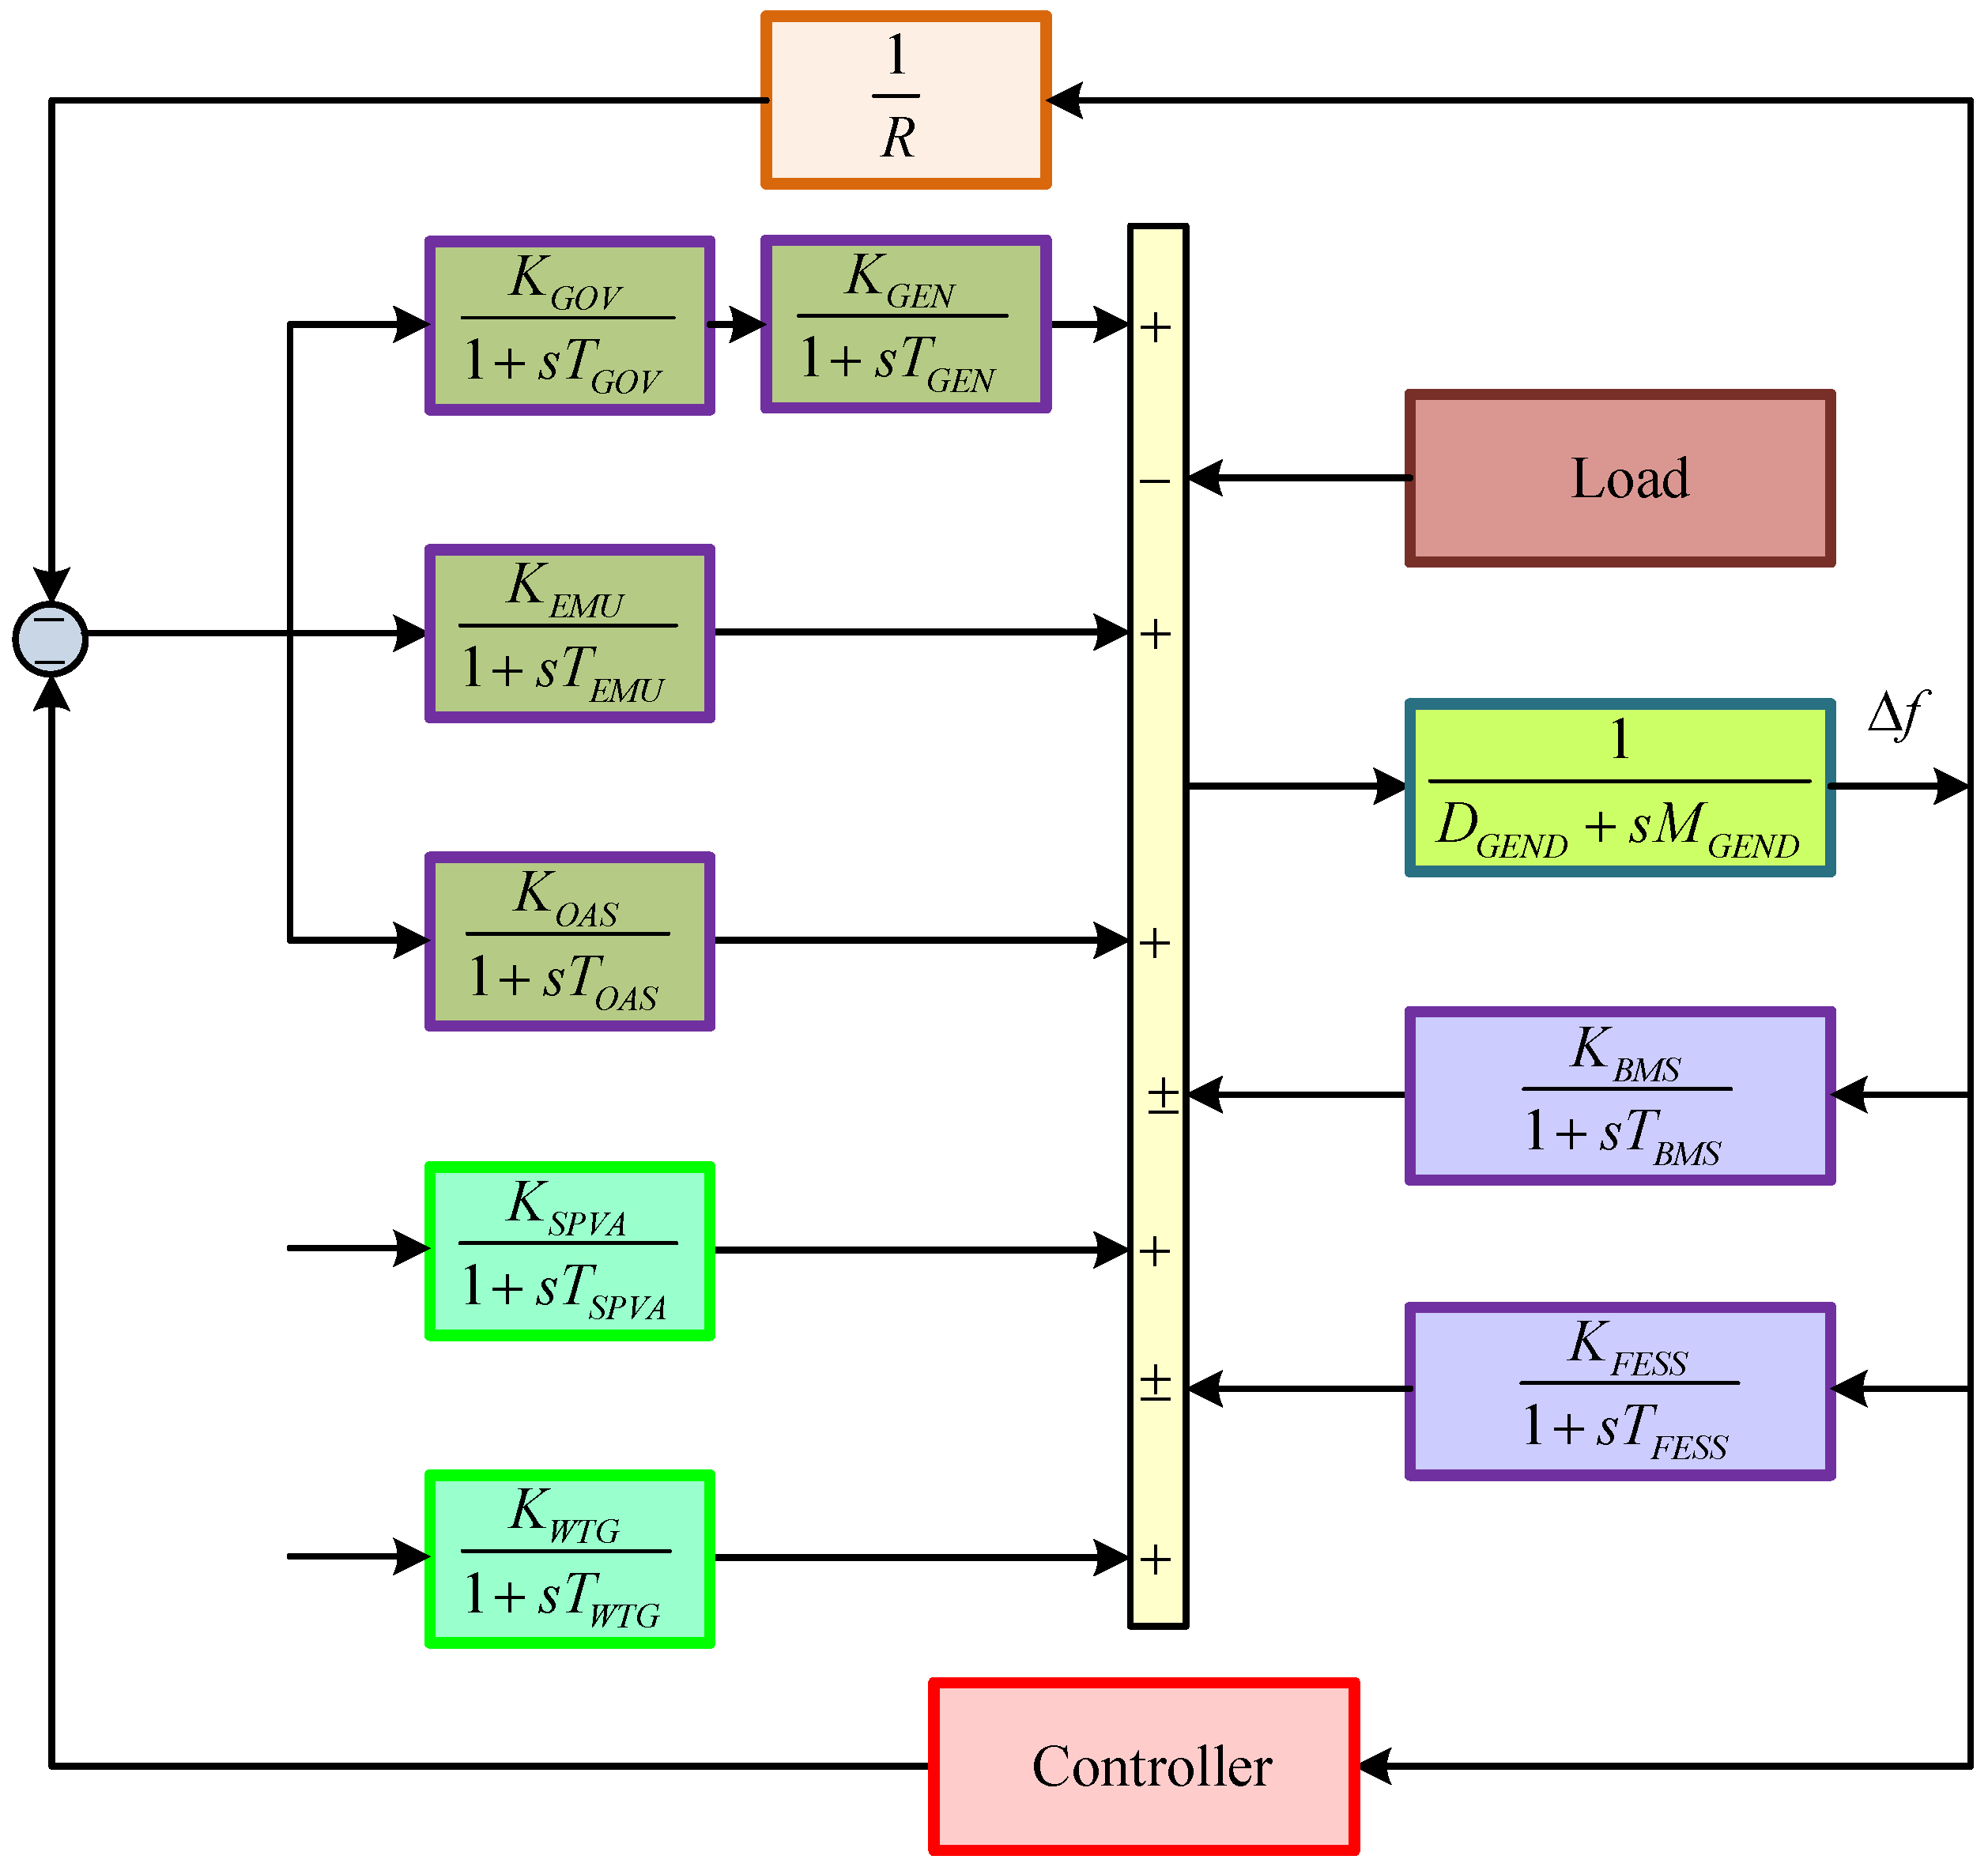
A block diagram representing the islanded AIM, developed from the layout shown in Figure 1, is illustrated in Figure 2. This configuration incorporates a two-tiered control system: the primary control layer, which focuses on a rapid response through ESDs such as the BSM and FESS, and the secondary control layer, which manages slower adjustments via DGUs such as the SPVA, WTS, OAS, EMU, and DBG. To maintain stable operation and power balance under varying conditions, the DGUs are regulated in response to the system demand and generation imbalance. In contrast, ESDs are employed for immediate compensation during transient events. Within this scheme, primary control delivers quick stabilization through fast-responding storage systems, while secondary control provides longer-term power regulation using dispatchable generation assets.
Intermittent renewable sources like the SPVA and WTS, which are affected by environmental variability, are modeled as disturbance inputs rather than controllable elements. Their output’s unpredictability requires balancing the support from other controllable units in the system. The dynamic behavior of both ESDs and DGUs is represented using first-order transfer functions, as described in Equations (4)–(11).

2.5. Equivalent Block Diagram of AIM

The simplified equivalent representation of Figure 1 is depicted in Figure 3, which outlines the roles of DGUs, ESDs, and the aggregate system dynamics. Key control variables, including P D G U , P E S D , P T , Δ f , and the disturbance signal, D ( s ) , are also highlighted in the diagram. The dynamic behavior of the system in the forward path is captured using a transfer function, denoted as G M ( s ) . This function is given by
G M ( s ) = Δ f ( s ) E ( s )
The terms Δ f ( s ) and E ( s ) are expressed as polynomials of the Laplace variable, s, as follows:
Δ f ( s ) = i = 0 n 1 A i s i
E ( s ) = i = 0 n B i s i
In these expressions, A i and B i denote the polynomial coefficients for the numerator and denominator, respectively, where i ranges from 0 to n 1 for A i and from 0 to n for B i . This model is utilized to investigate the frequency response characteristics of the islanded AIM under varying power imbalance conditions.

2.6. First-Order Plus-Dead-Time-Based Control

This study employs a control strategy based on the FOPDT model to regulate the dynamics of the AIM. The approach involves initially simplifying the higher-order transfer function of the system into a first-order model with an inherent delay, known as the FOPDT representation [24]. This simplified model is then used as the foundation for controller design.
The original high-order system model, referred to in Equation (12), is approximated using the following FOPDT transfer function given by
G F O P T D ( s ) = K 1 + s τ m e τ d s
In (15), K denotes the system gain, τ m is the time constant, ( τ m > 0 ) , and τ d is the time delay ( τ d > 0 ) . These parameters form the basis of the FOPDT model, (15), which serves as a reduced-order approximation of the original system.
Accurately identifying these parameters is essential to ensure that the simplified model effectively captures the key dynamic characteristics of the actual system. This, in turn, enables meaningful analysis and controller design for complex systems. Several techniques are available for estimating the FOPDT parameters, including the Skogestad half-rule, Taylor series expansion, curve fitting, relay feedback, the process reaction curve, and step response methods [24]. In the present work, the process reaction curve method is employed for estimation of the FOPDT model for the AIM. After creating the FOPDT model, an IAE-based PID controller is designed to regulate the AIM.
The IAE-based PID controller [26] is designed for set-point tracking and disturbance rejection in this work, for frequency regulation within the AIM. The model of the PID controller considered is given as
U ( s ) / E ( s ) = K p 1 + 1 T i s T d s + 1 0.1 T d s + 1
In (16), U ( s ) represents the output of the controller, while E ( S ) denotes the error signal, defined as the difference between the reference (desired) value and the actual measured value in the Laplace domain. The parameters T i , T d , K p correspond to the integral time constant, the derivative time constant, and the proportional gain, respectively. Table 2 outlines the tuning rules for the PID controller for set-point tracking (SPT) and load rejection (LDR) based on τ m and τ d .

3. Results and Discussion

This section presents the results of IAE-based control design for an islanded AIM. The analysis is carried out for both SPT and LDR modes. The process begins by deriving the overall seventh-order transfer function of the AIM. This higher-order representation is then approximated using an FOPDT representation to determine the system gain, the time constant, and the time delay. Using these parameters, an IAE-based control strategy is formulated for the AIM.
The results are organized into distinct subsections. The first subsection covers the derivation of the overall transfer function, the second presents the FOPDT model, and the third describes the IAE-based control design for the SPT and LDR modes. The inclusion of both SPT and LDR modes provides a comprehensive evaluation of the controller’s performance. While the SPT mode emphasizes the system’s ability to follow reference changes, the LDR mode highlights its effectiveness in rejecting load disturbances.

3.1. AIM Overall Model

The transfer function of the AIM is derived by taking the frequency deviation, Δ f ( s ) , as the output variable and the error, E ( s ) , as the input variable. A generalized form of the transfer function is given in (12). By using the values of the different components from Table 1, the overall model of the AIM becomes that given in (17).
G M ( s ) = Δ f ( s ) E ( s ) = i = 0 5 A i s i i = 0 7 B i s i
Table 3 lists the numerator and denominator coefficients of the islanded AIM.

3.2. Determination of the FOPDT Model

The transfer function of the AIM under consideration, presented in (17), is a seventh-order system. To ease the complexity of the analysis and support controller design, this high-order model is approximated using a first-order plus dead time (FOPDT) model through the application of the process reaction curve technique. The reaction curve derived from (17) is illustrated in Figure 4, with the extracted model parameters summarized in Table 4. In Figure 4, the tangent cut on the x-axis is analogous to the delay time. However, the steady state of the step response provides the gain of the FOPDT model.
Using the parameters listed in Table 4, the FOPDT approximation of the AIM is formulated as shown in (18).
G F O P D T ( s ) = 0.996 1 + 0.210764 s e 0.048891 s
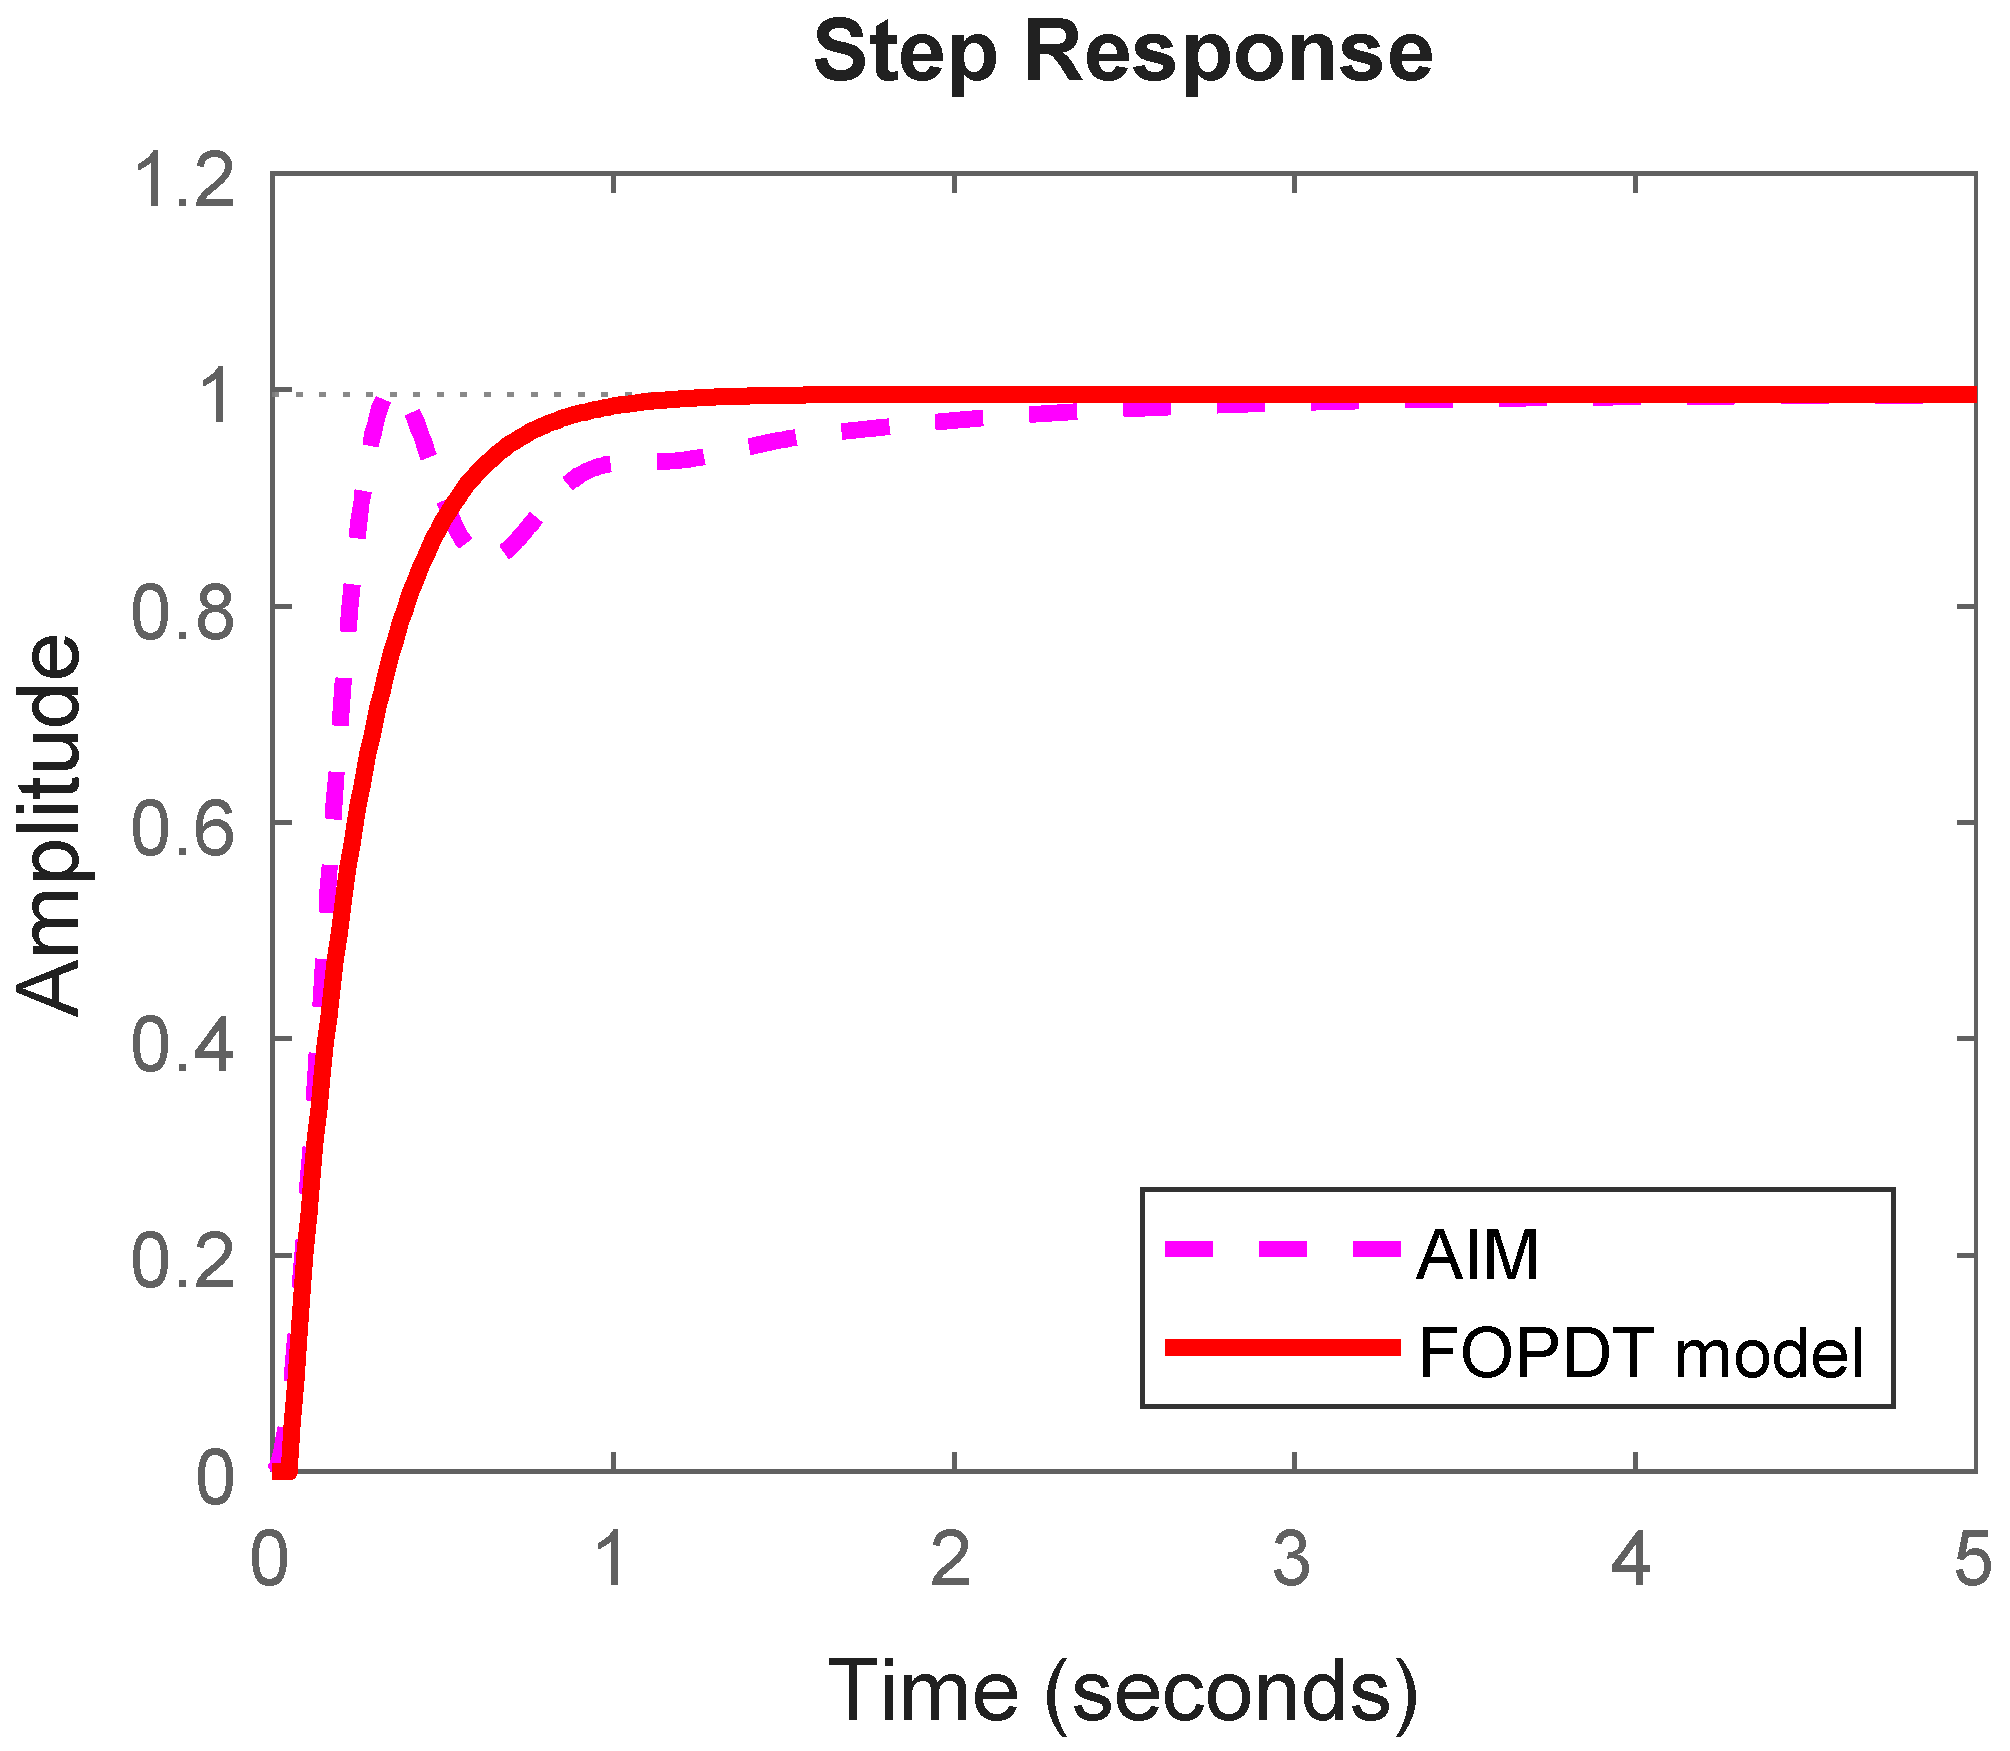
The validity of the approximated FOPDT model is assessed through a step response analysis, presented in Figure 5. The figure demonstrates that the approximated model exhibits stable behavior and closely matches the dynamic response of the original AIM. Table 5 summarizes the time-domain specifications, e.g., the rise time, peak time, settling time, and peak value, for both models. Both systems converge to identical steady-state values, i.e., 0.9960. The peak value for the FOPDT model is calculated as 0.9960, with no overshoot or undershoot. For the AIM, the rise time and the peak time are 0.2002 s and 0.3553 s, respectively, while the FOPDT model yields 0.4630 s for the rise time and 1.6403 s for the peak time. The settling times are also found to be 2.1727 s for the AIM and 0.8734 for the FOPDT model.
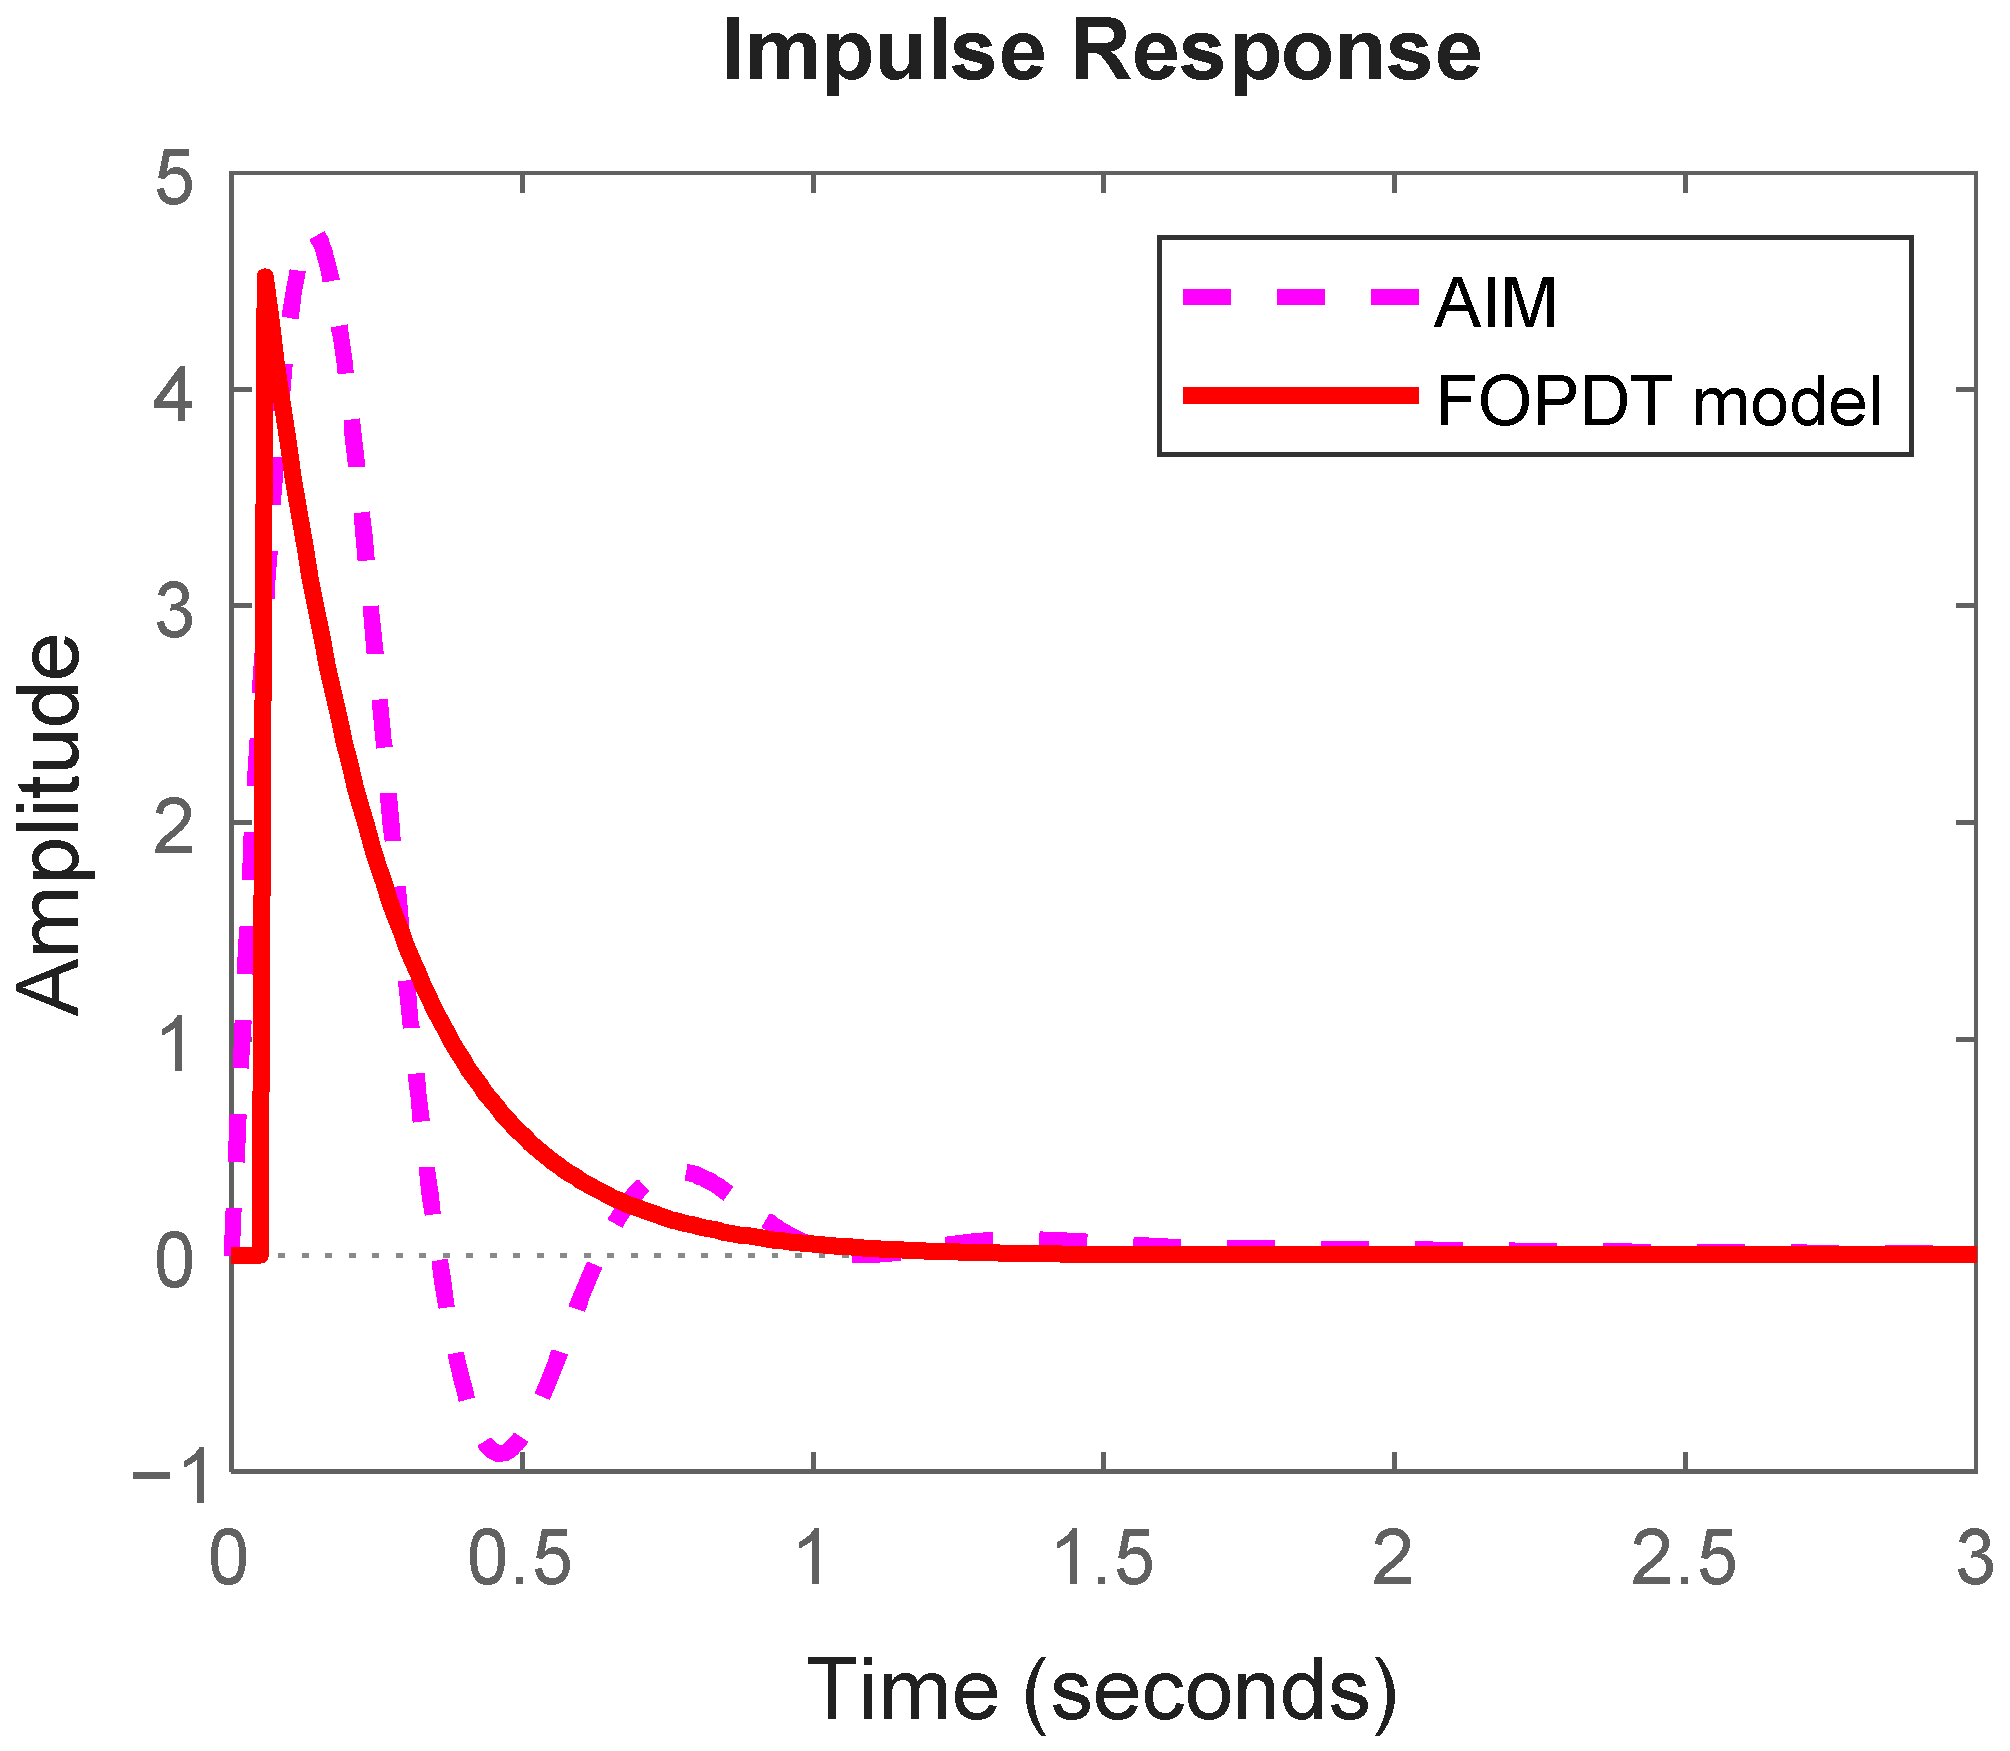
Table 6 quantifies differences in terms of error indices like the integral absolute error (IAE), integral squared error (ISE), integral time-weighted absolute error (ITAE), integral time-weighted squared error (ITSE), the integral of the time squared weighted absolute error (IT2AE), and the integral of the time squared weighted squared error (IT2SE). All of the error indices are within acceptable limits, indicating that the reduced-order model effectively represents the dynamics of the islanded AIM. Further validation is carried out by comparing the impulse response, illustrated in Figure 6. In this case as well, the FOPDT model follows the time-domain behavior of the original system.
On the basis of Figure 5 and Figure 6 and Table 5 and Table 6, it can be concluded that the proposed FOPDT model is a reliable and accurate approximation of the original seventh-order islanded AIM, making it suitable for subsequent control design and performance analysis.

3.3. IAE-Based Control Design

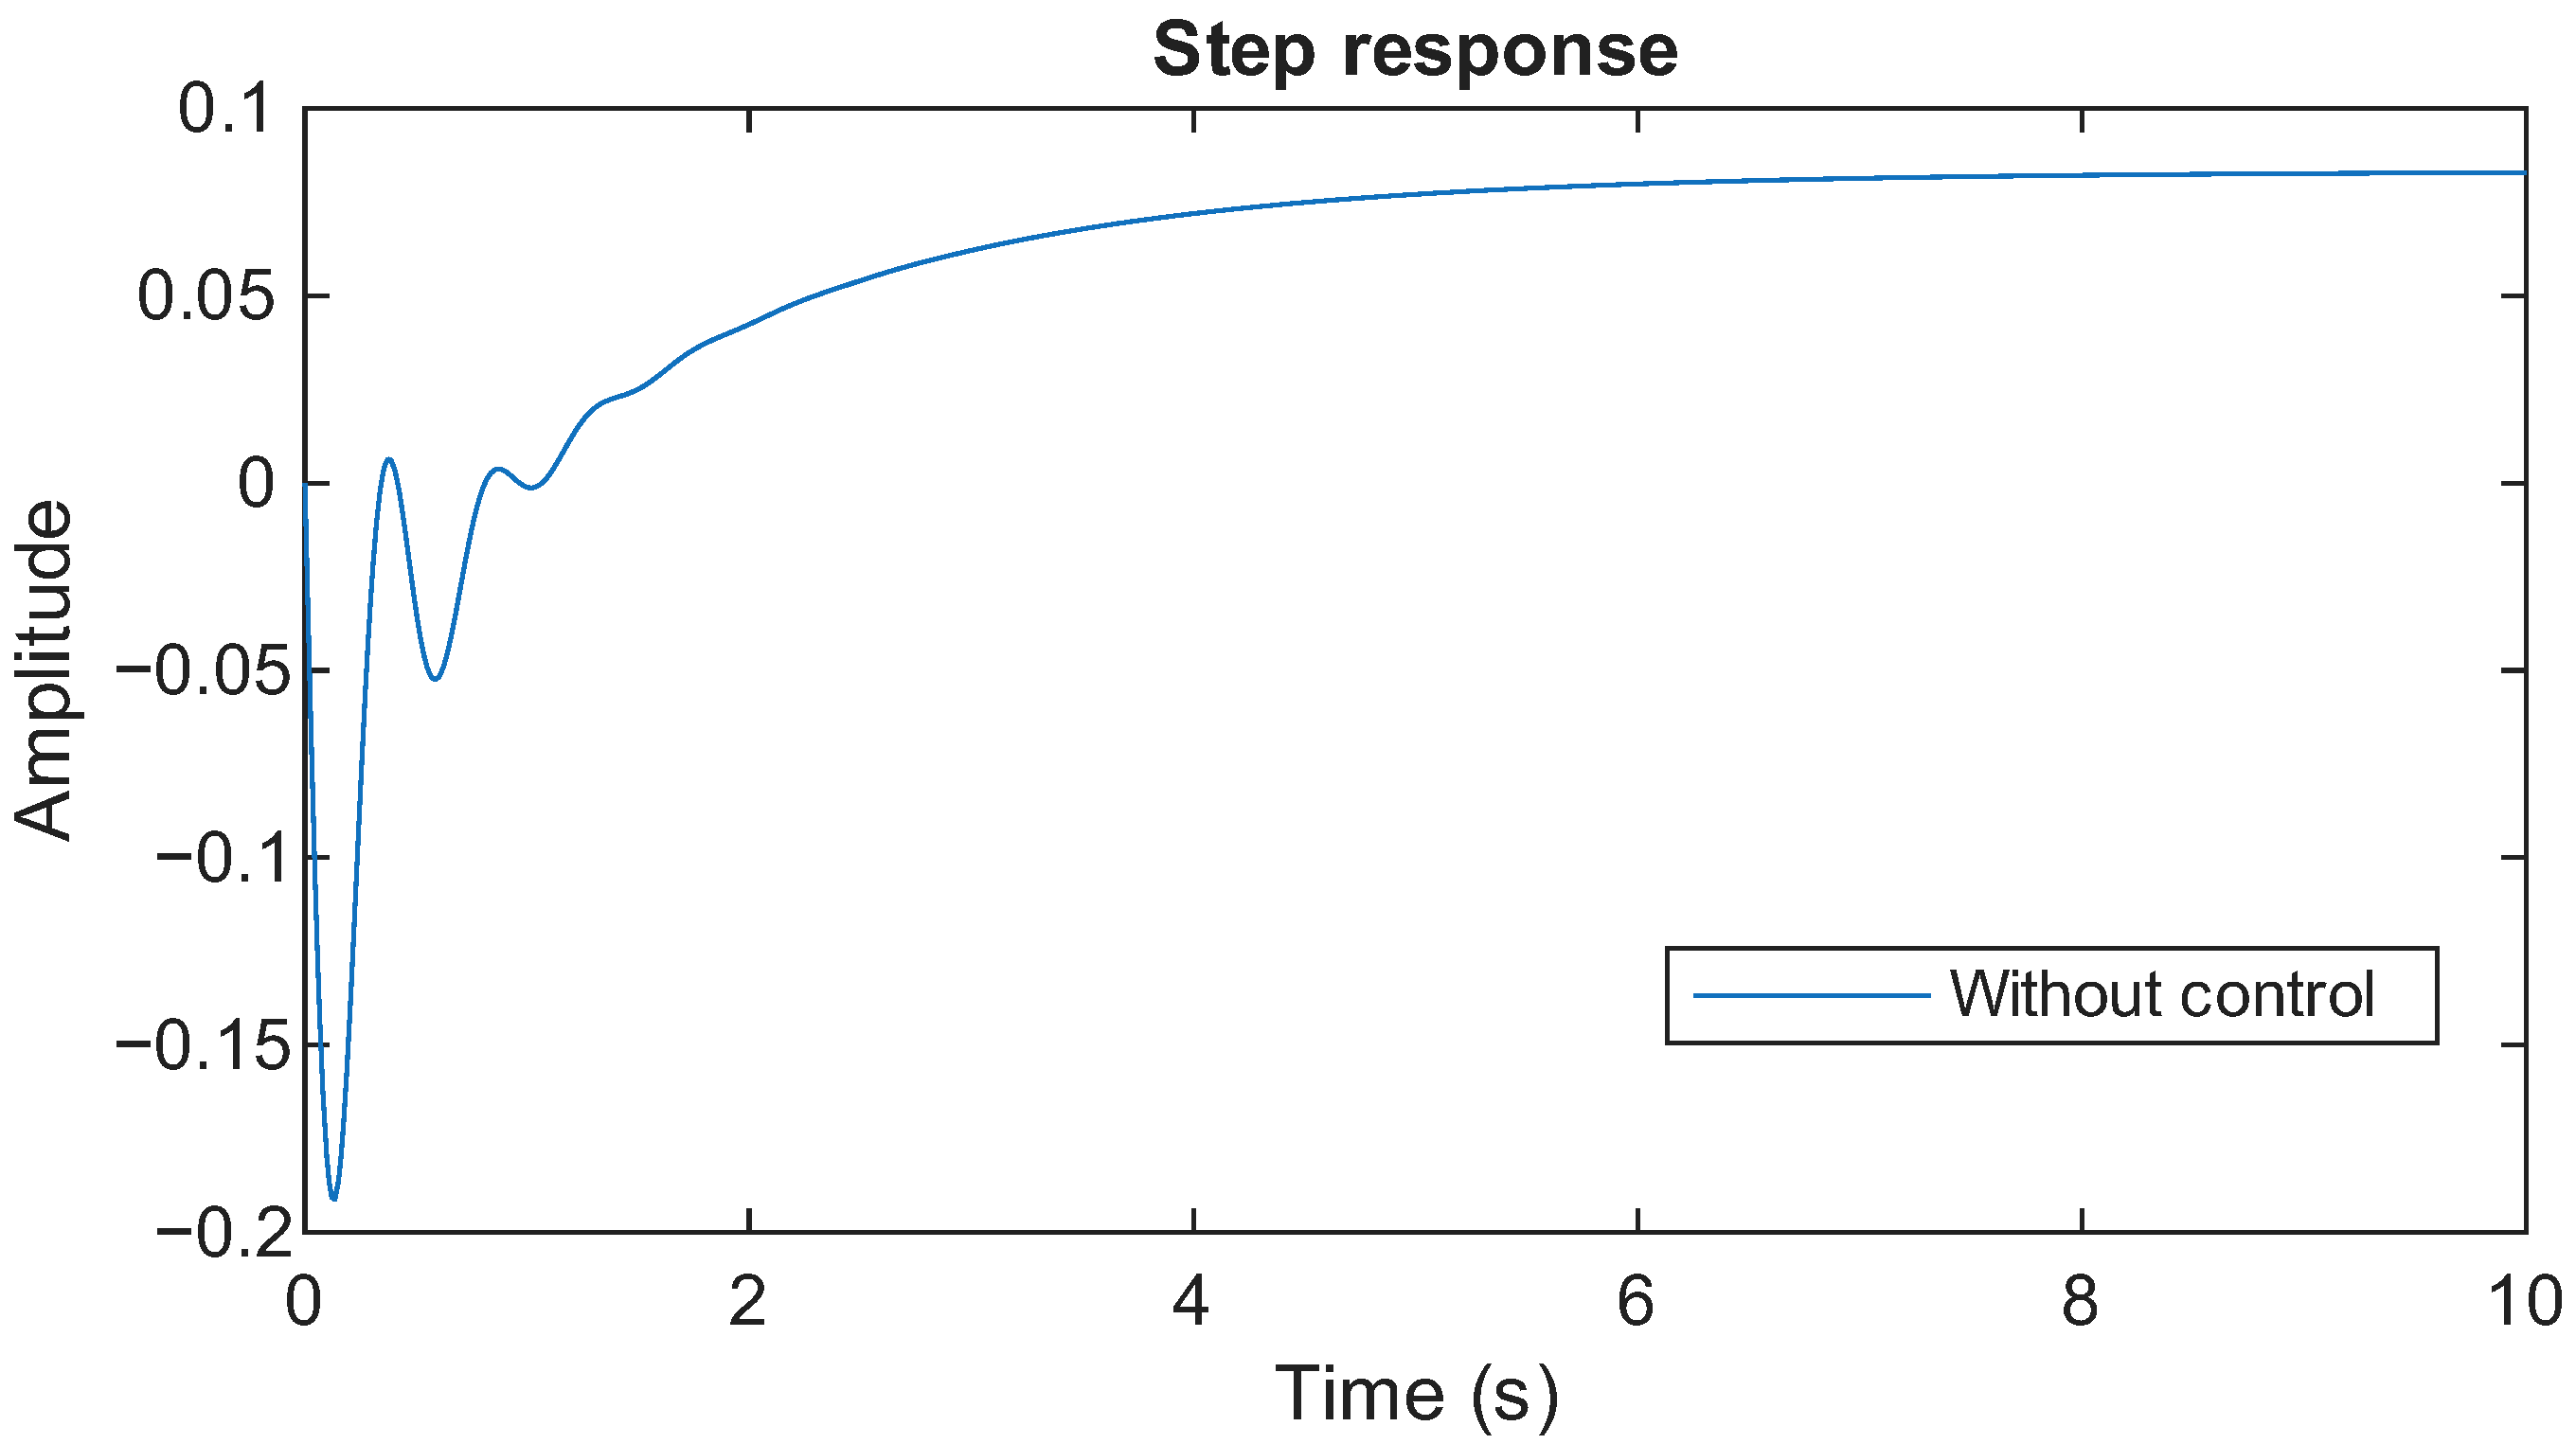
The frequency response of the AIM without a controller is shown in Figure 7. The time-domain indicators for this response are provided in Table 7. It is noticed that the presented response possesses a steady state difference of 0.0828. Additionally, the peak deviation reaches 0.1912 at a time of 0.1345 s. This undesired steady-state deviation must be mitigated using IAE-based control.

3.3.1. Control Design for SPT Mode

The tuning rules for the SPT mode are listed in Table 2. Upon substituting the values of K, τ m , and τ d from Table 4, Table 2 is updated to Table 8. Using these values in Equation (16), the PID controller is obtained as follows:
P I D IAE _ SPT ( s ) = U ( s ) E ( s ) = 3.663470 1 + 1 0.209827 s 0.020700 s + 1 0.002070 s + 1
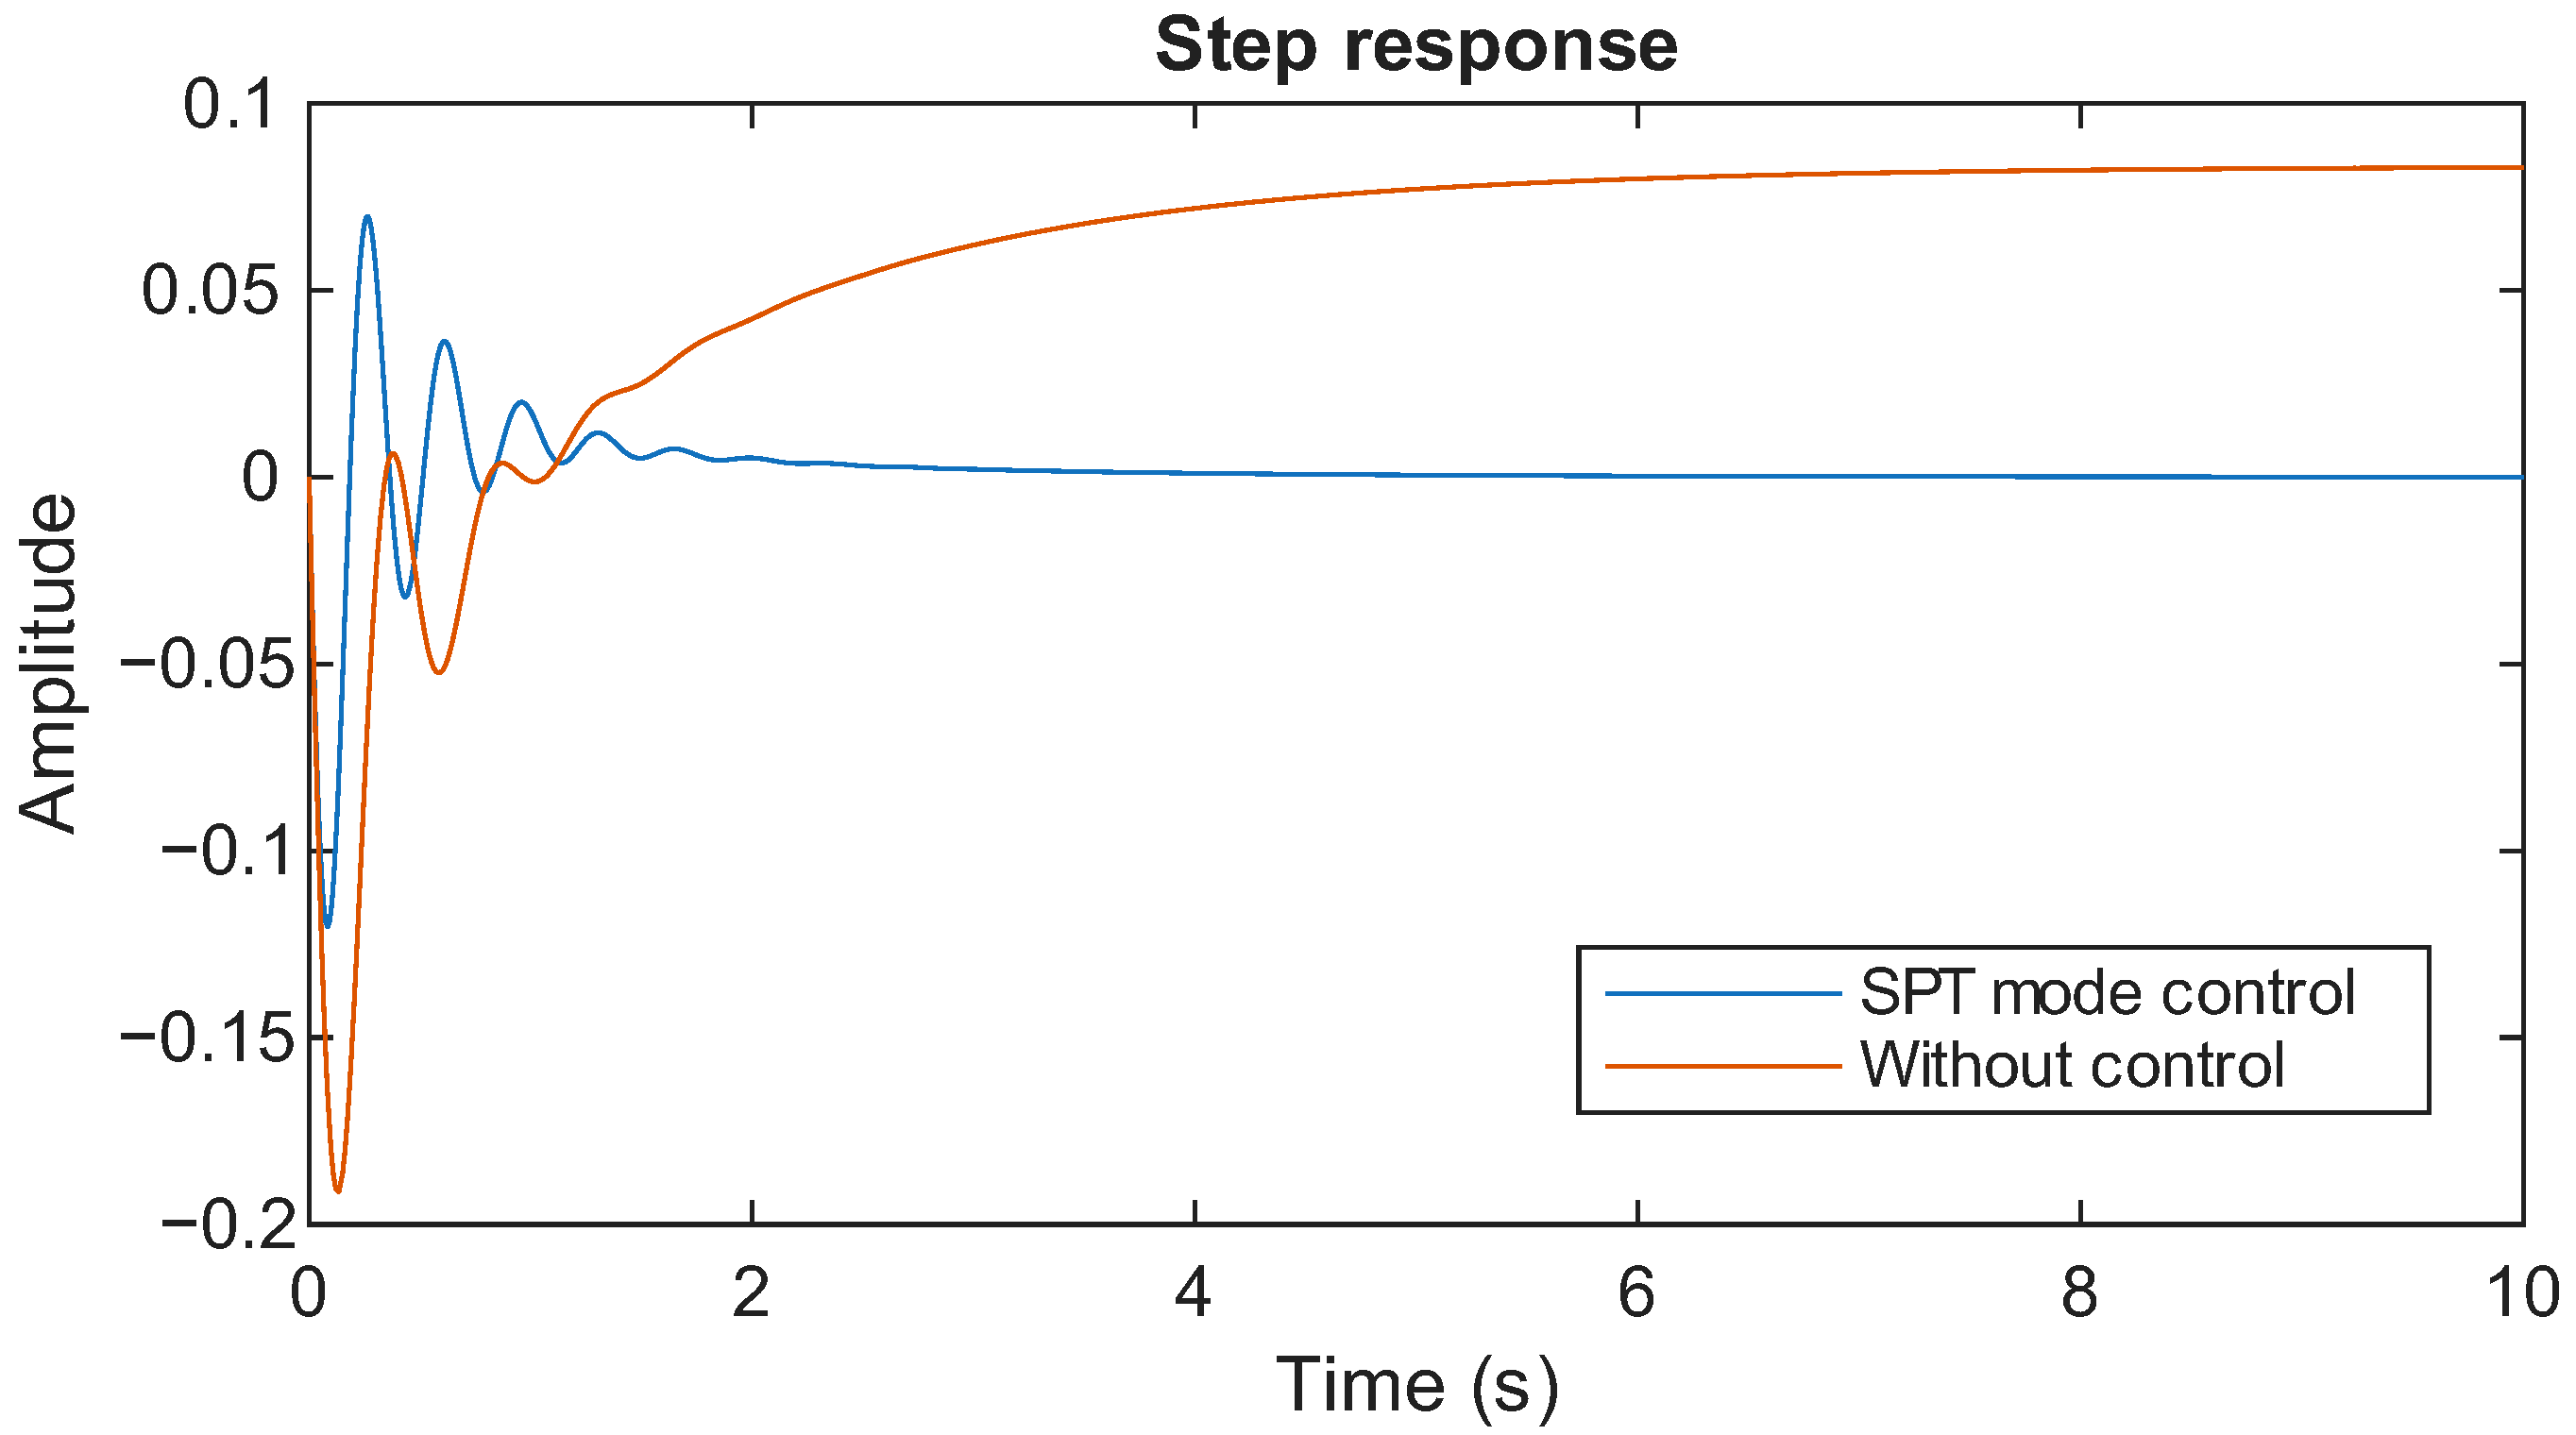
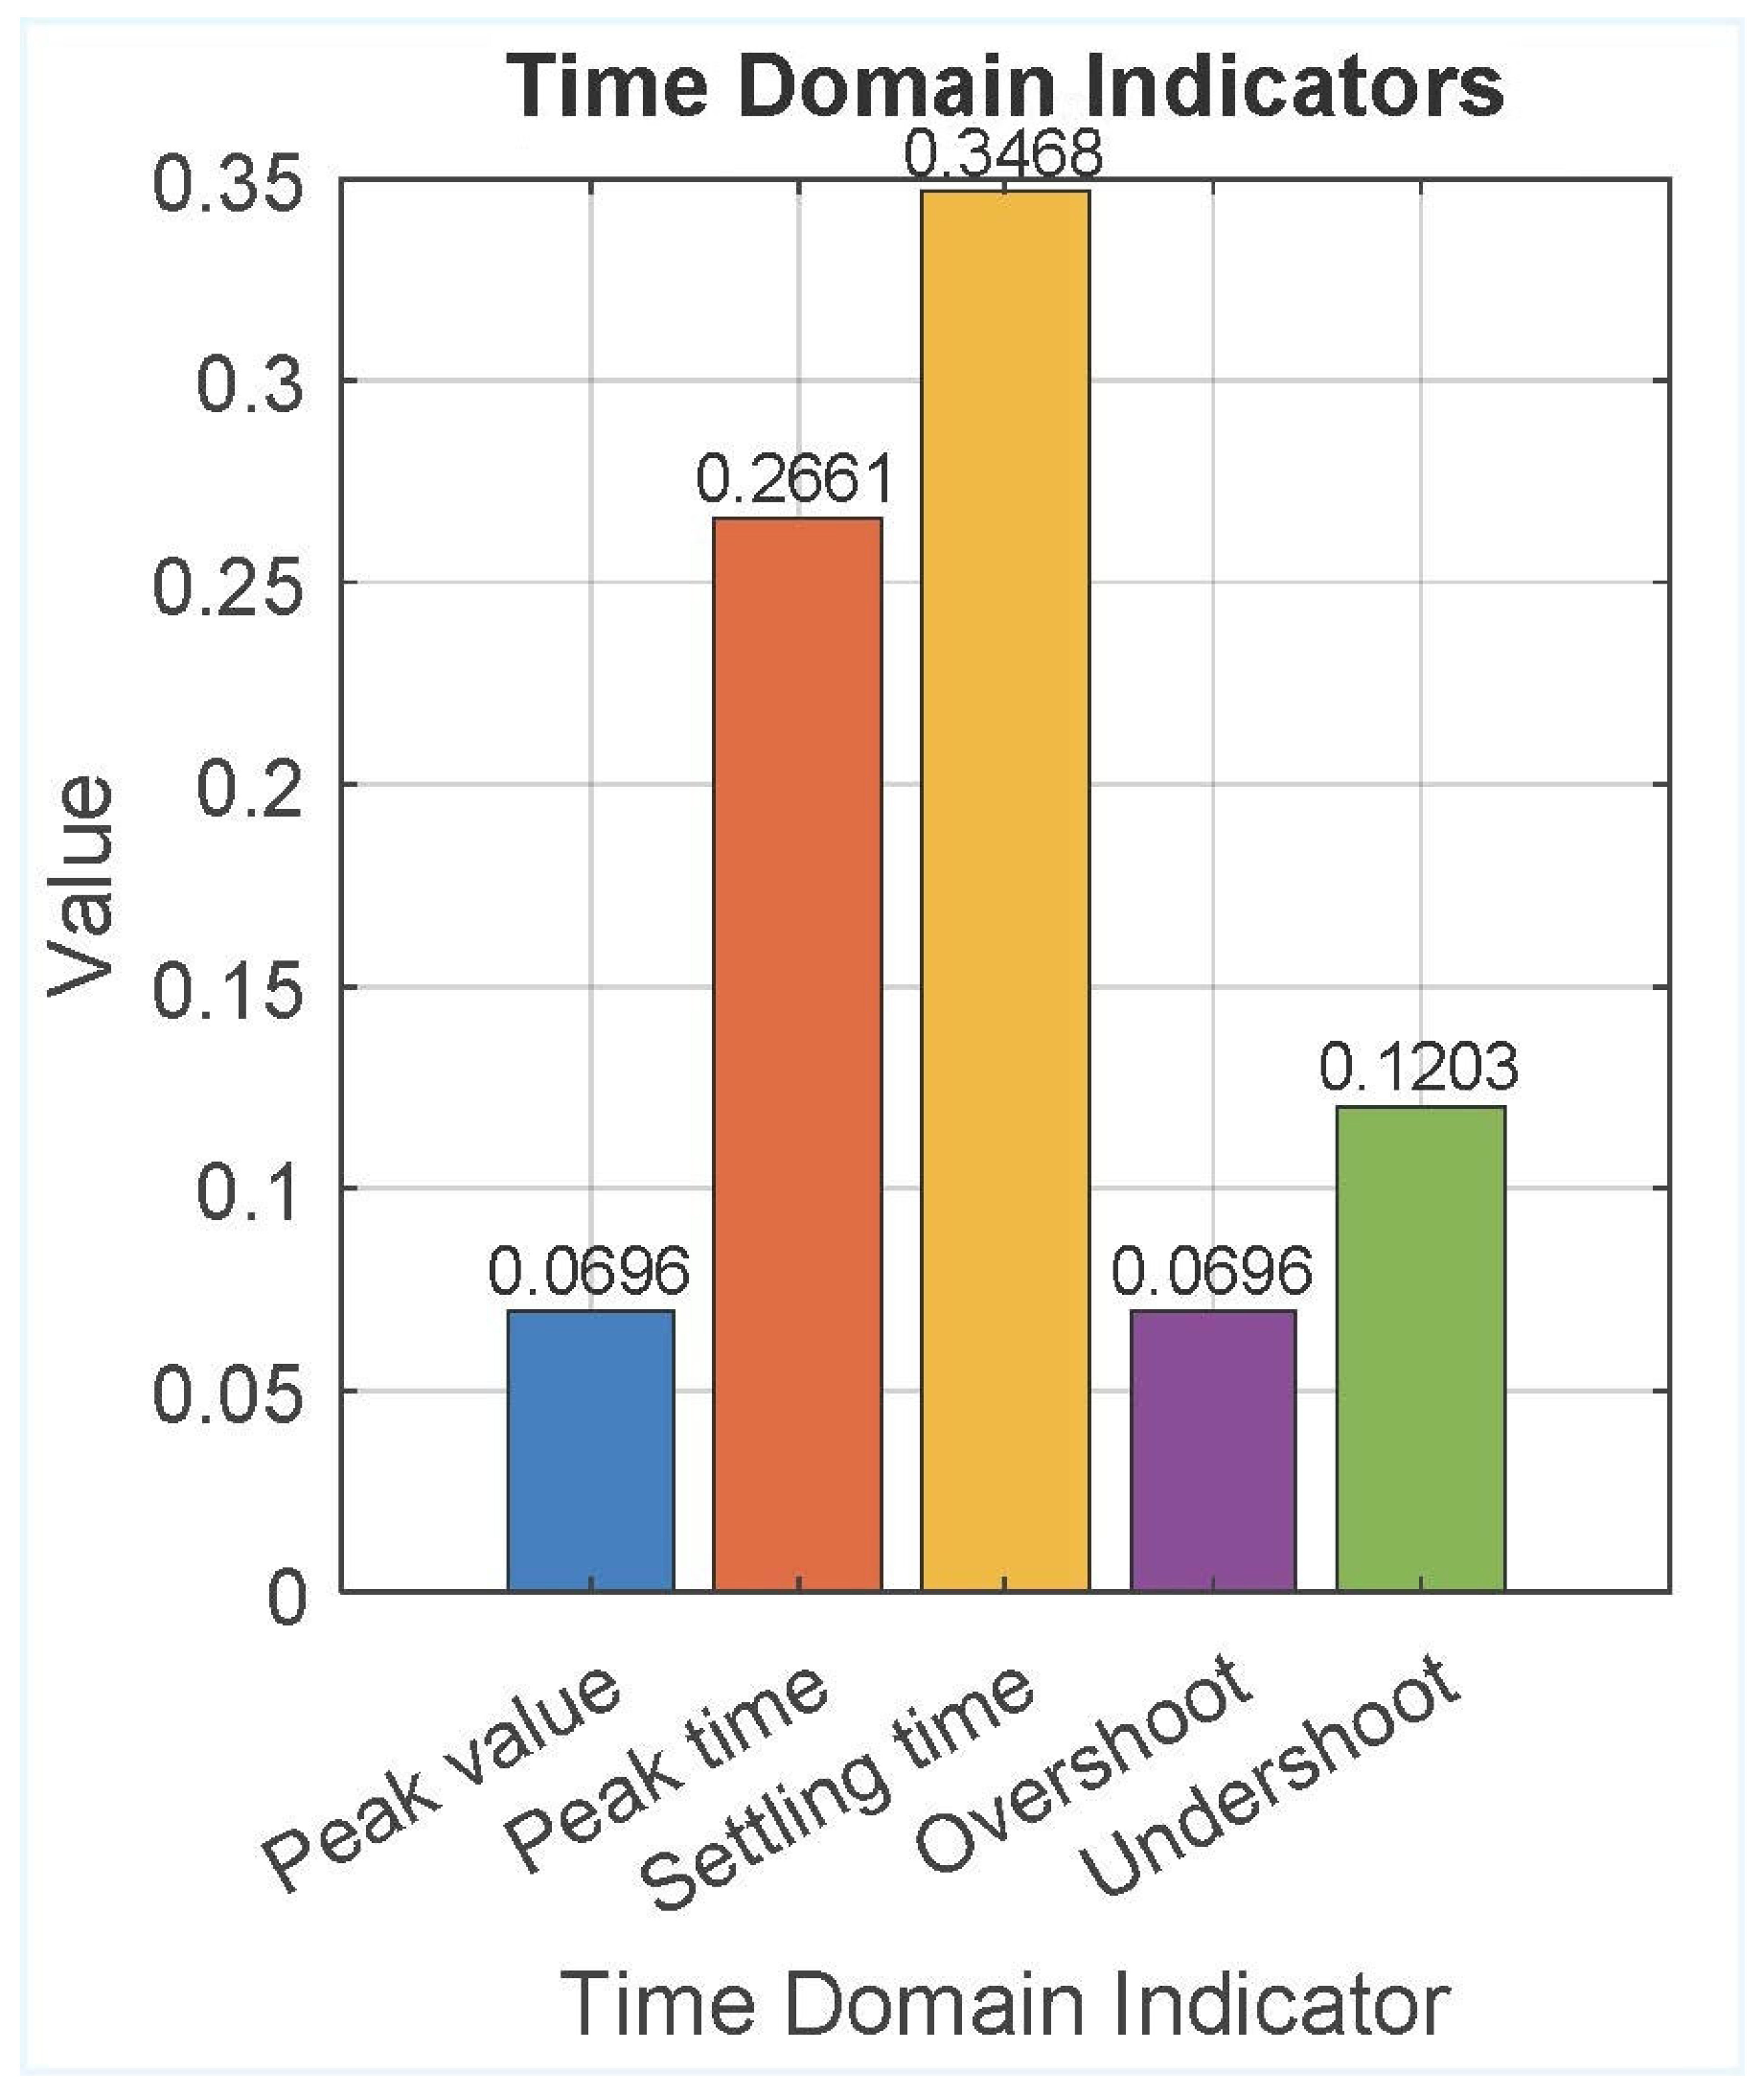
The impact of IAE-based PID control is presented in Figure 8 for SPT mode. However, the time-domain indicators for SPT mode are shown in Table 9. A bar chart for the indicators is also provided in Figure 9. The values of the peak, peak time, overshoot, and undershoot are found to be 0.0696, 0.2661 s, 0.0696, and 0.1203 with a settling time of 0.3468 s. This shows that IAE-based control mitigates the frequency response effectively.
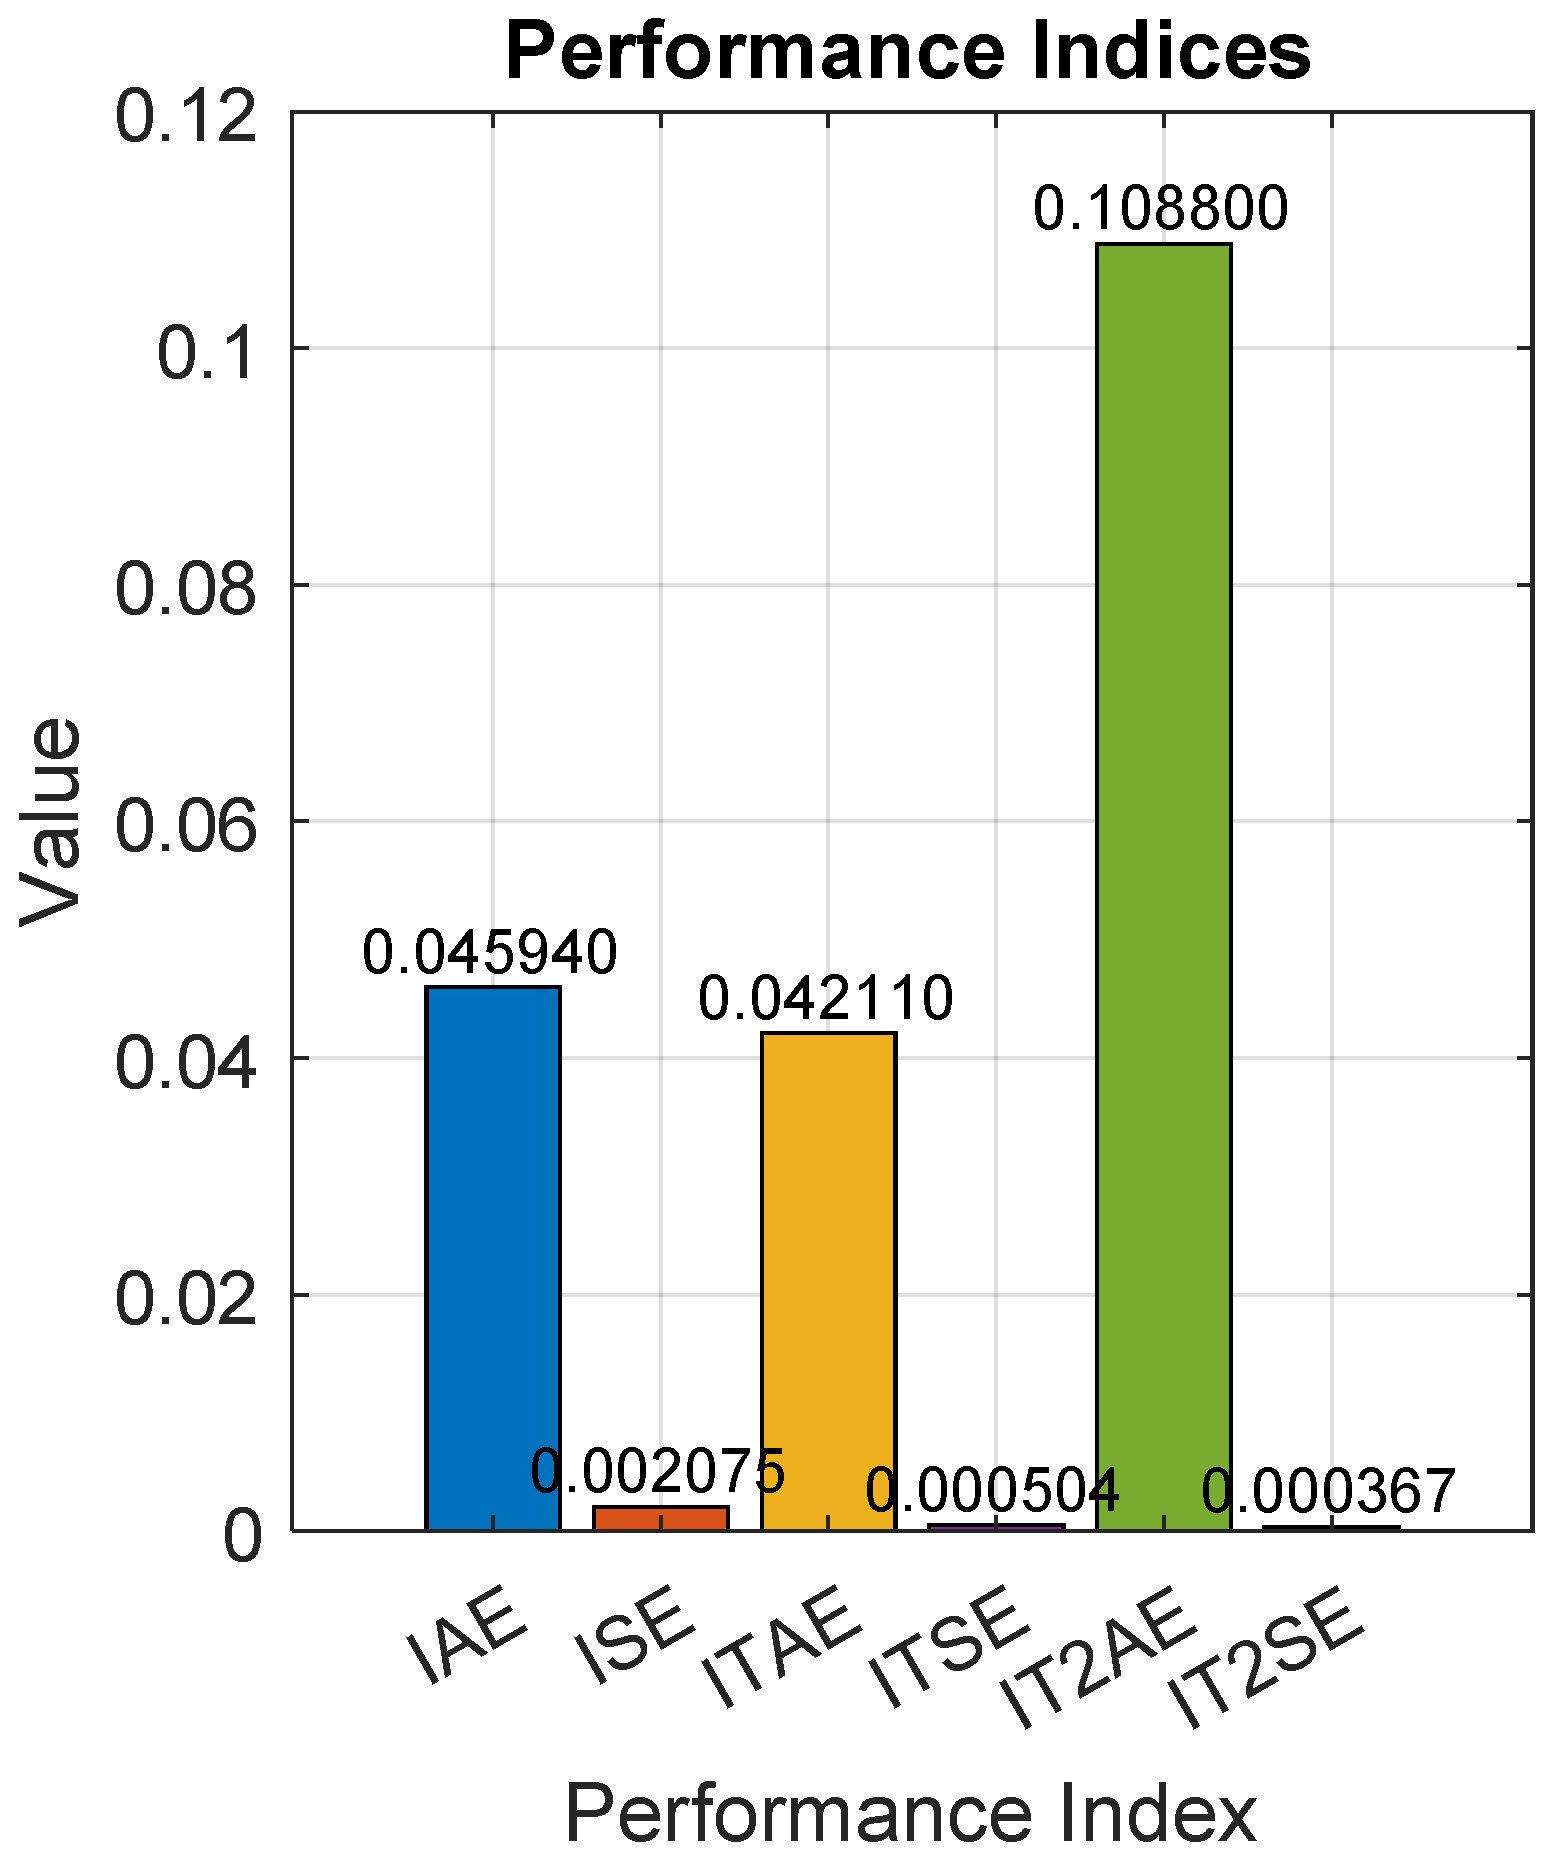
The performance of the control system is quantitatively evaluated using various error indices, including the IAE, ISE, ITAE, ITSE, IT2AE, and IT2SE. These indices are provided in Table 10. These indices are also plotted in Figure 10 for better visibility. The computed values of these indices are 0.04594 for the IAE, 0.002075 for the ISE, 0.04211 for the ITAE, 0.000504 for the ITSE, 0.1088 for the IT2AE, and 0.000367 for the IT2SE. These performance metrics demonstrate the enhanced accuracy and stability of the controller, reflecting its robustness in reducing both instantaneous and time-weighted deviations from the set point throughout the control process.

3.3.2. Control Design for LDR Mode

The tuning rules for LDR mode are provided in Table 2. By substituting the values of K, τ m , and τ d from Table 4, the updated parameters are summarized in Table 11. Using these parameters in Equation (16), the corresponding PID controller is derived as given by
P I D IAE _ LDR ( s ) = U ( s ) E ( s ) = 3.702332 1 + 1 0.519909 s 0.026416 s + 1 0.0026416 s + 1
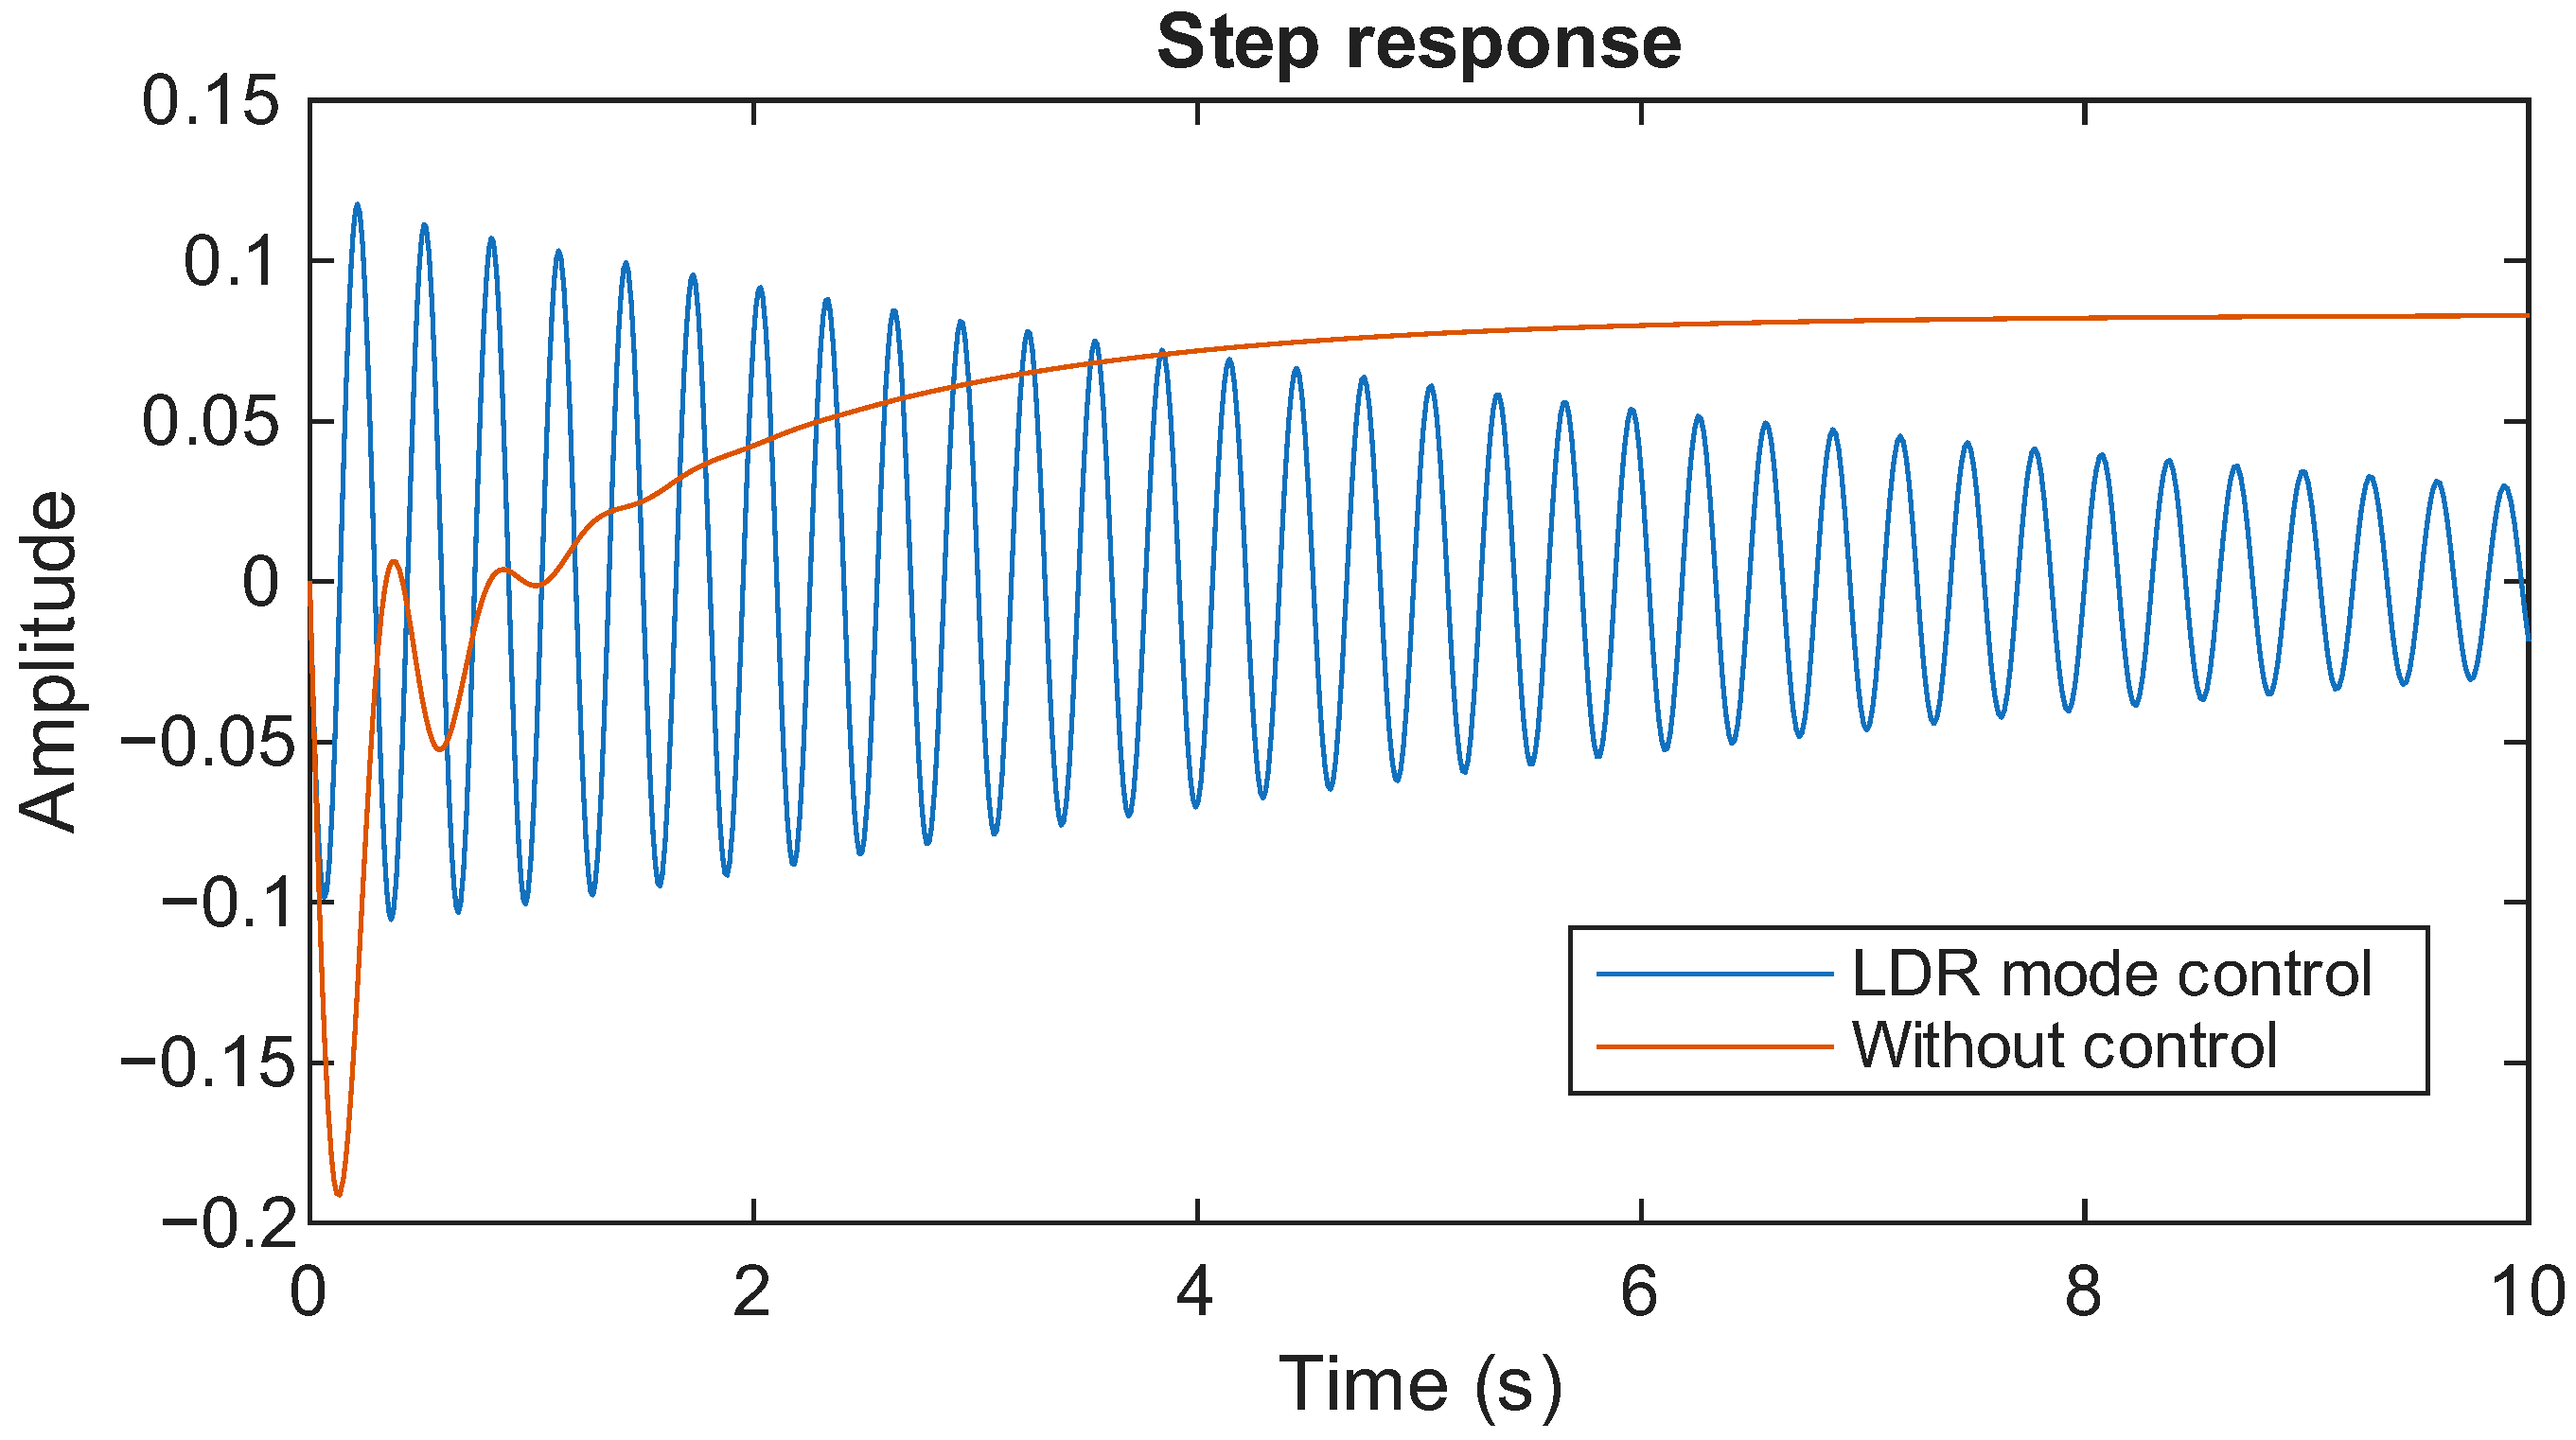
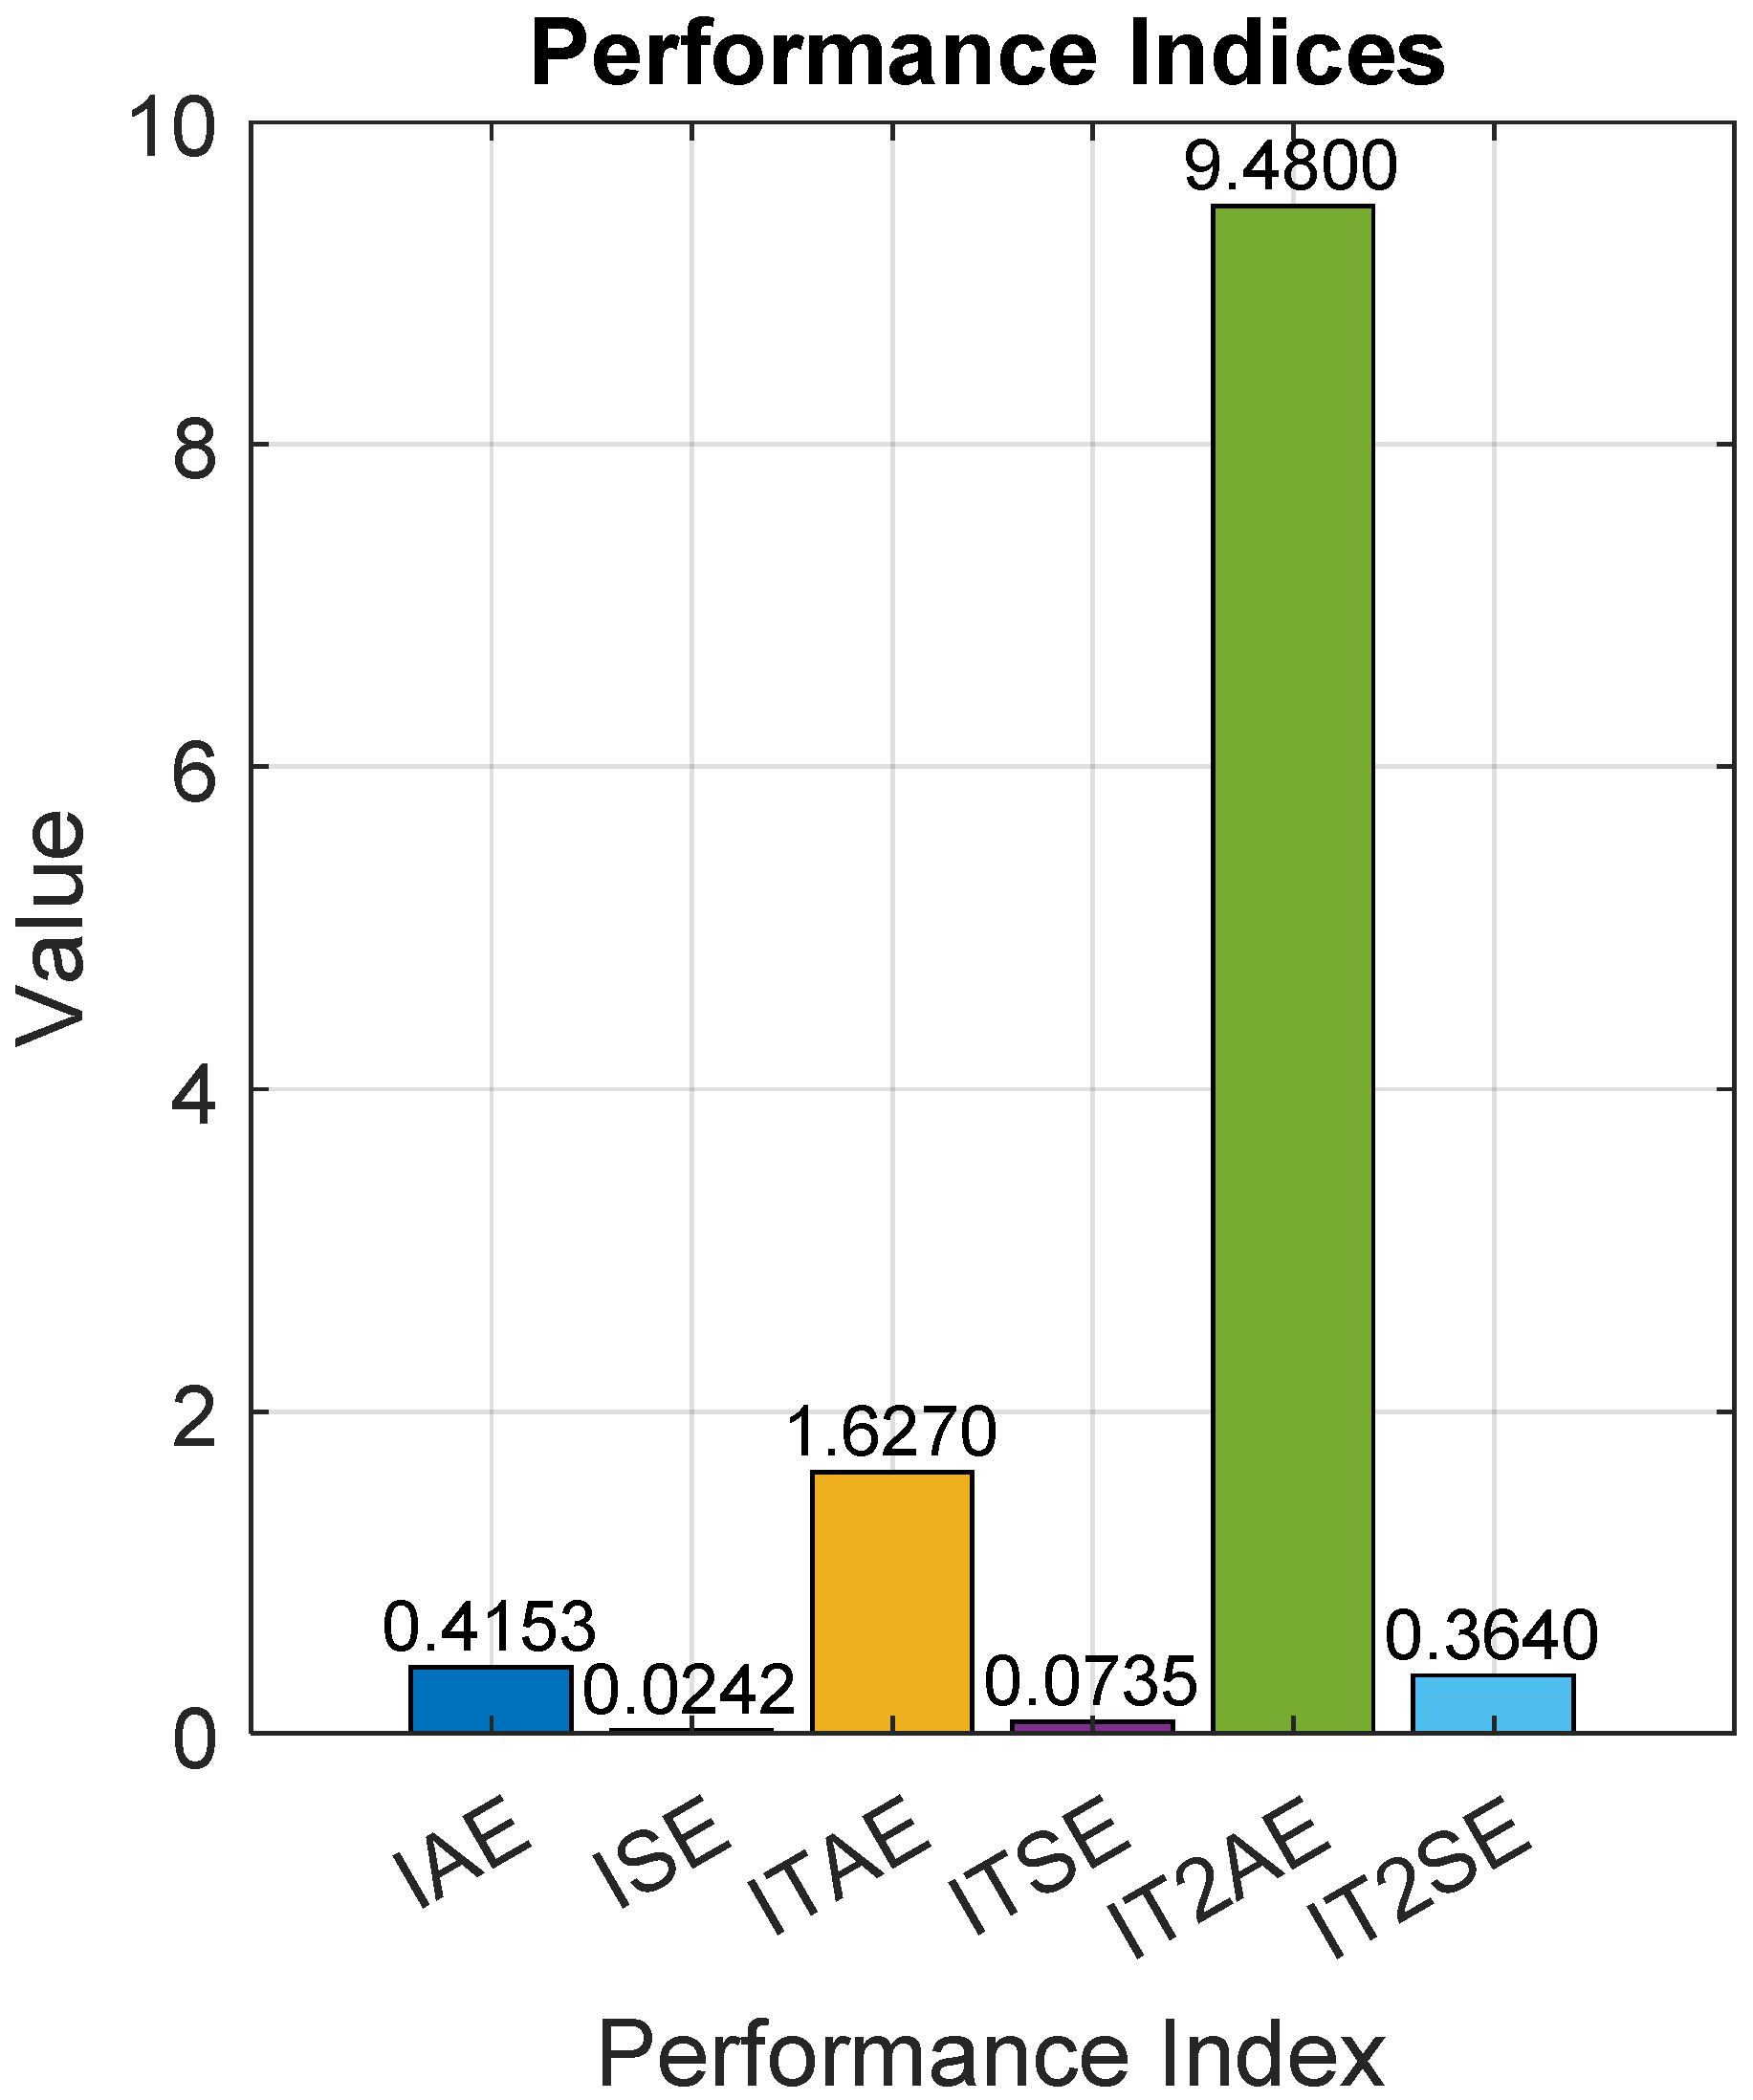
The effect of the IAE-based PID controller in LDR mode is illustrated in Figure 11. The associated time-domain performance measures are listed in Table 12, while a visual comparison of these indicators is shown in Figure 12. The calculated values for the peak, peak time, overshoot, and undershoot are 0.1166, 0.2061 s, 0.1166, and 0.1050, respectively. For this case, the values of the error indices are provided in Table 13. The values found are 0.04594 (IAE), 0.002075 (ISE), 0.04211 (ITAE), 0.000504 (ITSE), 0.1088 (IT2AE), and 0.000367 (IT2SE). These values are calculated for 10 s. A visual presentation of these values is provided in Figure 13. From Figure 11, it is clear that the response is oscillatory.

3.3.3. Comparison of SPT and LDR Modes

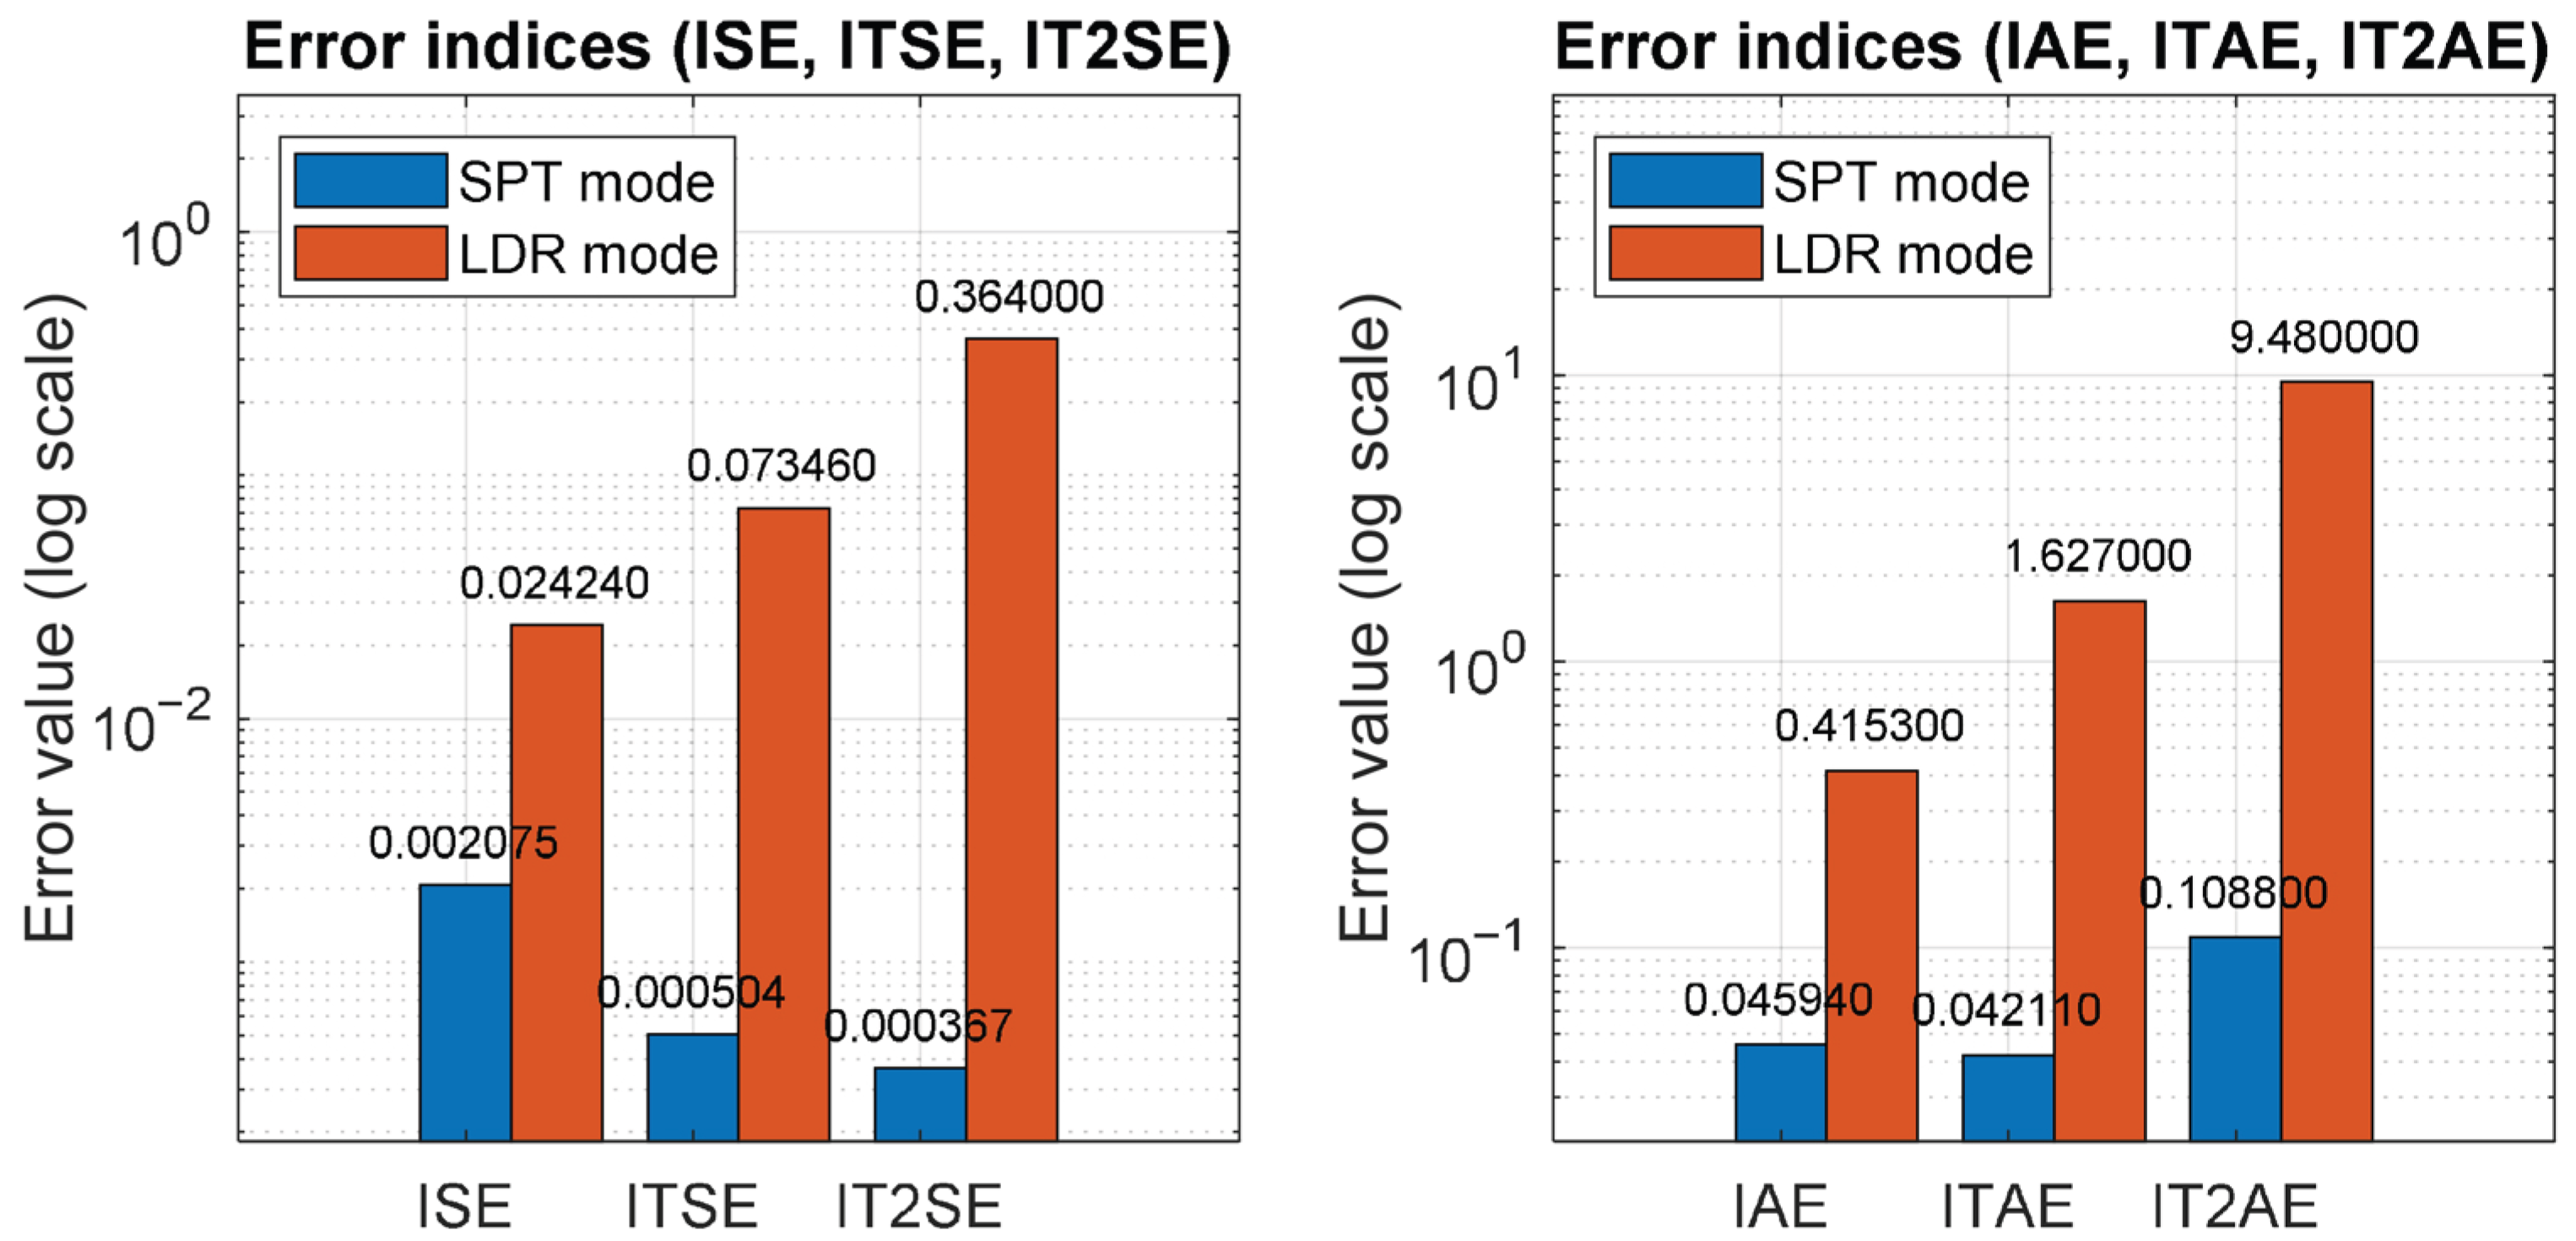
The values of the error indices for SPT mode and LDR mode are, respectively, provided in Table 10 and Table 13. A comparative plot of these values is shown in Figure 14.
The comparison of the error indices for the SPT and LDR modes clearly indicates a superior controller performance in SPT mode. The SPT mode consistently exhibits significantly lower error values across all indices: for instance, the IAE is 0.04594 compared to 0.4153 in LDR mode, and the ISE is 0.002075 versus 0.02424, highlighting a marked reduction in the cumulative error. Similarly, the ITAE and ITSE values for SPT mode are 0.04211 and 0.000504, respectively, which are substantially smaller than the LDR mode’s 1.627 and 0.07346. Even for higher-order weighted indices, such as the IT2AE and IT2SE, the SPT mode maintains lower values of 0.1088 and 0.000367, relative to 9.48 and 0.364 in LDR mode. These consistently lower error metrics demonstrate that the controller design under the SPT mode achieves a more accurate and stable control performance with reduced deviations and a better transient response compared to those under the LDR mode.

4. Conclusions

This study extensively examined frequency regulation of islanded AIM systems by employing an IAE-assisted control methodology. A PID controller is designed and implemented based on a linearized transfer function model of the islanded AIM, which is then effectively approximated using the FOPDT approach. A major achievement of this work is the precise application of the reaction curve technique to accurately extracting the FOPDT model from the linearized AIM system dynamics. In this research, two distinct PID controllers were developed, one designed for SPT mode and the other for LDR mode. Comprehensive results demonstrated that the SPT mode controller notably outperformed the LDR mode by providing an enhanced transient response and significantly reduced error values, indicating superior control accuracy and stability. The effectiveness and reliability of the proposed control scheme are well supported by extensive tabulated data detailing the tuned controller parameters and corresponding time-domain performance indices, reinforcing the practical applicability of the approach. The SPT mode consistently exhibits significantly lower error values across all indices: for example, IAE and ISE values of 0.04594 and 0.002075 compared to 0.4153 and 0.02424 in LDR mode, respectively, highlighting a marked reduction in the cumulative error. Similarly, the ITAE, ITSE, IT2AE, and IT2SE values for SPT mode remain substantially lower than those in LDR mode, demonstrating a more accurate and stable control performance with reduced deviations and a better transient response under the SPT scheme.
For future work, it is recommended to incorporate modern learning-based optimization algorithms for PID tuning, which could enhance controller performance and adaptability further. Additionally, investigating the potential of fractional-order PID controllers presents an opportunity to improve frequency control with finer-tuning capabilities. Lastly, addressing cyber-physical security concerns for AIM systems by developing robust security frameworks will be crucial to safeguarding the reliability and resilience of these systems against potential cyber threats and ensuring stable microgrid operation under real-world conditions.

Author Contributions

Conceptualization: T.V., N.P. and V.P.S.; methodology: T.V., N.P. and V.P.S.; software: T.V. and N.P.; validation: T.V. and N.P.; formal analysis: T.V., N.P. and V.P.S.; investigation: T.V. and N.P.; resources: T.V., N.P. and V.P.S.; data curation: T.V., N.P. and V.P.S.; writing—original draft preparation: T.V. and N.P.; writing—review and editing: T.V., N.P. and V.P.S. All authors have read and agreed to the published version of the manuscript.

Funding

The authors received no financial support for the research, authorship, and/or publication of this article.

Data Availability Statement

The authors declare no associated data in the manuscript.

Conflicts of Interest

The authors declare no competing interests.

References

  1. Bonfiglio, A.; Minetti, M.; Loggia, R.; Mascioli, L.F.; Golino, A.; Moscatiello, C.; Martirano, L. Integrated Vehicle-to-Building and Vehicle-to-Home Services for Residential and Worksite Microgrids. Smart Cities 2025, 8, 101. [Google Scholar] [CrossRef]
  2. Díaz-Bedoya, D.; González-Rodríguez, M.; Gonzales-Zurita, O.; Serrano-Guerrero, X.; Clairand, J.M. Advanced Wind Speed Forecasting: A Hybrid Framework Integrating Ensemble Methods and Deep Neural Networks for Meteorological Data. Smart Cities 2025, 8, 94. [Google Scholar] [CrossRef]
  3. Hansen, M.M.; Koonsanit, K.; Kulmala, V. How can data contribute to Smart City innovation: A study from Thailand’s Smart City initiatives. Front. Sustain. Cities 2025, 6, 1473123. [Google Scholar] [CrossRef]
  4. Singh, S.; Singh, V.; Mathur, A.; Bashishtha, T.; Padmanaban, S.; Varshney, T. Airport microgrid control using integral-of-absolute-error having high renewable penetration. Sci. Rep. 2025, 15, 23550. [Google Scholar] [CrossRef]
  5. Bashishtha, T.; Singh, V. Chien-hrones-reswick method-based pid control strategy for mitigation of frequency deviation of islanded microgrid. Electr. Eng. 2025, 107, 8085–8099. [Google Scholar] [CrossRef]
  6. Song, D.; Yousaf, A.; Noor, J.; Cao, Y.; Dong, M.; Yang, J.; Rizk-Allah, R.M.; Elkholy, M.; Talaat, M. ANN-Based Model Predictive Control for Hybrid Energy Storage Systems in DC Microgrid. Prot. Control Mod. Power Syst. 2025, 10, 1–15. [Google Scholar] [CrossRef]
  7. Albasheri, M.A.; Bouchhida, O.; Soufi, Y.; Cherifi, A.; Mujammal, M.A.H. Supervisory energy management strategy based-fuzzy logic for a DC microgrid. Int. J. Dyn. Control 2025, 13, 31. [Google Scholar] [CrossRef]
  8. Kumar, M.; Acharya, D.S.; Mishra, P. Mitigating Low Inertia Challenges in Renewable Energy-Based Microgrids: A Survey. In Proceedings of the 2025 IEEE 1st International Conference on Smart and Sustainable Developments in Electrical Engineering (SSDEE), Dhanbad, India, 28 February–2 March 2025; pp. 1–7. [Google Scholar]
  9. Rameshar, V.; Sharma, G.; Bokoro, P.N. The Use of ESD’s within Hybrid Microgrid Technology. In Proceedings of the 2025 33rd Southern African Universities Power Engineering Conference (SAUPEC), Pretoria, South Africa, 29–30 January 2025; pp. 1–5. [Google Scholar]
  10. Samal, M.; Panigrahi, C.K.; Gupta, D.K. Load Frequency Control in Modern Power System-An Overview. In Proceedings of the 2025 International Conference on Power Electronics Converters for Transportation and Energy Applications (PECTEA), Jatni, India, 18–21 June 2025; pp. 1–6. [Google Scholar]
  11. Pati, S.S.; Subudhi, U.; Mishra, S. Robust Frequency Regulation Management System in a Renewable Hybrid Energy Network with Integrated Storage Solutions. Electricity 2025, 6, 22. [Google Scholar] [CrossRef]
  12. Raj, H.; Jaiswal, S.; Maheshwari, A. A review of energy management strategy and forecasting techniques in multi microgrids. Int. J. Ambient Energy 2025, 46, 2507808. [Google Scholar] [CrossRef]
  13. Güven, A.F.; Hassan, M.H.; Kamel, S. Optimization of a hybrid microgrid for a small hotel using renewable energy and EV charging with a quadratic interpolation beluga whale algorithm. Neural Comput. Appl. 2025, 37, 3973–4008. [Google Scholar] [CrossRef]
  14. Campoverde, J.; Garcia Torres, M.; Tipan, L. Optimizing Residential Electricity Demand with Bipartite Models for Enhanced Demand Response. Energies 2025, 18, 3819. [Google Scholar] [CrossRef]
  15. Alouache, B.; Helaimi, M.; Djilali, A.B.; Yahdou, A. Frequency Control in Microgrid Isolated System Using PID Controller Using Ziegler Nichols Method and Genetic Algorithm. In Technological and Innovative Progress in Renewable Energy Systems: Proceedings of the 2024 International Renewable Energy Days (IREN Days’ 2024); Springer: Berlin/Heidelberg, Germany, 2025; pp. 205–209. [Google Scholar]
  16. Khamari, R.C.; Ray, P.K.; Senapati, M.K.; Padmanaban, S. Resilient Microgrid Frequency Control Under Cyber Threats With Experimental Validation Using MIWO-FOPID Controller. IEEE Trans. Consum. Electron. 2025; Early Access. [Google Scholar]
  17. Pachauri, N.; Vigneysh, T.; Kumar, A. Fuel cell-powered nano grid frequency deviation control using a 2 PD-PID control scheme. Int. J. Hydrogen Energy 2025, 143, 489–499. [Google Scholar] [CrossRef]
  18. Liu, X.; Fan, P.; Yang, J.; Tahmeed, U. A flexible frequency control strategy for airport-microgrid through vehicle-to-grid and aviation-to-grid. J. Energy Storage 2025, 125, 116980. [Google Scholar] [CrossRef]
  19. Miller, I.A.; Rutledge, A. Airport Electrification: Funding, Microgrids, and Sustainability. J. Aviat. Technol. Eng. 2025, 14, 1. [Google Scholar] [CrossRef]
  20. Vontzos, G.; Laitsos, V.; Bargiotas, D.; Fevgas, A.; Daskalopulu, A.; Tsoukalas, L.H. Microgrid Multivariate Load Forecasting Based on Weighted Visibility Graph: A Regional Airport Case Study. Electricity 2025, 6, 17. [Google Scholar] [CrossRef]
  21. Aessa, S.A.; Shneen, S.W.; Oudah, M.K. Optimizing PID Controller for Large-Scale MIMO Systems Using Flower Pollination Algorithm. J. Robot. Control (JRC) 2025, 6, 553–559. [Google Scholar] [CrossRef]
  22. Joyo, K.; Khan, T.A.; Kadir, K.A.; Bin Husen, M.N.; Nasir, H.M.; Azhar, M. Optimal PID controller with evolutionary optimization algorithms for rehabilitation robots. Discov. Appl. Sci. 2025, 7, 756. [Google Scholar] [CrossRef]
  23. Shayeghi, H.; Davoudkhani, I.F.; Bizon, N. Robust self-adaptive fuzzy controller for load-frequency control of islanded airport microgrids considering electric aircraft energy storage and demand response. IET Renew. Power Gener. 2024, 18, 616–653. [Google Scholar] [CrossRef]
  24. Bashishtha, T.; Singh, V.; Yadav, U.; Varshney, T. Reaction curve-assisted rule-based pid control design for islanded microgrid. Energies 2024, 17, 1110. [Google Scholar] [CrossRef]
  25. Lee, D.J.; Wang, L. Small-signal stability analysis of an autonomous hybrid renewable energy power generation/energy storage system part I: Time-domain simulations. IEEE Trans. Energy Convers. 2008, 23, 311–320. [Google Scholar] [CrossRef]
  26. Tan, W.; Liu, J.; Chen, T.; Marquez, H.J. Comparison of some well-known PID tuning formulas. Comput. Chem. Eng. 2006, 30, 1416–1423. [Google Scholar] [CrossRef]
Figure 1. Schematic diagram of AIM.
Inventions 10 00088 g001
Figure 2. Block diagram of AIM.
Inventions 10 00088 g002
Figure 3. Simplified block diagram of AIM.
Inventions 10 00088 g003
Figure 4. Reaction curve.
Inventions 10 00088 g004
Figure 5. Step response of AIM and FOPDT models.
Inventions 10 00088 g005
Figure 6. Impulse response of AIM and FOPDT models.
Inventions 10 00088 g006
Figure 7. Frequency response of AIM without control.
Inventions 10 00088 g007
Figure 8. Frequency deviations for PID controller.
Inventions 10 00088 g008
Figure 9. Bar chart for indicators.
Inventions 10 00088 g009
Figure 10. Bar chart for EIs.
Inventions 10 00088 g010
Figure 11. Frequency deviations for PID controller.
Inventions 10 00088 g011
Figure 12. Bar chart for indicators.
Inventions 10 00088 g012
Figure 13. Bar chart for EIs.
Inventions 10 00088 g013
Figure 14. Comparison of SPT and LDR modes.
Inventions 10 00088 g014
Table 1. First-order models.
UnitParameters and ValuesModel
SPVA K S P V A = 1 , T S P V A = 1.8 1 1 + 1.8 s
WTG K W T G = 1 , T W T G = 1.5 1 1 + 1.5 s
OAS K O A S = 1 , T O A S = 1 1 1 + s
EMU K E M U = 1 , T E M U = 0.1 1 1 + 0.1 s
Generator K G E N = 1 , T G E N = 0.1 1 1 + 0.1 s
Governor K G O V = 1 , T G O V = 0.08 1 1 + 0.08 s
BSM K B S M = 1 , T B S M = 0.1 1 1 + 0.1 s
FESS K F E S S = 1 , T F E S S = 0.1 1 1 + 0.1 s
System dynamics D G E N D = 0.012 , M G E N D = 0.2 1 0.012 + 0.2 s
Table 2. Controller gains.
GainIAE_SPTIAE_LDR
K p 0.65 K τ d τ m 1.04432 0.980890 K τ d τ m 0.76167
T i τ m 0.9895 + 0.9539 τ d / τ m τ m 0.91032 τ d τ m 1.05211
T d 0.50814 τ m τ d τ m 1.08433 0.59974 τ m τ d τ m 0.89819
Table 3. Coefficients of AIM.
Coefficients of NumeratorCoefficients of Denominator
A 0 3 B 0 3.012
A 1 3.16 B 1 4.0310933
A 2 0.856 B 2 1.45619733
A 3 0.0972 B 3 0.2628096
A 4 0.0049 B 4 0.028863973
A 5 0.000088 B 5 0.0020384693
-- B 6 0.000085696
-- B 7 0.0000016
Table 4. Parameters of FOPDT model.
Time Delay ( τ d )Time Constant ( τ m )Steady-State Gain (K)
0.0488910.2107640.996
Table 5. Time-domain specifications.
PeakPeak Time (s)Rise Time (s)Settling Time (s)OvershootUndershoot
AIM1.00090.35530.20022.17270.49200
FOPDT model0.99601.64030.46300.873400
Table 6. Error indices of FOPDT model.
Error IndexIAEITAEISEITSEIT2AEIT2SE
Value0.30241.4510.02410.061999.6580.3088
Table 7. Time-domain indicators.
Peak DeviationPeak Time (s)Steady State Deviation
0.19120.13450.0828
Table 8. Controller gains for SPT mode.
GainIAE_SPT
K p 3.663470
T i 0.209827
T d 0.020700
Table 9. Time-domain indicators.
Peak ValuePeak Time (s)Settling Time (s)OvershootUndershoot
0.06960.26610.34680.06960.1203
Table 10. Performance indices.
IAEISEITAEITSEIT2AEIT2SE
0.045940.0020750.042110.0005040.10880.000367
Table 11. Controller gains for LDR mode.
GainIAE_LDR
K p 3.702332
T i 0.519909
T d 0.026416
Table 12. Time-domain indicators.
Peak ValuePeak TimeOvershootUndershoot
0.11660.20610.11660.1050
Table 13. Error indices.
IAEISEITAEITSEIT2AEIT2SE
0.41530.024241.6270.073469.480.364
Disclaimer/Publisher’s Note: The statements, opinions and data contained in all publications are solely those of the individual author(s) and contributor(s) and not of MDPI and/or the editor(s). MDPI and/or the editor(s) disclaim responsibility for any injury to people or property resulting from any ideas, methods, instructions or products referred to in the content.