Article

Functionalized Graphene Quantum Dots for Thin-Film Illuminator and Cell Dyeing Applications

1
Department of Chemical and Materials Engineering, Chang Gung University, Guishan, Taoyuan 33302, Taiwan
2
Department of Internal Medicine, Division of Nephrology, Chang Gung Memorial Hospital Linkou, Taoyuan 33305, Taiwan
3
Department of Safety, Health and Environmental Engineering, Ming Chi University of Technology, Taishan, New Taipei City 24301, Taiwan
4
Department of Chemical Engineering and Materials Science, Yuan Ze University, Taoyuan 32003, Taiwan
5
Department of Mechanical, Aerospace, and Biomedical Engineering, University of Tennessee, Knoxville, TN 37996, USA
*
Authors to whom correspondence should be addressed.
Inventions 2025, 10(5), 81; https://doi.org/10.3390/inventions10050081
Submission received: 13 August 2025 / Revised: 29 August 2025 / Accepted: 1 September 2025 / Published: 3 September 2025

Abstract

Graphene quantum dots (GQDs) have emerged as promising nanomaterials due to their unique optical properties, high biocompatibility, and tunable surface functionalities. In this work, GQDs were synthesized via a one-pot hydrothermal method and further functionalized using polyethylene glycol (PEG) of various molecular weights and sodium hydroxide to tailor their photoluminescence (PL) behavior and enhance their applicability in thin-film illumination and biological staining. PEG-modified GQDs exhibited a pronounced red-shift and intensified fluorescence response due to aggregation-induced emission, with GQD-PEG (molecular weight: 300,000) achieving up to eight-fold enhancement in PL intensity compared to pristine GQDs. The influence of solvent environments on PL behavior was studied, revealing solvent-dependent shifts and emission intensities. Transmission electron microscopy confirmed the formation of core–shell GQD clusters, while Raman spectroscopy suggested improved structural ordering upon modification. The prepared GQD thin films demonstrated robust fluorescence stability under prolonged water immersion, indicating strong adhesion to glass substrates. Furthermore, the modified GQDs effectively labeled E. coli, Gram-positive, and Gram-negative bacteria, with GQD-PEG and GQD-NaOH displaying red and green emissions, respectively, at optimal concentrations. This study highlights the potential of surface-functionalized GQDs as versatile materials for optoelectronic devices and fluorescence-based bioimaging.

1. Introduction

Graphene quantum dots (GQDs), a class of zero-dimensional carbon-based nanomaterials typically below 10 nm in size, have garnered significant attention due to their extraordinary optical, electrical, and biocompatible properties. These unique features arise from quantum confinement and edge effects, which enable tunable photoluminescence, high surface area, and excellent aqueous solubility [1,2,3]. GQDs have emerged as promising candidates for a broad range of applications including bioimaging, optoelectronic devices, photocatalysis, and sensing platforms [4,5,6]. Compared to conventional semiconductor quantum dots, GQDs offer low toxicity and superior chemical stability, which is particularly advantageous in biological and environmental applications [3]. Numerous synthesis methods have been developed to fabricate GQDs, such as chemical oxidation, electrochemical exfoliation, laser ablation, and hydrothermal carbonization [7,8,9]. Among them, hydrothermal methods are especially favored for their simplicity, scalability, and ability to produce GQDs with uniform size and controlled surface functionality [10].
Surface functionalization of GQDs plays a crucial role in tailoring their properties for specific applications by introducing functional groups that influence solubility, stability, and interaction with surrounding media [5]. In this work, we adopt a one-pot hydrothermal method to synthesize and simultaneously functionalize GQDs using polyethylene glycol (PEG) of various molecular weights and sodium hydroxide (NaOH). PEG molecules serve not only as surface modifiers to enhance water solubility and biocompatibility but also as passivating agents that improve quantum yield and fluorescence stability [3,5]. NaOH acts to promote the deprotonation of oxygen-containing groups and facilitate carbonization and nucleation processes during hydrothermal synthesis, resulting in GQDs with tunable surface charge and improved functional group density [6,8]. This approach allows precise control over the physicochemical properties of GQDs, making them ideal for advanced applications such as thin-film illuminators and cell dyeing, where both optical performance and biological compatibility are essential [3,4,9].
In light of the above, the present study focuses on investigating the photoluminescence (PL) characteristics of GQD clusters functionalized with PEG and NaOH. We report a one-step, efficient solvothermal synthesis of organic-soluble GQD clusters utilizing 1,3,6-trinitropyrene (TNP) as a dual source of carbon and nitrogen. TNP, with its polyaromatic structure and nitro-substituted periphery, facilitates the molecular fusion under solvothermal conditions to form GQDs possessing a hydrophobic graphene-like core and NO2-functionalized edges. These structural characteristics impart excellent solubility in a broad range of organic solvents, including both polar and nonpolar media such as isobornyl acrylate (IBOA), tetrahydro-2-furanmethanol (THFA), and propylene glycol methyl ether acetate (PGMEA), while remaining insoluble in water [11]. The direct exposure of the sp2 carbon core to organic environments enhances fluorescence quantum yield and enables GQD dispersion in resin-based matrices, making them suitable for advanced optical and display applications [12].
By employing PEGs with different molecular weights, we systematically investigated how chain length affects the PL emission behavior and dispersion quality of the resulting GQD clusters. PEG molecules interact with the surface functional groups of GQDs, modulating electron density and facilitating exciton confinement, which in turn influences the emission wavelength and intensity [13]. Notably, two synthetic routes were successfully established to yield red and green fluorescence emissions from PEG- and NaOH-modified GQDs, respectively, demonstrating controllable luminescence via surface engineering. The red-shifting of PL spectra in PEG-functionalized samples is attributed to increased π–π stacking and enhanced surface passivation, while NaOH treatment leads to deprotonation and formation of oxygenated edge states that favor green emission [2,14]. The bioimaging capability of these luminescent GQDs was further validated by fluorescent labeling of Escherichia coli (E. coli) and both Gram-positive and Gram-negative bacterial strains, showing their excellent membrane permeability, low cytotoxicity, and photostability [15]. These findings underline the multifunctional potential of modified GQDs as optical tracers and smart fluorescent agents for biological and materials science applications.

2. Materials and Methods

2.1. Solvothermal Synthesis of PEG- and NaOH-Modified GQD Clusters

Prior to the synthesis of PEG-modified GQD clusters, TNP precursor was chemically modified by a nitration of pyrene in concentric nitric acid [13]. First, pyrene (5 g) was mixed uniformly in 500 mL concentrated HNO3 (16 N), and the solution was heated to 90 °C and then stirred by using a magnetic bar at 150–200 rpm. The nitration process was carried out at 90 °C for 18 h. Afterward, the solution was naturally cooled down to ambient temperature and then diluted with distilled water (1 L). The diluted solution was held at room temperature for 48 h, ensuring the presence of NOx groups attached to TNP molecules. Finally, the mixture was filtered to remove the acid and then dried at 60 °C for 24 h, giving TNP precursor.
The TNP (5 g) precursor was firstly dispersed in 40 mL dimethylformamide (DMF, boiling point: 153 °C) using an ultrasonic bath at ambient temperature for 0.5 h. The homogeneous suspension was placed into a poly-(tetrafluoroethylene) (Teflon)-lined autoclave (120 mL). The solvothermal synthesis process was performed at 180 °C for 12 h and then naturally cooled to room temperature. The suspension containing organic-soluble GQDs were filtered through a 0.22 μm microporous membrane to remove traces of insoluble impurities, and then dried in a rotary evaporator at 45 °C. For comparison, we selected three PEG powders with different molecular weights: 6000, 10,000, 100,000, and 300,000 and added them into the suspensions. The ratio of TNP to PEG powders was set at 5:2 in w/w. The other parameter settings were identical with the above. The final products were designated to GQD-PEG, GQD-PEG1, GQD-PEG2, GQD-PEG3, and GQD-PEG4, according to pristine sample, PEG-additive with molecular weight: 6000, 10,000, 100,000, and 300,000, respectively.
As for NaOH-modified GQD clusters, TNP (5 g) precursor was firstly dispersed in 50 mL NaOH solution (2 mol/L) using an ultrasonic bath at ambient temperature for 0.5 h. The homogeneous suspension was placed into a Teflon-lined autoclave (120 mL). The solvothermal synthesis process was performed at 180 °C for 12 h and then naturally cooled to room temperature. The suspension containing organic-soluble GQDs were filtered through a 0.22 μm microporous membrane to remove traces of insoluble impurities, and then dried in a rotary evaporator at 45 °C. The resulting product was designated to GQD-NaOH sample. For clarification, one qualitative sketch for engineering the functionalized GQD samples was illustrated in Scheme 1.

2.2. Materials Characterization of the Modified GQD Clusters

High-resolution transmission electron microscopy (TEM) micrographs were taken using a FEI Talos F200s electron microscope (Columbus, OH, USA) at an accelerating voltage of 200 kV. The crystalline structure of GQD samples was characterized by using Raman spectroscopy (Renishaw Micro-Raman spectrometer, Gloucestershire, UK). X-ray photoelectron spectroscopy (XPS, Fison VG ESCA210, Glasgow, UK) equipped with Mg–Kα radiation emitter, was used to characterize chemical composition of the samples. The C 1s and N 1s spectra were deconvoluted by using a non-linear least squares fitting program with a symmetric Gaussian function. The GQD suspensions (typically 100 mg/L) were ultrasonically vibrated in different solvents at ambient temperature for 0.5 h to ensure a homogeneous dispersion. The PL emission spectra of each suspension were acquired using a fluorescence spectrometer (Hitachi F-7000 FLS920P, Tokyo, Japan) at 450 nm. To figure out the solid concentration, the GQD-PEG with different concentrations (20, 40, 60, 80, 100 mg/L) were also prepared to clarify the PL response.

2.3. Thin-Film Illuminators Using the Modified GQD Clusters

To explore the optoelectronic potential of the synthesized GQD clusters, red- and green-fluorescence thin films were fabricated using the GQD-PEG and GQD-NaOH samples, respectively. The preparation methods involved the following steps for red-fluorescence thin films (GQD-PEG). The first step was to dissolve 50 mg of GQD-PEG powder in 6.5 mL of DMF and then to separately dissolve 0.7 g of polyvinyl alcohol (PVA) in 9 mL of deionized water with gentle heating. Next, we homogeneously mixed the GQD-PEG/DMF and PVA/water solutions together and stir thoroughly to form a uniform polymer–nanodot hybrid dispersion. A drop-cast was employed to cast the resulting solution evenly onto a clean glass coverslip to ensure uniform surface coverage. Eventually, the thin films was baked in an oven at 50 °C for 2 h to evaporate the solvents, thus forming a stable, luminescent thin film.
As to preparing green-fluorescence thin films (GQD-NaOH), the first step was to disperse 50 mg of GQD-NaOH powder into 6.5 mL of water glass (sodium silicate solution) under mild sonication. Next, we added 0.9 mL of Nafion solution to the mixture and stirred continuously for 30 min to ensure homogeneity. After that, the mixture was uniformly spread over a glass substrate using a drop-casting method. The coated substrate was then dried in an oven at 50 °C for 2 h to obtain a stable thin film with bright green photoluminescence under UV irradiation. These thin-film architectures serve as proof-of-concept illuminators, demonstrating strong, stable emissions and excellent adhesion to the substrate. Their compatibility with different solvents and matrices suggests high potential for integration into optical coatings, flexible displays, and light-emitting devices.

2.4. Cell Imaging Using the Modified GQD Clusters

The biological compatibility and fluorescence efficiency of the modified GQD clusters were further validated through cell imaging experiments involving E. coli, Gram-positive, and Gram-negative bacterial strains. Fluorescent labeling was achieved by incubating bacterial cultures with aqueous dispersions of GQD-PEG and GQD-NaOH samples.
In a typical procedure, bacterial cells were cultured to the mid-logarithmic phase, harvested by centrifugation, and washed three times with phosphate-buffered saline (PBS). The cell pellets were resuspended in 1 mL of PBS containing 50 μg/mL of either GQD-PEG or GQD-NaOH. The mixtures were incubated at 37 °C for 30 min under gentle shaking to allow efficient uptake or surface adsorption of the GQD clusters. After incubation, the cells were washed again with PBS to remove excess unbound GQDs. The stained cells were then deposited onto glass slides, fixed using 4% paraformaldehyde, and visualized using a fluorescence microscope equipped with appropriate excitation and emission filters. Red-emitting GQD-PEG samples provided distinct intracellular or membrane-localized fluorescence signals, whereas green-emitting GQD-NaOH clusters offered sharp contrast for membrane staining, depending on the bacterial strain. This labeling strategy demonstrated high photostability, minimal cytotoxicity, and clear differentiation of bacterial morphologies, establishing the utility of these modified GQDs as versatile and non-toxic bioimaging agents for microbial diagnostics and live-cell tracking.

3. Results and Discussion

3.1. Morphology and Structural Characteristics of PEG-Modified GQD Clusters

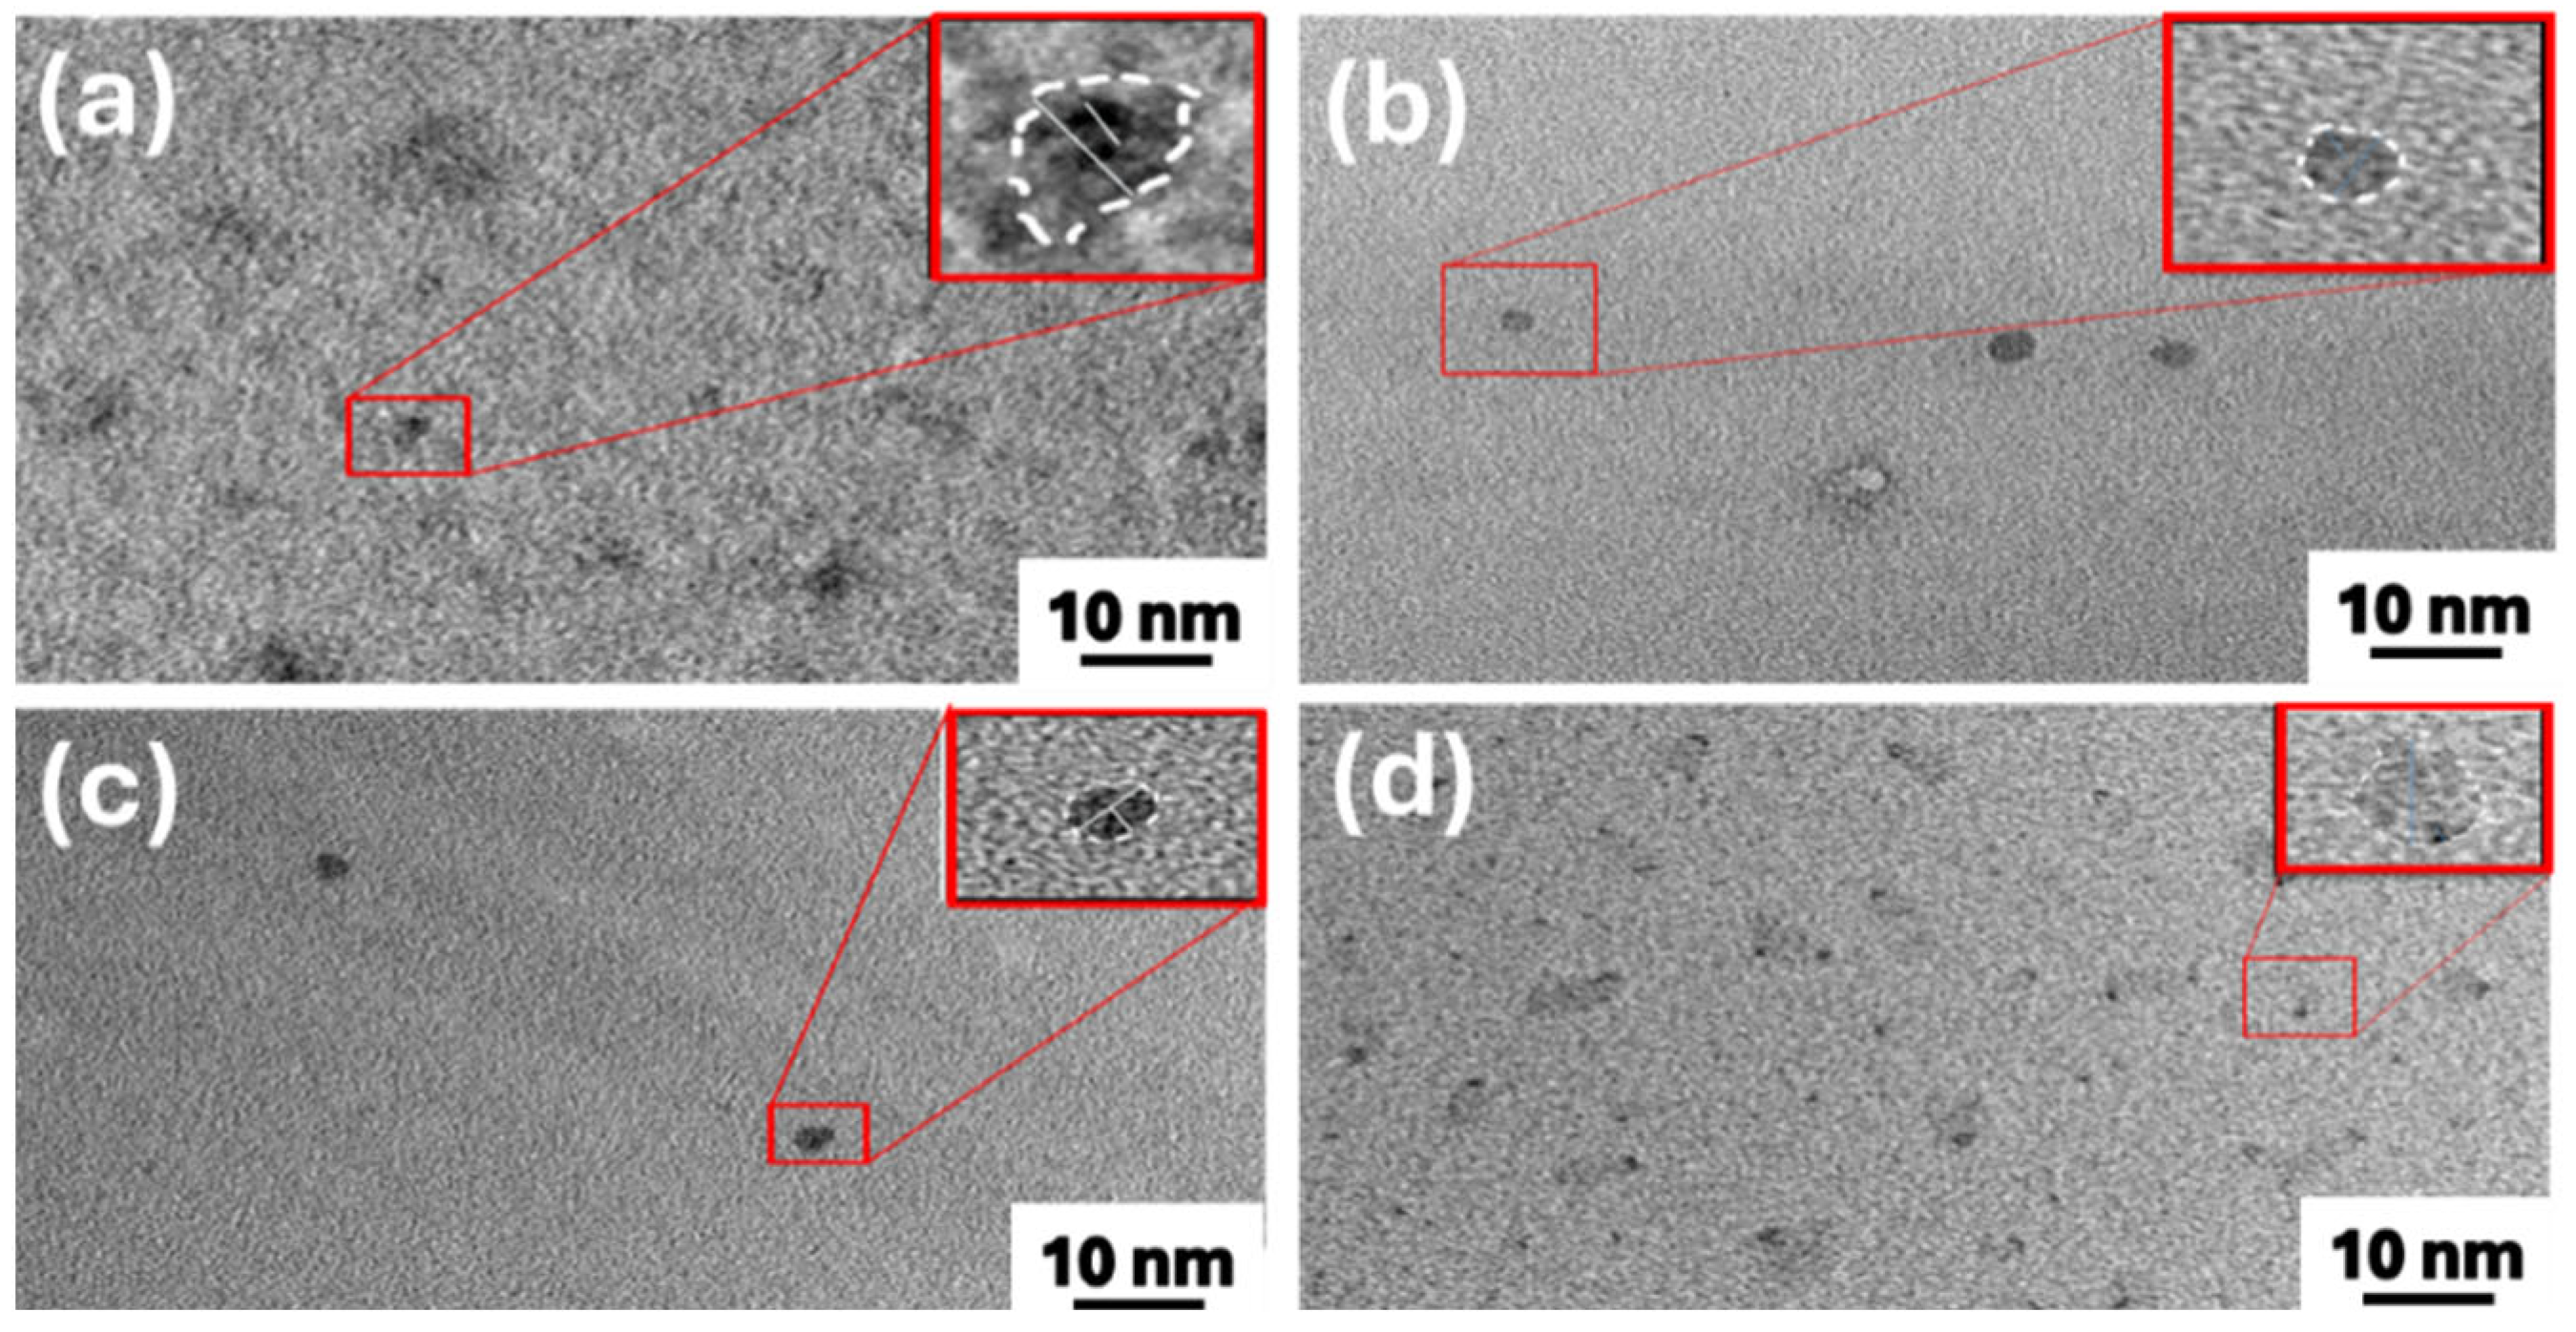
TEM images of GQD-PEG1, GQD-PEG2, GQD-PEG3, and GQD-PEG4 samples are presented in Figure 1, clearly demonstrating the formation of core–shell nanostructures. Each GQD core, with an average diameter ranging from approximately 3.3 to 5.1 nm, is uniformly encapsulated by a PEG polymer shell. Assuming that the interlayer spacing distance of a perfect graphite is approximately 0.340 nm, the number of graphene layers is thus estimated to be 10–15 based on the average particle size ranging from approximately 3.3 to 5.1 nm. Notably, the shell thickness increases progressively with the molecular weight of the PEG used during synthesis, yielding shell sizes of 8.4, 9.2, 10.8, and 37.9 nm for GQD-PEG1 through GQD-PEG4, respectively. This observation confirms the effective role of PEG in tailoring the surface architecture of the quantum dots [16]. Furthermore, the TEM images reveal that the PEG-coated GQDs exhibit a strong tendency to form aggregates or clusters. These clusters consist of individual GQD particles linked together by linear PEG chains, which act as soft molecular binders. Despite aggregation at the cluster level, each GQD within the cluster maintains high dispersion and uniform particle size, suggesting excellent colloidal stability and spatial arrangement. This behavior highlights the dual function of the one-pot solvothermal synthesis method, not only enabling the formation of highly crystalline graphene-like nanodomains but also facilitating in situ surface passivation via polymer encapsulation [13]. Such hierarchical organization is especially advantageous for applications requiring both luminescence and matrix compatibility, such as optical films and biological imaging.
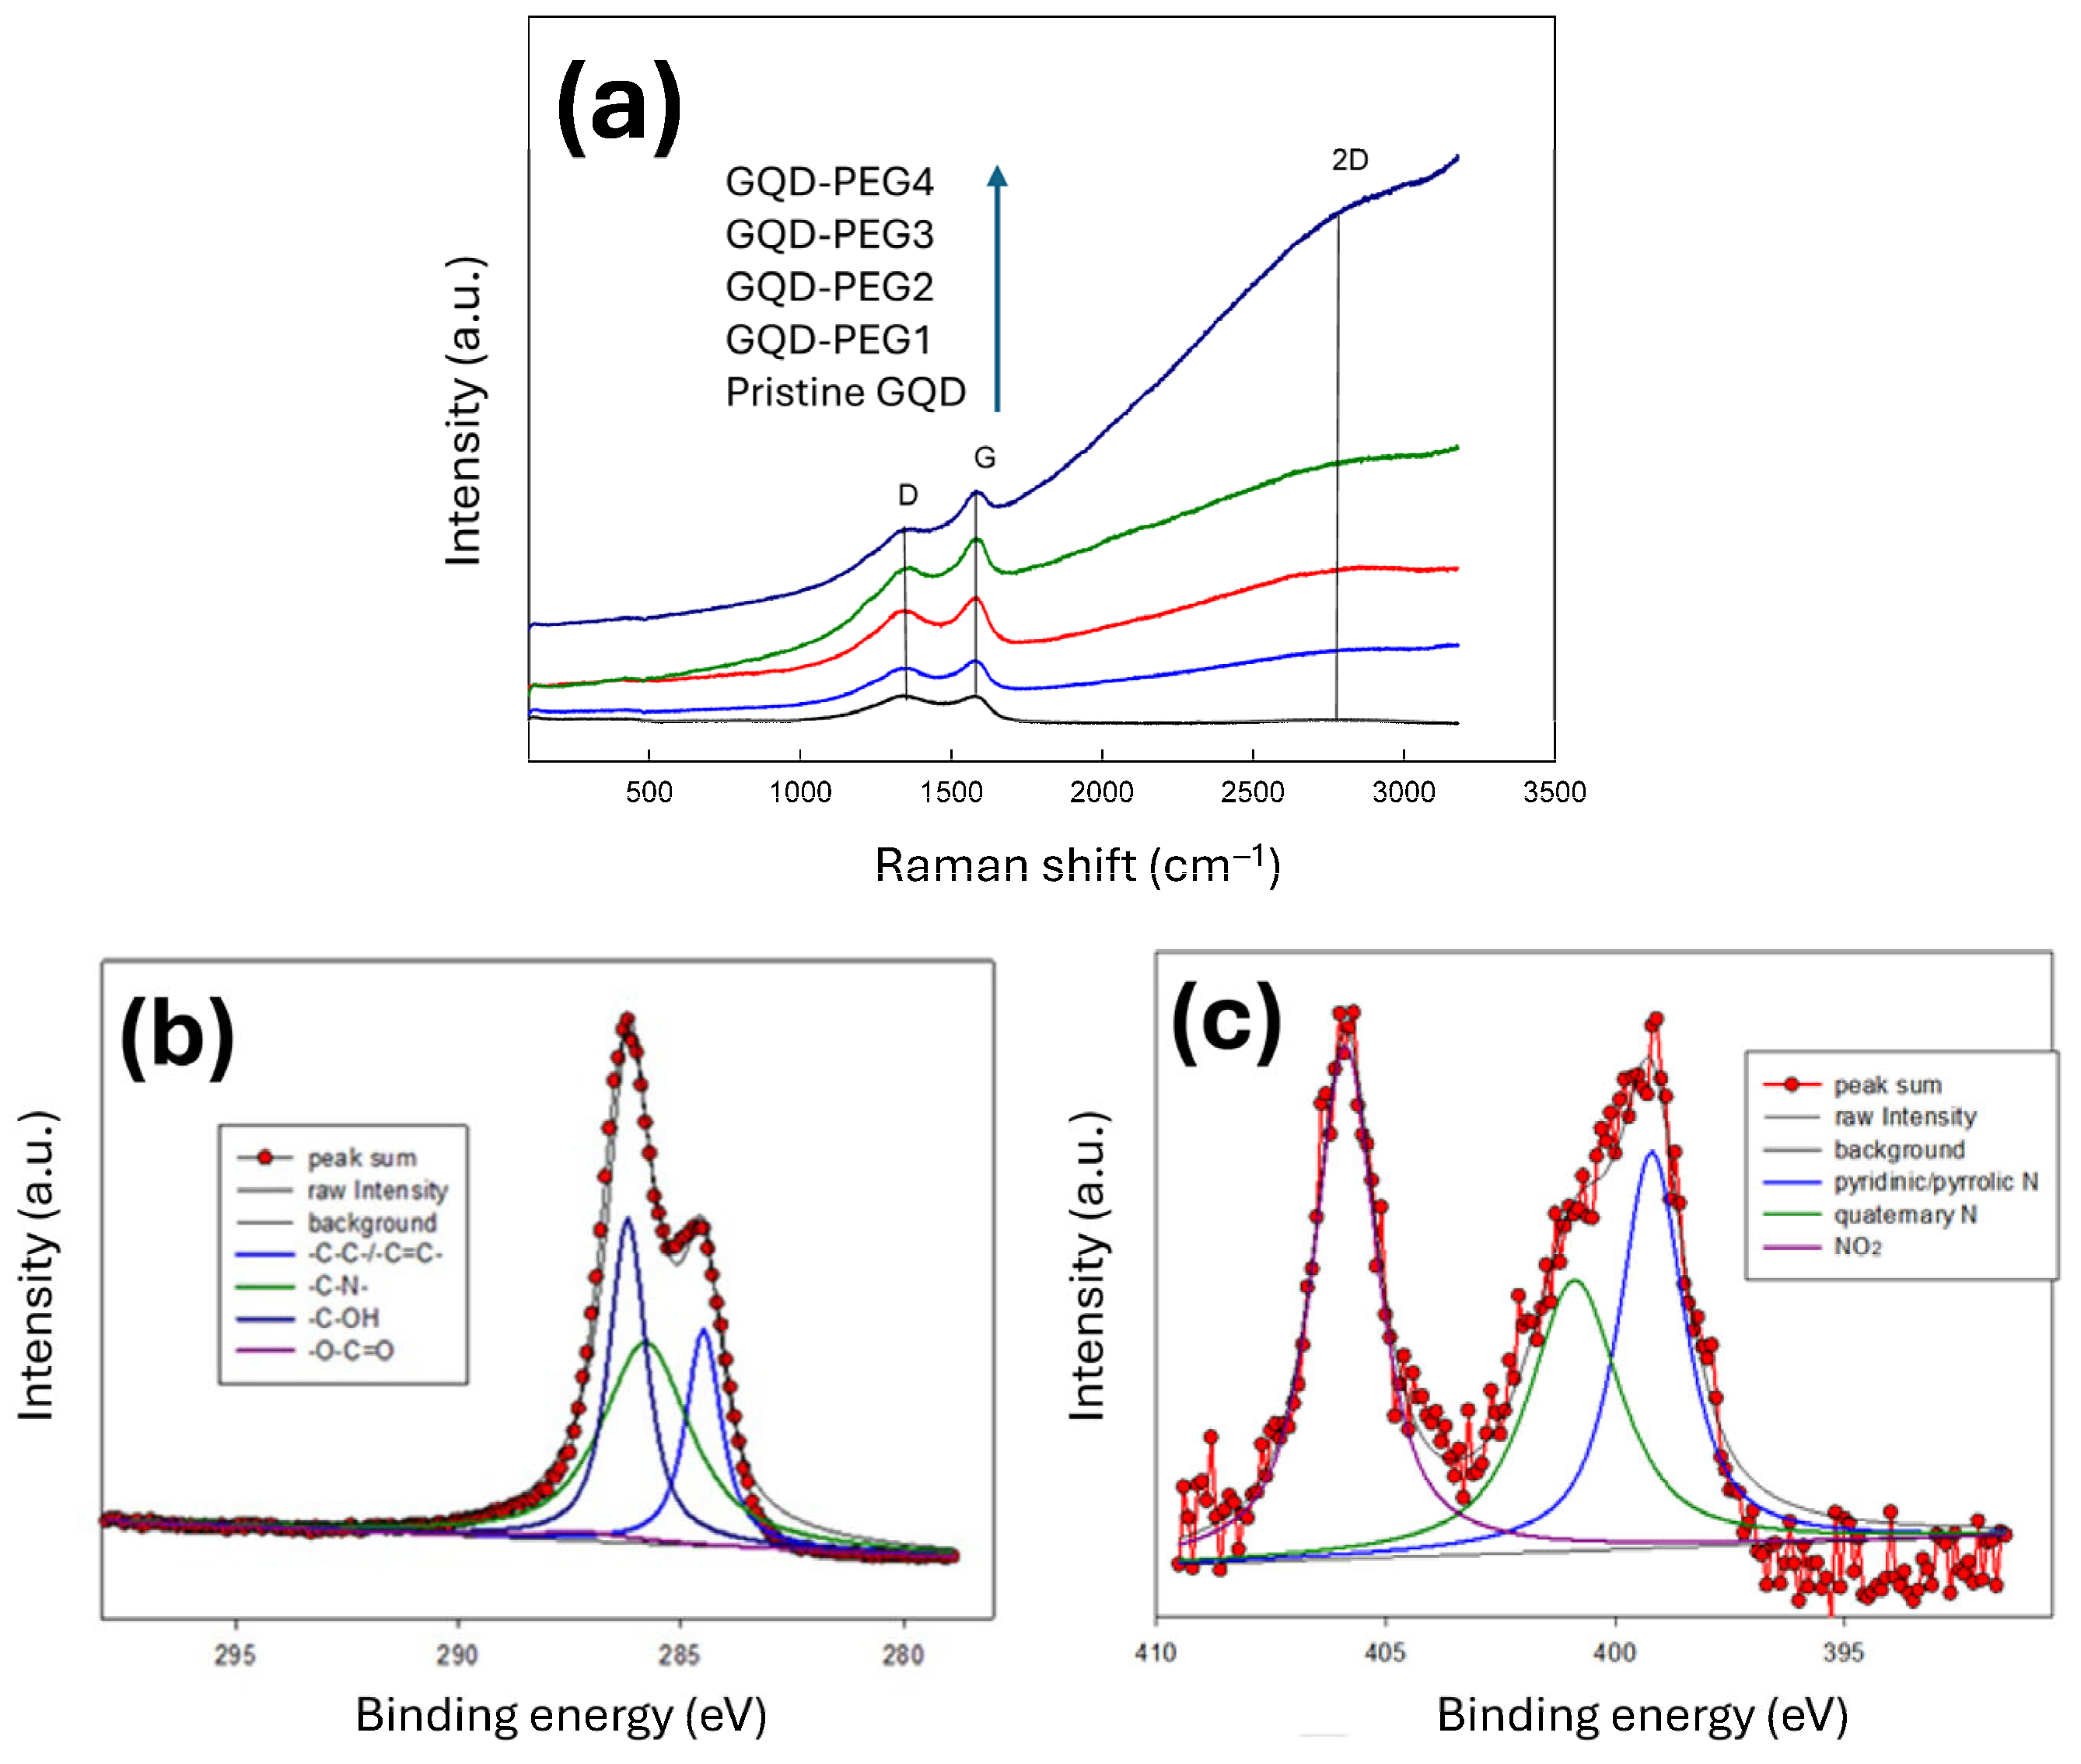
To evaluate the crystalline structure of the synthesized samples, Raman spectroscopy was performed on pristine GQDs and PEG-coated GQD clusters, as shown in Figure 2a. The spectra display two prominent peaks: the D band centered around 1350 cm−1, associated with disorder and sp3-hybridized carbon, and the G band near 1580 cm−1, corresponding to the E2g phonon of sp2 carbon domains in graphitic structures [17]. The intensity ratio of these peaks (ID/IG) serves as a metric to assess the degree of graphitization and structural order within carbon nanomaterials.
For the pristine GQDs, the ID/IG intensity ratio is approximately 1.0, indicating a high degree of edge defects and disordered carbon, which is typical for small-sized carbon quantum dots [18]. However, upon PEG modification, the ID/IG ratio significantly decreases, particularly for higher molecular weight PEG coatings. This reduction implies an enhancement in structural regularity, likely due to the formation of a more crystalline, protective polymer shell that passivates surface defects and suppresses disorder-induced scattering. The correlation between PEG molecular weight and decreasing ID/IG ratio confirms that PEG not only provides steric stabilization but also promotes the formation of more graphitic, structurally ordered clusters [19]. This structural evolution is crucial for optimizing the optical performance and chemical robustness of the GQD clusters in practical applications.
XPS was employed to investigate the elemental composition and the distribution of surface functional groups on the GQD samples, particularly focusing on the influence of PEG surface functionalization. Survey-scan XPS spectra revealed the presence of three dominant elements in all samples: C1s (282–292 eV), N1s (396–408 eV), and O1s (530–535 eV). The pristine GQD sample exhibits high oxidation and amidation levels, as indicated by the O/C and N/C atomic ratios of 31.9 at.% and 28.3 at.%, respectively. However, after PEG modification, the O/C atomic ratio increases significantly to a range of 37.6–47.0 at.%, while the N/C ratio decreases markedly to 2.9–8.6 at.%. Notably, GQD-PEG4, which incorporates the highest molecular weight PEG, presents the lowest N/C ratio (2.9 at.%) while still maintaining a high O/C ratio (37.6 at.%). This composition trend suggests that the PEG shell, rich in H−(O−CH2−CH2)n−OH monomer units, fully encapsulates the GQD core, thereby introducing abundant hydroxyl and ether groups [20]. The pronounced increase in oxidation and concurrent suppression of nitrogen-containing groups in GQD-PEG4 is attributed to the formation of a thicker PEG skin layer that effectively masks the nitrogen functionalities on the GQD surface [21].
To gain deeper insight into the surface chemistry, high-resolution C1s and N1s spectra of the GQD-PEG4 sample were deconvoluted using multiple Gaussian fitting. As shown in Figure 2b, the C1s spectrum comprises four distinct components: C=C/C–C (284.5 eV), C–N (285.8 eV), C–OH (286.2 eV), and O–C=O (287.2 eV), corresponding to sp2 carbon frameworks, amine groups, hydroxyl functionalities, and carboxylic acids, respectively [22]. The dominant contribution from the C–OH peak further corroborates the enrichment of PEG-related hydroxyl groups at the GQD surface. This distribution reflects successful PEG passivation and the presence of oxygen-rich moieties originating from both the carbon precursor and PEG shell. Figure 2c displays the N1s region, which was deconvoluted into three peaks centered around 399.6 eV (pyridinic/pyrrolic N), 401.6 eV (quaternary N), and 405.7 eV (NOx species). Among these, pyridinic/pyrrolic nitrogen and NOx functionalities dominate the nitrogen signal, implying that heteroatom doping occurred during the solvothermal carbonization process. The incorporation of these nitrogen species into the carbon lattice is facilitated by precursor molecules such as trinitropyrene, which enable in situ growth of “lattice N” within the graphene domains [23]. These species likely emerge through nucleophilic substitution and condensation reactions involving adjacent phenolic, carboxylic, and pyrone moieties present on the graphitic edges [24]. The coexistence of graphitic and edge nitrogen configurations not only enhances the electronic properties of GQDs but also tailors their PL and bioimaging functionalities.

3.2. PL Emission from PEG-Modified GQD Clusters

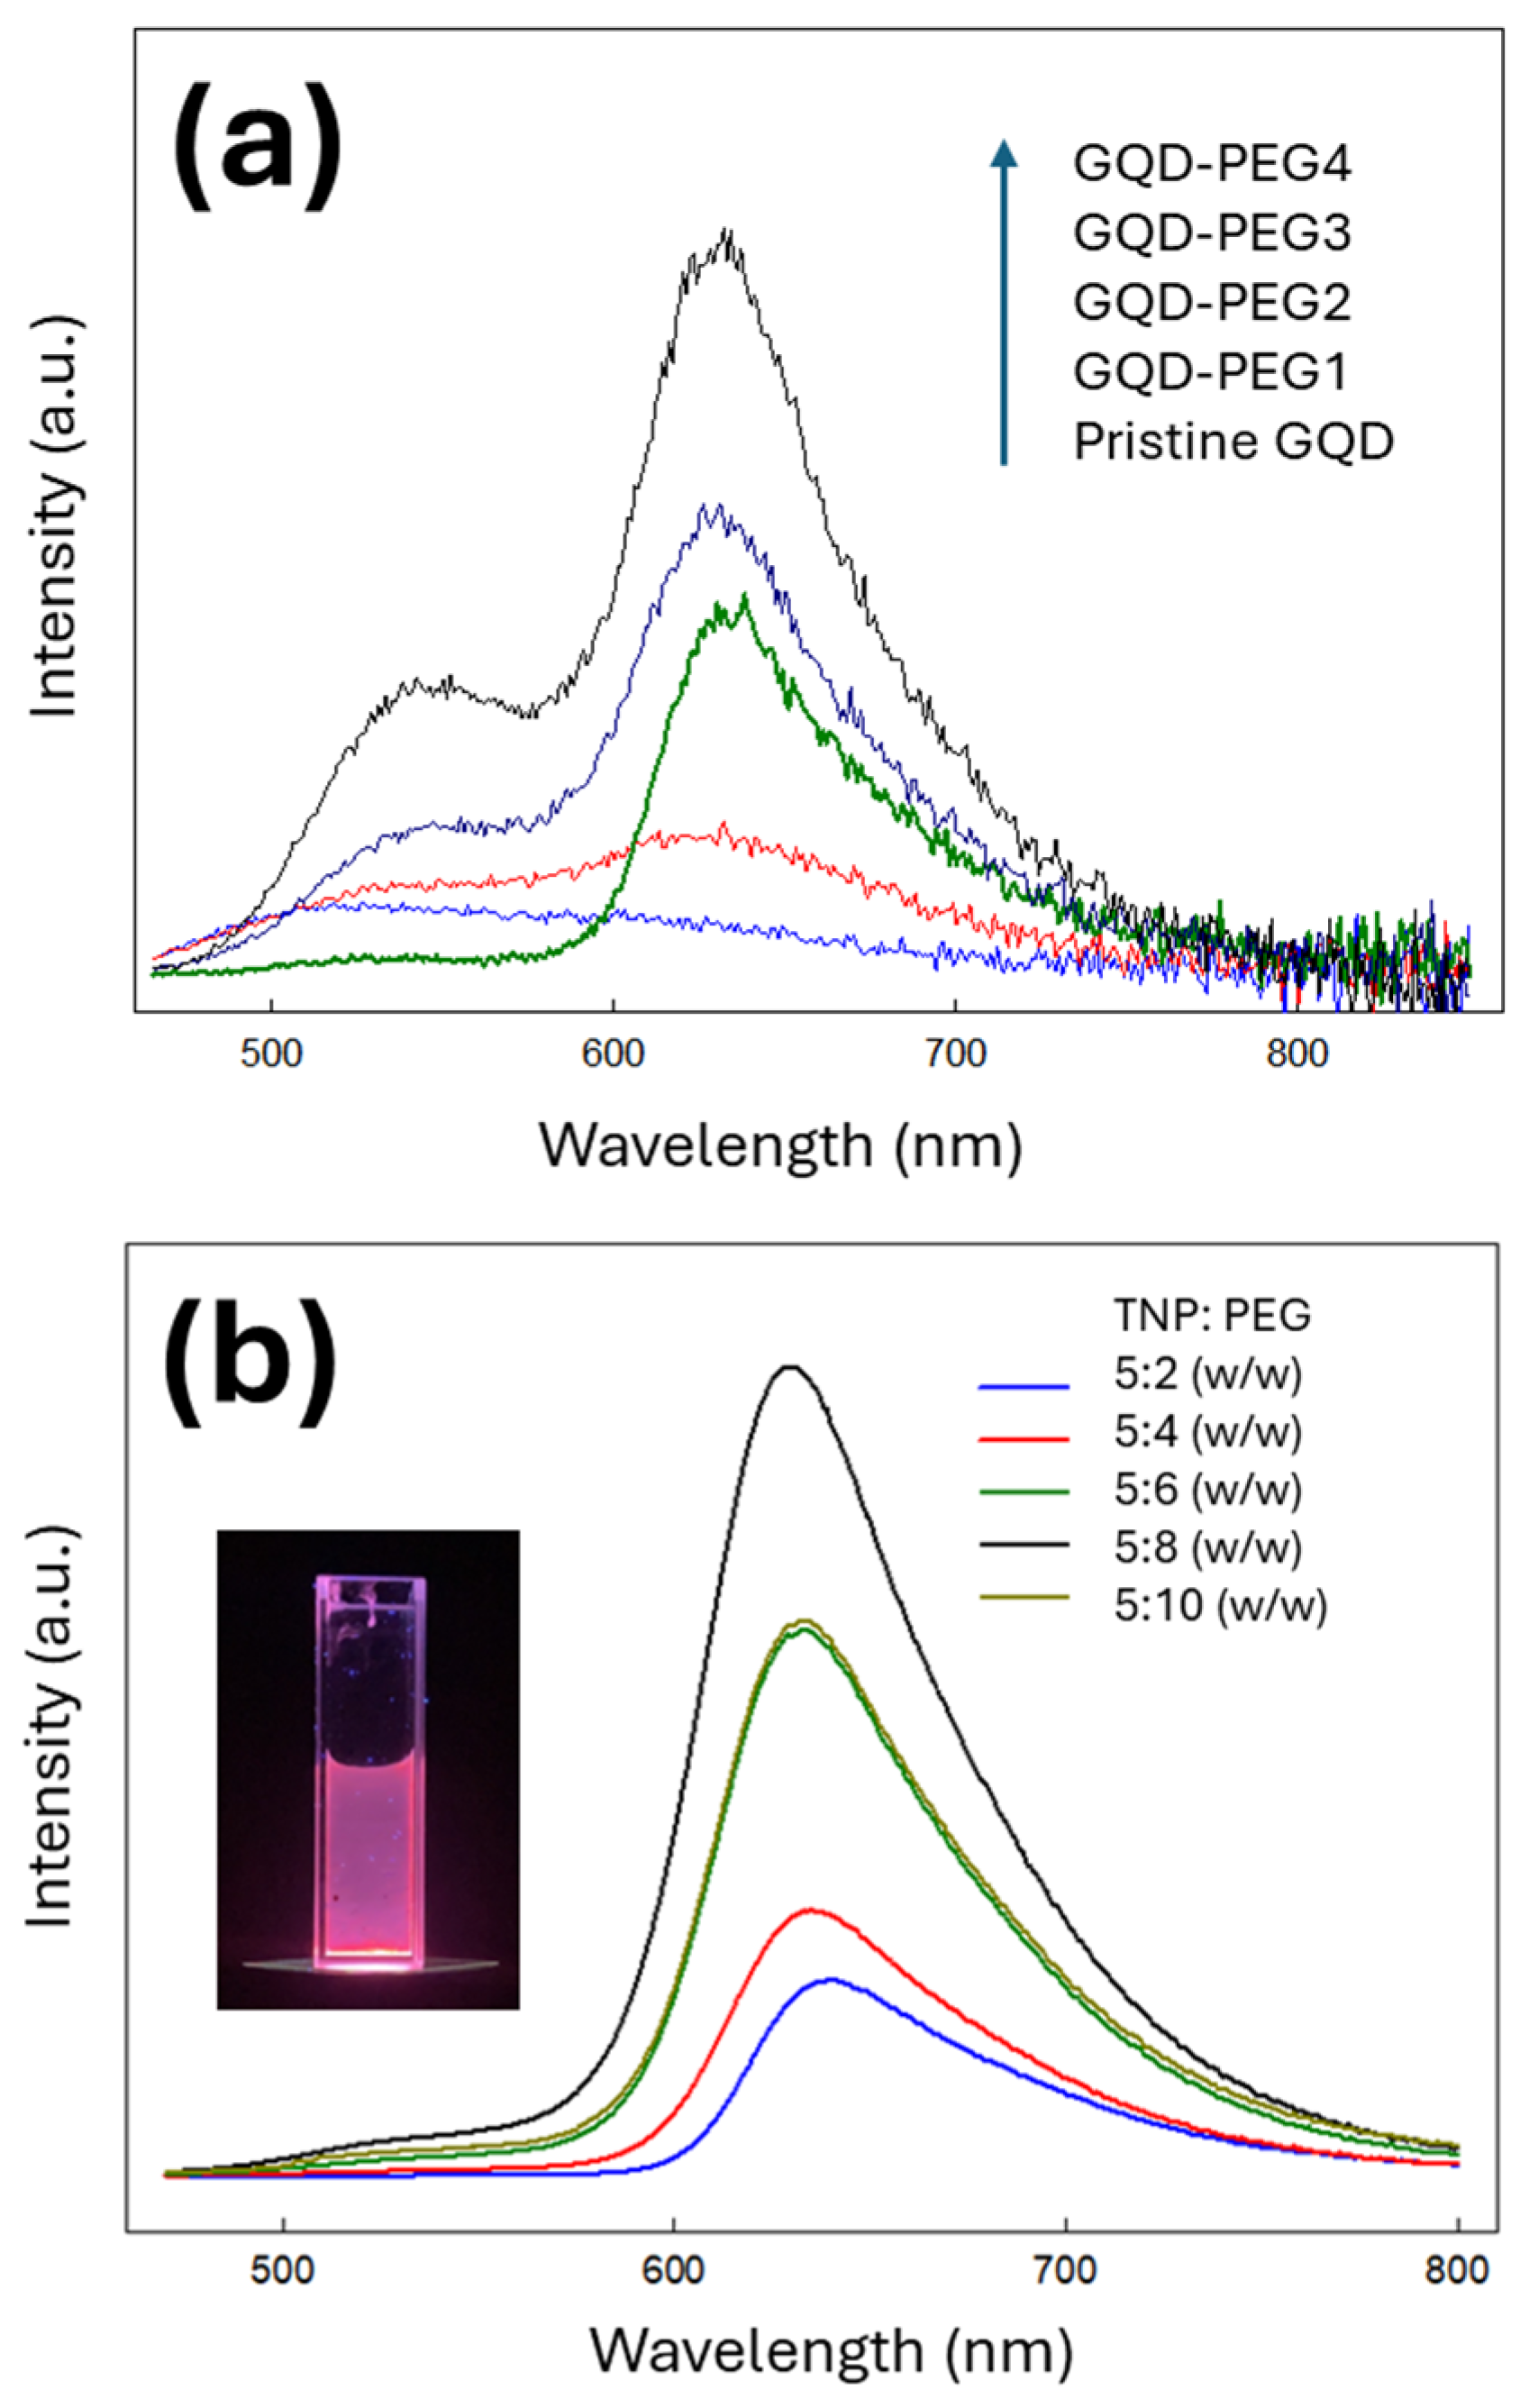
Figure 3a presents the PL emission spectra of pristine GQD and PEG-modified GQD cluster suspensions dispersed in PGMEA, all excited at 450 nm. All GQD samples exhibit broad and asymmetric emission profiles, yet the peak positions and intensities are clearly dependent on the surface modification. The pristine GQD shows a maximum emission at ~580 nm, whereas the PEG-functionalized variants demonstrate progressively red-shifted emissions: ~625 nm for GQD-PEG1 and ~635 nm for GQD-PEG2, GQD-PEG3, and GQD-PEG4. This red shift in PL peak position correlates strongly with the increasing molecular weight of the PEG capping layer, indicating modifications in the electronic structure and aggregation behavior of the GQD clusters due to surface passivation [25].
Notably, the PL intensity is markedly enhanced as the PEG molecular weight increases, a trend attributable to the aggregation-induced emission (AIE) effect. Unlike traditional fluorophores that typically suffer from aggregation-caused quenching, the PEG-modified GQDs display intensified luminescence upon clustering. This enhancement arises because the PEG skin layers facilitate the spatial restriction of intramolecular motions and non-radiative decay pathways, thereby promoting radiative recombination of excitons [26]. Among the samples, GQD-PEG4, functionalized with PEG of molecular weight 300,000, exhibits the highest PL intensity, with an ~8-fold enhancement compared to pristine GQD. This significant improvement underscores the critical role of optimal PEG shell thickness in maximizing fluorescence output through AIE mechanisms. Moreover, the extended conjugation and increased surface polarity induced by PEG also help stabilize excitonic states and reduce charge-trapping defects, further improving PL efficiency [27].
To evaluate the impact of PEG dosage on emission performance, Figure 3b displays the PL spectra of GQD-PEG4 suspensions synthesized with various TNP/PEG precursor ratios. It is evident that the sample prepared with a TNP/PEG ratio of 5:6 produces the most intense PL emission under blue light illumination. The inset photograph in Figure 3b visually confirms this finding, showing the GQD-PEG4 suspension emitting vivid red fluorescence upon excitation at 450 nm. These results further validate the significance of AIE as a key luminescence mechanism for PEG-modified GQD systems, and demonstrate that both molecular weight and dosing of PEG can be strategically tuned to modulate optical properties for targeted applications in imaging, illumination, and optoelectronics [28].
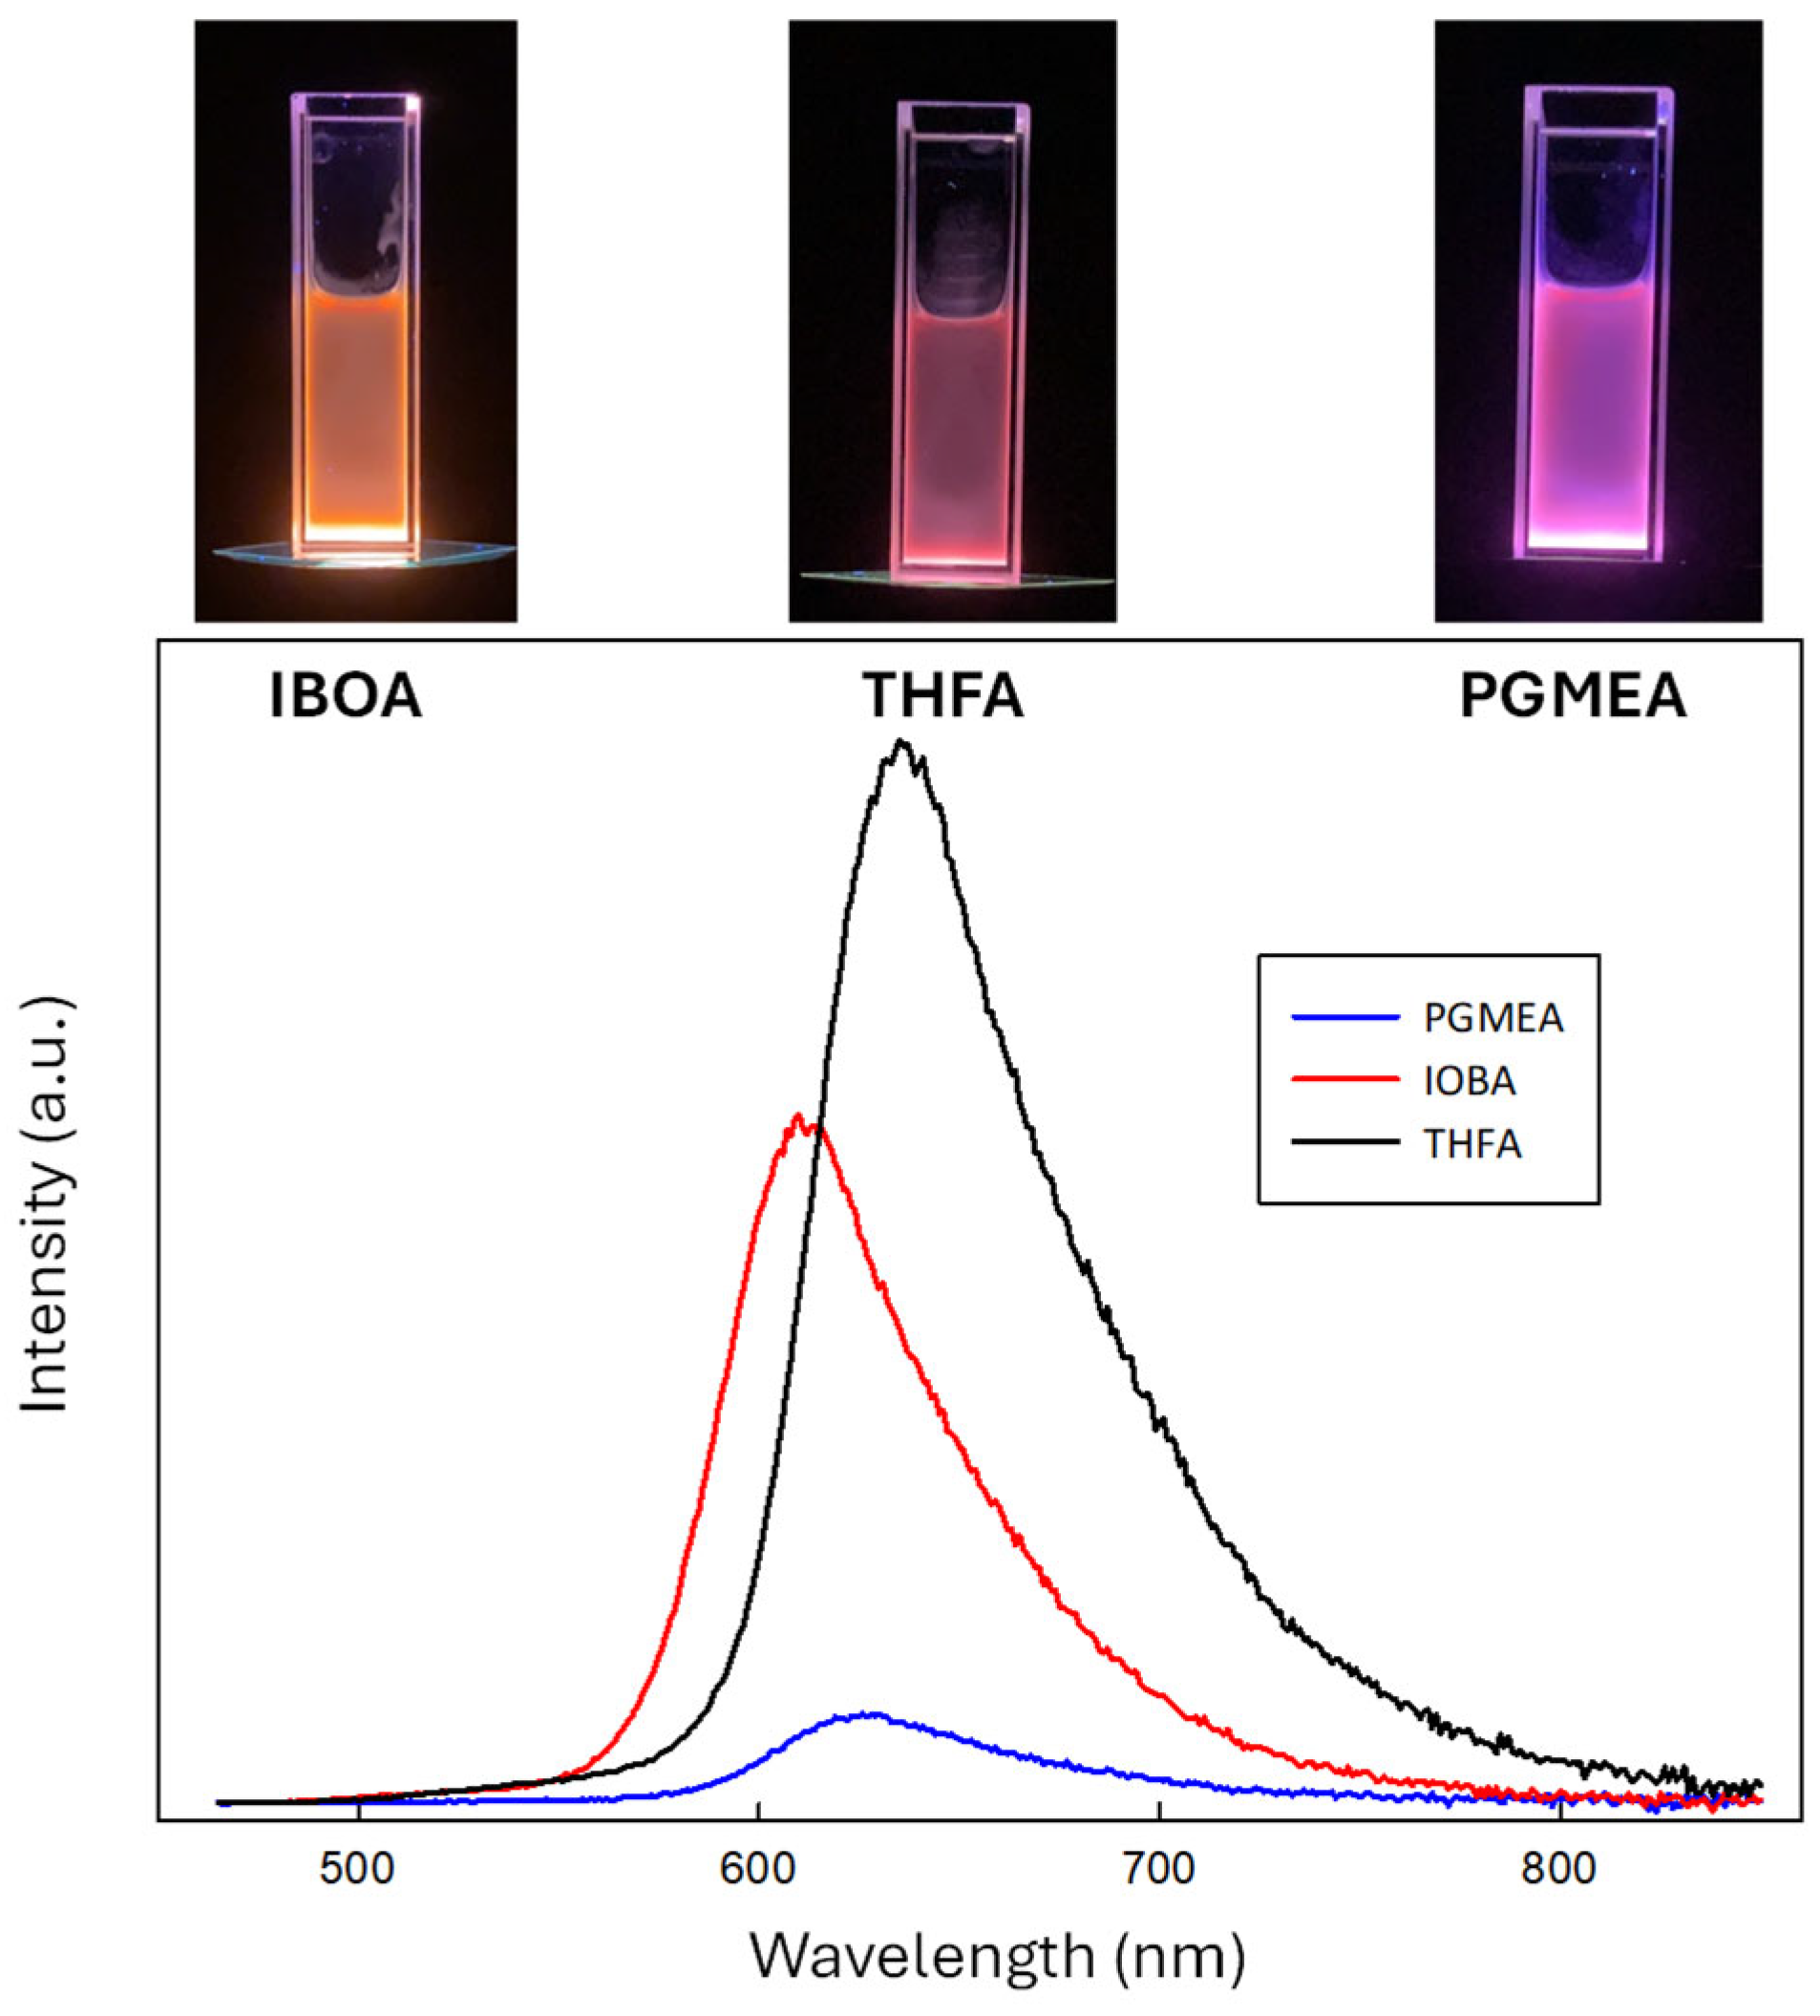
To explore the effect of solvent environment on the PL behavior, the PL emission spectra of GQD-PEG4 suspensions dispersed in three different organic solvents, IBOA, THFA, and PGMEA, were recorded under 450 nm excitation, as shown in Figure 4. It is evident that the solvent type has a significant impact on both the emission wavelength and intensity. Specifically, the maximum PL emission peaks are located at approximately 605 nm for IBOA, 642 nm for THFA, and 635 nm for PGMEA. Correspondingly, the GQD-PEG suspensions emit distinctly different visible colors: orange in IBOA, deep red in THFA, and vivid red in PGMEA.
This red shift in emission with changing solvents can be attributed to the solvatochromic effect, where the polarity and hydrogen-bonding capability of the solvent influence the excited-state energy levels of the GQD clusters. THFA, which is the most polar among the three solvents, stabilizes the excited states of GQD-PEG clusters to a greater extent, thus leading to a pronounced red shift [29]. Additionally, the dielectric constant and viscosity of the solvents modulate the molecular mobility and degree of aggregation of the PEG-modified clusters, directly affecting the non-radiative decay processes and, hence, the PL intensity.
Interestingly, the PL intensity follows the order THFA > IBOA > PGMEA. This trend can be explained by considering the AIE mechanism in conjunction with solvent–polymer interactions. In THFA, favorable solvation and partial aggregation of PEG-wrapped GQDs promote efficient radiative recombination, thereby enhancing PL intensity. In contrast, PGMEA, despite yielding a vivid red color, results in lower PL intensity, possibly due to a more dispersed GQD-PEG configuration that diminishes the AIE effect. These results emphasize the critical role of solvent properties, such as polarity, viscosity, and hydrogen-bonding ability, in tuning the emission behavior of GQD-based fluorophores [30].

3.3. Structural and Optical Characterization of GQD-KOH and GQD-NaOH Samples

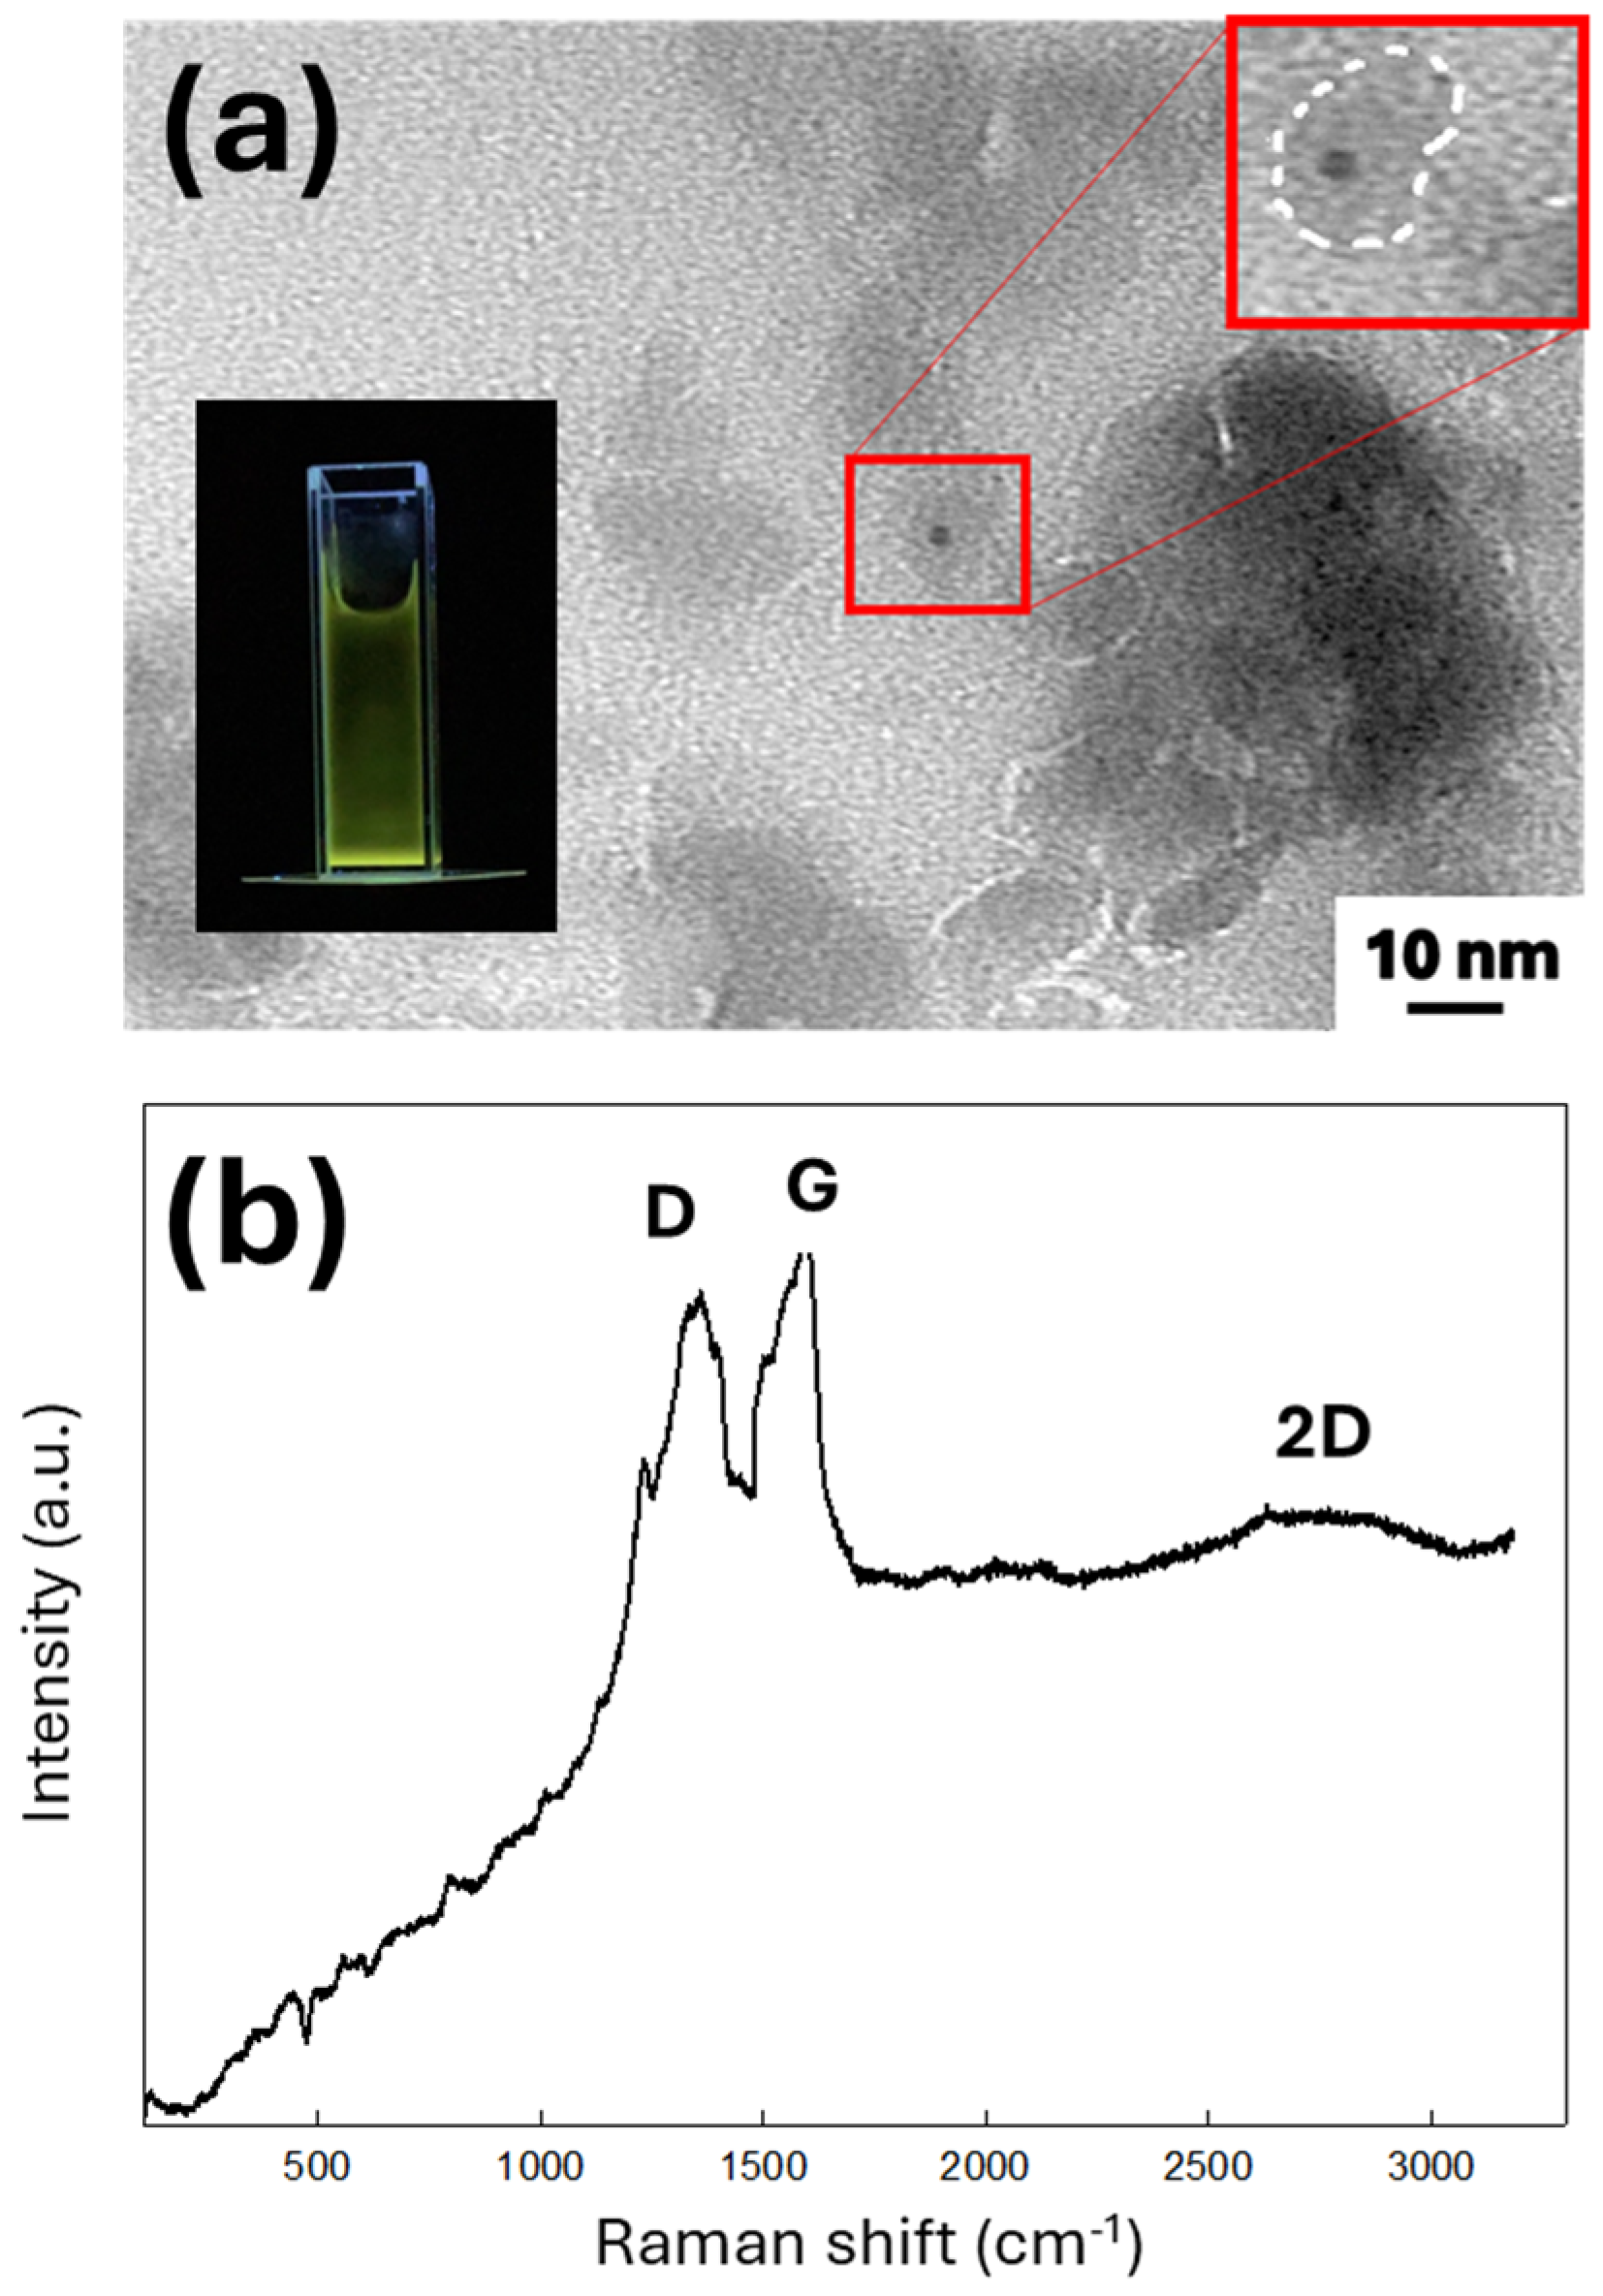
The TEM micrograph of the GQD-KOH sample, shown in Figure 5a, clearly demonstrates the formation of distinct core–shell nanostructures. The GQD cores, each with an average diameter of approximately 3.3 nm, are homogeneously encapsulated by a surrounding amorphous shell layer with a thickness of about 26.6 nm. This encapsulation is likely formed by the surface functionalization during alkaline treatment, which promotes the formation of a uniform passivation layer around the GQD core. The core–shell configuration provides enhanced surface stability and colloidal dispersion, both of which are essential for the optical performance of the clusters [12].
Raman spectroscopy was further used to probe the structural characteristics of the GQD-NaOH clusters, as illustrated in Figure 5b. The spectra reveal two well-defined peaks: the D band, centered around 1350 cm−1, is indicative of defects, disordered carbon, or sp3-hybridized carbon domains, while the G band, near 1580 cm−1, corresponds to the E2g vibration mode of graphitic sp2 carbon networks. Importantly, the ID/IG intensity ratio of these peaks is found to be less than unity, suggesting a higher degree of graphitic crystallinity within the core and a reduced level of structural disorder. The relatively low ID/IG ratio implies that the KOH-induced passivation shell acts as a crystalline stabilizer, protecting the GQD core from oxidative or structural defects and suppressing non-radiative recombination channels [31].
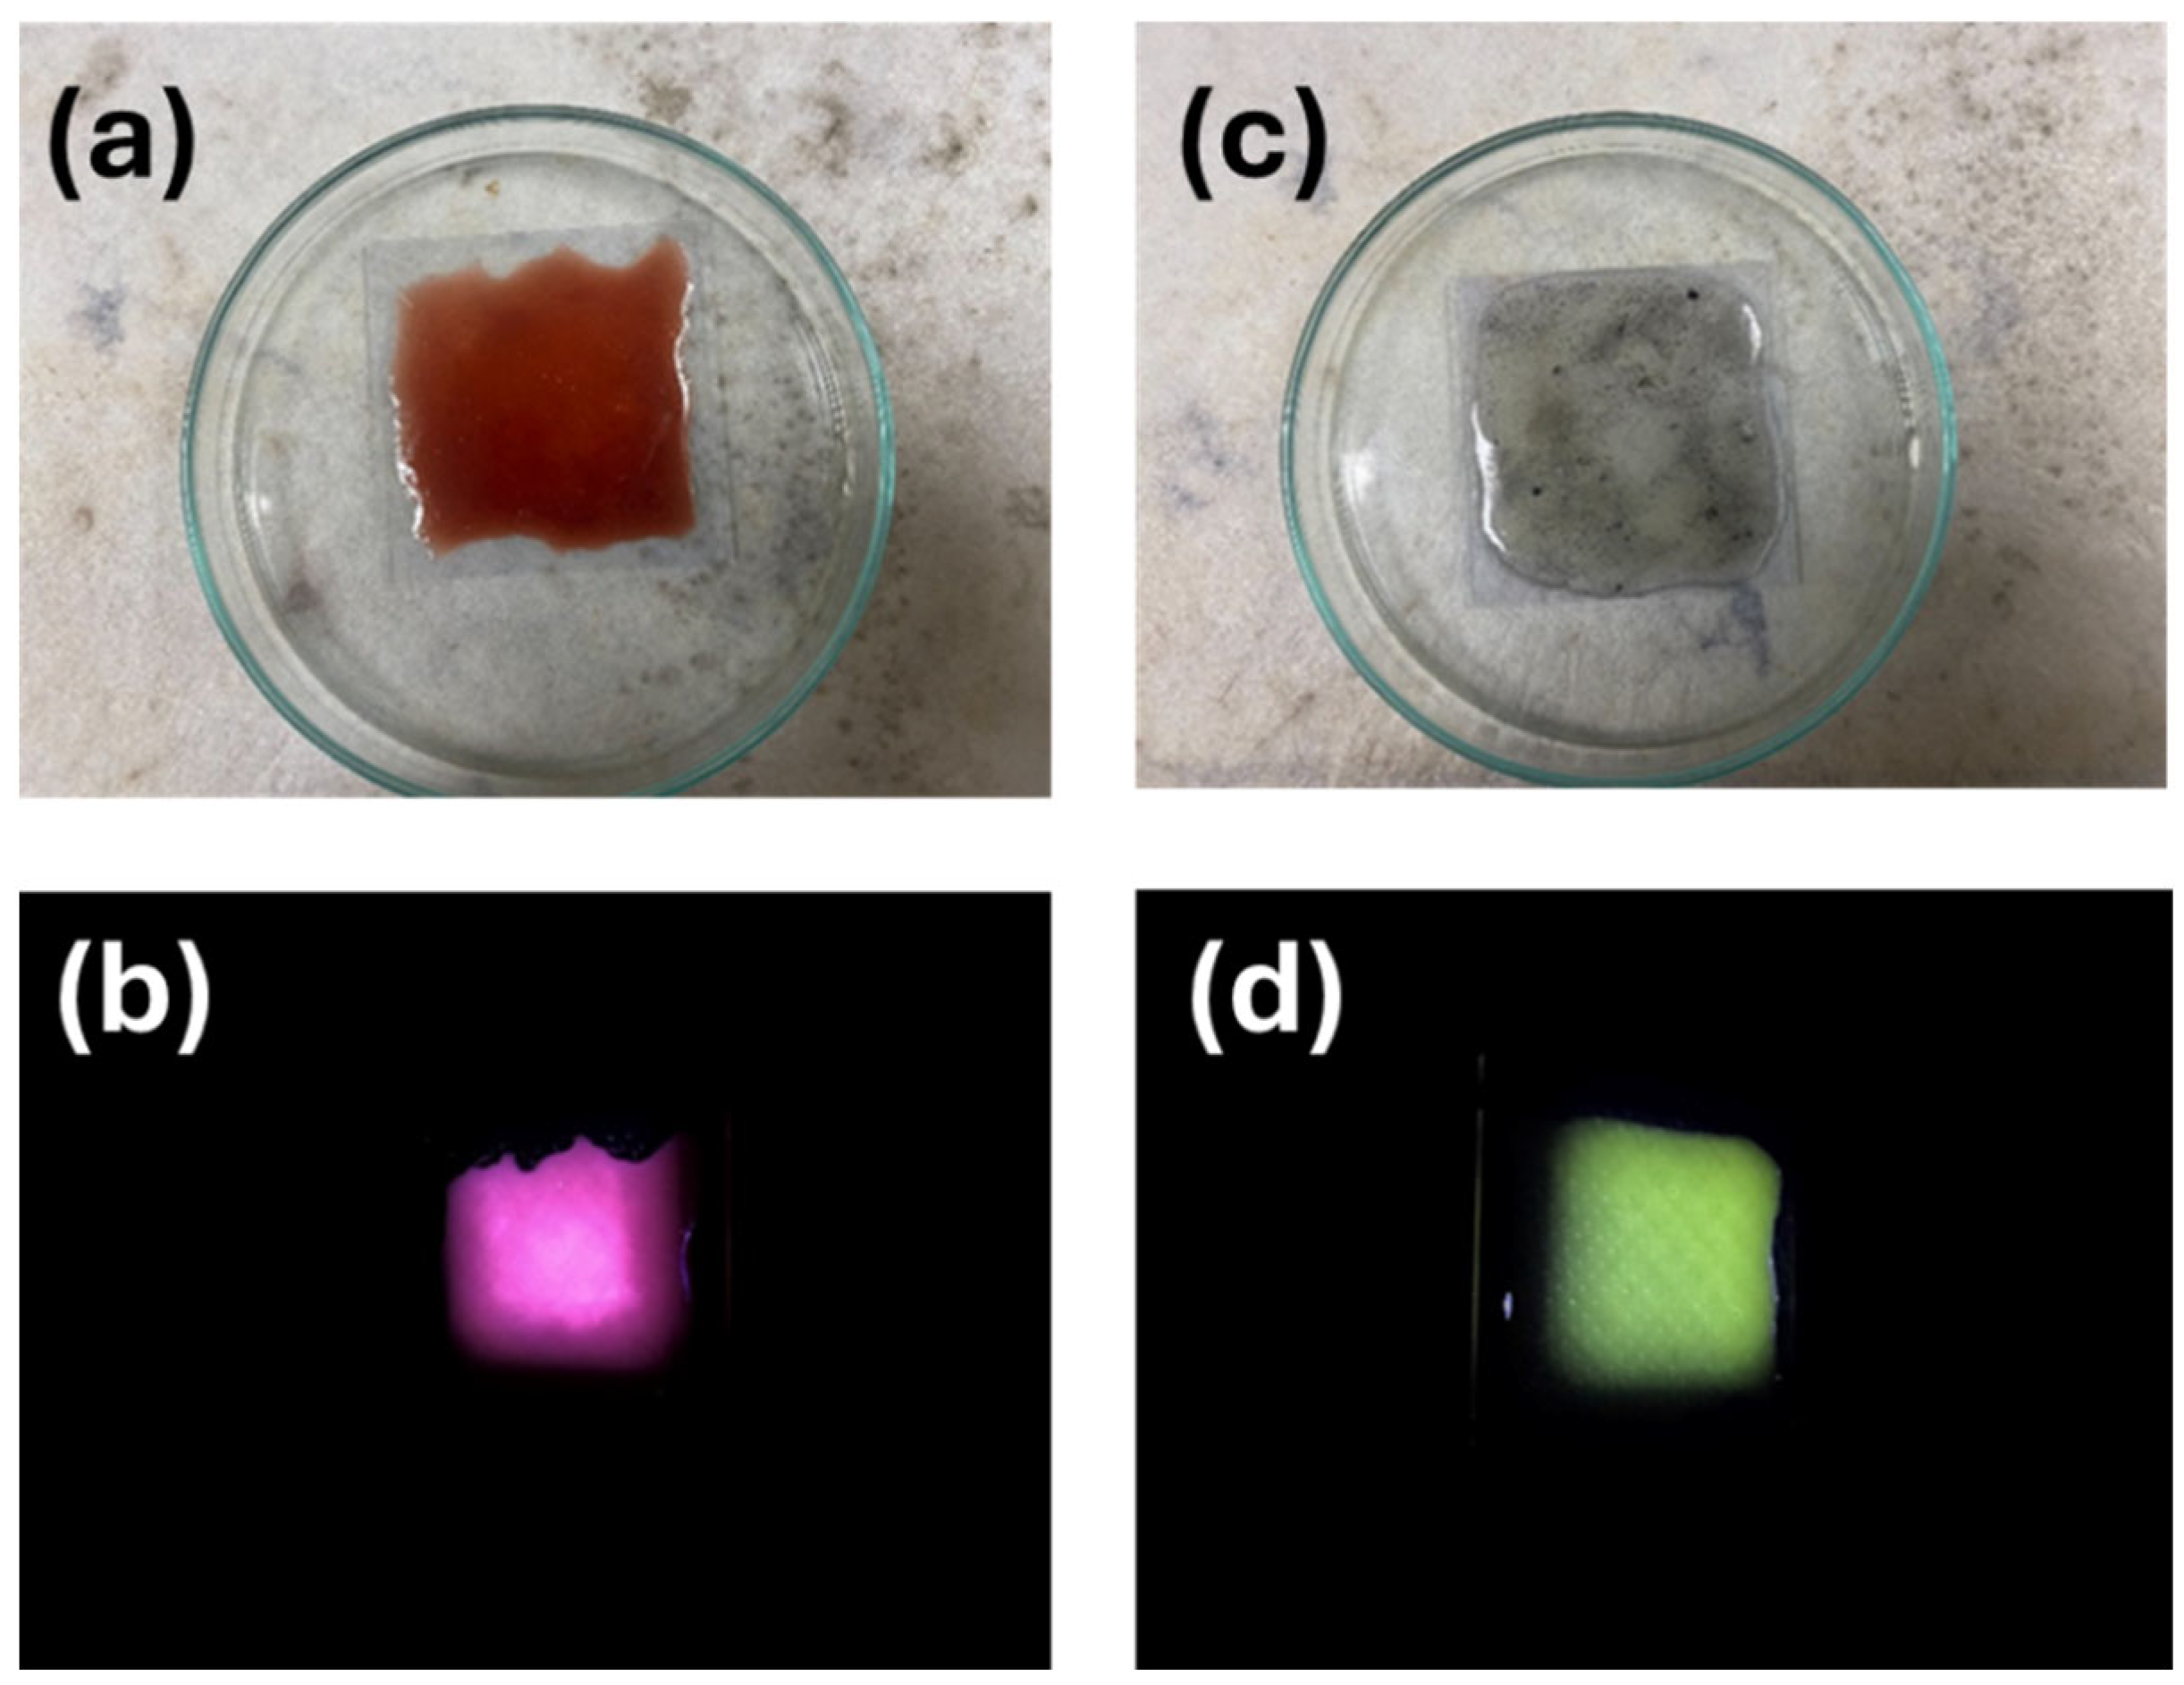
Figure 6 displays optical photographs of GQD-PEG and GQD-NaOH thin films under both ambient sunlight and 450 nm blue-light illumination. The images clearly demonstrate that the resulting films emit vivid red and green fluorescence, respectively, when exposed to blue light. This strong photoluminescence is attributed to the effective AIE mechanisms and the passivation effects of PEG and NaOH treatments. The PEG-functionalized films favor red emission due to their extensive π-conjugation and inter-dot interactions, while the NaOH-treated films exhibit green fluorescence, likely due to modified surface groups and electronic states introduced during alkaline activation. These observations suggest that the optical characteristics of GQD films can be precisely tailored via surface functionalization and treatment conditions, making them promising candidates for applications in flexible photonic devices, security tags, and full-color light-emitting diodes [1].
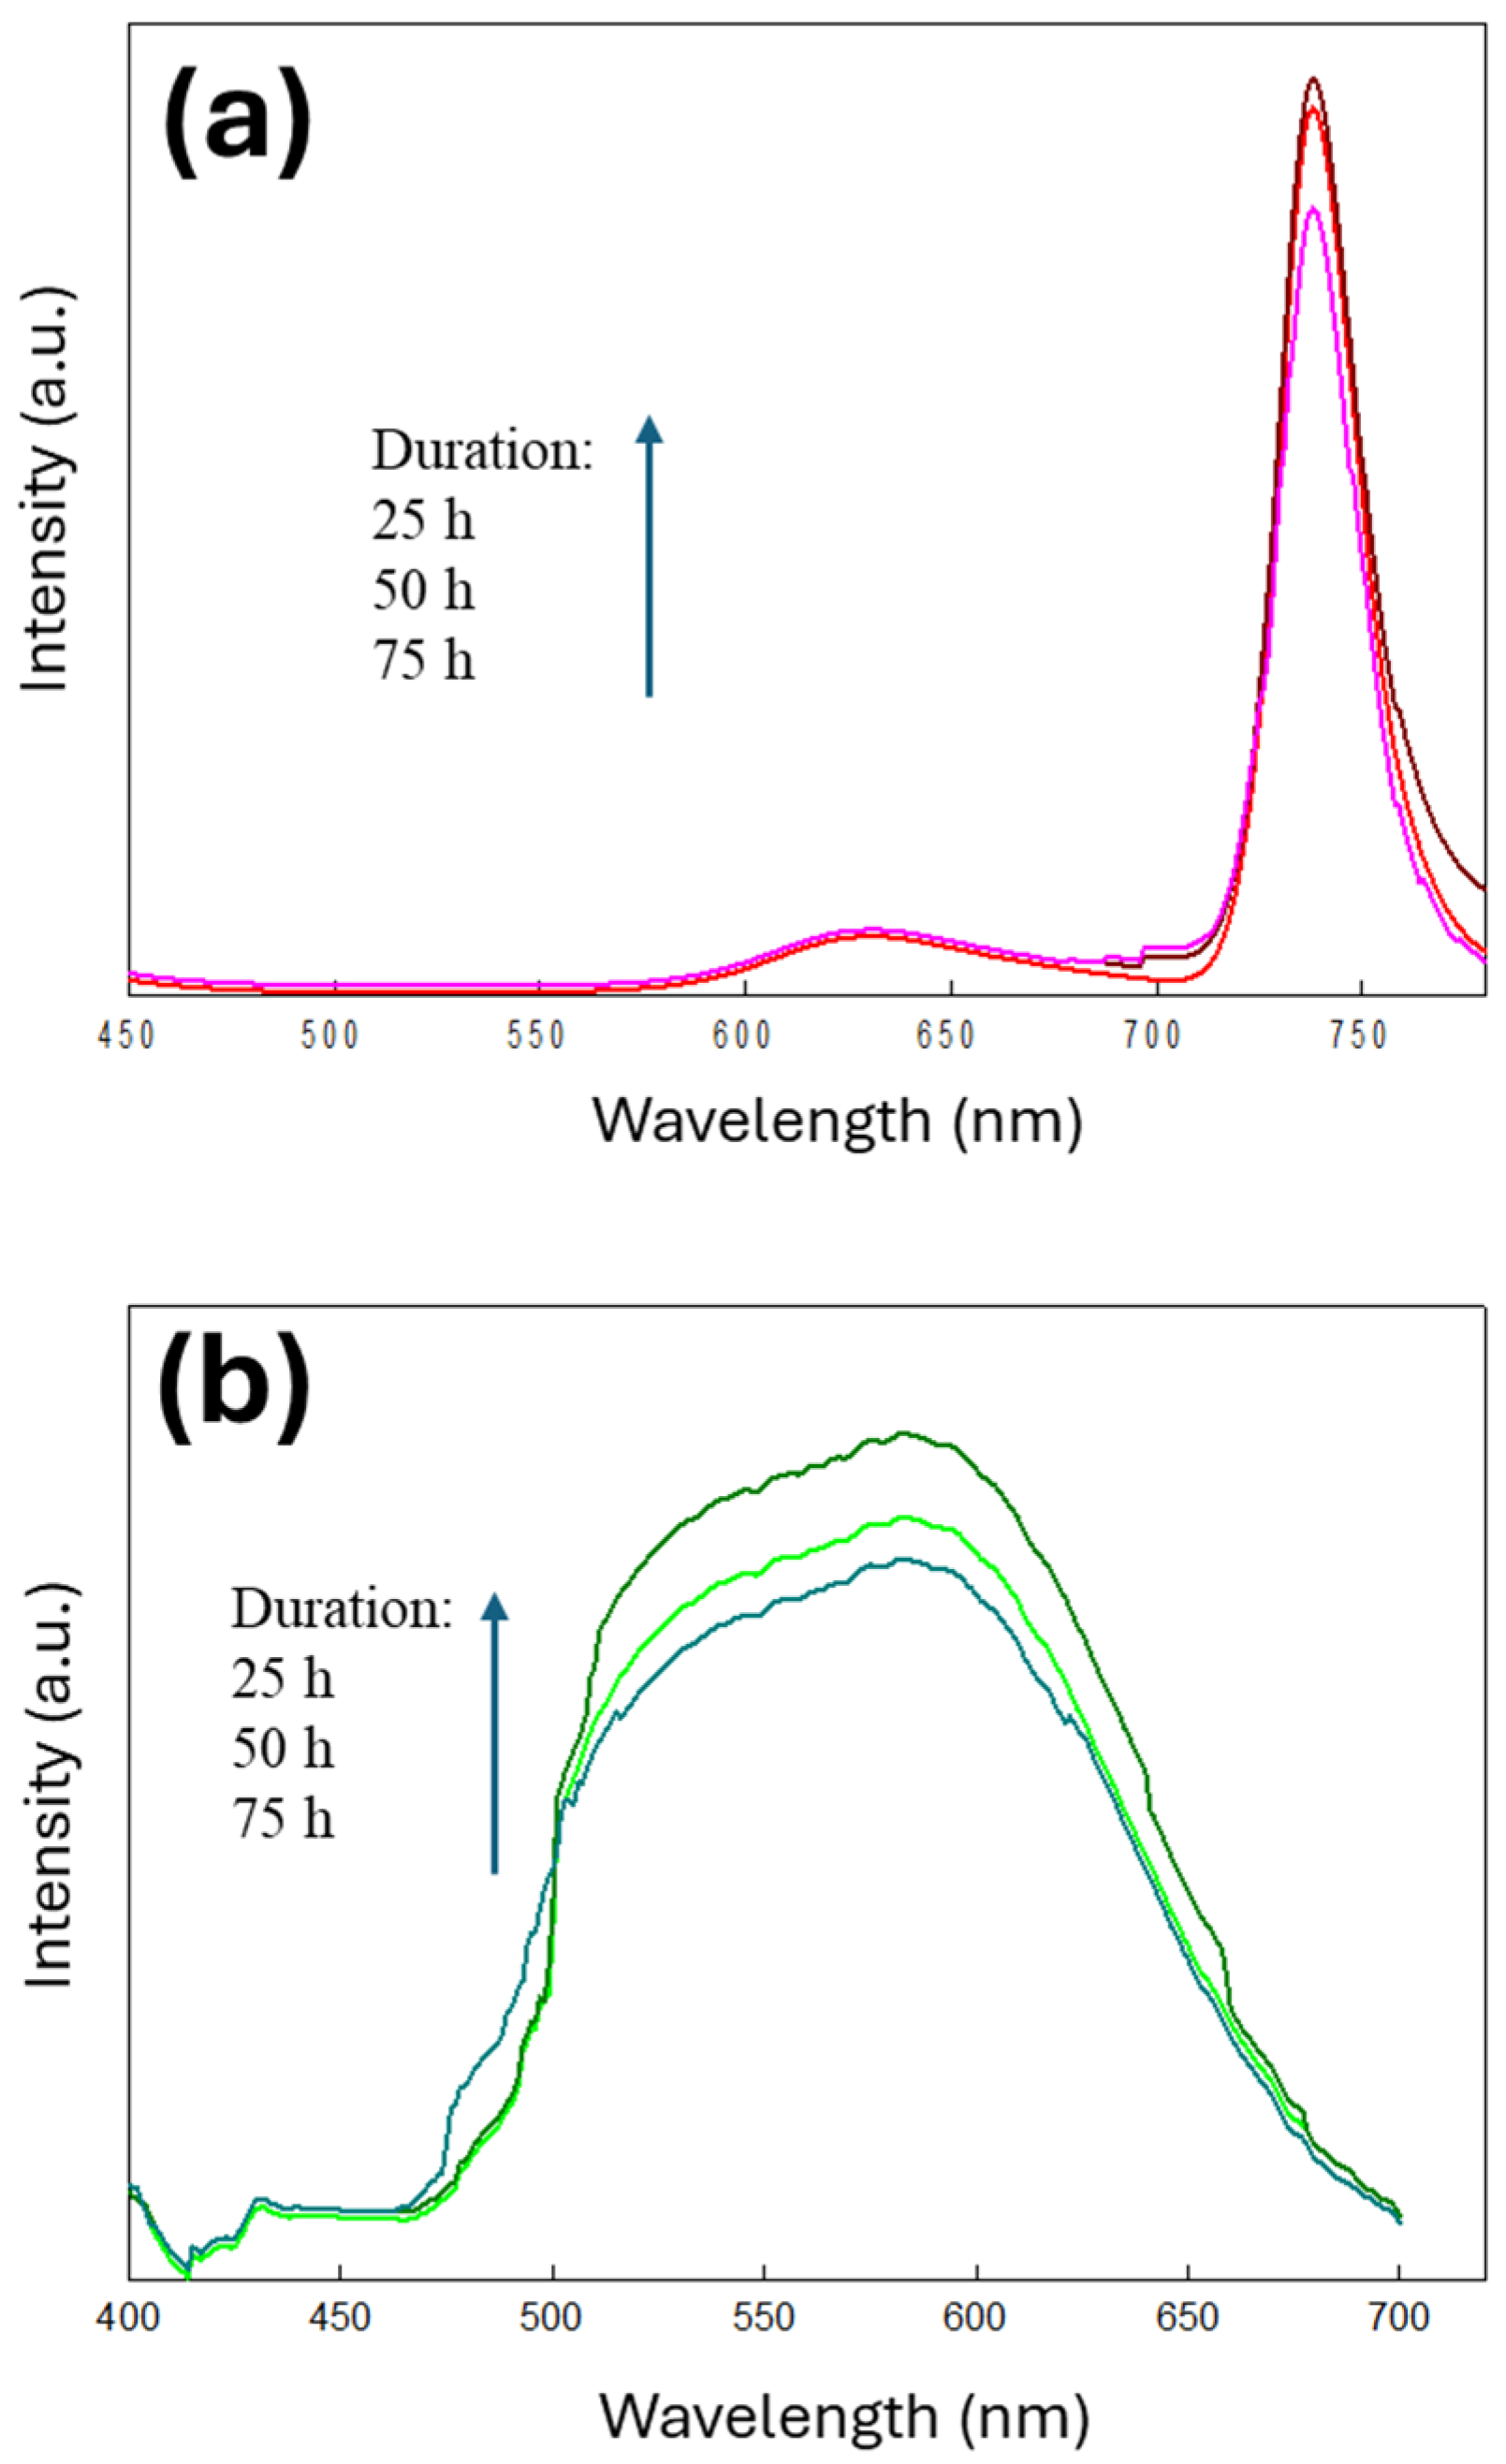
To evaluate the adhesion stability and environmental durability of the as-prepared GQD thin films, both GQD-PEG and GQD-NaOH films were immersed in distilled water for extended durations of 25, 50, and 75 h. After each immersion period, the films were gently dried under ambient conditions and their PL emission spectra were recorded, as presented in Figure 7. The GQD-PEG thin film exhibits a pronounced fluorescence peak centered around 745 nm, corresponding to the red emission facilitated by PEG-induced surface passivation and AIE mechanisms.
In contrast, the GQD-NaOH film shows a distinct fluorescence emission near 580 nm, consistent with its greenish optical signature arising from hydroxide-mediated surface states. Notably, both films maintain strong PL intensity with only minor degradation over time. After 75 h of immersion, the PL intensity of the GQD-PEG and GQD-NaOH films remains at approximately 85% of the initial value recorded after 25 h, indicating minimal quenching or detachment. This result clearly demonstrates that the GQD thin films possess excellent adhesion to glass substrates, with no observable signs of delamination or surface peeling even after prolonged water exposure. The high adhesion stability can be attributed to robust interfacial bonding between the GQD surface functional groups (e.g., hydroxyl, carboxyl, or ether groups) and the hydroxylated glass surface, as well as the cohesive interactions within the polymeric or alkaline-modified matrix [32].

3.4. Cell Labeling Using GQD-KOH and GQD-NaOH Samples

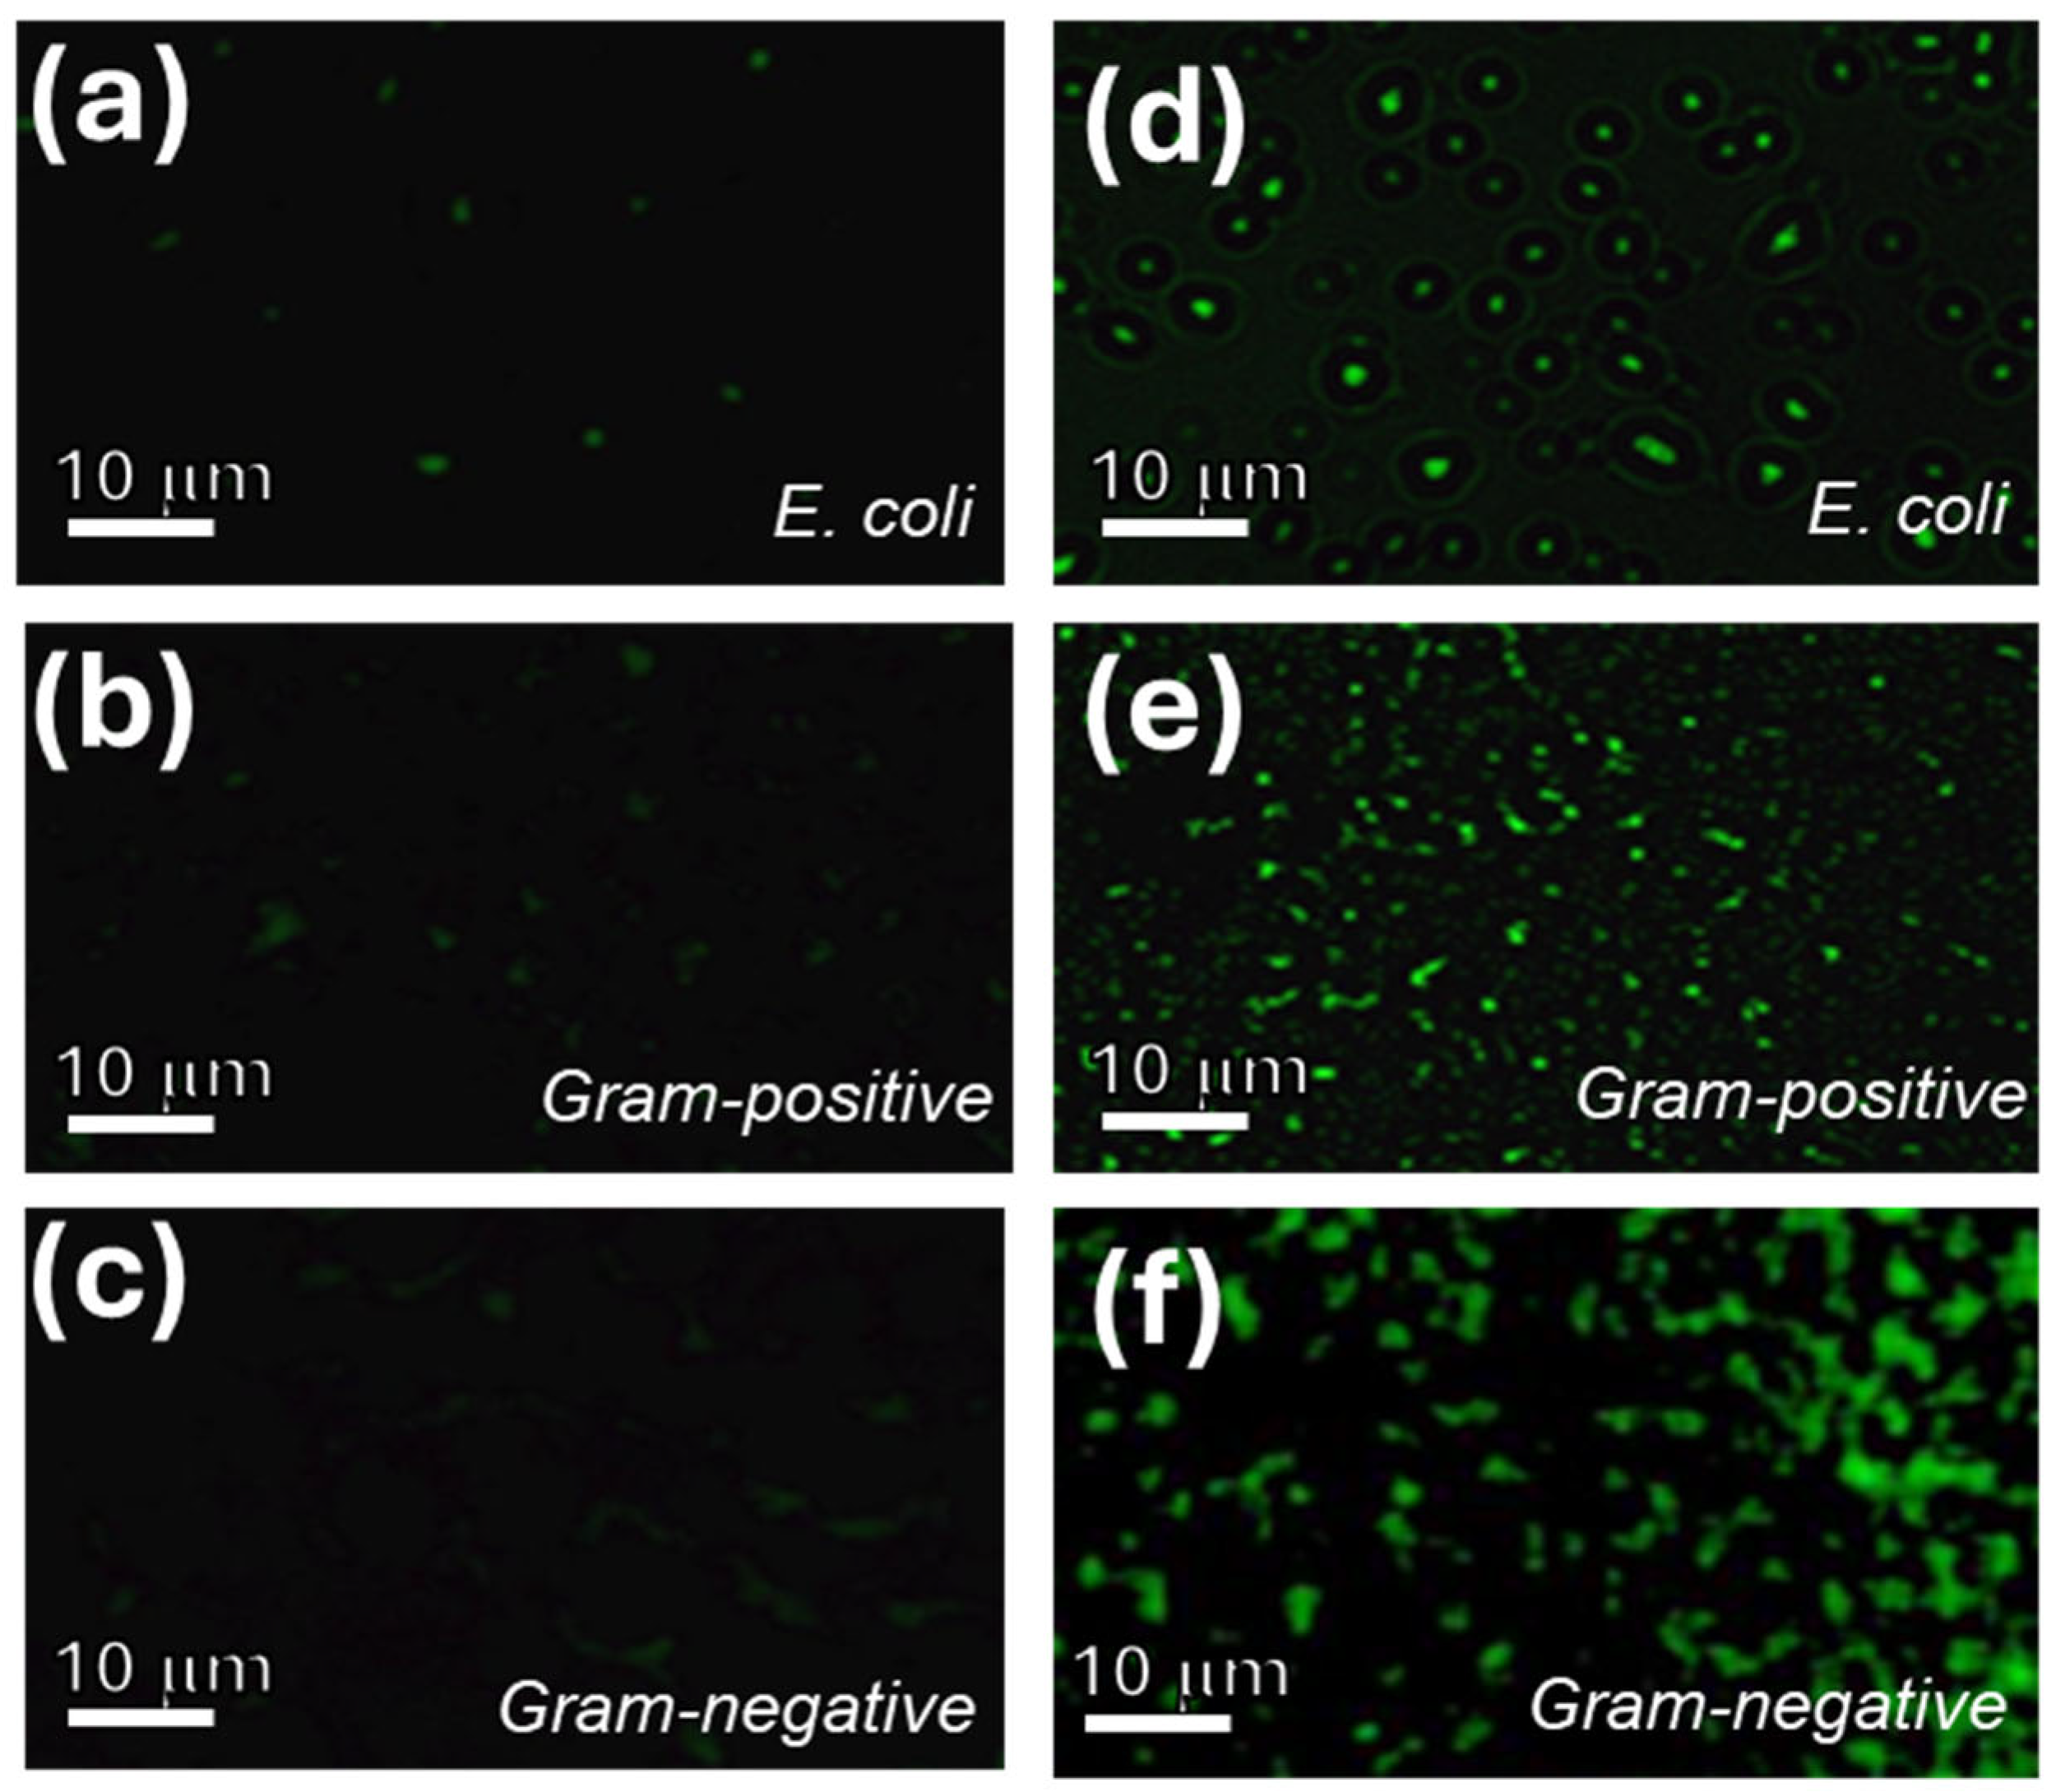
Photographic evidence of fluorescent labeling for E. coli, Gram-positive, and Gram-negative bacterial strains using the synthesized GQD-PEG and GQD-NaOH nanoprobes is displayed in Figure 8 and Figure 9, respectively. Here, two concentration levels of the GQD samples, 75 and 100 mg/L, were used to assess their bio-imaging efficacy. At a lower concentration of 75 mg/L, minimal fluorescence signals were observed across all bacterial strains, indicating insufficient nanoprobe-cell interaction or internalization. However, at 100 mg/L, all three types of cells exhibited distinct fluorescence, confirming successful cellular labeling.
Interestingly, the type of surface functionalization distinctly influenced the emission color: GQD-PEG nanoprobes produced a prominent red fluorescence, while GQD-NaOH nanoprobes exhibited a bright green emission under fluorescence microscopy. This difference arises from the surface-modification-induced shifts in the photoluminescence spectra of the GQDs, which are sensitive to local chemical environments and aggregation states [24]. The ability of both GQD-PEG and GQD-NaOH clusters to effectively label both Gram-positive and Gram-negative bacteria further highlights their broad biocompatibility and strong affinity toward bacterial membranes, potentially through hydrogen bonding, electrostatic, or hydrophobic interactions [33]. Based on our results, the functionalized GQDs in our work are primarily adsorbed onto the cell membrane rather than penetrating deeply into the cytoplasm. The relatively large size of GQD aggregates in aqueous suspension (tens of nanometers) together with their surface functionalization (PEG or NaOH treatment) favors strong electrostatic and hydrogen-bonding interactions with the bacterial cell walls (both Gram-positive and Gram-negative) and with the outer membrane of E. coli cells. This surface adsorption is sufficient to provide strong fluorescent labeling, as observed in our imaging experiments. Overall, these findings demonstrate the excellent potential of functionalized GQDs as dual-color bio-imaging agents, capable of selectively labeling various bacterial strains in a concentration-dependent manner. Such dual-emissive fluorescent labeling paves the way for the development of cost-effective, nanomaterial-based diagnostic tools for microbial detection/identification [34] and potential applications [35,36].

4. Conclusions

In summary, we successfully synthesized and functionalized GQDs using a one-pot hydrothermal approach, enabling precise control over their PL properties through PEG and NaOH surface modification. PEG-functionalized GQDs displayed enhanced red fluorescence due to AIE effects, while NaOH-modified GQDs emitted green light, providing dual-color emission profiles suitable for multifunctional applications. The PL response was significantly influenced by the molecular weight of PEG and solvent polarity, with GQD-PEG in THFA exhibiting the strongest fluorescence. The thin films fabricated from these GQDs demonstrated excellent water-resistant adhesion and fluorescence retention, making them viable for thin-film illuminators. Additionally, both GQD types effectively labeled bacterial cells at concentrations above 100 mg/L, validating their use as bioimaging probes. These findings provide a robust platform for developing multifunctional GQD-based materials for future optoelectronic, biosensing, and diagnostic applications.

Author Contributions

Conceptualization, R.-S.J.; methodology, Y.-R.L. and C.-C.F.; validation, R.-S.J. and C.-T.H.; formal analysis, C.-C.F. and C.-T.H.; investigation, Y.-R.L. and C.-C.F.; data curation, Y.-R.L. and C.-C.F.; visualization, Y.-R.L. and C.-C.F.; writing—original draft preparation, C.-T.H.; writing—review and editing, R.-S.J. and C.-T.H.; supervision, R.-S.J. and C.-T.H.; funding acquisition, R.-S.J. and C.-T.H. All authors have read and agreed to the published version of the manuscript.

Funding

This research was funded by the Chang Gung Memorial Hospital, Linkou, Taiwan (grant No. CMRPD2M0092) and by the National Science and Technology Council in Taiwan (grant No. 113-2221-E-182-015 and 110-2623-E-006-002).

Data Availability Statement

The data presented in this study are available on request from the corresponding author.

Conflicts of Interest

The authors declare no conflict of interest. The funders had no role in the design of the study; in the collection, analyses, or interpretation of data; in the writing of the manuscript, or in the decision to publish the results.

References

  1. Zhu, S.; Meng, Q.; Wang, L.; Zhang, J.; Song, Y.; Jin, H.; Yang, B. Highly photoluminescent carbon dots for multicolor patterning, sensors, and bioimaging. Angew. Chem. Int. Ed. 2013, 52, 3953–3957. [Google Scholar] [CrossRef]
  2. Li, X.; Rui, M.; Song, J.; Shen, Z.; Zeng, H. Carbon and Graphene Quantum Dots for Optoelectronic and Energy Devices: A Review. Adv. Funct. Mater. 2015, 25, 4929–4947. [Google Scholar] [CrossRef]
  3. Baker, S.N.; Baker, G.A. Luminescent Carbon Nanodots: Emergent Nanolights. Angew. Chem. Int. Ed. Engl. 2010, 49, 6726–6744. [Google Scholar] [CrossRef] [PubMed]
  4. Wang, Y.; Kalytchuk, S.; Zhang, Y.; Shi, H.; Kershaw, S.V.; Rogach, A.L. Thickness-Dependent Full-Color Emission Tunability in a Flexible Carbon Dot Ionogel. J. Phys. Chem. Lett. 2014, 5, 1412–1420. [Google Scholar] [CrossRef] [PubMed]
  5. Lim, S.Y.; Shen, W.; Gao, Z. Carbon quantum dots and their applications. Chem. Soc. Rev. 2015, 44, 362–381. [Google Scholar] [CrossRef]
  6. Dong, Y.; Pang, H.; Bin Yang, H.; Guo, C.; Shao, J.; Chi, Y.; Chen, G. Carbon-Based Dots Co-doped with Nitrogen and Sulfur for High Quantum Yield and Excitation-Independent Emission. Angew. Chem. Int. Ed. Engl. 2013, 52, 7800–7804. [Google Scholar] [CrossRef]
  7. Pan, D.; Zhang, J.; Li, Z.; Wu, C.; Yan, X.; Wu, M.; Zhang, H. Observation of pH-, solvent-, spin-, and excitation-dependent blue photoluminescence from carbon nanoparticles. Chem. Commun. 2010, 46, 3681–3683. [Google Scholar] [CrossRef]
  8. Wang, F.; Xie, Z.; Zhang, H.; Liu, C.; Zhang, Y. Highly luminescent organosilane-functionalized carbon dots for multicolor patterning, sensors, and bioimaging. Adv. Funct. Mater. 2011, 21, 1027–1031. [Google Scholar] [CrossRef]
  9. Li, H.; He, X.; Kang, Z.; Huang, H.; Liu, Y.; Liu, J.; Lian, S.; Tsang, C.H.A.; Yang, X.; Lee, S. Water-Soluble Fluorescent Carbon Quantum Dots and Photocatalyst Design. Angew. Chem. Int. Ed. Engl. 2010, 49, 4430–4434. [Google Scholar] [CrossRef]
  10. Kohli, H.K.; Parab, D. Green synthesis of carbon quantum dots and applications: An insight. Next Mater. 2025, 8, 100527. [Google Scholar] [CrossRef]
  11. Zhou, J.; Booker, C.; Li, R.; Zhou, X.; Sham, T.-K.; Sun, X.; Ding, Z. An Electrochemical Avenue to Blue Luminescent Nanocrystals from Multiwalled Carbon Nanotubes (MWCNTs). J. Am. Chem. Soc. 2007, 129, 744–745. [Google Scholar] [CrossRef] [PubMed]
  12. Liu, J.; Li, R.; Yang, B. Carbon Dots: A New Type of Carbon-Based Nanomaterial with Wide Applications. ACS Central Sci. 2020, 6, 2179–2195. [Google Scholar] [CrossRef]
  13. Juang, R.-S.; Fu, C.-C.; Hsieh, C.-T.; Gu, S.; Gandomi, Y.A.; Liu, S.-H. Highly luminescent aggregate-induced emission from polyethylene glycol-coated carbon quantum dot clusters under blue light illumination. J. Mater. Chem. C 2020, 8, 16569–16576. [Google Scholar] [CrossRef]
  14. Jiang, K.; Sun, S.; Zhang, L.; Lu, Y.; Lin, H. Red, Green, and Blue Luminescence by Carbon Dots: Full-Color Emission Tuning and Multicolor Cellular Imaging. Angew. Chem. Int. Ed. Engl. 2015, 54, 5360–5363. [Google Scholar] [CrossRef]
  15. Ou, S.-F.; Zheng, Y.-Y.; Lee, S.-J.; Chen, S.-T.; Wu, C.-H.; Hsieh, C.-T.; Juang, R.-S.; Peng, P.-Z.; Hsueh, Y.-H. N-Doped Carbon Quantum Dots as Fluorescent Bioimaging Agents. Crystals 2021, 11, 789. [Google Scholar] [CrossRef]
  16. Yang, S.-T.; Wang, X.; Wang, H.; Lu, F.; Luo, P.G.; Cao, L.; Sun, Y.P. Carbon Dots as Nontoxic and High-Performance Fluorescence Imaging Agents. J. Phys. Chem. C 2009, 113, 18110–18114. [Google Scholar] [CrossRef]
  17. Gu, S.; Hsieh, C.-T.; Gandomi, Y.A.; Chang, J.-K.; Li, J.; Li, J.; Zhang, H.; Guo, Q.; Lau, K.C.; Pandey, R. Microwave growth and tunable photoluminescence of nitrogen-doped graphene and carbon nitride quantum dots. J. Mater. Chem. C 2019, 7, 5468–5476. [Google Scholar] [CrossRef]
  18. Ferrari, A.C.; Robertson, J. Interpretation of Raman spectra of disordered and amorphous carbon. Phys. Rev. B 2000, 61, 14095–14107. [Google Scholar] [CrossRef]
  19. Hsieh, C.-T.; Lee, C.-E.; Chen, Y.-F.; Chang, J.-K.; Teng, H.-S. Thermal conductivity from hierarchical heat sinks using carbon nanotubes and graphene nanosheets. Nanoscale 2015, 7, 18663–18670. [Google Scholar] [CrossRef] [PubMed]
  20. Peng, Z.; Ji, C.; Zhou, Y.; Zhao, T.; Leblanc, R.M. Polyethylene glycol (PEG) derived carbon dots: Preparation and applications. Appl. Mater. Today 2020, 20, 100677. [Google Scholar] [CrossRef]
  21. Lou, Y.; Ji, J.; Qin, A.; Liao, L.; Li, Z.; Chen, S.; Zhang, K.; Ou, J. Cane Molasses Graphene Quantum Dots Passivated by PEG Functionalization for Detection of Metal Ions. ACS Omega 2020, 5, 6763–6772. [Google Scholar] [CrossRef]
  22. Chua, C.K.; Sofer, Z.; Luxa, J.; Pumera, M. Selective Nitrogen Functionalization of Graphene by Bucherer-Type Reaction. Chem.–A Eur. J. 2015, 21, 8090–8095. [Google Scholar] [CrossRef] [PubMed]
  23. Chen, C.-M.; Zhang, Q.; Zhao, X.-C.; Zhang, B.; Kong, Q.-Q.; Yang, M.-G.; Yang, Q.-H.; Wang, M.-Z.; Yang, Y.-G.; Schlögl, R.; et al. Hierarchically aminated graphene honeycombs for electrochemical capacitive energy storage. J. Mater. Chem. 2012, 22, 14076–14084. [Google Scholar] [CrossRef]
  24. Zhu, S.; Zhang, J.; Tang, S.; Qiao, C.; Wang, L.; Wang, H.; Yang, B. Surface Chemistry Routes to Modulate the Photoluminescence of Graphene Quantum Dots: From Fluorescence Mechanism to Up-Conversion Bioimaging Applications. Adv. Funct. Mater. 2012, 22, 4732–4740. [Google Scholar] [CrossRef]
  25. Tang, L.; Ji, R.; Li, X.; Teng, K.S.; Lau, S.P.; Shih, C.K. Deep Ultraviolet to Near-Infrared Emission and Photoresponse in Layered N-Doped Graphene Quantum Dots. ACS Nano 2014, 8, 6312–6320. [Google Scholar] [CrossRef] [PubMed]
  26. Kim, H.J.; Lee, C.K.; Seo, J.G.; Hong, S.J.; Song, G.; Lee, J.; Ahn, C.; Lee, D.J.; Song, S.H. Highly luminescent polyethylene glycol-passivated graphene quantum dots for light emitting diodes. RSC Adv. 2020, 10, 27418–27423. [Google Scholar] [CrossRef]
  27. Mei, J.; Leung, N.L.C.; Kwok, R.T.K.; Lam, J.W.Y.; Tang, B.Z. Aggregation-Induced Emission: Together We Shine, United We Soar! Chem. Rev. 2015, 115, 11718–11940. [Google Scholar] [CrossRef]
  28. Hao, Y.; Gan, Z.; Xu, J.; Wu, X.; Chu, P.K. Poly(ethylene glycol)/carbon quantum dot composite solid films exhibiting intense and tunable blue–red emission. Appl. Surf. Sci. 2014, 311, 490–497. [Google Scholar] [CrossRef]
  29. Lakowicz, J.R. Principles of Fluorescence Spectroscopy, 3rd ed.; Springer: Berlin/Heidelberg, Germany, 2006. [Google Scholar] [CrossRef]
  30. Gu, S.; Hsieh, C.-T.; Yuan, C.-Y.; Gandomi, Y.A.; Chang, J.-K.; Fu, C.-C.; Yang, J.-W.; Juang, R.-S. Fluorescence of functionalized graphene quantum dots prepared from infrared-assisted pyrolysis of citric acid and urea. J. Lumin. 2020, 217, 116774. [Google Scholar] [CrossRef]
  31. Rathee, G.; Puertas-Segura, A.; Blair, J.; Rathee, J.; Tzanov, T. Quantum dots@layered double hydroxides: Emerging nanocomposites for multifaceted applications. Prog. Mater. Sci. 2025, 150, 101403. [Google Scholar] [CrossRef]
  32. Park, H.; Lee, S.H. Review on Interfacial Bonding Mechanism of Functional Polymer Coating on Glass in Atomistic Modeling Perspective. Polymers 2021, 13, 2244. [Google Scholar] [CrossRef]
  33. Kalluri, A.; Dharmadhikari, B.; Debnath, D.; Patra, P.; Kumar, C.V. Advances in Structural Modifications and Properties of Graphene Quantum Dots for Biomedical Applications. ACS Omega 2023, 8, 21358–21376. [Google Scholar] [CrossRef] [PubMed]
  34. Younis, M.R.; He, G.; Lin, J.; Huang, P. Recent Advances on Graphene Quantum Dots for Bioimaging Applications. Front. Chem. 2020, 8, 424. [Google Scholar] [CrossRef] [PubMed]
  35. Novoselov, K.S.; Fal′Ko, V.I.; Colombo, L.; Gellert, P.R.; Schwab, M.G.; Kim, K. A roadmap for graphene. Nature 2012, 490, 192–200. [Google Scholar] [CrossRef] [PubMed]
  36. Marconcini, P.; Macucci, M. Transport Simulation of Graphene Devices with a Generic Potential in the Presence of an Orthogonal Magnetic Field. Nanomaterials 2022, 12, 1087. [Google Scholar] [CrossRef]
Scheme 1. The qualitative sketch for engineering the functionalized GQD samples in this study.
Inventions 10 00081 sch001
Figure 1. TEM images of (a) GQD-PEG1, (b) GQD-PEG2, (c) GQD-PEG3, and (d) GQD-PEG4 samples.
Inventions 10 00081 g001
Figure 2. (a) Raman spectra of different GQD-PEG powders and high-resolution XPS spectra of GQD-PEG4 sample: (b) C1s and (c) N1s, deconvoluted by a multiple Gaussian function.
Inventions 10 00081 g002
Figure 3. (a) PL emission spectra of different GQD suspensions excited at 450 nm, and (b) PL emission spectra of GQD-PEG4 with different precursor recipes excited at 450 nm. The inset of (b) shows the photograph of GQD-PEG4 suspension under blue light illumination, displaying a stable red fluorescence.
Inventions 10 00081 g003
Figure 4. PL emission spectra of GQD-PEG4 suspensions in different solvents excited at 450 nm. The photographs of the GQD suspensions in IBOA, THFA, and PGMEA solvents, emitting various fluorescence.
Inventions 10 00081 g004
Figure 5. (a) TEM micrograph and (b) Raman spectrum of GQD-NaOH sample. The inset of (a) shows the photograph of GQD-NaOH suspension excited at 450 nm.
Inventions 10 00081 g005
Figure 6. Photographs of GQD-PEG thin film under (a) sunlight and (b) blue-light illumination. Photographs of GQD-NaOH thin film under (c) sunlight and (d) blue-light illumination.
Inventions 10 00081 g006
Figure 7. PL emission spectra of (a) GQD-PEG and (b) GQD-NaOH thin films excited at 450 nm. The thin films were immersed in distilled water for 25, 50, and 75 h and then dried at 80 °C.
Inventions 10 00081 g007
Figure 8. Photographs of cell bioimaging using GQD-PEG4 samples with different doses: (ac) 75 mg/L and (df) 100 mg/L.
Inventions 10 00081 g008
Figure 9. Photographs of cell bioimaging using GQD-NaOH samples with different doses: (ac) 75 mg/L and (df) 100 mg/L.
Inventions 10 00081 g009
Disclaimer/Publisher’s Note: The statements, opinions and data contained in all publications are solely those of the individual author(s) and contributor(s) and not of MDPI and/or the editor(s). MDPI and/or the editor(s) disclaim responsibility for any injury to people or property resulting from any ideas, methods, instructions or products referred to in the content.