Article

Throwing Angle Estimation of a Wire Installation Device with Robotic Arm Using a 3D Model of a Spear

Department of Mechanical Engineering, Graduate School of Engineering, Osaka Metropolitan University, Osaka 599-8531, Japan
*
Author to whom correspondence should be addressed.
Inventions 2025, 10(5), 73; https://doi.org/10.3390/inventions10050073
Submission received: 1 July 2025 / Revised: 10 August 2025 / Accepted: 19 August 2025 / Published: 22 August 2025
(This article belongs to the Section Inventions and Innovation in Advanced Manufacturing)

Abstract

In recent years, the deterioration of social infrastructure such as bridges has become a serious issue in many countries around the world. To maintain the functionality of aging bridges over the long term, it is necessary to conduct regular inspections, detect damage at an early stage, and perform timely repairs. However, inspections require significant cost and time, and ensuring the safety of inspectors remains a major challenge. As a result, inspection using robots has attracted increasing attention. This study focuses on a wire-driven bridge inspection robot designed to inspect the underside of bridge girders. To use this robot, wires must be installed in the space beneath the girders. However, it is difficult to install wires over areas such as rivers. To address this problem, we developed a robotic arm capable of throwing a spear attached to a string. In order to throw the spear accurately to the target location, a three-dimensional dynamic model of the spear in flight was constructed, considering the tension of the string. Using this model, we accurately estimated the required throwing conditions and confirmed that the robotic arm could successfully throw the spear to the target location.

1. Introduction

In recent years, the deterioration of social infrastructure, including bridges, has become a significant issue around the world, with reported incidents of damage and collapse [1]. Many developed nations constructed a large number of bridges during periods of rapid economic growth, and these structures are now aging. Japan, for instance, intensively built many bridges from the 1950s to the 1970s. As a result, bridge deterioration is progressing, and countermeasures such as maintenance and renewal are required. However, rebuilding bridges involves large-scale work and substantial costs, making it unrealistic. Therefore, the Japanese government has mandated regular inspections every five years. By performing preventive maintenance on damaged areas, the government aims to preserve and continue using existing bridges over the long term [2]. Currently, for these periodic inspections, inspectors rely on scaffolding or special crane vehicles. However, these methods require significant time and cost, and pose challenges such as ensuring the safety of inspectors working in hazardous locations. To address these issues, the introduction of inspection robots is attracting attention.
In recent years, various bridge inspection robots have been developed, including suction-based robots [3,4,5,6,7,8], flying robots [9,10,11,12,13,14,15,16], and wire-driven robots [17]. Among these, the author focused on wire-driven robots.
Wire-driven robots operate by attaching a winch to the bridge structure and using wires installed beneath the bridge to move and conduct inspections. Compared to flying or suction-based robots, they have a lower risk of falling and can move stably. Additionally, depending on the suspension method, various inspection techniques can be applied, allowing inspections to be conducted on a wide range of bridges, including concrete and steel bridges, regardless of material. However, using these robots presents wire installation challenges. If people can access under the bridge, manual wire installation is possible. However, when a bridge is located over a road or river, it becomes difficult for workers to set up the wires.
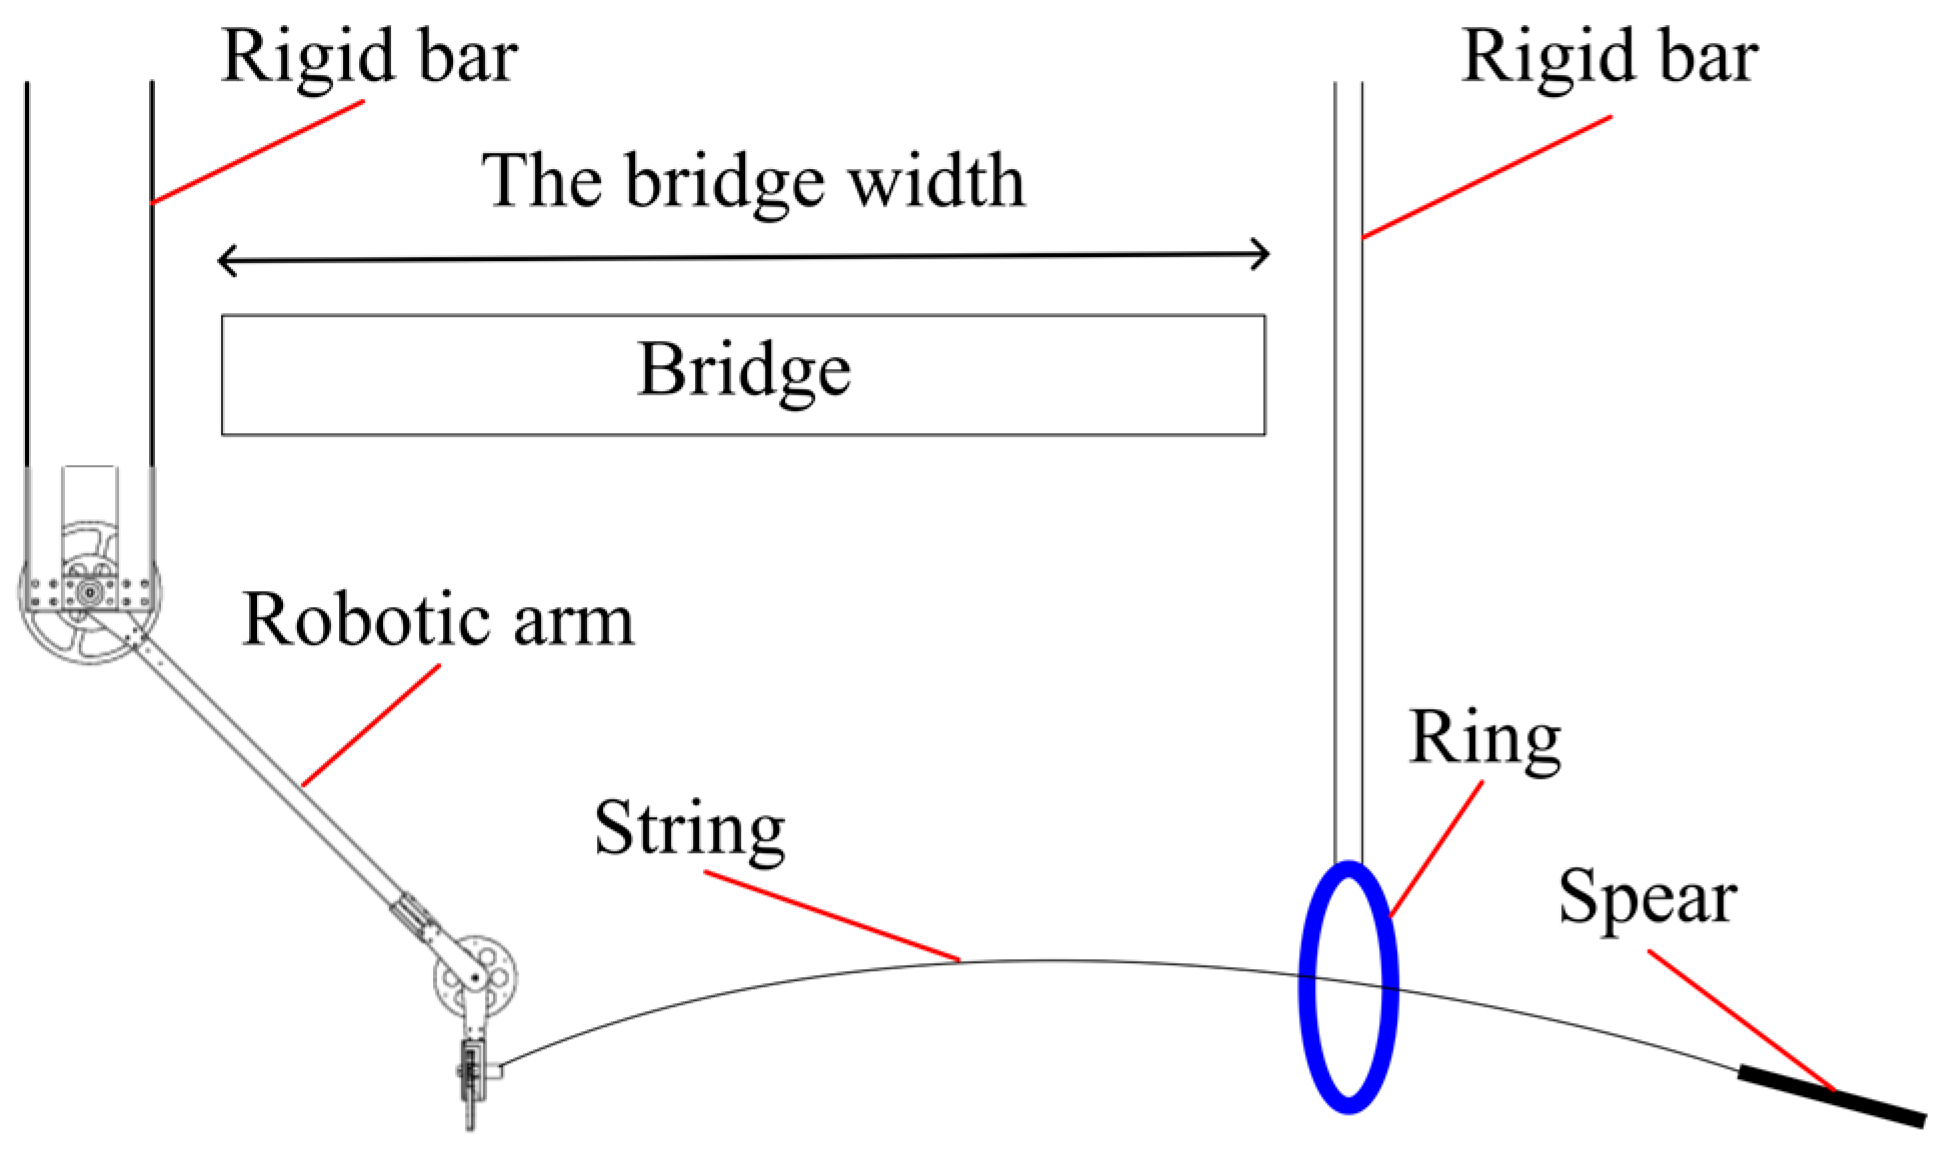
Therefore, this study aims to install wires beneath bridge girders using a wire installation device. With the goal of wire installation, Ishida et al. developed a slingshot system [18], while Ohara et al. proposed a spring-type shooting device [19]. However, these devices lack the capability to adjust the shooting velocity arbitrarily. Since the width of actual bridges varies, it is desirable to adjust the shooting velocity according to the distance to the ring in order to suppress excessive shooting force. Accordingly, a spear-throwing approach utilizing a robotic arm is proposed in this study. The use of a robotic arm enables arbitrary adjustment of the shooting velocity, making it possible to adapt to varying bridges. The outline of the wire installation method is shown in Figure 1, where a robotic arm-type wire installation device, attached to a rigid rod, is lowered from one side of the bridge. Next, a ring is placed on the opposite side beneath the girder. A spear with a string attached is then thrown toward the ring, passing through it. Afterward, the ring is retrieved along with the spear and string. The wire is then attached to the retrieved spear. Finally, by pulling the string from the device side, the wire is installed beneath the girder. For explanatory purposes, the sizes in Figure 1 do not reflect actual proportions.
A variety of studies have been carried out on the throwing of objects and robotic end effectors. Okada et al. [20] investigated the manipulation of objects beyond the operational range of a robotic arm by throwing them from an arm mounted on the ground. In this case, the thrown object is not equipped with a thread. Additionally, Arisumi et al. [21] and Adriano et al. [22] proposed a method known as casting manipulation, in which an end effector tethered with a thread is thrown to expand the manipulable workspace. As shown in Table 1, while these studies analyze the landing position of the thrown end effector considering the frictional force of the string, they do not take into account the air resistance acting on either the end effector or the string. However, since the object thrown by the wire installation device is lightweight, the effect of air resistance is significant and cannot be neglected. Therefore, in this study, a three-dimensional dynamic model considering air resistance acting on both the thrown spear and the string was constructed. After validating the model under conditions with varying shooting velocities, trajectory analysis was performed. Furthermore, the initial conditions such as the throwing angle and velocity, obtained from the analysis results, are input into the device to throw the spear, and the successful passage of the spear through the ring is experimentally verified.

2. Materials and Methods

2.1. Overview of the Device

2.1.1. Overview of the Wire Installation Device with Robotic Arm

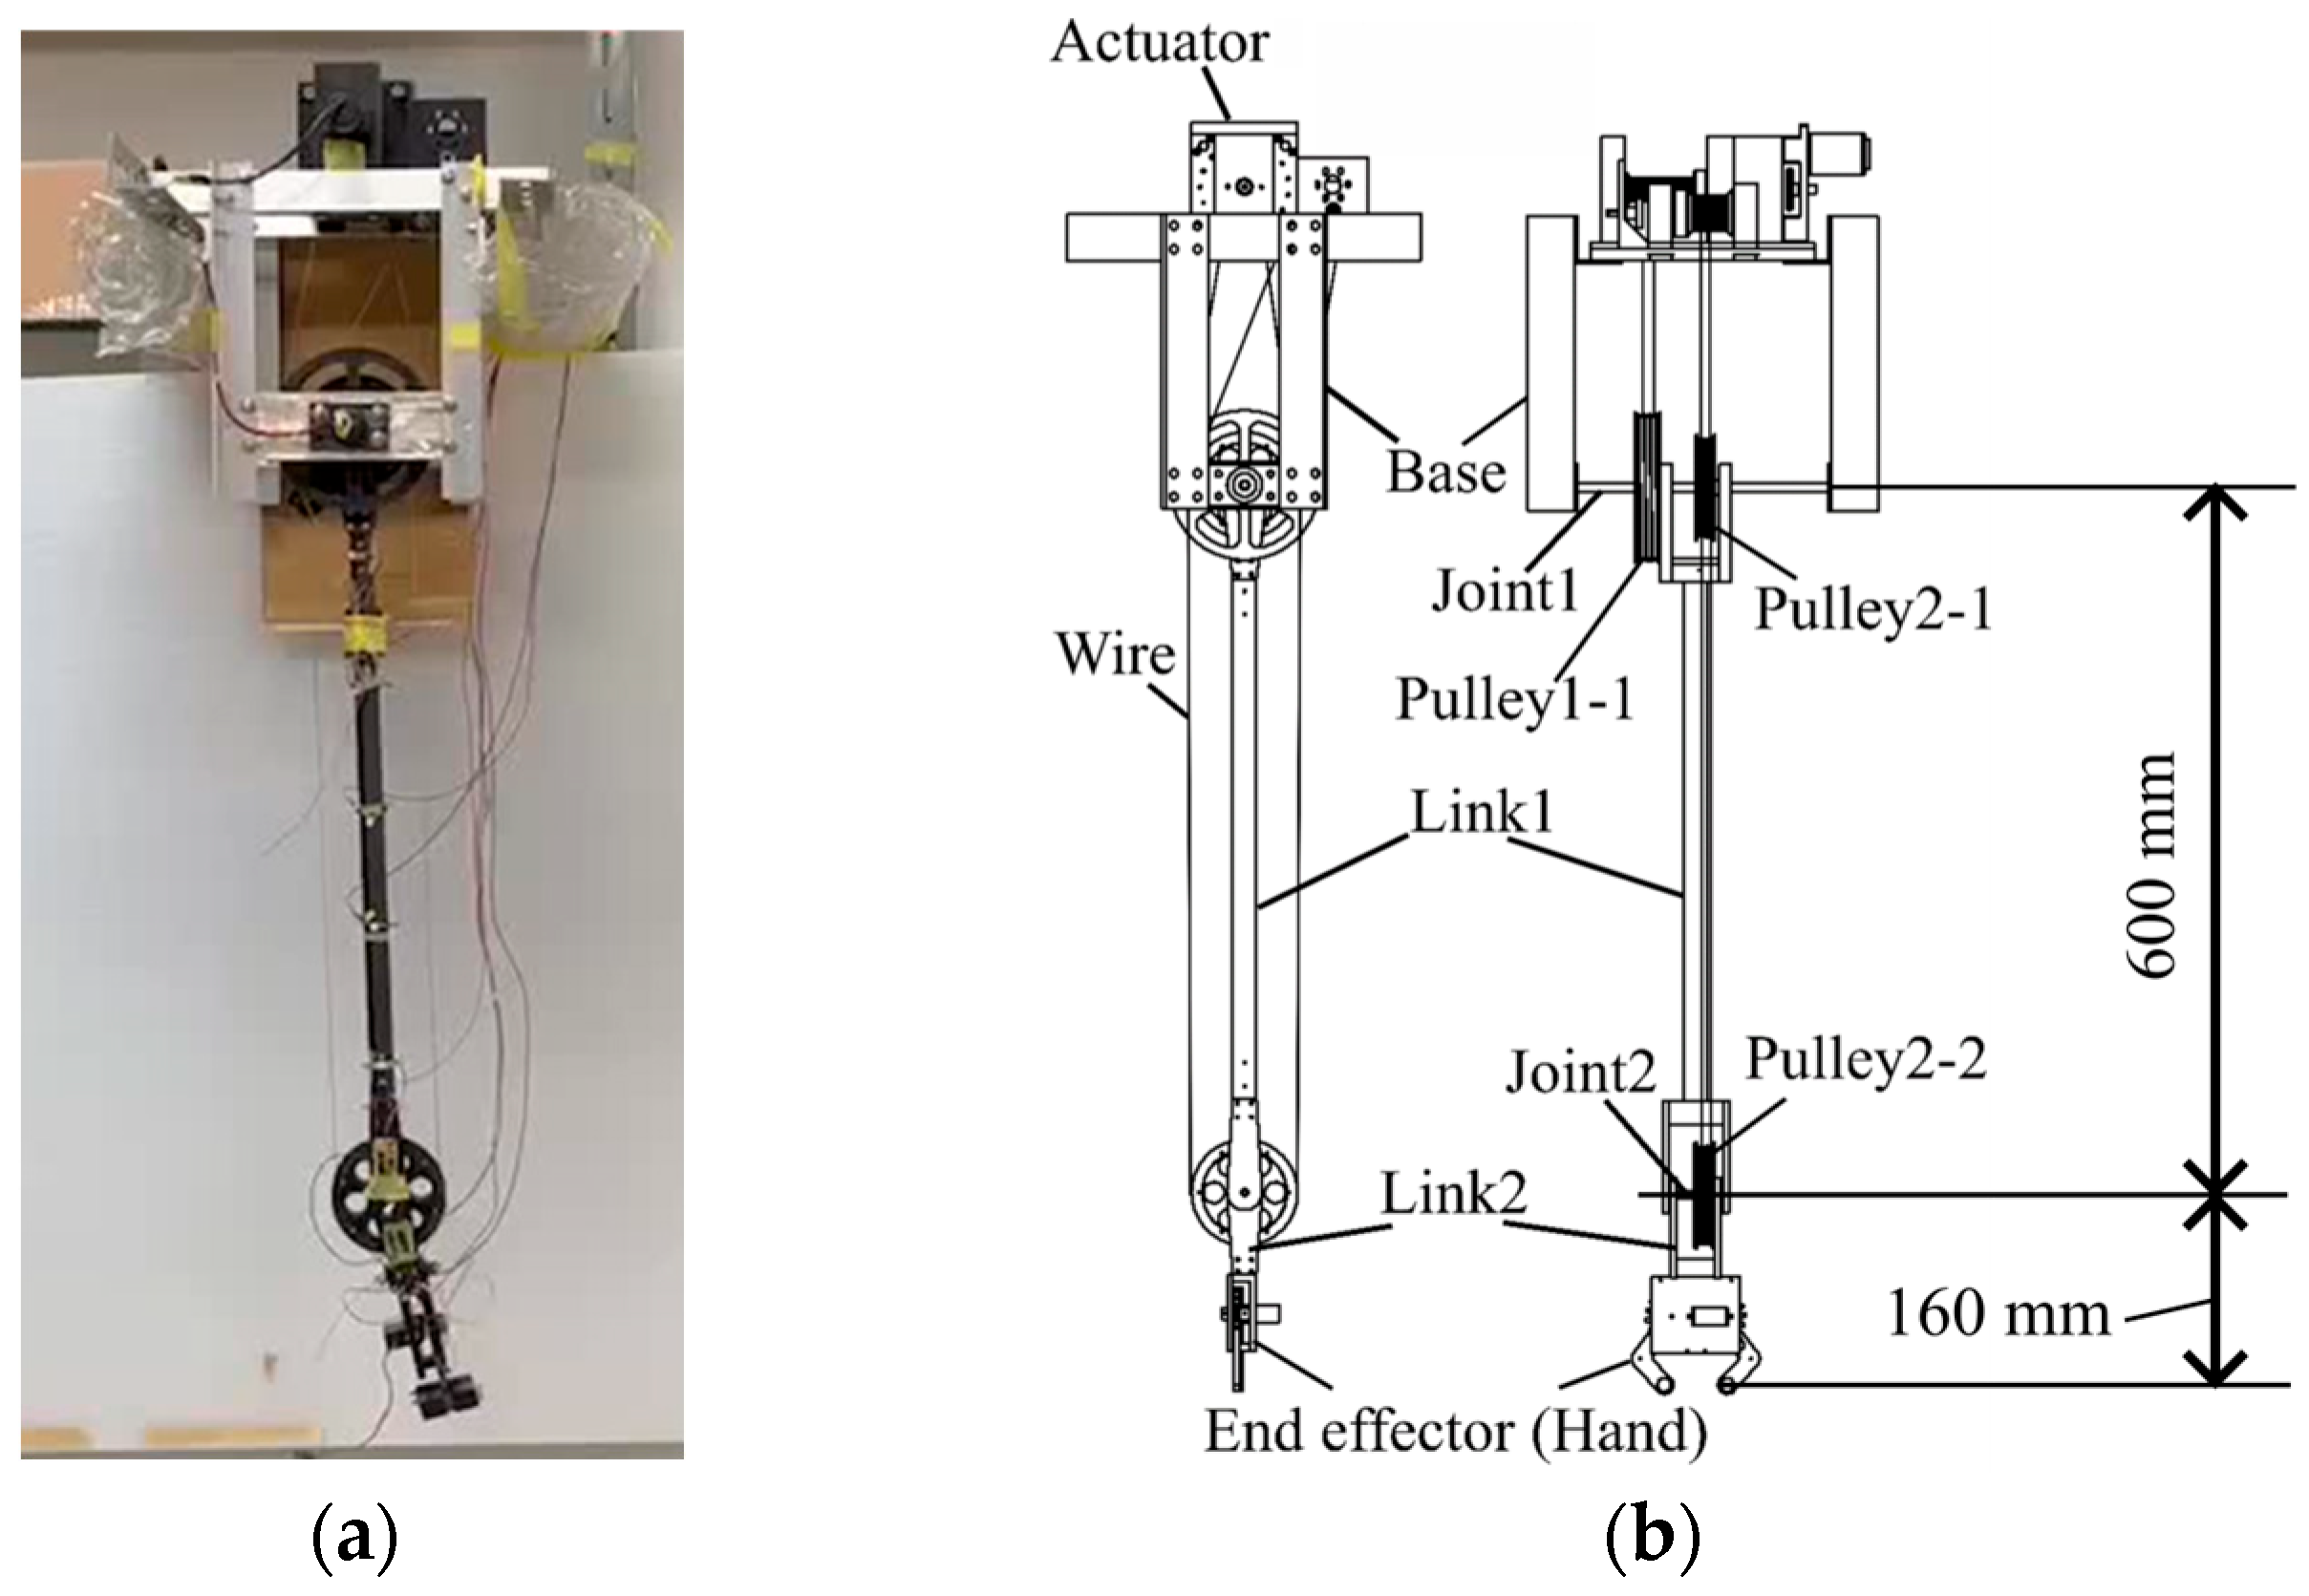
In this study, as shown in Figure 2, a two-link, one-degree-of-freedom robotic arm, which moves on a vertical two-dimensional plane, is used to throw a spear. The arm’s movement is powered by a brushless DC motor (RS Pro Brushless DC Motor, RS Stock No: 892-8767, by RS Group PLC, London, UK) and a motor controller (EM-206 by ELECTROMEN Oy Ltd., Turku, Finland). A micro servo motor (MICRO2BBMG by Grand Wing Servo-tech Co., Ltd., Shijr City, Taiwan) is mounted on the end effector. The servo motor synchronizes the two links, allowing them to open. The spear is grasped by the end effector, and by opening it at the appropriate time, the spear is thrown.

2.1.2. The Spear and String Description

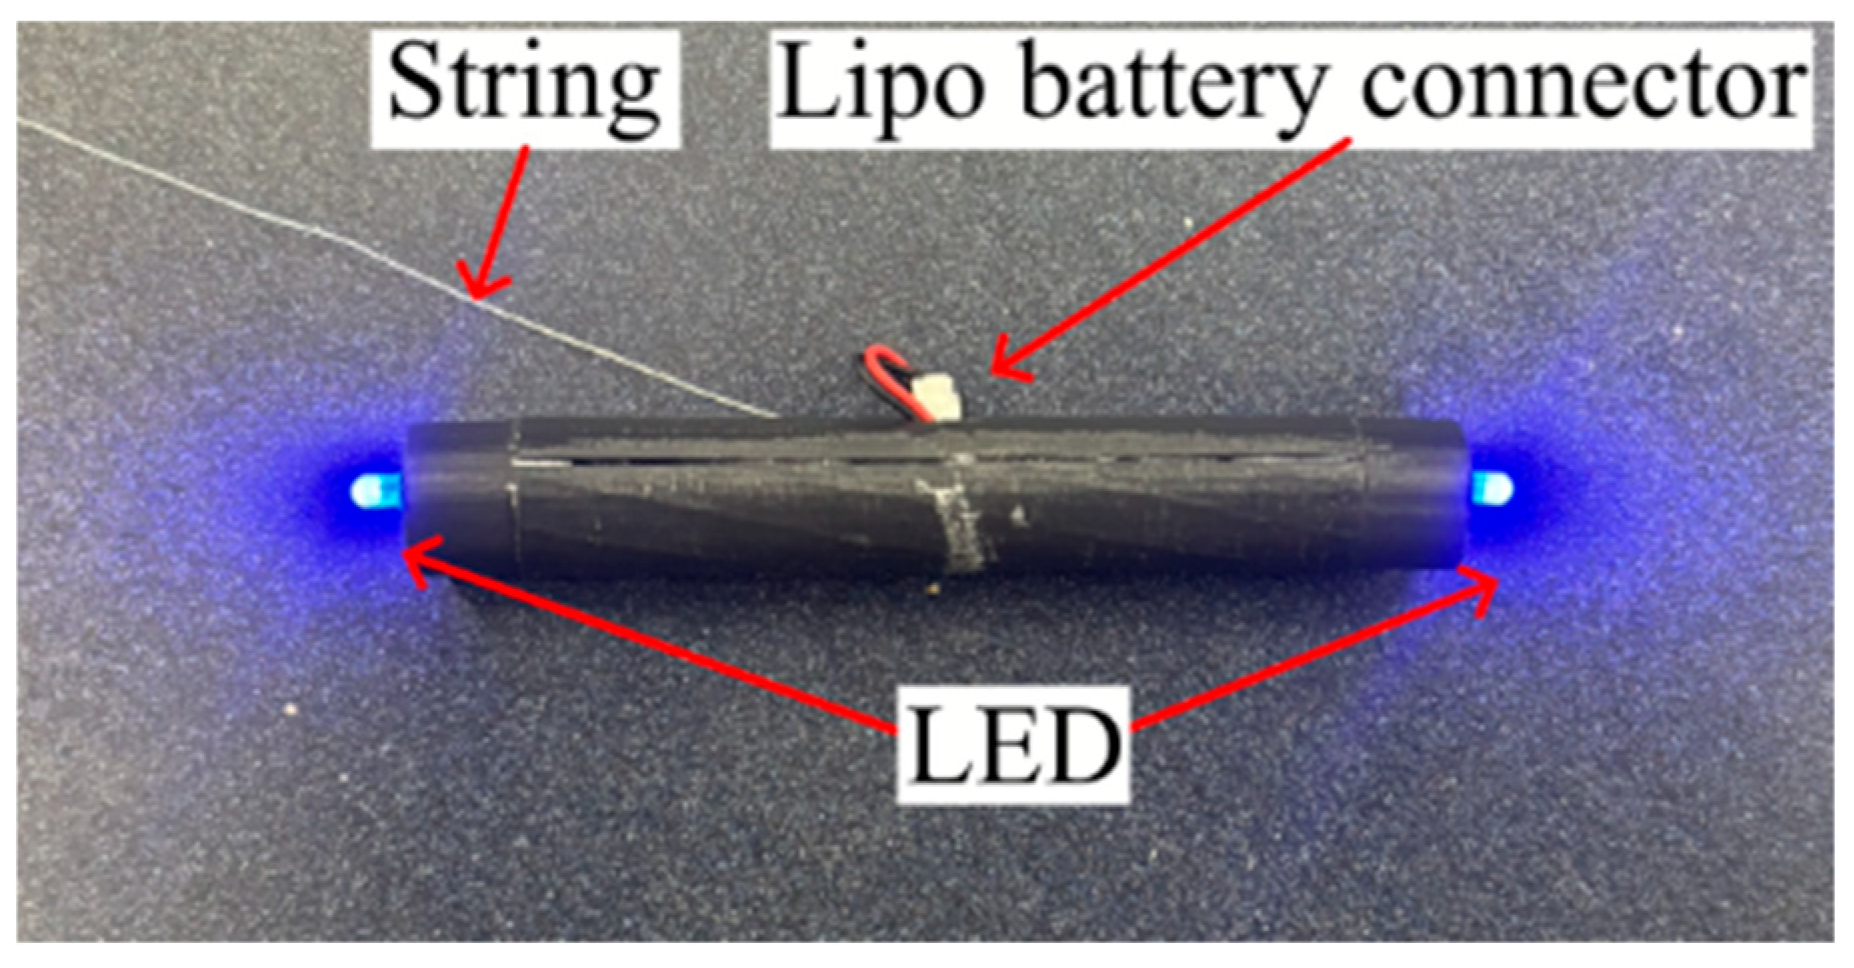
The spear and string used for throwing with the robotic arm are illustrated in Figure 3. The spear is cylindrical, with a length of 100 mm, an outer diameter of 15 mm, and a mass of 12.07 g. It was fabricated using a 3D printer. Moreover, to enable trajectory capture by a camera, LEDs were attached to both ends of the spear. Additionally, the string is attached to the rear end of the spear and is made of 100% cotton thread with a yarn count of 60.

2.2. Studying the Dynamic Model of the Spear

In this section, a dynamic model of the spear thrown by the device is developed. Note that a string is attached to this spear. The spear is applied gravitational force, aerodynamic drag, and the tension of the string. The tension force consists of the extraction force, the gravitational force acting on the string, and its aerodynamic drag. The resulting forces and their corresponding moments are formulated using ordinary differential equations, and numerical solutions are obtained using the Runge–Kutta method. In this study, experiments are conducted in a windless environment to eliminate external factors, making it easier to examine the effects of strings and air resistance on the spear’s trajectory. Furthermore, the string is considered to be under constant tension and to remain a straight shape between the extraction point and the rear end of the spear.

2.2.1. Definition of Coordinate Systems and Postures

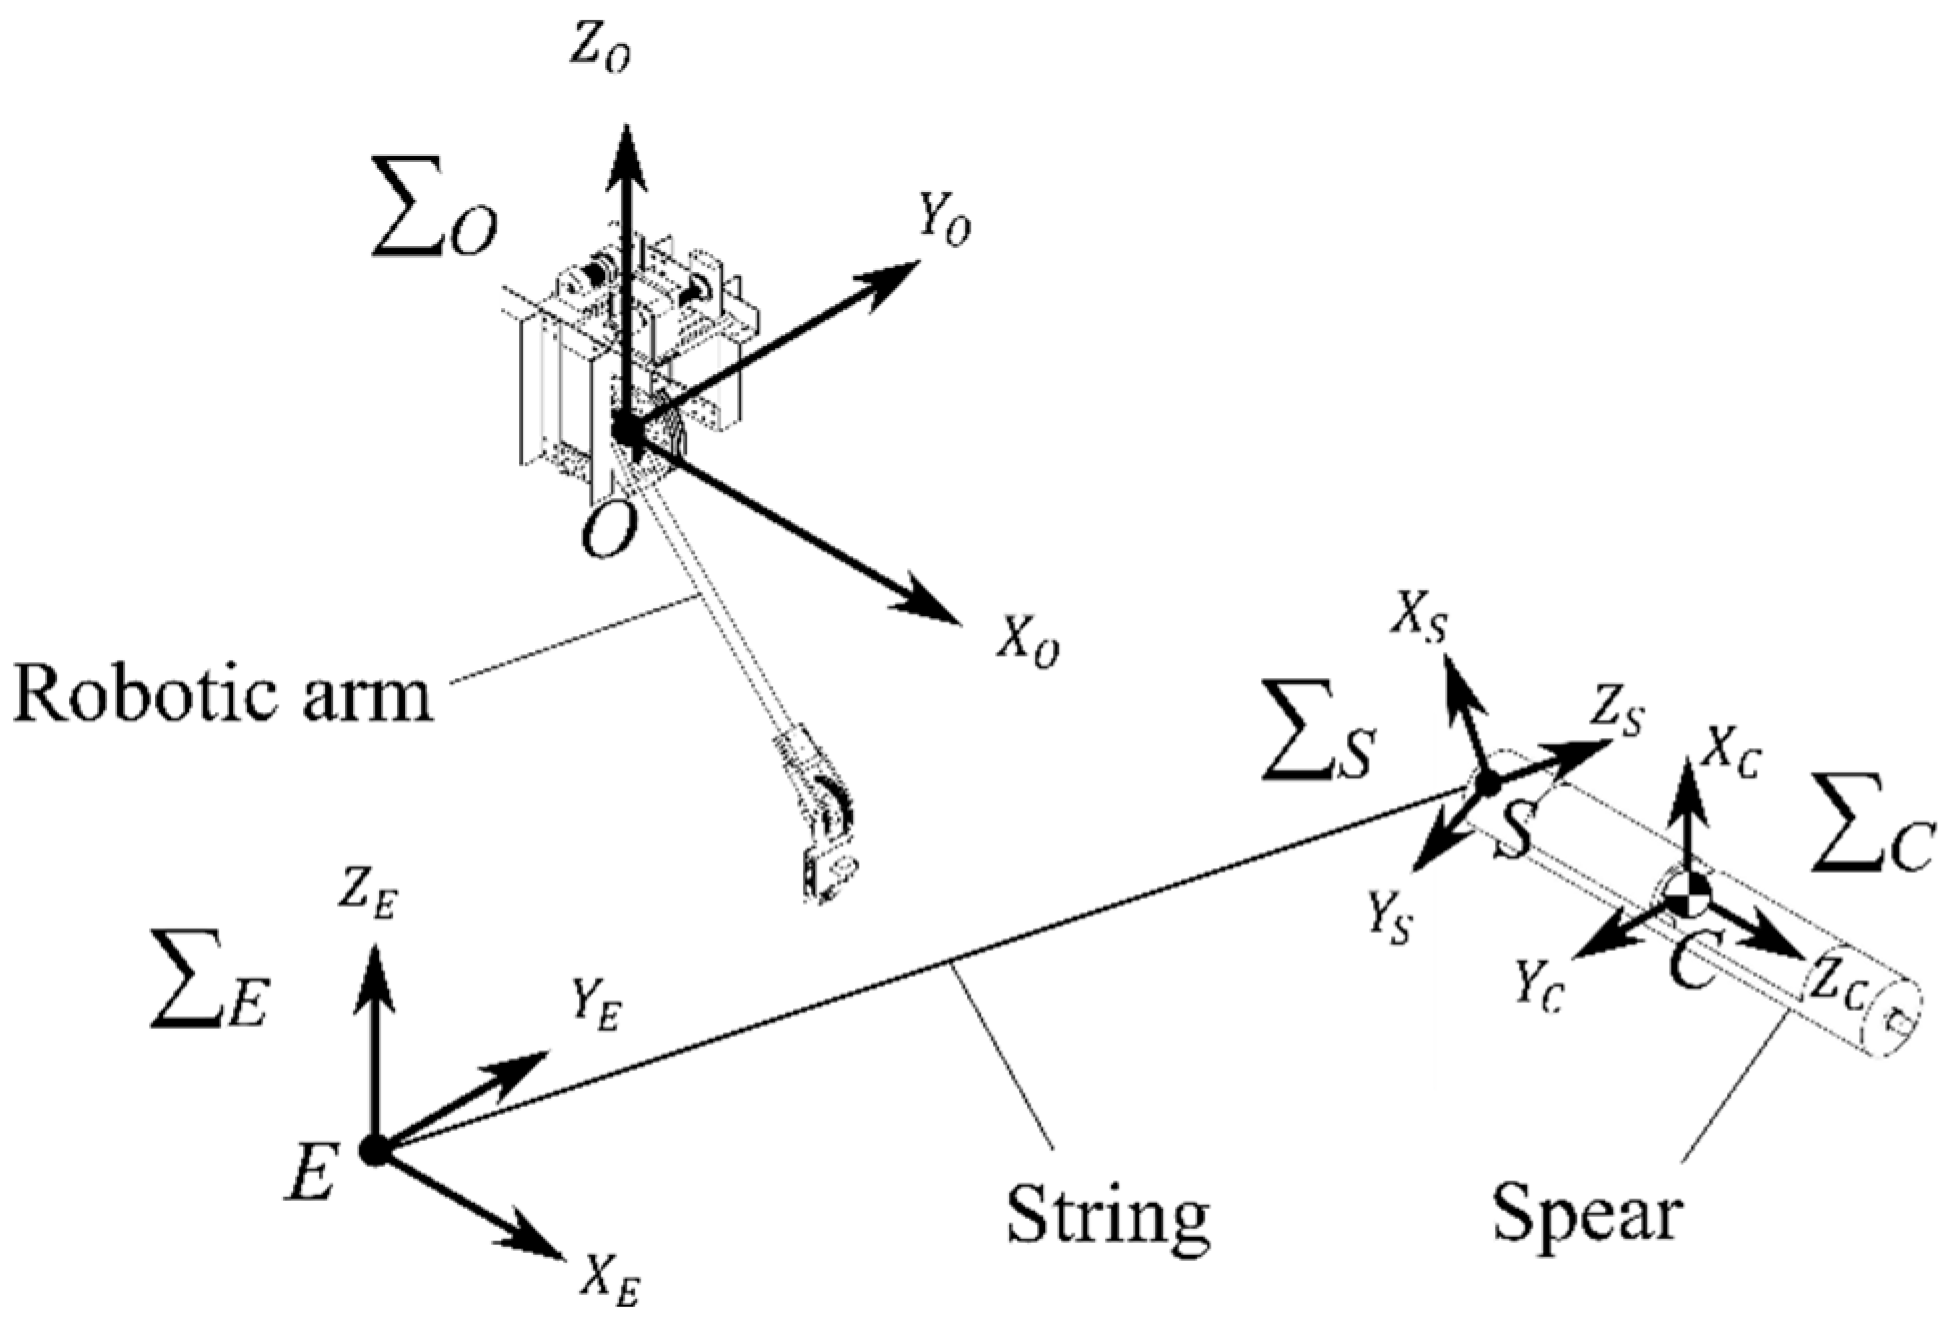
The coordinate systems for representing the position and orientation of the spear are illustrated in Figure 4. The global coordinate system, denoted as Σ O , is defined with the origin O at the first joint of the robot arm. The X O -axis is matched to the horizontal component of the spear’s direction of motion, and the Z O -axis is directed vertically upward.
A local coordinate system Σ C , fixed to the spear, is defined with the origin C at the center of mass of the spear, and the Z C -axis aligned with the spear’s axial direction. Another local coordinate system Σ S is fixed at the tip of the string, with its origin S at the connection point between the string and the spear. The Z S -axis is aligned with the axis of the string, and the X S -axis is defined as the component orthogonal to the Z O -axis within the plane containing the Z S -axis. Additionally, a coordinate system Σ E is defined with its origin E at the string’s extraction point.
In the initial state, the directions of the axes X O , Z C , Z S and X E are identical to each other, and likewise, the directions of the axes Z O , X C , X S and Z E are identical to each other.
The rotation of Σ C from its initial state is represented by the Z-Y-X Euler angles: α C = θ R C θ P C θ Y C T . Here, r B A = x B A y B A z B A T denotes the position vector of frame Σ B as seen from frame Σ A , R B A denotes the rotation matrix from frame Σ B to frame Σ A , and e X B A , e Y B A , e Z B A represent the unit vectors of the X, Y, and Z axes of frame Σ B as seen from frame Σ A .
The rotation matrices for each coordinate system are given by Equations (1)–(4). To make expressions easy to understand, we use shorthand notation such as sin θ R = S R and cos θ R = C R . Additionally, ‖∙‖ denotes the norm of a vector.
R C O = S P C C P C S Y C C P C C Y C S R C C P C S R C S P C S Y C C R C C Y C S R C S P C C Y C + C R C S Y C C R C C P C C R C S P C S Y C S R C C Y C C R C S P C C Y C + S R C S Y C
R S O = e X S O e Y S O e Z S O
e Z S O = r S E r S E ,   e X S O = e Z O O e Z O O · e Z S O e Z S O e Z O O e Z O O · e Z S O e Z S O ,   e Y S O = e Z S O × e X S O
R E O = 1 0 0 0 1 0 0 0 1

2.2.2. The Spear’s Equation of the Motion

The spear is regarded as a single rigid body. Therefore, the spear’s equations of the motion are formalized as below [23]:
m s p r ¨ C O + m s p g O = F C O
I sp O ω ˙ C O + ω C O × I sp O ω C O = M C O
where m s p , I s p , ω C O denote mass of the spear, moment of inertia of the spear and the angular velocity vector of Σ C observed from Σ O , respectively. And then, ω C O is expressed by Equation (7) using the transformation matrix K and the time derivative of the Euler angles α ˙ C .
ω C O = K α ˙ C = 1 0 S P C 0 C R C S R C C P C 0 S R C C R C C P C θ ˙ R C θ ˙ P C θ ˙ Y C  
Moreover, since the moment of inertia of the spear observed from Σ O , I sp O , varies depending on its attitude, it is transformed from the attitude-independent moment of inertia observed from I sp C , as shown in Equation (8).
I sp O = R C O I sp C R T C O
F C O and M C O represent the external force acting on the spear and the moment of its center of mass, respectively. These will be discussed in the next section and beyond.

2.2.3. The Impact of Air Resistance on the Spear

In this section, the aerodynamic drag acting on the spear is derived. In this study, the air resistance is calculated approximately using the slender-body theory [24]. The translational velocity of the spear’s center of gravity is denoted by r ˙ C O . As shown in Figure 5a, the spear is divided along its axis into n small segments, and we consider a segment C i   ( i = 1 , 2 , 3 , , n ) located at r C i C in frame Σ C . Because this small segment C i rotates about the center of mass C with angular velocity ω C O , the velocity of the segment as seen from frame Σ O is given by Equation (9).
r ˙ C i O = r ˙ C O + ω C O × R C O r C i C
Therefore, as seen from frame Σ C , a relative airflow with velocity u C i C = R T C O r ˙ C i O hits each small segment in the direction opposite to its motion. As illustrated in Figure 5b, this relative velocity u C i C is decomposed into an axial component u C i a x i a l C along the axis of the spear and a radial component u C i r a d i a l C perpendicular to it. The aerodynamic drag forces in the axial and radial directions, denoted by F s p   a x i a l C and F s p   a i r r a d i a l C , are obtained by Equations (10) and (11), and their resultant force is given by Equation (12). With regard to the axial direction, only the end faces at i = 1 or i = n , where the wind hits, are considered. ρ denotes the air density.
F s p   a i r a x i a l C = 1 2 ρ π d 2 4 C D s p   a x i a l u C i a x i a l C u C i a x i a l C   ( i = 1 , n )
F s p   a i r r a d i a l C = i = 1 n F s p   a i r r a d i a l i C = i = 1 n 1 2 ρ ξ d s p C D s p   r a d i a l u C i r a d i a l C u C i r a d i a l C
F s p   a i r C = F s p   a i r a x i a l C + F s p   a i r r a d i a l C
Additionally, the moment of force about the center of gravity due to air resistance is given by Equation (13).
M s p   a i r C = i = 1 n r C i C × F s p   a i r r a d i a l i C = i = 1 n r C i C × 1 2 ρ ξ d s p C D s p   r a d i a l u C i r a d i a l C u C i r a d i a l C

2.2.4. Effect of String on Spear Behavior

The string is subjected to gravitational force, aerodynamic drag, and extraction tension, which collectively affect the motion of the spear.
To begin with, as shown in Figure 6a, the aerodynamic drag acting on the string is derived. Similar to the spear, the string is divided into n small segments, and we consider a segment S i located at position r S i S from the connection point S with the spear. The position and velocity of this segment as seen from the global frame Σ O are expressed by Equations (14) and (15).
r S i O = r C O + R C O r S C + R S O r S i S
r ˙ S i O = r ˙ C O + ω C O × R C O r S C + R ˙ S O r S i S
Therefore, each small segment is subjected to an airflow with a relative velocity of u S i S = R T S O r ˙ S i O . This velocity u S i S is then decomposed into an axial component u S i a x i a l S along the string and a radial component u S i r a d i a l S perpendicular to it.
Following previous research, based on Kida’s study on the aerodynamic drag characteristics of cotton strings, the following relations (16) and (17) concerning the drag coefficients C D s t   a x i a l i ,   C D s t   r a d i a l i and the Reynolds numbers R e s t a x i a l i ,   R e s t a x i a l i were derived [25,26]. Here, d s t denotes the diameter of the string, and ν is the kinematic viscosity of air.
C D s t   a x i a l i = 14.84 R e s t a x i a l i 0.4295 = 14.84 d s t u S i a x i a l S ν 0.4295
C D s t   r a d i a l i = 2.074 R e s t a x i a l i 0.4989 = 2.074 d s t u S i r a d i a l S ν 0.4989
Therefore, the aerodynamic drag on the string is given by Equation (18) through (20).
F s t   a i r a x i a l S = i = 1 n F s t   a i r a x i a l i S = i = 1 n 1 2 ρ ξ d s t C D s t a x i a l u S i a x i a l S u S i a x i a l S
F s t   a i r r a d i a l S = i = 1 n F s t   a i r r a d i a l i S = i = 1 n 1 2 ρ ξ d s t C D s t r a d i a l u S i r a d i a l S u S i r a d i a l S
F s t   a i r S = F s t   a x i a l S + F s t   a i r r a d i a l S
Next, the extraction tension induced by the ejection conditions is calculated. According to the study by Dan et al., when an object with an attached string is ejected, an extraction tension proportional to the square of the extraction velocity arises along the axial direction of the string [27], as illustrated in Figure 6b and expressed by Equation (21). The extraction tension coefficient, k m , will be identified experimentally in the following chapter.
F e x t r a c t E = k m ( r ˙ S E · e Z S E ) e Z S E ( r ˙ S E · e Z S E ) e Z S E
The effect of gravity acting on the string is given by Equation (22).
F s t g S = ρ s t g r S E
Based on the above, the force and moment exerted by the string on the spear are given by Equations (23) and (24).
F s t C = R S C ( F s t   a i r S + F e x t r a c t S + F s t g S )
M s t C = r S C × F s t C

2.2.5. Concluding Remarks on the Spear’s Dynamic Model

From the above, the mechanical model of the spear becomes Equations (25) and (26).
m s p r ¨ C O + m s p g O = R C O ( F s p   a i r C + F s t C )
I s p O ω ˙ C O + ω C O × I s p O ω C O = R C O ( M s p   a i r C + M s t C )

2.2.6. Parameters

Table 2 summarizes the values of the parameters used in the simulation model.

2.3. Experimental Throwing of the Spear and Comparison with the Simulation Mode

2.3.1. Experimental Method

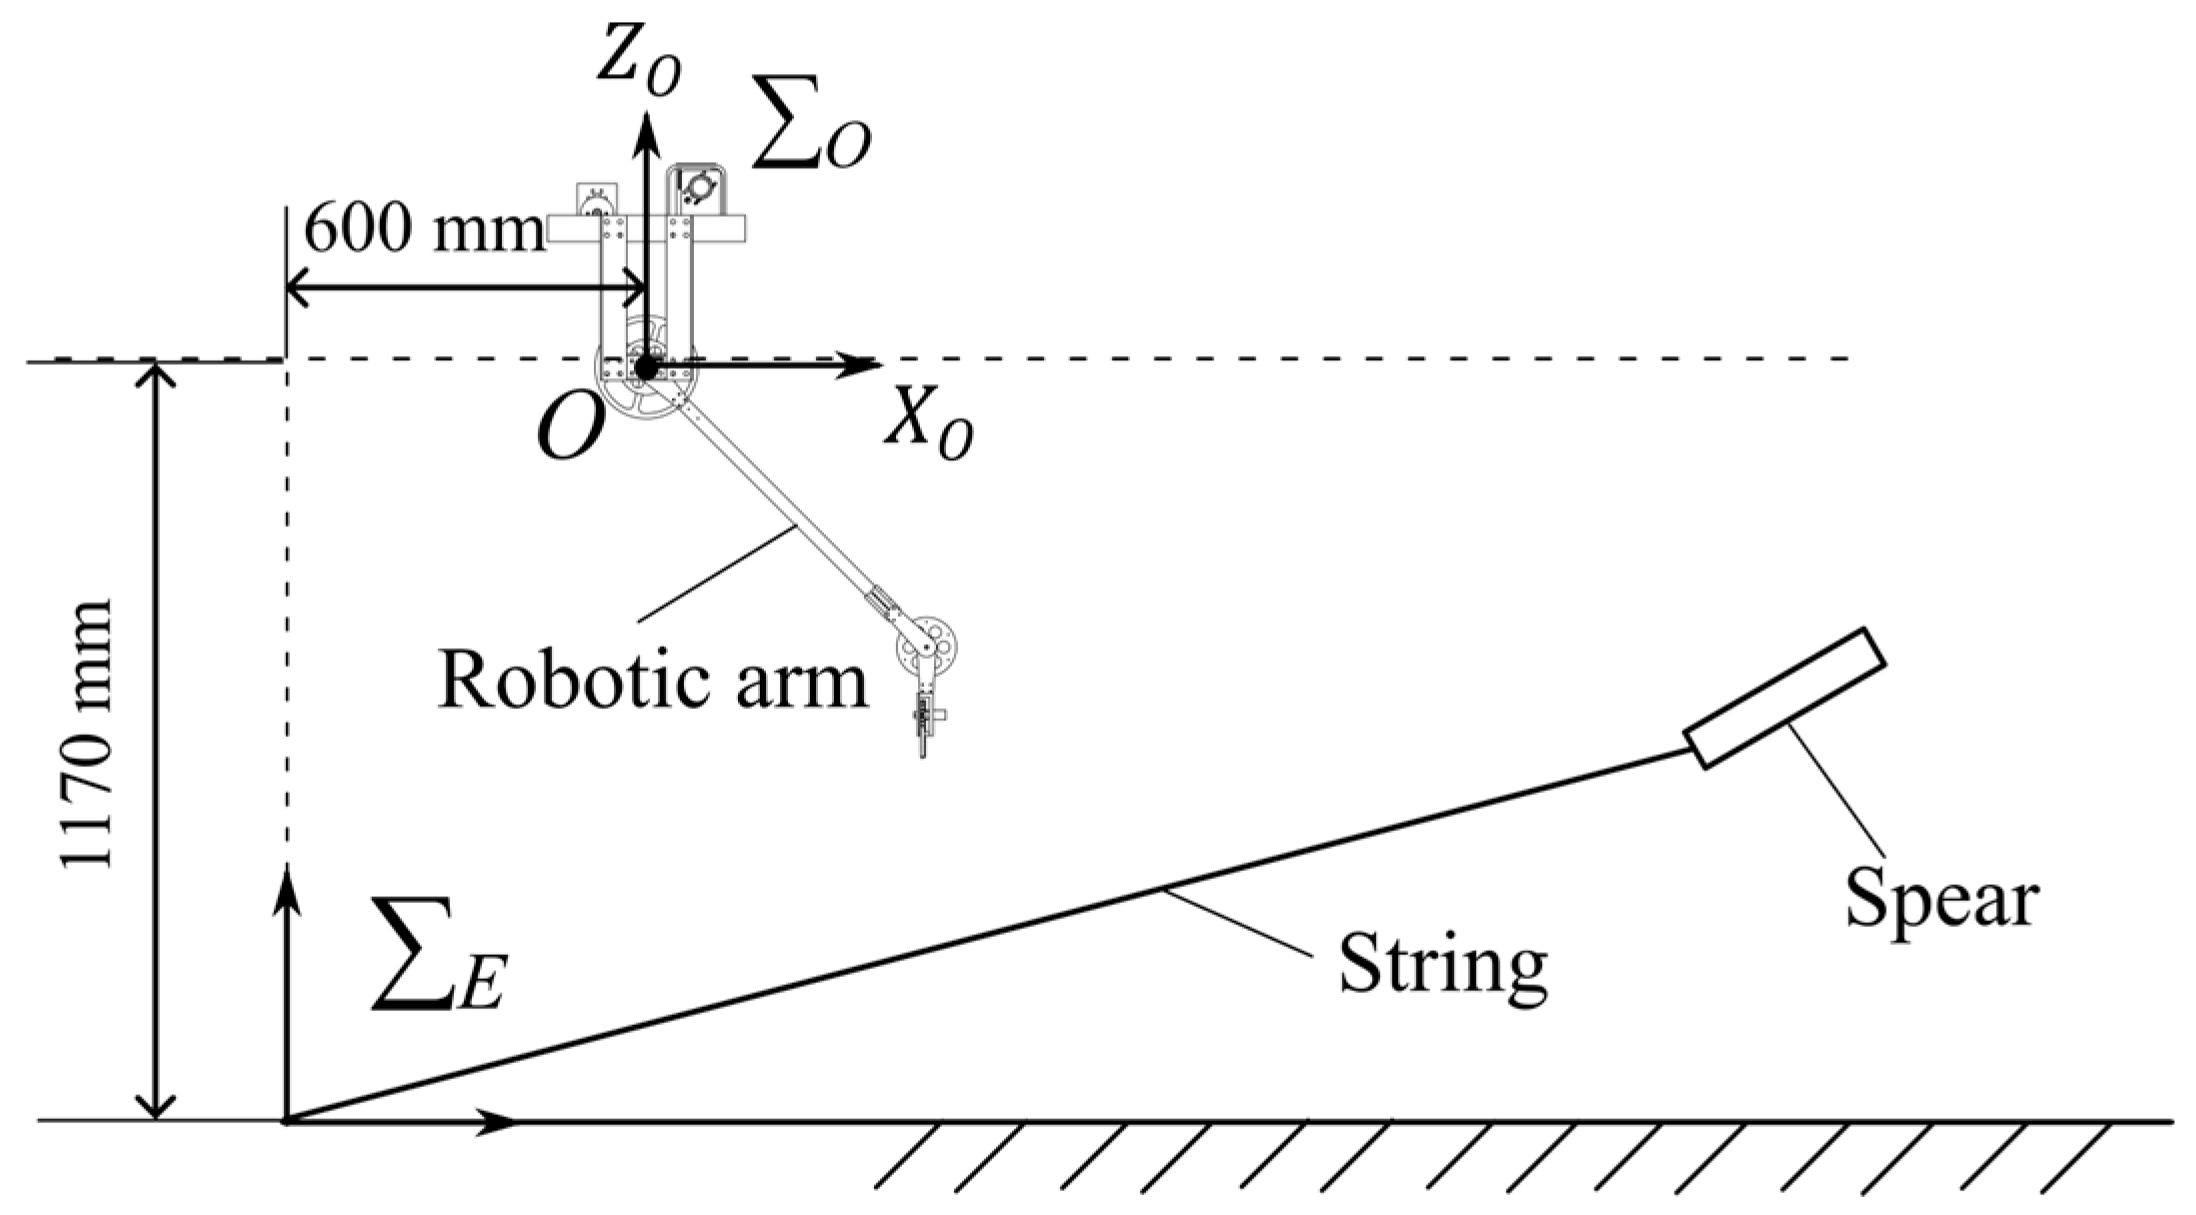
In this section, we conducted a spear throwing experiment and compared the spear’s trajectory with the simulation model. The experimental setup is shown in Figure 7. The robotic arm was installed such that its origin O was positioned 1170 mm above the ground, and the string extraction point E was fixed to the ground. The string was wound on a bobbin with a diameter of 33 mm and was allowed to be free extracted in the axial direction of the bobbin [28]. The axis of the bobbin is inclined at 37 degrees with respect to the X O -axis. The robotic arm first swung upward clockwise by 120 degrees from the vertically downward position to create an approach phase and then rotated counterclockwise to accelerate and throw the spear.
Next, the measurement methods used in the experiment are described. In the experiment, the moment when the robotic arm released the spear was recorded in monochrome at 500 fps using a high-speed camera (INFINICAM by Photron Limited, Tokyo, Japan). LEDs attached to both ends of the spear and to the robotic hand were detected and tracked as circles exceeding a given brightness and diameter threshold using OpenCV, an open-source computer vision library by Open Source Vision Foundation, Palo Alto, CA, USA. From this, the positions of the spear and robotic hand at each time step were calculated, and the initial conditions such as the throwing angle and angular velocity were determined. Additionally, the entire trajectory of the spear was recorded using a camera (Google Pixel 9 by Google LLC, Mountain View, CA, USA) operating at 240 frames per second. The recorded video was converted into a sequence of still images, and trajectory analysis was performed by applying multiple exposure composition every 30 frames.
The robotic arm was operated using PID control. The commanded throwing angles were set to 30, 40, 50, and 60 degrees, and the commanded throwing angular velocities were set to 500, 550, and 600 degrees/s. Throwing experiments were conducted 5 to 7 times for each of the 12 combinations.

2.3.2. Definition of Terms

The throwing angle is defined as the angle between the direction of motion of the robotic hand at the moment of release and the X O Y O plane of the coordinate system Σ O . It is equal to the angle between Link 1 and the Z O axis. The throwing angular velocity is the angular velocity of Link 1 at the moment of release. The shooting velocity and shooting angle are defined as the velocity of the spear’s center of mass and the angle between its direction of motion and the X O Y O plane at the moment of release. The posture angle is the angle between the axis of the spear and X O Y O plane. The posture angular velocity is the time derivative of the posture angle. Ideally, the robotic hand should open instantaneously at the moment of release. However, in reality, the gripping force gradually decreases, and the spear separates while sliding along the contact surface with the hand.

2.3.3. Experimental Results

Table 3 shows the mean values of the actual throwing angle, throwing angular velocity, shooting angle, shooting velocity, posture angle, posture angular velocity and horizontal reach measured for each target throwing angle, as well as the 95% confidence intervals assuming the measured values follow a normal distribution. A total of 72 experiments were conducted.
The variations in these values are considered to be caused by factors such as vibrations of the apparatus, differences in the tension of the wires, and errors in the spear’s coordinate values obtained from the high-speed camera.

2.3.4. Parameter Identification of Extraction Tension

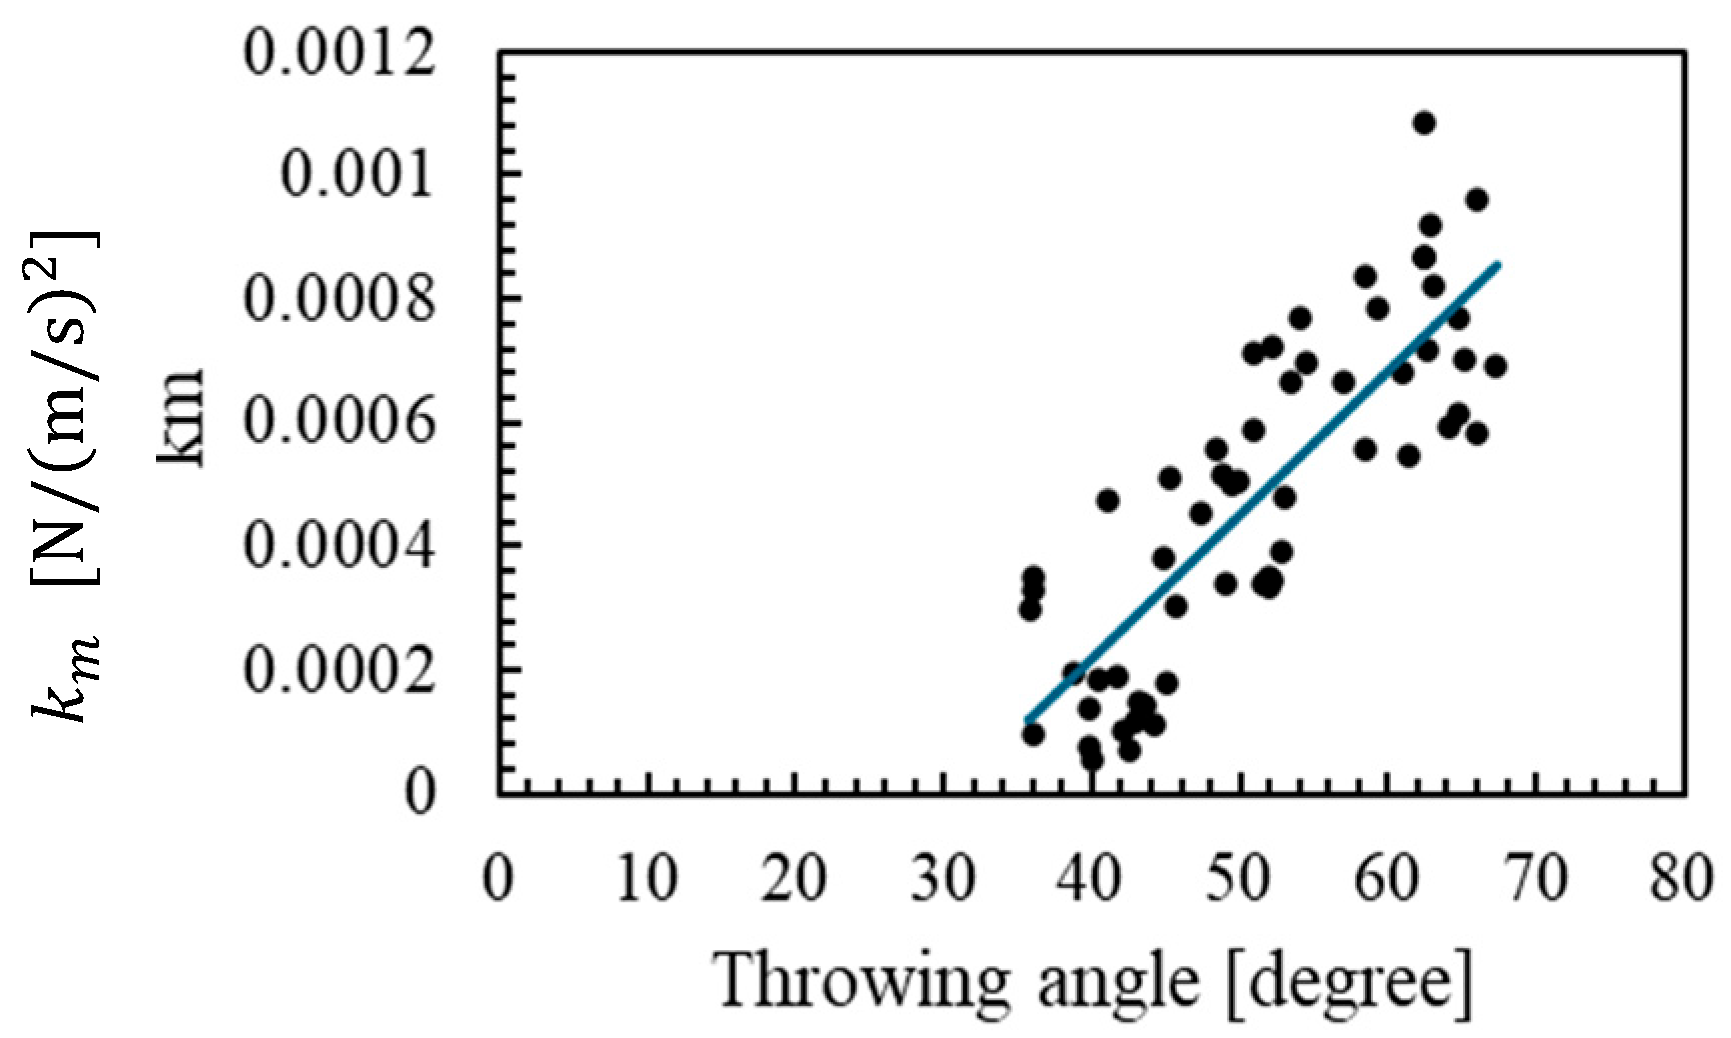
The coefficient k m for the extracted tensile force F e x t r a c t , described in the previous Section 2.2.4, is derived. In this study, following the approach adopted by Yaida [29], the value of k m is identified for each throwing trial such that the horizontal reach matches between the experiment and the model. Figure 8a,b present the relationship between k m and the experimental throwing angles as well as the throwing angular velocities.
As shown in Figure 8a, the value of k m decreases near a throwing angle of 35 degrees, and tends to increase as the angle deviates from 35 degrees. On the other hand, as shown in Figure 8b, no dependence of k m on the throwing angular velocity was observed within the range of the present experiments.
The dependence of k m on the throwing angle is considered to be due to the deviation between the string extraction direction at the moment of release and the axis direction of the bobbin. In this device, the string is initially wound on a bobbin and undergoes free extraction along its axial direction [28]. However, when the extraction direction deviates from the axial direction, friction between the string and the bobbin increases in addition to the extraction tension, resulting in a larger k m than its original value. The throwing position of the spear and the angle and position of the bobbin have a geometric relationship as shown in Figure 9, and it is considered that at a throwing angle of around 35 degrees, the string extraction direction coincides with the bobbin axis direction, thereby reducing friction. On the other hand, when the throwing angle exceeds 35 degrees, the extraction direction becomes upward, and when it is less than 35 degrees, it becomes downward; in both cases, friction increases, resulting in a larger k m . Therefore, it is considered that by adjusting the position and angle of the bobbin so that the string extraction direction coincides with the bobbin axis direction, this model could be applied even at small throwing angles.
In this experiment, a greater amount of data was obtained for throwing angles of 35 degrees or greater, where the thread extraction direction is oriented upward relative to the axial direction of the bobbin. Therefore, the model was developed based on data within this throwing angle range. At this time, a linear relationship between the throwing angle and k m was observed, as shown in Figure 10. Then, by linear approximation, the relationship between k m and the throwing angle θ t h r o w i n g was obtained as Equation (27). Furthermore, Table 4 shows the standard deviation and maximum value of the errors from the approximate linear line for k m . From this, it can be concluded that within the throwing angle range of 35   d e g r e e s and above, k m could be estimated by the approximate linear line with a maximum error of 0.000340   N / ( m / s ) 2 . Regarding the applicable range of throwing angles for the present model, it is considered possible to accommodate various conditions by adjusting the position and angle of the bobbin so that the desired throwing angle falls within the applicable range, and conducting similar experiments accordingly.
k m = 2.35 × 10 5 θ t h r o w i n g 7.21 × 10 4
In addition, the simulation model requires initial values for the throwing angle θ t h r o w i n g , throwing angular velocity θ ˙ t h r o w i n g   [ d e g r e e ] , shooting angle θ s h o o t i n g   [ d e g r e e / s ] , shooting velocity v s h o o t i n g   [ m / s ] , posture angle θ p o s t u r e   [ d e g r e e ] , and posture angular velocity θ ˙ p o s t u r e   [ d e g r e e / s ] . Among these, the throwing angle and throwing angular velocity can be controlled by the operator through the robotic arm. The other initial values, however, are difficult to control because they vary due to slippage between the spear and the robotic hand. Therefore, based on the average values obtained from the 72 experimental trials mentioned above, the following empirical relationships (Equations (28)–(31)) were derived.
θ s h o o t i n g = θ t h r o w i n g 5.67
v s h o o t i n g = 0.6 π θ ˙ t h r o w i n g / 180 0.037
θ p o s t u r e = 1.27
θ ˙ p o s t u r e = 190

2.3.5. Validation of the Model

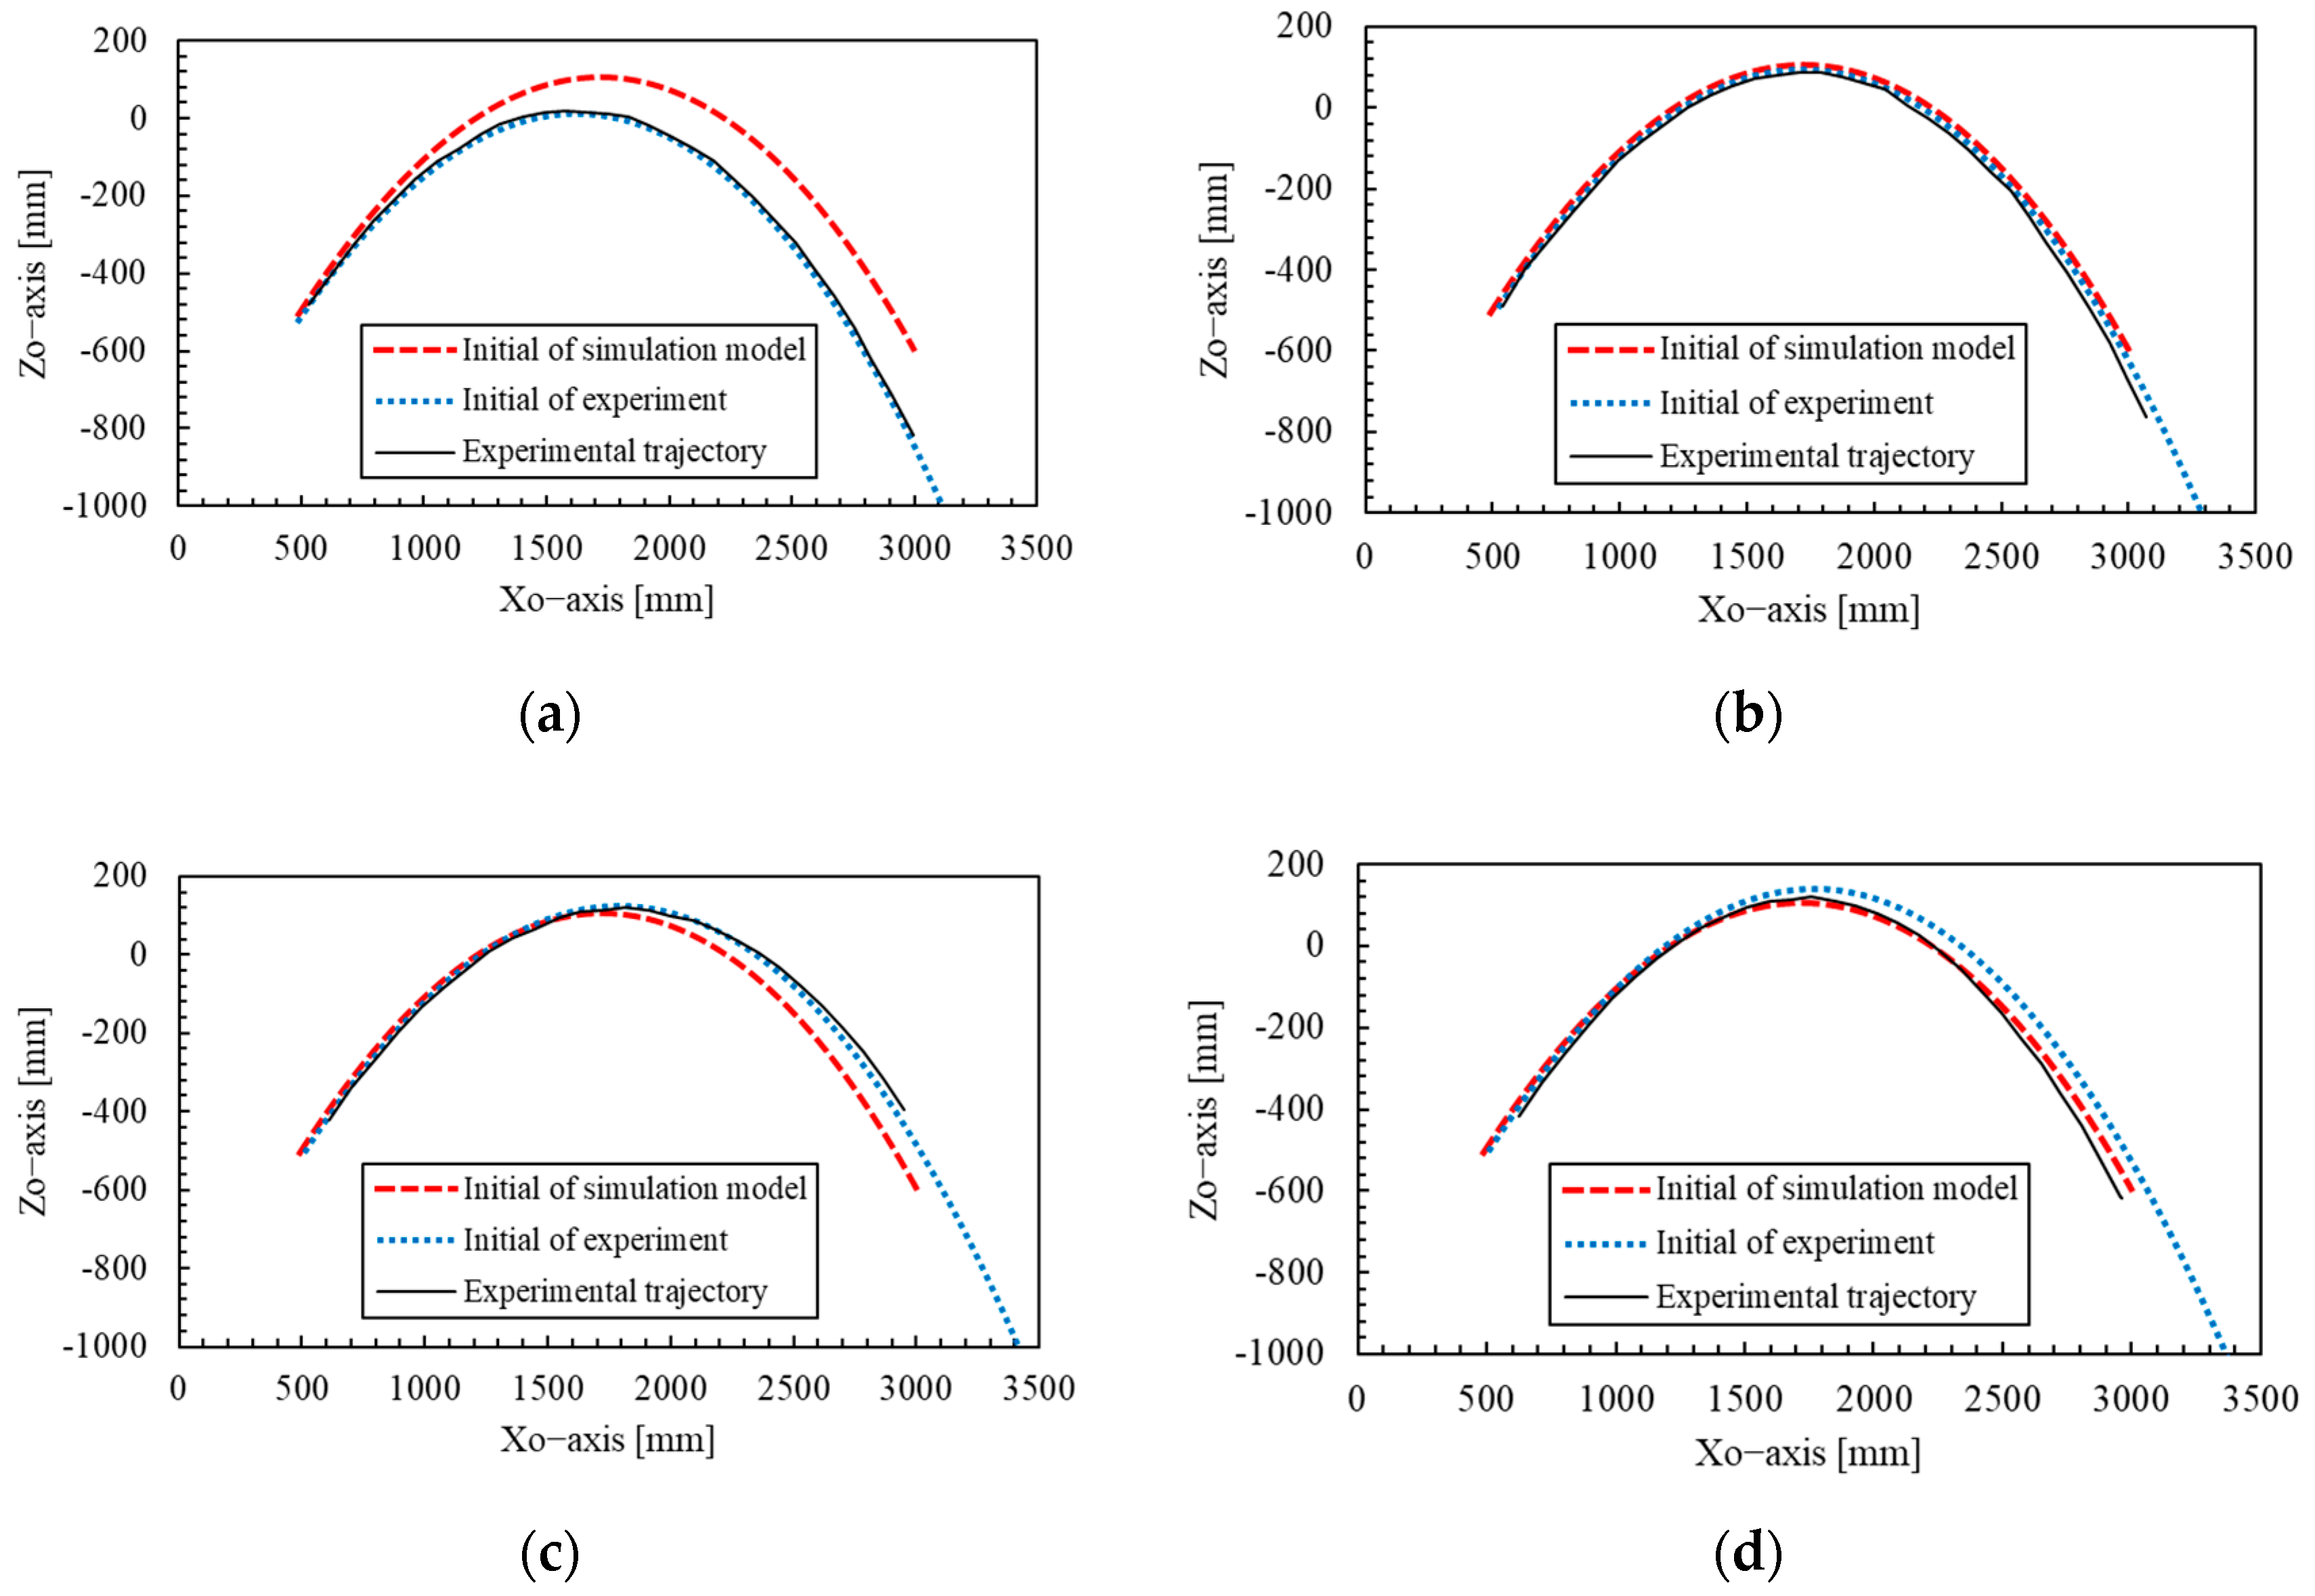
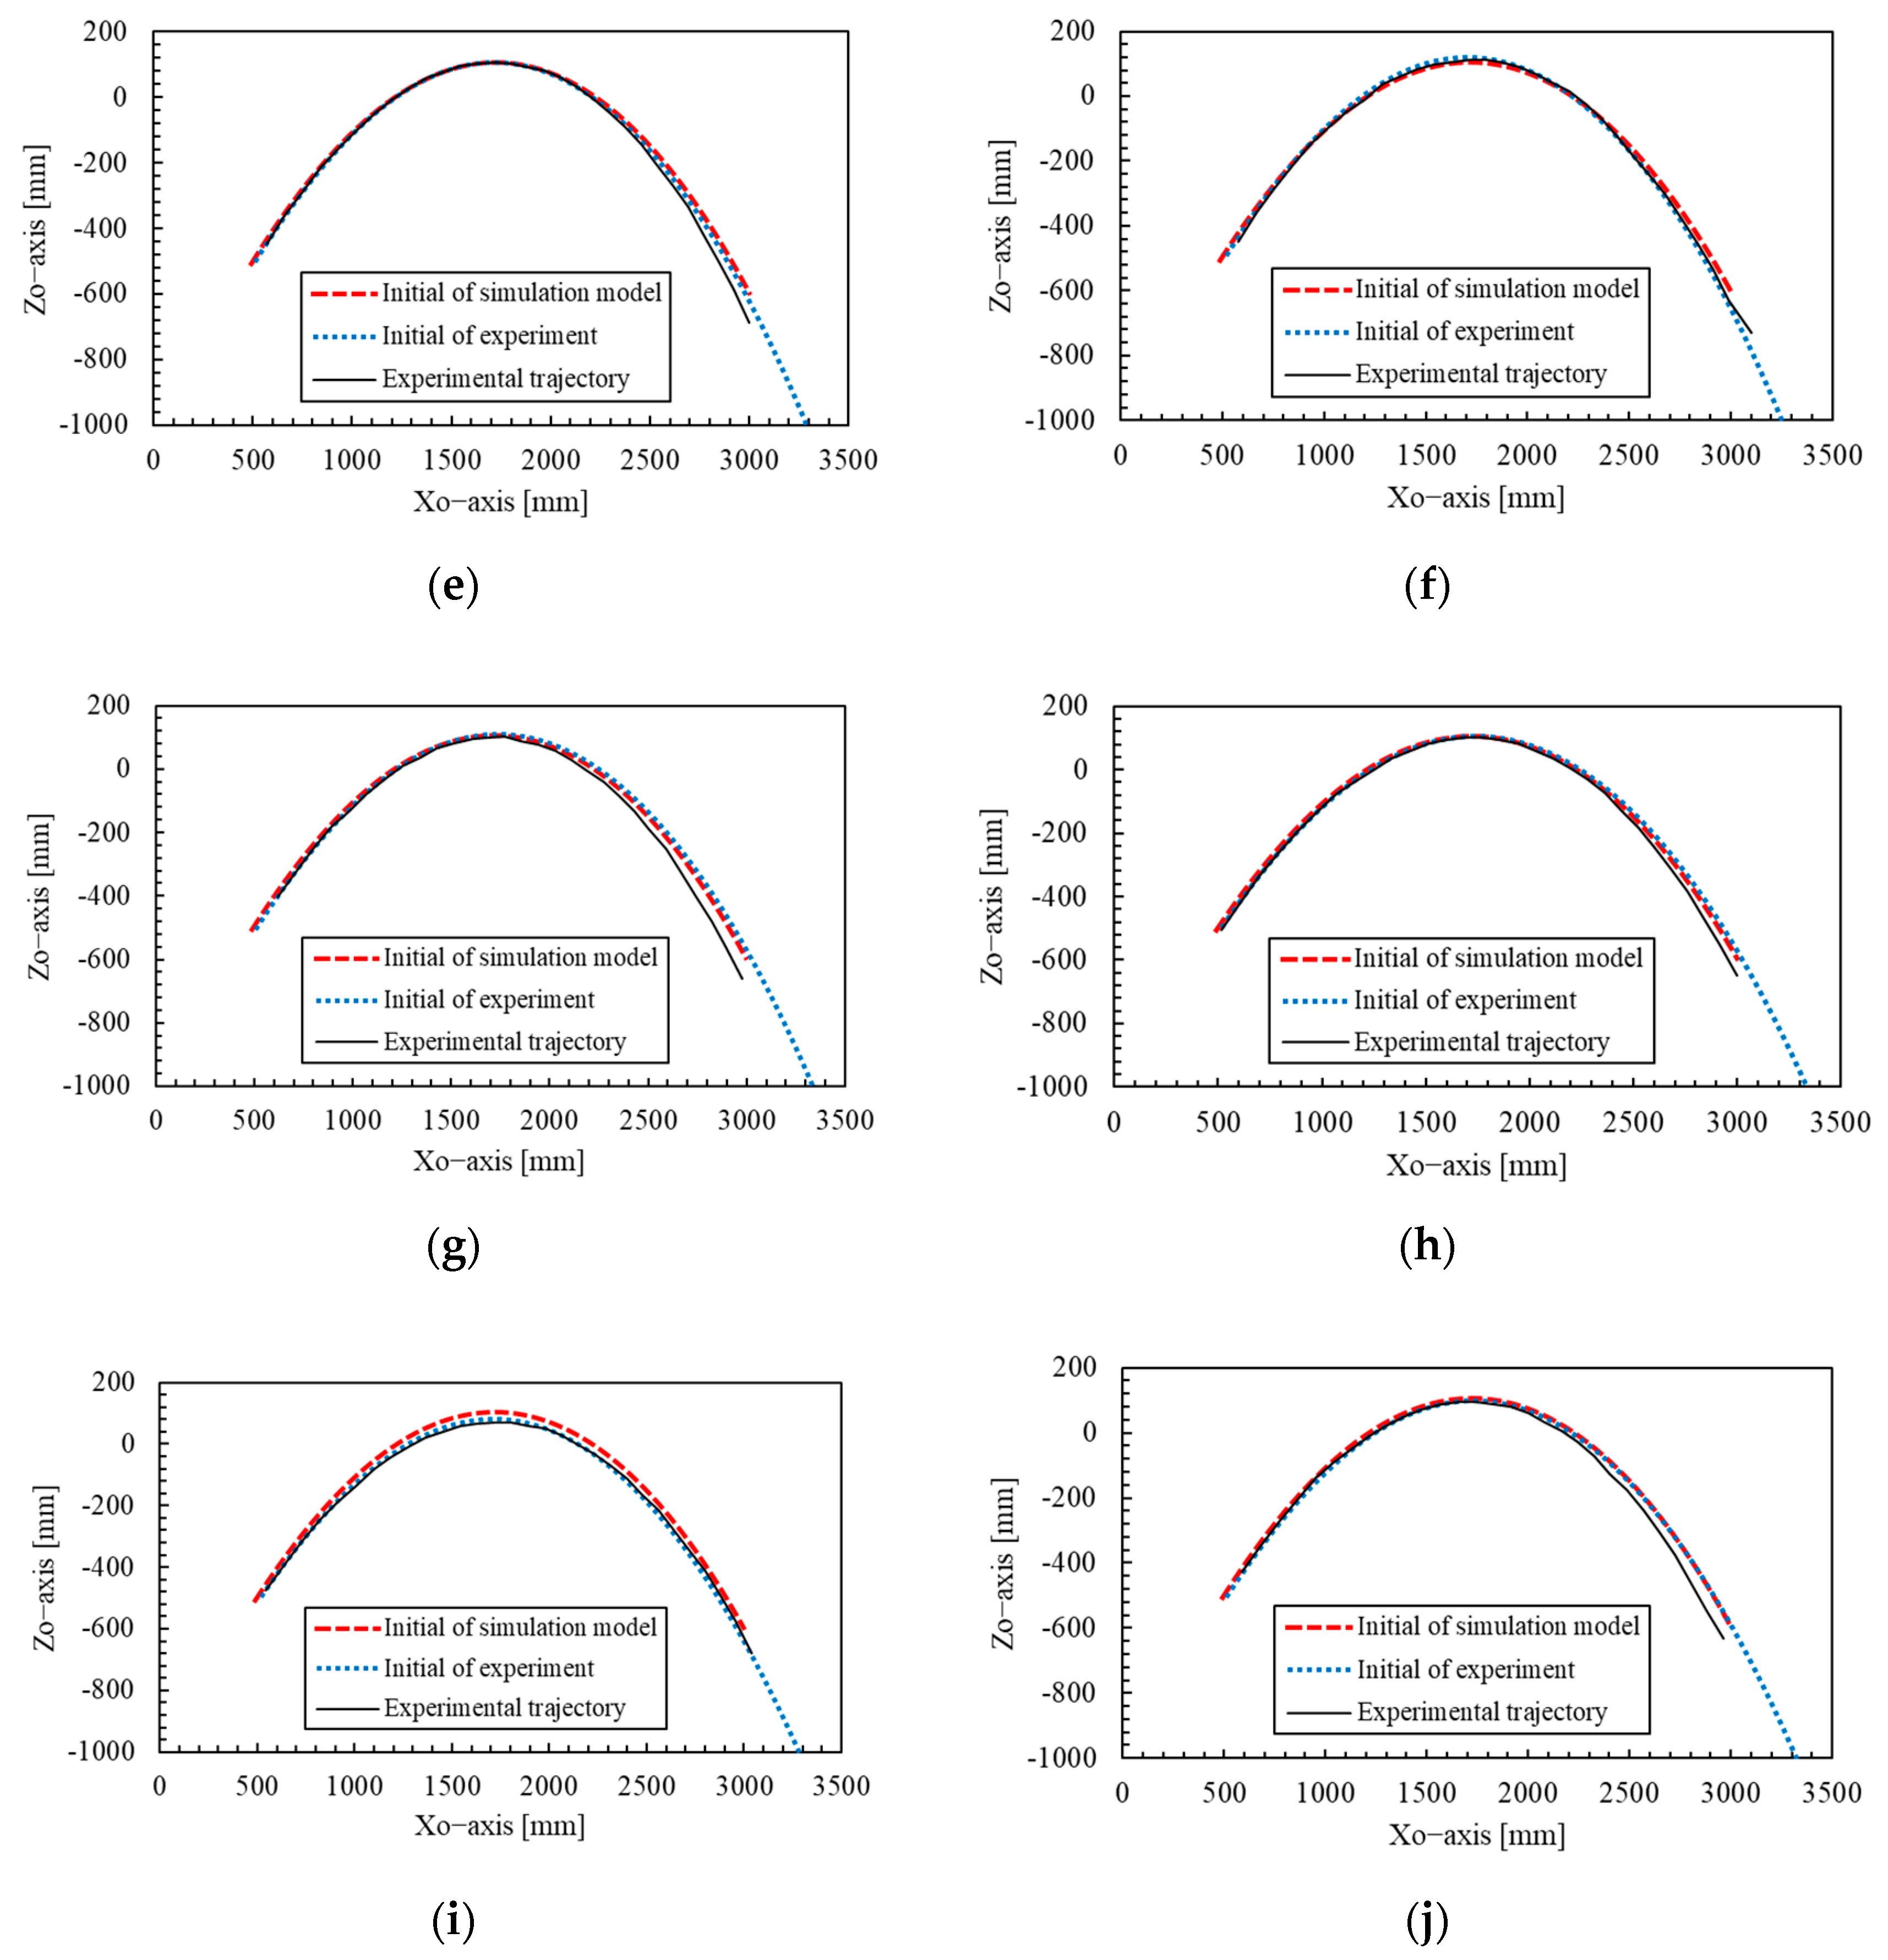
We compared the spear trajectories obtained from the experiments with those from numerical simulations to verify the validity of the model. Figure 11 shows the spear trajectories for each combination of the target throwing angle and target throwing angular velocity. The black lines represent the trajectories from each experimental trial. The red lines represent the simulated trajectories obtained using the average initial conditions from the experimental trials, with k m determined by Equation (27). The horizontal and vertical axes correspond to the X O and Z O axes of the coordinate system Σ O , whose origin is located at the first joint of the robotic arm.
Since the average values from each trial were used as the initial conditions for the simulation model, if the model is valid, its trajectory is expected to pass approximately through the center of the spread of the experimental trajectories. From Figure 11d–l, it can be seen that for target throwing angles of 40, 50, and 60 degrees, the model trajectories pass approximately through the center of the experimental trajectories’ spread, indicating that the model is valid for this range of throwing angles and throwing angular velocities.

2.4. Throwing Experiment for the Ring

As shown in the Figure 12, let the center of rotation of the robotic arm be the origin of Σ O , and define the center position of the ring as r R i n g O = X R i n g Y R i n g Z R i n g T . In this study, a bridge with a width of 3 m is assumed, and the center position of the ring is set to X R i n g = 3.0 [m], Y R i n g = 0.0 [m], Z R i n g = 0.6 [m]. If the throwing angle and angular velocity of the robotic arm can be determined such that the spear passes through this ring center position, then the throwing conditions can be derived from the trajectory estimation. In this study, the throwing angle varies from 35 degrees to 70 degrees in 1-degree increments, and for each angle, the throwing angular velocity required for the spear to pass through the ring position is calculated using the Newton-Raphson method.
From Figure 13, it is possible to select an appropriate throwing condition that suits the objective. In general, a lower angular velocity results in reduced output requirements for the device. Therefore, from Figure 13b, the condition with a small throwing angular velocity—specifically, a throwing angle of 50   d e g r e e s and an angular velocity of 492   d e g r e e s / s —was selected. The trajectory in this case is indicated by the red line in Figure 13a. As shown in the previous Section 2.3.4, k m has a maximum error of 0.000340   N / m / s 2 . Therefore, under this throwing condition, the upper and lower bounds of the spear’s passing point Z O coordinate, resulting from the error in k m , are as shown in Table 5.

3. Result

Using the throwing conditions obtained in Section 2.4 (throwing angle: 50 degrees, throwing angular velocity: 492 degrees/s) as target values, 11 throwing experiments toward the ring were conducted. Figure 14a shows the estimated trajectory from the simulation model as well as the actual trajectories of the spear observed in the experiments. The coordinates of the spear’s passing point are also shown in Figure 14b. The horizontal axis represents the number of experimental trials, and the dashed line indicates the center position of the ring. The initial values measured in each trial are shown in Table 6 and Table 7. In addition, the throwing conditions obtained from trajectory estimation, as well as the sample means and 95% confidence intervals of the measured values in the experiment, are also presented in Table 8. Note that the initial values in the third experiment could not be measured due to a failure.
From Table 8, it can be seen that the spear was thrown with approximately the target throwing angle and angular velocity. Figure 14a shows that the experimentally obtained spear trajectory generally agrees with the predicted trajectory from the simulation model. As shown in Figure 14b, excluding the first and fourth trials, the passing points of the spear fell within the upper and lower bounds resulting from variations in k m .
Based on the above, it was confirmed that this trajectory estimation method provides sufficient accuracy and reproducibility, as long as the spear is thrown under conditions close to the target throwing parameters. In particular, when the ring is placed at a horizontal distance of 3 m, it was found that if the ring has an inner diameter of at least 250 mm, nearly all spears can be passed through the ring.

4. Discussion

The cause of the deviation of the passing point from the center of the ring is discussed. First, the error in the initial conditions between the simulation model and the experiment is considered as a possible cause. In the simulation model, the initial conditions were set using Equations (28)–(31). However, the initial conditions measured in the experiment are shown in Table 5 and 6, and discrepancies are observed between the model and the actual measurements. Therefore, two types of flight simulations of the spear were conducted: one using the initial conditions of the simulation model shown in Table 8, and the other using the initial conditions obtained from each individual experiment in Table 6 and 7. The results are shown in Figure 15.
From Figure 15, it was confirmed that when all experimentally obtained initial conditions were used, the simulated trajectories became closer to the actual experimental trajectories in many trials compared to those predicted using the original model parameters. In particular, for the first and fourth trials, where the passing points deviated from the predicted intervals, it was confirmed that the trajectories better matched the experimental results when the initial values obtained from experiments were applied, as shown in Figure 15a,c. Therefore, it is suggested that discrepancies in the initial conditions between the simulation model and the actual experiment influence the trajectory and the passing point. To reduce the deviation of the passing point, it is important to realize initial conditions in the actual system that are as close as possible to those used in the trajectory prediction model. While the throwing angle and angular velocity can be made to closely follow the target values by improving the control performance of the robotic arm, the shooting angle, shooting velocity, posture angle, and angular velocity are affected by slippage between the spear and the robotic hand. As a result, it is currently difficult to specify these values in advance. In order to allow all initial values to be predetermined, it is necessary to elucidate the dynamics of the transition from the contact state between the robot hand and the spear to the separation state. On the other hand, the fact that the trajectory error was reduced by adjusting the model’s initial values based on the experimental initial values indicates that the prediction of the spear’s trajectory after release using the present model was valid. Even in this case, discrepancies remained between the experimental and simulated trajectories, which are considered to be due to modeling errors in k m obtained from Equation (27) based on Figure 10.
Next, we discuss the practical applicability of the device developed in this study. According to a survey conducted by CTI Engineering Co., Ltd. targeting 421 bridges within Japan, 49.3% of the bridges have a width of 10 m or more, and 41.0% of the bridges have a girder clearance height between 2 and 5 m [18]. Thus, actual bridges generally have a wider width than the 3-m width assumed in this study, and there are also constraints on the girder clearance height in the vertical direction. In this study, the throwing conditions were selected based on the trajectory corresponding to the minimum throwing angular velocity indicated by the red line in Figure 13a. However, in practice, it is necessary to consider the girder clearance height of the bridge and examine trajectories from Figure 13a that ensure the spear does not contact the bridge. Therefore, scenarios where the spear is thrown along a trajectory lower than the red line trajectory can be considered, and in such cases, the throwing angular velocity increases as the trajectory deviates further from the red line, as shown in Figure 13b. From Table 3, it can be confirmed that when the target throwing angular velocity reaches the maximum of 600 degrees/s, the measured variations in the throwing angle and angular velocity increase. This is considered to be due to the rapid acceleration and deceleration of the robotic arm, which reduces its ability to follow the commanded values. As discussed above, variations in the initial conditions lead to deviations in the spear’s trajectory and passing position. Therefore, the lower the clearance height under the girder, the more the robotic arm tends to throw at a low trajectory. This low trajectory requires a higher angular velocity, which consequently leads to decreased throwing accuracy. Similarly, as the width of the bridge increases, the distance to the ring becomes larger, requiring a higher angular velocity for the throw and potentially reducing throwing accuracy. In other words, if the robotic arm’s tracking performance to the commanded values can be improved even under conditions of high angular velocity, throwing accuracy is expected to improve. This will be a subject of future work.
We discuss the potential applicability of the device to alternative uses. Considering its capability to throw objects and thereby extend the operational range of a robotic arm, the device may be applicable to picking tasks [30]. In this task, a robotic hand attached to a thread is thrown toward a distant target object to capture it, and the object is then retrieved by pulling the thread back.
In this study, a model of a spear attached with a string was constructed, and it was verified that the trajectory prediction enables accurate throwing to the target position. Based on these results, it is demonstrated that trajectory analysis of an end effector equipped with a string is feasible even when air resistance cannot be neglected, and that by predicting the trajectory to a distant target object, the end effector can be accurately thrown to the object’s location. Therefore, it is considered feasible to apply this device to picking tasks and similar operations.

5. Conclusions

The author developed a robotic arm-based wire installation device. A simulation model of the spear was created to estimate the required throwing angle and angular velocity based on the position of the ring, and experiments were conducted to throw the spear toward the ring. The following findings were obtained:
  • The dependence of the extraction tension coefficient on the throwing angular velocity was not observed within the range of the present experiments, whereas a dependence on the throwing angle was confirmed. In particular, for throwing angles of 35 degrees or more, the extraction tension coefficient exhibited a monotonically increasing trend with respect to the throwing angle, and a linear approximation was found to be applicable. This approximation allowed the estimation error of the extraction tension coefficient to be reduced to a maximum of 0.000340 N / m / s 2 .
  • The throwing angle and angular velocity required for the spear to pass through the target ring position were estimated using the simulation model. In the experiment conducted under these conditions, it was confirmed that the spear passed through the ring with high reproducibility, achieving success in 9 out of 11 trials. In particular, it was demonstrated that when the ring with an inner diameter of 250 mm was placed 3 m away, nearly all spears were able to pass through the ring.
Future challenges and prospects are as follows: In this research, experiments were conducted in a windless environment free from external disturbances, thereby establishing the foundation of a model that accounts for the effects of the string and air resistance, and verifying its validity. Since wind is expected to be present in the actual space beneath bridges, future work should apply the model developed in this study to examine the accuracy of trajectory prediction under windy conditions. Furthermore, it was confirmed that discrepancies in initial values between the simulation and the actual system affected errors in the spear’s trajectory and passing points. To reduce such initial value errors, it is necessary to elucidate the dynamic effects such as slipping and friction that occur when the spear is released from the robotic hand, and to improve the tracking performance of the robotic arm to its target values.
Author Contributions

Conceptualization, Y.K., N.T., K.M., R.S. and Y.T.; methodology, Y.K. and N.T.; software, Y.K. and N.T.; validation, Y.K., K.M. and R.S.; formal analysis, Y.K., K.M. and R.S.; investigation, Y.K., N.T., K.M. and R.S.; resources, Y.K., N.T. and K.M.; data curation, Y.K., N.T., K.M. and R.S.; writing—original draft preparation, Y.K., K.M. and R.S.; writing—review and editing, Y.K., K.M., R.S. and Y.T.; visualization, Y.K. and N.T.; supervision, Y.T.; project administration, Y.T.; funding acquisition, Y.T. All authors have read and agreed to the published version of the manuscript.

Funding

This work was supported by JSPS KAKENHI Grant Number JP22K04656.

Data Availability Statement

The original contributions presented in this study are included in the article. Further inquiries can be directed to the corresponding authors.

Conflicts of Interest

The authors declare no conflicts of interest.

References

  1. Nuti, C.; Briseghella, B.; Chen, A.; Lavorato, D.; Iori, T.; Vanzi, I. Relevant outcomes from the history of Polcevera Viaduct in Genova, from design to nowadays failure. J. Civ. Struct. Health Monit. 2020, 10, 87–107. [Google Scholar] [CrossRef]
  2. Ministry of Land, Infrastructure, Transport and Tourism. Road Maintenance Annual Report; MLIT: Tokyo, Japan, 2024.
  3. Matsumura, Y.; Kawamoto, K.; Takada, Y. Development of a Compact Wall-Climbing Robot of Transitioning among Floor, Vertical Wall and Ceiling. J. Robot. Soc. Jpn. 2019, 37, 514–522. [Google Scholar] [CrossRef]
  4. Takada, Y.; Kirimoto, K.; Tajiri, T.; Kawai, T. Development of a Bridge Inspection Robot Working in Three-Dimensional Environment (Evaluation of Driving Performance of a Moving Mechanism with Permanent Magnets). Trans. Jpn. Soc. Mech. Eng. 2013, 79, 155–166. [Google Scholar] [CrossRef]
  5. Mazumdar, A.; Asada, H.H. Mag-Foot: A Steel Bridge Inspection Robot. In Proceedings of the 2009 IEEE/RSJ International Conference on Intelligent Robots and Systems, St. Louis, MO, USA, 11–15 October 2009; pp. 1691–1696. [Google Scholar]
  6. Bui, H.D.; Nguyen, S.; Billah, U.H.; Le, C.; Tavakkoli, A.; La, H.M. Control Framework for a Hybrid-Steel Bridge Inspection Robot. In Proceedings of the 2020 IEEE/RSJ International Conference on Intelligent Robots and Systems (IROS), Las Vegas, NV, USA, 25–29 October 2020; pp. 2585–2591. [Google Scholar]
  7. Lim, R.S.; La, H.M.; Shan, Z.; Sheng, W. Developing a Crack Inspection Robot for Bridge Maintenance. In Proceedings of the 2011 IEEE International Conference on Robotics and Automation, Shanghai, China, 9–13 May 2011; pp. 6288–6293. [Google Scholar]
  8. Nguyen, S.T.; La, H.M. A Climbing Robot for Steel Bridge Inspection. J. Intell. Robot. Syst. 2021, 102, 21. [Google Scholar] [CrossRef]
  9. Mimura, T.; Nitta, M.; Wada, H.; Nakamura, H. The development of inner defect detecting method by using UAV having hammering mechanism and application to actual bridges. J. Struct. Eng. B. 2019, 65A, 607–614. [Google Scholar]
  10. Okada, Y.; Okatani, T. Development of UAV Passive Rotating Spherical Shell for Bridge Inspection and its Evaluation of Inspection Capability in Real Bridges. J. Robot. Soc. Jpn. 2016, 34, 119–122. [Google Scholar] [CrossRef]
  11. Tokura, Y.; Takada, Y. Strategy for lowering electric power consumption concerning vertical wall inspection robot HORNET. Trans. Jpn. Soc. Mech. Eng. 2016, 82, 15–00422. [Google Scholar]
  12. Ikeda, T.; Yasui, S.; Fujihara, M.; Ohara, K.; Ashizawa, S.; Ichikawa, A.; Okino, A.; Oomichi, T.; Fukuda, T. UAV with Manipulator for Bridge Inspection—1st report: Stability of Impact and Contact Force Control against Floor Slab using One DoF Manipulator. J. Robot. Soc. Jpn. 2018, 36, 57–65. [Google Scholar] [CrossRef]
  13. Feroz, S.; Abu Dabous, S. UAV-Based Remote Sensing Applications for Bridge Condition Assessment. Remote Sens. 2021, 13, 1809. [Google Scholar] [CrossRef]
  14. Wang, J.; Ueda, T. A review study on unmanned aerial vehicle and mobile robot technologies on damage inspection of reinforced concrete structures. Int. Fed. Struct. Concreate 2023, 24, 536–562. [Google Scholar] [CrossRef]
  15. Ohno, K.; Okada, Y.; Harashima, S.; Yokoe, M. Unmanned Aerial Vehicle for Supporting Close Visual Inspection of Bridges. J. Jpn. Soc. Precis. Eng. 2017, 83, 1066–1070. [Google Scholar] [CrossRef]
  16. Nakui, R.; Yamaguchi, T. A prototype inspection robot based on multi-copter structure on three dimensional surface. In Proceedings of the 2016 JSME Conference on Robotics and Mechatronics, Yokohama, Japan, 8–11 June 2016. No. 16-2, 2P1–10a5. [Google Scholar]
  17. Fujisawa, R.; Umemoto, K.; Tanaka, M.; Saito, N.; Nagaya, N.; Katsuyama, N. Bridge Inspection and Operation of Araneus—Winch Wiring Robot System. J. Jpn. Soc. Civ. Eng. Ser. F4 Constr. Manag. 2017, 73, 26–37. [Google Scholar]
  18. Ishida, N.; Hirose, S.; Guarnieri, M. Development of a wire-suspended bridge inspection robot system. J. Jpn. Soc. Civ. Eng. Ser. F4 Constr. Manag. 2020, 76, 42–50. [Google Scholar] [CrossRef] [PubMed]
  19. Ohara, M.; Song, H.; Takada, Y. Study on a Shooting Device to Support a Wire-Driven Bridge Inspection Robot. Trans. Jpn. Soc. Mech. Eng. 2022, 88, 22–00081. [Google Scholar] [CrossRef]
  20. Okada, M.; Oniwa, S.; Hijikata, W. Robust throwing design based on dynamic sensitivity analysis. Mech. Eng. J. 2018, 5, 17–00442. [Google Scholar] [CrossRef]
  21. Arisumi, H.; Kotoku, T.; Komoriya, K. Study on Casting Manipulation (1st Report, Manipulator with Flexible String and its Swing Motion Control). Trans. Jpn. Soc. Mech. Eng. 1998, 64, 162–169. [Google Scholar] [CrossRef]
  22. Fagiolini, A.; Arisumi, H.; Bicchi, A. Visual-based feedback control of Casting Manipulation. In Proceedings of the 2005 IEEE International Conference on Robotics and Automation, Barcelona, Spain, 18–22 April 2005. [Google Scholar]
  23. Uchiyama, M.; Nakamura, Y. Robot Motion, 1st ed.; Yamaguchi, Ed.; Iwanami Shoten: Tokyo, Japan, 2004; pp. 64–78. [Google Scholar]
  24. Hoerner, S.F. Fluid-Dynamic Drag: Practical Information on Aerodynamic Drag and Hydrodynamic Resistance, 2nd ed.; Hoerner Fluid Dynamics: Bakersfield, CA, USA, 1965. [Google Scholar]
  25. The Japan Society of Mechanical Engineers. JSME Mechanical Engineer’s Handbook Fundamentals α4: Fluids Engineering, 1st ed.; The Japan Society of Mechanical Engineers: Tokyo, Japan, 2006; p. 85. [Google Scholar]
  26. Kida, T. Mechanism of Fiber Separation Part 3: Air Drag Properties of Fibers. J. Text. Eng. 1969, 22, 207–212. [Google Scholar]
  27. Dan, D.; Horikawa, A.; Yaida, O. On the Dynamics of String (5). J. Text. Eng. 1980, 33, 239–242. [Google Scholar]
  28. Dan, D.; Horikawa, A.; Yaida, O. On the Dynamics of String (4). J. Text. Eng. 1980, 33, 185–190. [Google Scholar]
  29. Yaida, O. Studies on Mechanics of String (Part 2) Mechanics of Moving string. Bull. Fac. Life Sci. Osaka City Univ. 1982, 33, 59–66. [Google Scholar]
  30. Arisumi, H. Casting Manipulation. Trans. Jpn. Soc. Mech. Eng. 2023, 41, 854–857. [Google Scholar]
Figure 1. Diagram of wire installation method.
Inventions 10 00073 g001
Figure 2. Robotic arm: (a) external appearance; (b) side view showing component names and dimensions.
Inventions 10 00073 g002
Figure 3. The image of processing.
Inventions 10 00073 g003
Figure 4. Definition of the coordinate system.
Inventions 10 00073 g004
Figure 5. An infinitesimal segment of the spear: (a) definition of infinitesimal segment; (b) flow velocity of infinitesimal segment; (c) the air resistance of infinitesimal segment.
Inventions 10 00073 g005
Figure 6. The force exerted on the string: (a) the air resistance of the string; (b) the extraction tension of the string.
Inventions 10 00073 g006
Figure 7. The environment of the experiment.
Inventions 10 00073 g007
Figure 8. The relationship between k m and parameters: (a) The relationship between k m and throwing angle; (b) The relationship between k m and throwing angular velocity.
Inventions 10 00073 g008
Figure 9. The relationship between the bobbin’s axial direction and the yarn extraction direction.
Inventions 10 00073 g009
Figure 10. The relationship between k m and shooting angle over 30 degrees.
Inventions 10 00073 g010
Figure 11. Comparison of trajectory between simulation and actual device: (a) 30 deg–500 deg/s; (b) 30 deg–550 deg/s; (c) 30 deg–600 deg/s; (d) 40 deg–500 deg/s; (e) 40 deg–550 deg/s; (f) 40 deg–600 deg/s; (g) 50 deg–500 deg/s; (h) 50 deg–550 deg/s; (i) 50 deg–600 deg/s; (j) 60 deg–500 deg/s; (k) 60 deg–550 deg/s; (l) 60 deg–600 deg/s.
Inventions 10 00073 g011
Figure 12. Experimental environment.
Inventions 10 00073 g012
Figure 13. Throwing conditions that pass through the center of the ring: (a) trajectories for representative throwing angles at 5 degrees intervals; (b) relationship between throwing angle and angular velocity.
Inventions 10 00073 g013
Figure 14. Comparison between desired and experimental values: (a) trajectories; (b) passing points.
Inventions 10 00073 g014
Figure 15. Comparison of trajectory between the trajectory using the initial conditions of the simulation model, the trajectory using the initial conditions obtained from each individual experiment and the actual experimental trajectory: (a) Experiment No. 1; (b) Experiment No. 2; (c) Experiment No. 4; (d) Experiment No. 5; (e) Experiment No. 6; (f) Experiment No. 7; (g) Experiment No. 8; (h) Experiment No. 9; (i) Experiment No. 10; (j) Experiment No. 11.
Inventions 10 00073 g015aInventions 10 00073 g015b
Table 1. Comparison between casting manipulation and the device used in this study.
Casting Manipulation [21]Casting Manipulation [22]The Device Proposed in This Study
Weight of the object0.10 kg0.084 kg0.012 kg
Extraction tensionBe consideredDidn’t be consideredBe considered
Air resistanceDidn’t be consideredDidn’t be consideredBe considered
Table 2. Parameter used in simulations.
ParameterSymbolValueDimension
Mass of the spear m s p 12.07 g
Length of the spear L s p 100 m m
Length from the end of the spear to the gravity center of the spear L g 50 m m
The diameter of the spear d s t 15 m m
Drag coefficient of the circular in radial direction C D s p   r a d i a l 0.76
Drag coefficient of the cylinder in axial direction C D s p   a x i a l 0.98
Air density ρ 1.25 k g / m 2
The string density of the string ρ s t 0.000023 k g / m
Kinematic viscosity of the air ν 1.512 × 10 5 m 2 / s
Table 3. The experimentally measured initial values of the throw.
Target Throwing Angle [Degree]30
Target throwing velocity [degree/s]500550600
Number of trials666
Average throwing angle [degree] 35.1 ± 1.7 30.1 ± 1.8 30.1 ± 1.3
Average throwing angular velocity [degree/s] 484 ± 5 538 ± 3 638 ± 5
Average shooting angle [degree] 30.0 ± 1.1 24.9 ± 1.2 24.5 ± 1.0
Average shooting velocity [m/s] 5.06 ± 0.04 5.63 ± 0.06 6.74 ± 0.06
Average posture angle [degree] 2.15 ± 0.69 3.38 ± 2.08 4.32 ± 4.90
Average posture angular velocity [degree/s] 185 ± 80 260 ± 143 277 ± 164
Average horizontal reach [mm] 3155 ± 95 3309 ± 180 4237 ± 256
Target Throwing Angle [Degree]40
Target throwing velocity [degree/s]500550600
Number of trials676
Average throwing angle [degree] 40.1 ± 1.0 43.5 ± 1.0 45.3 ± 3.0
Average throwing angular velocity [degree/s] 479 ± 6 528 ± 3 626 ± 9
Average shooting angle [degree] 35.9 ± 1.0 38.4 ± 0.6 37.1 ± 2.6
Average shooting velocity [m/s] 5.03 ± 0.03 5.48 ± 0.03 6.49 ± 0.08
Average posture angle [degree] 0.33 ± 1.97 8.5 ± 21.2 4.53 ± 3.60
Average posture angular velocity [degree/s] 52 ± 123 64 ± 107 370 ± 117
Average horizontal reach [mm] 3344 ± 34 3852 ± 74 4655 ± 192
Target Throwing Angle [Degree]50
Target throwing velocity [degree/s]500550600
Number of trials666
Average throwing angle [degree] 51.9 ± 1.6 50.6 ± 2.0 54.4 ± 3.0
Average throwing angular velocity [degree/s] 488 ± 3 540 ± 4 634 ± 14
Average shooting angle [degree] 47.2 ± 1.0 45.1 ± 0.7 46.7 ± 2.7
Average shooting velocity [m/s] 5.02 ± 0.10 5.56 ± 0.06 6.57 ± 0.08
Average posture angle [degree] 1.46 ± 3.63 0.02 ± 2.20 3.64 ± 2.69
Average posture angular velocity [degree/s] 115 ± 135 137 ± 109 290 ± 89
Average horizontal reach [mm] 3261 ± 78 3791 ± 49 4555 ± 93
Target Throwing Angle [Degree]60
Target throwing velocity [degree/s]500550600
Number of trials665
Average throwing angle [degree] 64.5 ± 1.1 63.0 ± 1.7 61.7 ± 4.4
Average throwing angular velocity [degree/s] 473 ± 6 527 ± 3 622 ± 15
Average shooting angle [degree] 59.6 ± 0.5 58.4 ± 1.4 54.3 ± 0.8
Average shooting velocity [m/s] 4.90 ± 0.03 5.47 ± 0.02 6.51 ± 0.12
Average posture angle [degree] 2.26 ± 0.87 1.52 ± 1.65 2.70 ± 1.68
Average posture angular velocity [degree/s] 172 ± 91 161 ± 79 230 ± 159
Average horizontal reach [mm] 2779 ± 26 3175 ± 143 4253 ± 62
Table 4. Standard deviation and maximum error of k m .
Standard deviation [ N / m / s 2 ] 0.000150
Maximum error [ N / m / s 2 ] 0.000340
Table 5. Bounds of desired passing point.
The Upper BoundsThe Nominal ValueThe Lower Bounds
Desired passing point [mm] 492 600 744
Table 6. The initial conditions obtained from each individual experiment (Experiment No. 1–6).
Experiment Number 1 2 3 4 5 6
Throwing angle [degree] 49.4 53.2 50.4 52.7 51.3
Throwing angular velocity [degree/s] 483 512 512 510 508
Shooting angle [degree] 43.0 43.7 43.9 44.3 44.4
Shooting velocity [m/s] 4.89 5.12 5.21 5.23 5.14
Posture angle [degree] 3.20 9.81 1.54 90.9 10.1
Posture angular velocity [degree/s] 10.7 427 21.3 382 486
Table 7. The initial conditions obtained from each individual experiment (Experiment No. 7–11).
Experiment Number 7 8 9 10 11
Throwing angle [degree] 53.7 50.7 52.4 52.0 50.8
Throwing angular velocity [degree/s] 509 512 508 511 515
Shooting angle [degree] 45.0 44.3 43.9 43.1 43.9
Shooting velocity [m/s] 5.11 5.18 5.17 5.12 5.17
Posture angle [degree] 12.0 8.12 8.20 14.7 9.47
Posture angular velocity [degree/s] 490 413 392 568 475
Table 8. Comparison between desired and experimental values of throwing conditions.
Desired ValueExperimental Value
Throwing angle [degree]50.0 51.7 ± 1.0
Throwing angular velocity [degree/s]492 508 ± 6
Shooting angle [degree] 44.3 44.0 ± 0.4
Shooting velocity [m/s] 5.11 5.13 ± 0.07
Posture angle [degree] 1.27 1.7 ± 22.7
Posture angular velocity [degree/s] 190 290 ± 218
The passing point [mm] 600 650 ± 60
Disclaimer/Publisher’s Note: The statements, opinions and data contained in all publications are solely those of the individual author(s) and contributor(s) and not of MDPI and/or the editor(s). MDPI and/or the editor(s) disclaim responsibility for any injury to people or property resulting from any ideas, methods, instructions or products referred to in the content.