Article

Numerical Method for Internal Structure and Surface Evaluation in Coatings

Department of Production Engineering, Faculty of Mechanical Engineering and Design, Kaunas University of Technology, Studentu St. 56, 51424 Kaunas, Lithuania
*
Author to whom correspondence should be addressed.
Inventions 2025, 10(4), 71; https://doi.org/10.3390/inventions10040071 (registering DOI)
Submission received: 19 July 2025 / Revised: 6 August 2025 / Accepted: 10 August 2025 / Published: 13 August 2025
(This article belongs to the Section Inventions and Innovation in Advanced Manufacturing)

Abstract

This study introduces a MATrix LABoratory (MATLAB, version R2024b, update 1 (24.2.0.2740171))-based automated system for the detection and measurement of indication areas in coated surfaces, enhancing the accuracy and efficiency of quality control processes in metal, polymeric and thermoplastic coatings. The developed code identifies various indication characteristics in the image and provides numerical results, assesses the size and quantity of indications and evaluates conformity to ISO standards. A comprehensive testing method, involving non-destructive penetrant testing (PT) and radiographic testing (RT), allowed for an in-depth analysis of surface and internal porosity across different coating methods, including aluminum-, copper-, polytetrafluoroethylene (PTFE)- and polyether ether ketone (PEEK)-based materials. Initial findings had a major impact on indicating a non-homogeneous surface of obtained coatings, manufactured using different technologies and materials. Whereas researchers using non-destructive testing (NDT) methods typically rely on visual inspection and manual counting, the system under study automates this process. Each sample image is loaded into MATLAB and analyzed using the Image Processing Tool, Computer Vision Toolbox, Statistics and Machine Learning Toolbox. The custom code performs essential tasks such as image conversion, filtering, boundary detection, layering operations and calculations. These processes are integral to rendering images with developed indications according to NDT method requirements, providing a detailed visual and numerical representation of the analysis. RT also validated the observations made through surface indication detection, revealing either the absence of hidden defects or, conversely, internal porosity correlating with surface conditions. Matrix and graphical representations were used to facilitate the comparison of test results, highlighting more advanced methods and materials as the superior choice for achieving optimal mechanical and structural integrity. This research contributes to addressing challenges in surface quality assurance, advancing digital transformation in inspection processes and exploring more advanced alternatives to traditional coating technologies and materials.

1. Introduction

Non-destructive testing (NDT) methods have several advantages making them an important part of the quality control process in manufacturing. NDT does not damage the test object; provides accurate detection results for defects such as voids, cracks and corrosion; diagnoses potential problems early; and often has a wide range of applications for various materials [1,2,3,4]. The ability to evaluate surface coatings without damaging them is crucial for the large-scale industrial development of coating technologies. It is very important to choose the right inspection methods that allow the detection of damage and defects in coatings at various stages of manufacturing. In many cases, more than one NDT method is required to identify defects and damage to perform a full-scale quality analysis.
One of the most universal NDT methods is the X-ray method, as X-ray inspection affects all materials, regardless of their magnetic properties [5,6,7,8,9]. The density variations of alloys and ferromagnetic materials create clear contrast in radiographic images and help to effectively detect small internal defects such as voids, porosity, cracks and inclusions. In addition, the X-ray method can be used to ensure a homogeneous distribution of the coating in the thickness direction and chemical composition of coatings and layers [10,11]. X-ray diffraction is convenient to use in evaluating the properties of thin coatings and films [12]. The capabilities of the X-ray method can be further expanded by combining this method with other methods. A successful development is the combination of X-ray computed tomography with a focused ion beam. This allows for a clear 3D and virtual cross-sectional view of the coating and substrate to determine the size, distribution and location of defects [13]. Digital radiography and the computerized microtomography method were applied to the inspection of laminated pipe joints in polymeric composite material reinforced with glass fiber, enabling the detection of voids, delamination or debonding [14]. A hybrid approach combining synchrotron X-ray imaging with compressible Multiphysics process modeling was used to elucidate the mechanisms of pore formation during laser welding of copper [15]. X-rays can be used for probing cutting tool coatings during machining to assess how the strain evolution in the coating of the tool changes [16]. X-ray microcomputed tomography was used to determine different types of fatigue-initiating defects [17]. Using X-ray images as input enables automatic non-destructive defect detection to proactively avoid accidents related to unintended equipment failures [18]. X-ray radiography allows the detection of pores in the material and the determination of the pore structures [19,20,21]. Synchrotron X-ray refraction radiography was coupled with heat treatment to analyze the evolution of microstructure and porosity as a function of temperature [22]. X-ray computed tomography and X-ray radiography are two well-known NDT methods used to evaluate internal weld imperfections [23]. However, when X-ray images of various defects are obtained, the clarity, sharpness and ability to determine the dislocation of defects are very important, as in radiography, image visibility is often limited due to the structure of the object being examined, weak contrast in X-ray images or scattered X-rays. Several methods have been developed or proposed to overcome these problems. A sign recognition system based on convolutional neural networks is proposed for welding images. The proposed system includes a spatial and channel enhancement module, based on which a narrow network is created for the final recognition of welding information and for image pose correction [24]. Commonly, an automatic analysis of large image sequences requires clear and reliable image processing and feature extraction algorithms. An algorithm is proposed that can provide numerical results on the width, height and area of an Al alloy melting pool for large high-speed radiography image sequences [25]. The efficient acquisition of high-accuracy deblurring in X-ray images is based on the use of a compressed sensing deblurring method that is integrated with a total variation regularization penalty [26]. The dark channel allows for image restoration using a radiographic scattering model, in which the intensity of scattered X-rays and the direct transmission function of the object under study are estimated from a single X-ray image [27]. A method is proposed where the initiation of pore defects with X-ray imaging is correlated with thermal monitoring signals to determine the probability of defect occurrence [28].
Liquid penetrant testing is a process that uses capillary forces to expose imperfections in the test surface. The method is widely applied to identify defects in non-porous materials (ferrous and non-ferrous metals, glass, rubber, plastics), as it is one of the cheapest, fastest and simplest non-destructive testing methods [2,29,30]. The method has found applicability for testing parts of various purposes: for aircraft and aerospace components, automotive and railway components, pressure vessels and piping, electronic components, machined parts, welded components, castings, forgings and medical equipment [31,32,33,34,35,36,37,38]. The liquid penetration method is used to identify cracks in coatings created by laser cladding [30,39], to detect of fatigue cracks caused by operational effects in turbine blades [40], to study the permeability of concrete [41,42], to study coatings made of composite materials subjected to impact loads [43], to determine the change in porosity of composite coatings with changing casting temperature and casting time [44] and to detect surface weld discontinuities [45,46,47]. Studies have shown that the effectiveness of the liquid penetration method is affected by temperature and vibrations [48]. In order to qualitatively assess the penetration of the penetrant, various systems have been proposed, namely the automation of the image processing process [49], the use of robotic systems [50] and automatic inspection systems [51] for image processing and acquisition of the inspected part. However, most of these methods, both X-ray and penetration, require special equipment and careful and laborious additional work to measure the scattering characteristics.
Various programs are used to process the obtained measurement results on the internal structure of materials, possible internal defects and heterogeneity faster and more clearly. Such an opportunity is provided by the MATLAB-based automated system. MATLAB programs are used in the paper production process to determine pulp quality, brightness and consistency in real time [52]; in software defect prediction [53]; for high-quality defect detection in the process of casting polymer films [54]; for the identification of localized defects in bearings in the automotive industry [55]; and in other areas.
In this study, we propose a fully automated MATLAB-based image processing system designed to evaluate surface and internal defects in components subjected to NDT. The system supports both PT in accordance with EN ISO 3452-1 [56] and RT performed using ISO 17636-1 [57] with scanned physical X-ray films. The developed system integrates tools from MATLAB’s Core Environment, Image Processing Toolbox and Report Generator Toolbox, forming a complete analysis environment that spans from image acquisition to structured report generation (Figure 1).
The methodology is designed to support both liquid penetrant testing for external surface defect detection and X-ray radiography for internal structure evaluation. In applications where fully digital X-ray imaging systems remain prohibitively expensive, the proposed method offers a practical alternative by enhancing the diagnostic value of conventional radiographic images through computational post-processing [58]. The system improves visibility and interpretability of defects using contrast manipulation, morphological filtering and segmentation, thereby extending the capabilities of standard NDT tools [59].
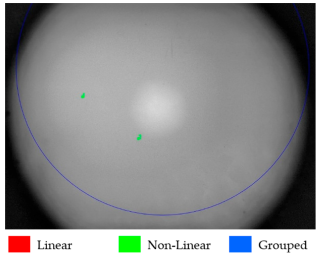
The two separate detection codes were developed depending on the NDT method: for penetrant testing, color-based segmentation is used in the LAB color space to extract dye indications (via rgb2lab and pixel thresholding), while for radiographic films, grayscale contrast variations are processed using the same morphological framework. Once segmented, indications undergo classification by shape (linear, non-linear or grouped) using bounding box geometry, aspect ratios and inter-feature distances (regionprops, pdist). Evaluation thresholds for count, area and grouping are enforced per ISO 4386-3 [60].
This standard, ISO 4386-3, is specifically developed for the evaluation of journal bearings, particularly those made from white metals. The decision to use this standard is intentional because journal bearings present unique inspection challenges due to the inherent variability of their coating application technologies, such as casting, soldering, cladding or spraying. These methods often result in heterogeneous microstructures, allowing more indications than in welded joints, where standards such as EN ISO 5817 [61] impose far stricter acceptance criteria. Therefore, ISO 4386-3 allows a higher threshold of permissible indications, but demands precise quantification of defect number, area density, geometry and spatial distribution [62].
Most other MATLAB-based systems for NDT (e.g., for weld crack segmentation, ultrasonic data interpretation or computed tomography (CT) image analysis) focus either on a single testing method or require additional toolboxes such as Deep Learning Toolbox or Signal Processing Toolbox. Our implementation is unique in its dual-modality design—allowing the same computational logic to be applied to both surface (penetrant) and internal (radiographic) inspection data—and its strict adherence to standardized thresholds and geometric classification, and it does not require any training datasets [63]. The system includes automated visualization of all detected indications, with color-coded bounding boxes overlaid using rectangles and indexed annotations placed with text.
This MATLAB-based solution enables rapid, standards-compliant inspection of coatings, weld overlays and cast surfaces using commonly available imaging equipment. By leveraging only core MATLAB and image processing toolboxes, it ensures replicability, maintainability and accessibility—essential for scaling quality inspection technologies without major infrastructure costs [64].
While NDT operators may outperform automated methods in complex visual contexts, such as when compensating for image blur, shadows, or dye inconsistencies, the MATLAB-based solution demonstrates superior efficiency and reliability in quantifying extensive porosity and large datasets where manual evaluation becomes impractical [65].
The uniqueness of this method lies in its dual-modality design, enabling both surface defect detection (PT) and internal defect evaluation (RT) within a single MATLAB framework. Unlike many existing NDT approaches, which are limited to one modality or rely on data-driven models, our method is fully rule-based and ISO 4386-3 compliant, ensuring transparency, reproducibility and regulatory acceptance. This strict adherence to standardized thresholds distinguishes it from conventional visual assessment and other automated systems that lack formal standards integration.

2. Materials and Methods

Special specimens were developed and adapted to specific testing and evaluation processes. The specimens were obtained using three different casting methods: static casting (SC), flame soldering (FS) and clad welding (CW). In all three cases, the chemical composition of the white metal rod that formed a layer on the substrate of the specimens was the same (Table 1).
However, after coating the substrate with a layer of white metal using all three methods and analyzing the chemical composition of the coating, it can be concluded that the concentrations of the main elements, i.e., antimony, tin and copper, were slightly different. When the static casting method was used, antimony was 12.40%, tin was 83.72% and copper was 3.73%. When the material was coated using the flame soldering method, they were 12.70%, 83.40% and 3.69%, respectively, and when the material was coated by the clad welding method, they were 13.10%, 81.16% and 5.57%. These slight changes in chemical composition are influenced by several factors, including the duration of the coating procedure, temperature differences, exposure to oxygen and the rate of evaporation during the deposition process.
For this study, three specimens were prepared using static casting, flame soldering and clad welding methods. Each specimen had an identical “O-shaped” flat-round configuration (Figure 2) with an outer diameter of Ø100 mm, an inner cavity diameter of Ø80 mm, a height of 25 mm and a chamfer of 6 mm at 45°. The base material was carbon steel S355J2, selected for its mechanical stability and compatibility with white metal coatings. A total of three specimens (one per method) were produced, ensuring uniform geometry to enable direct comparison between preparation techniques. This standardization ensured that differences in porosity and defect distribution could be attributed primarily to the coating method rather than geometric or dimensional variability.
Using the SC method, the white metal material was melted and refined in a furnace. The white metal coating was created by pouring liquid white metal directly from the crucible onto the prepared substrate. When the specimens were prepared, special attention was paid to the temperature generated under the white metal coating. The temperature reached 378° C and was suitable to guarantee that antimony, as one of the main chemical elements of the coating, was not burnt due to excessive heat input during casting. Carbon steel S355J2 was used as the substrate.
In the FS method, the white metal was melted onto the prepared substrate using an oxidizing flame. The flame was generated by burning a mixture of propane and oxygen gases at a ratio of 1:4.
A digitally controlled electrode power source with resonant intelligence, a Fronius TransPocket 2500 TIG welding machine (Fronius International GmbH, Wels, Austria) and a non-consumable Abicor Binzel 1.6 mm diameter WP green TIG tungsten electrode (K&G, Schweisstechnik GmbH, Hauptwil, Germany) operating at a stable current of 20 A and voltage range of 10–20 V were used to form the white metal coating by the CW method. The process was carried out in an argon shielding gas environment with a concentration of 99%, ensuring minimal oxidation and contamination of the molten white metal alloy. A controlled cooling regime, i.e., decreasing the temperature approximately 100 °C/min down to 100 °C, followed by natural cooling to ambient conditions, was applied, aiming to minimize thermal stresses and porosity formation. The appropriate heat input, inert gas protection, and gradual cooling directly contributed to the superior coating quality observed in CW specimens compared with SC and FS methods.
The three coating methods—SC, FS and CW—were selected to represent distinct deposition processes with differing thermal input and defect mechanisms. SC serves as a baseline but is prone to shrinkage porosity; FS provides localized heating but risks gas entrapment; CW offers controlled bonding under shielding gas, minimizing porosity. Their inclusion enables a direct comparison of how manufacturing technology influences coating quality under the same ISO 4386-3 evaluation framework.

2.1. Penetrant Testing

The penetration method is based on the penetration of liquids into defect cavities. Penetration testing is a valuable technique used in white metal coating technologies to detect surface defects and to assess the quality of coated materials. Due to the capillary effect of surface cracks, capillary pressure acts on the penetrant and forces it to fill the crack cavities in the white metal layer. Basically, a penetrant test is performed by applying a penetrating liquid, often a colored dye or a fluorescent liquid, to the surface of the white-metal-coated component. The penetrant penetrates the damage cavity until the pressure of the air trapped in the crack equals the capillary pressure before it starts to act. At this point, the maximum depth of penetration of the penetrant into the crack is reached. After sufficient time for penetration, the excess penetrant is removed from the surface. A developer, usually a white powder or developer spray, is then applied. This developer draws the penetrant out of the defects, creating visible indications. These indications can be examined by their size, shape and intensity [66]. The penetration testing process started with a surface penetration study of the specimens. To properly understand what defects the specimens have in their structure, one must start at the very top layer (Figure 3).
According to ISO 4386-3, the penetration test can detect various types of defects such as cracks, porosity and other surface defects [60]. This method is very effective in detecting open defects that extend to the surface and is therefore particularly suitable for white metal coatings. The choice of penetrant and developer depends on the specific application and the materials to be tested. It is very important to follow recognized standards and procedures for penetration testing, as indicated in literature sources such as ISO 4386-3. Adherence to these standards ensures that defects are consistently detected and evaluated, thus contributing to the overall quality control of white metal coatings.
The equipment used for the test, including software, is as follows:
  • MR® 67 water and solvent removable penetrant (red and fluorescent)—Type II and III, sensitivity level 2 (acc. EN ISO 3452:2) [67]; carrier medium water, Jumbo-Pen type (MR Chemie GmbH, Nordstraße 61–63, 59427 Unna, Germany).
  • MR® 70 solvent-based developer, carrier medium solvent; Jumbo-Pen type (MR Chemie GmbH, Nordstraße 61–63, 59427 Unna, Germany).
  • MR® 88 Penetrant remover and pre-cleaner; Class 2 according to AMS 2644; Method C according to EN ISO 3452-2; alcohol mixture, free of hydrocarbons (MR Chemie GmbH, Nordstraße 61–63, 59427 Unna, Germany).
  • UNI-T UT381 Luxmeter (0~20,000 Lux); high-precision digital visible light sensor with 8-bit microprocessor (Uni-Trend Technology (Dongguan) Limited, Dong Fang Da Dao, Bei Shan Dong Fang Industrial Development District, Hu Men Town, Dongguan City, Guang Dong Province, China).
  • Thermometer Testo 830-T4 (infrared −30 to +400 °C and Type K (NiCr-Ni) −50 to +500 °C); resolution—0.1 °C (Testo SE & Co. KGaA, Celsiusstraße 2, 79822 Titisee-Neustadt, Germany)
  • MATLAB ® software (MathWorks, 1 Apple Hill Drive, Natick, MA 01760-2098, USA).
In this study, a new generation of an innovative penetrator solution was tested by applying the penetrant to the surface using a marker-type pen instead of an aerosol spray. This method greatly facilitates the test itself, as the handling becomes very simple. The ergonomics of the test are also improved as the environment is not contaminated by the evaporation of the sprayed penetrant.
The workflow initiates with image acquisition and spatial calibration, where pixel-to-millimeter conversion using pixelPerMm is performed through user-defined reference distances using the ginput and sqrt functions. The image is converted into the CIE Lab* color space using rgb2lab, enhancing the separation of chromatic channels and enabling accurate color filtering, which is particularly effective for identifying pink indications from penetrant testing, allowing more accurate detection of colors via a* and b* channel filtering [68]. Masking is then performed with a function such as strel, and image preprocessing is conducted through morphological operations such as closing (imclose), hole filling (imfill) and area opening (bwareaopen), which remove noise, isolate relevant features and apply a circular mask to limit evaluation to a 100 mm diameter inspection area. The development of a custom code allowed the accurate identification and quantification of surface defects by analyzing the penetration indications developed by the penetration tests.
The evaluation workflow was structured into key steps: parameter initialization, image loading and calibration, defect segmentation, morphological processing, grouping, classification and compliance verification according to ISO 4386-3. Code snippets are provided to clarify the methodology.
Evaluation parameters and acceptance thresholds were defined according to ISO 4386-3 by the following code snippet:
evaluationLevel = 'B';
structuringElementSize = 10;
minRegionSize = 35;
pinkRange = [75 5 -15; 100 60 20];
groupingDistance = 2; % mm
aspectRatioThreshold = 3;
criteria = struct(...
    'A', struct('linearMax', 0, 'nonlinearMax', 3, 'areaPerDm2', 10), ...
    'B', struct('linearMax', 0, 'nonlinearMax', 4, 'areaPerDm2', 20), ...
    'C', struct('linearMax', 0, 'nonlinearMax', 5, 'areaPerDm2', 50), ...
    'D', struct('linearMax', 0, 'nonlinearMax', 6, 'areaPerDm2', 125), ...
    'E', struct('linearMax', 7, 'nonlinearMax', 8, 'areaPerDm2', 250));
crit = criteria.(evaluationLevel);
The analysis zone was calibrated using a known 100 mm diameter reference by
image = imread('sample_PT_image.jpg');
if isempty(pixelPerMm)
    figure; imshow(image); title('Click across 100 mm diameter');
    [x, y] = ginput(2);
    measuredPixels = sqrt((x(2)-x(1))^2 + (y(2)-y(1))^2);
    pixelPerMm = measuredPixels / 100;
    close;
end
The image was converted from RGB to CIE LAB. Indications were segmented based on a defined pink threshold. Morphological operations removed noise and filled small gaps by
labImage = rgb2lab(image);
pinkMask = (labImage(:,:,2) >= pinkRange(1,2) & labImage(:,:,2) <= pinkRange(2,2)) & ...
           (labImage(:,:,3) >= pinkRange(1,3) & labImage(:,:,3) <= pinkRange(2,3));
se = strel('disk', structuringElementSize);
pinkMask = imclose(pinkMask, se);
pinkMask = imfill(pinkMask, 'holes');
pinkMask = bwareaopen(pinkMask, minRegionSize);
Only indications within the 100 mm circular test area were considered by
[rows, cols, ~] = size(image);
centerX = cols / 2; centerY = rows / 2;
sampleRadiusPx = (100 / 2) * pixelPerMm;
[X, Y] = meshgrid(1:cols, 1:rows);
distFromCenter = sqrt((X - centerX).^2 + (Y - centerY).^2);
circularMask = distFromCenter <= sampleRadiusPx;
pinkMask = pinkMask & circularMask;
To avoid merged blobs, watershed segmentation was applied by
distanceTransform = -bwdist(~pinkMask);
distanceTransform(~pinkMask) = -Inf;
watershedMask = watershed(distanceTransform);
pinkMask(watershedMask == 0) = 0;
Connected components were labeled and their geometric properties extracted by
labeledMask = bwlabel(pinkMask);
stats = regionprops(labeledMask, 'Area', 'BoundingBox', ...
    'Centroid', 'MajorAxisLength', 'MinorAxisLength');
Indications were grouped if their bounding boxes were within the defined distance threshold by
minBoxDistance = @(b1,b2) sqrt( ...
   max(0, max(b1(1),b2(1)) - min(b1(1)+b1(3), b2(1)+b2(3)))^2 + ...
   max(0, max(b1(2),b2(2)) - min(b1(2)+b1(4), b2(2)+b2(4)))^2 );
groupLabels = 1:numel(stats);
changed = true;
while changed
    changed = false;
    for i = 1:numel(stats)
        for j = i+1:numel(stats)
            d = minBoxDistance(stats(i).BoundingBox, stats(j).BoundingBox) / pixelPerMm;
            if d <= groupingDistance && groupLabels(i) ~= groupLabels(j)
                minLabel = min(groupLabels(i), groupLabels(j));
                maxLabel = max(groupLabels(i), groupLabels(j));
                groupLabels(groupLabels == maxLabel) = minLabel;
                changed = true;
            end
        end
    end
end
Each indication was classified as linear, non-linear or grouped by
for k = 1:numel(stats)
    major = stats(k).MajorAxisLength / pixelPerMm;
    minor = stats(k).MinorAxisLength / pixelPerMm;
    area = stats(k).Area / (pixelPerMm^2);
    aspect = major / minor;
    if aspect >= aspectRatioThreshold
        shape = 'Linear';
        status = 'FAIL';
    elseif (major + minor)/2 > crit.nonlinearMax
        shape = 'Non-linear';
        status = 'FAIL';
    else
        shape = 'Non-linear';
        status = 'PASS';
    end
end
Measured values were compared against ISO 4386-3 acceptance limits by
sampleAreaDm2 = pi * (100/2)^2 / 10000;
indicatedAreaPerDm2 = sum([stats.Area]) / (pixelPerMm^2 * sampleAreaDm2);
if indicatedAreaPerDm2 > crit.areaPerDm2
    disp('FAIL: Area exceeds limit');
else
    disp('PASS: Within allowable limits');
end
Detected indications were visualized with bounding boxes by
imshow(image); hold on;
for i = 1:numel(stats)
    rectangle('Position', stats(i).BoundingBox, 'EdgeColor', 'r', 'LineWidth', 2);
    text(stats(i).BoundingBox(1), stats(i).BoundingBox(2)-10, ...
        num2str(i), 'Color', 'yellow', 'FontSize', 9, 'Font-Weight', 'bold');
end
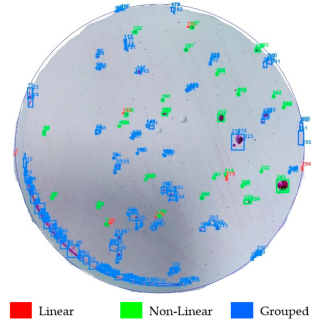
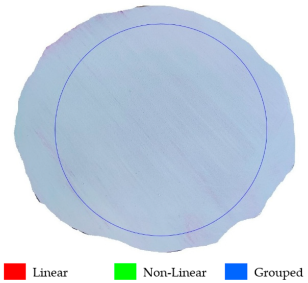
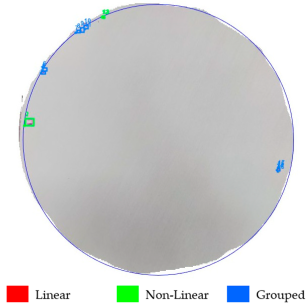
The MATLAB code developed allows automatic detection and measurement of defect areas. It detects different characteristics of the indications and calculates their exact size and location on the coated surface. This innovative approach not only simplifies the analysis process but also provides accurate and repeatable results. The ISO 4386-3 standard was chosen for the evaluation of defects, with level B as the evaluation criterion [60]. According to this, linear indication is not allowed, and non-linear indication is allowed up to a maximum diameter of 4 mm. Also, connected linear defects are not allowed, and there can be up to 4 non-linear defects in an area of 16 dm2. The maximum permissible defect area is 20 mm2 per 1 dm2 (Figure 4).
Using this developed MATLAB program code, it was possible to gain a better understanding of the porosity of white metal coatings, allowing informed decisions to be made regarding the quality of the coating and possible improvements. This approach represents a significant step forward in the field of quality control of white metal coatings, combining the power of numerical analysis with the insights gained from traditional testing methods. The test technique consists of applying a penetrant to the surface, which is left on the surface for 10 min for penetration, then wiping off the excess with a cleaner, and applying a chalk-based developer with a 10 min development time. The final assessment is performed after 30 min [67].
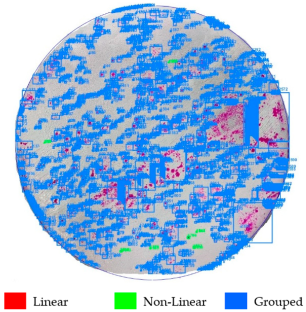
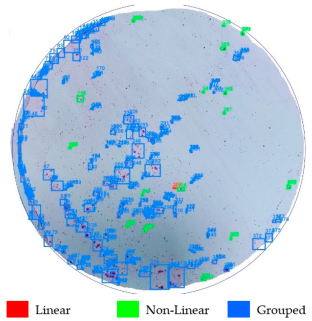
Figure 5 shows that some specimens (SC and FS) have a relatively high number of pores when viewed visually, so it is necessary to move this research to a level that provides numerical values. Each specimen is individually loaded into the MATLAB program code and analyzed using the Image Processing Tool. In short, the code with the tools performs image conversion, filtering, boundary detection, layering operations, calculations (Figure 6) and rendering of the image with marked indicators.
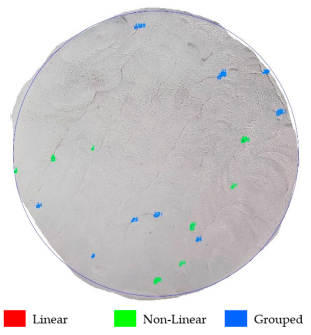
Initial penetration testing revealed the presence of porosity on the surface, but it was important to determine whether these defects extended deeper into the coating or were limited to the surface layers. A methodological approach was taken to address this problem. Firstly, the white-metal-coated specimens were thoroughly ground to remove the surface layers while retaining the underlying substrate. The grinding was carried out by abrading the white metal with a micron-grade mineral abrasive, specifically a 3M™ Trizact™ Cloth Roll 237AA abrasive (aluminum oxide) belt (3M, St. Paul, MN, USA), on a Scheppach BTS900 grinding machine (Scheppach GmbH, Günzburger Str. 69, D-89335 Ichenhausen, Germany). After the grinding process, the penetration test was repeated twice more on a perfectly smooth abraded white metal surface at different depths. Next, after grinding, the penetrators were retested on a completely flat white metal coating surface (Figure 7).
Interestingly, despite the better performance of the SC, the CW continues to be in near-perfect condition, with imperceptible porosity. This consistency demonstrates the robustness of the CW and highlights the need for further investigation (Figure 8) to identify the root causes of the differences between the other methods.
Visually, a significant difference in the final result can be observed, including small defects in the CW specimen, but the latter are excluded due to the characteristics of the process end, where unevenness due to the edge of the substrate is present, as the technology does not require fusion here.
The detailed analysis of porosity trends has provided valuable insights into white metal coating processes and will support further improvements in the future to ensure consistently high-quality coatings in a wide range of applications. The results of these subsequent retests provided critical insights into the depth and distribution of porosity. By assessing the presence of defects at different depths in the pavement, it was possible to distinguish whether the porosity was confined to the surface layers or whether it penetrated deeper into the coating.

2.2. Radiography Testing

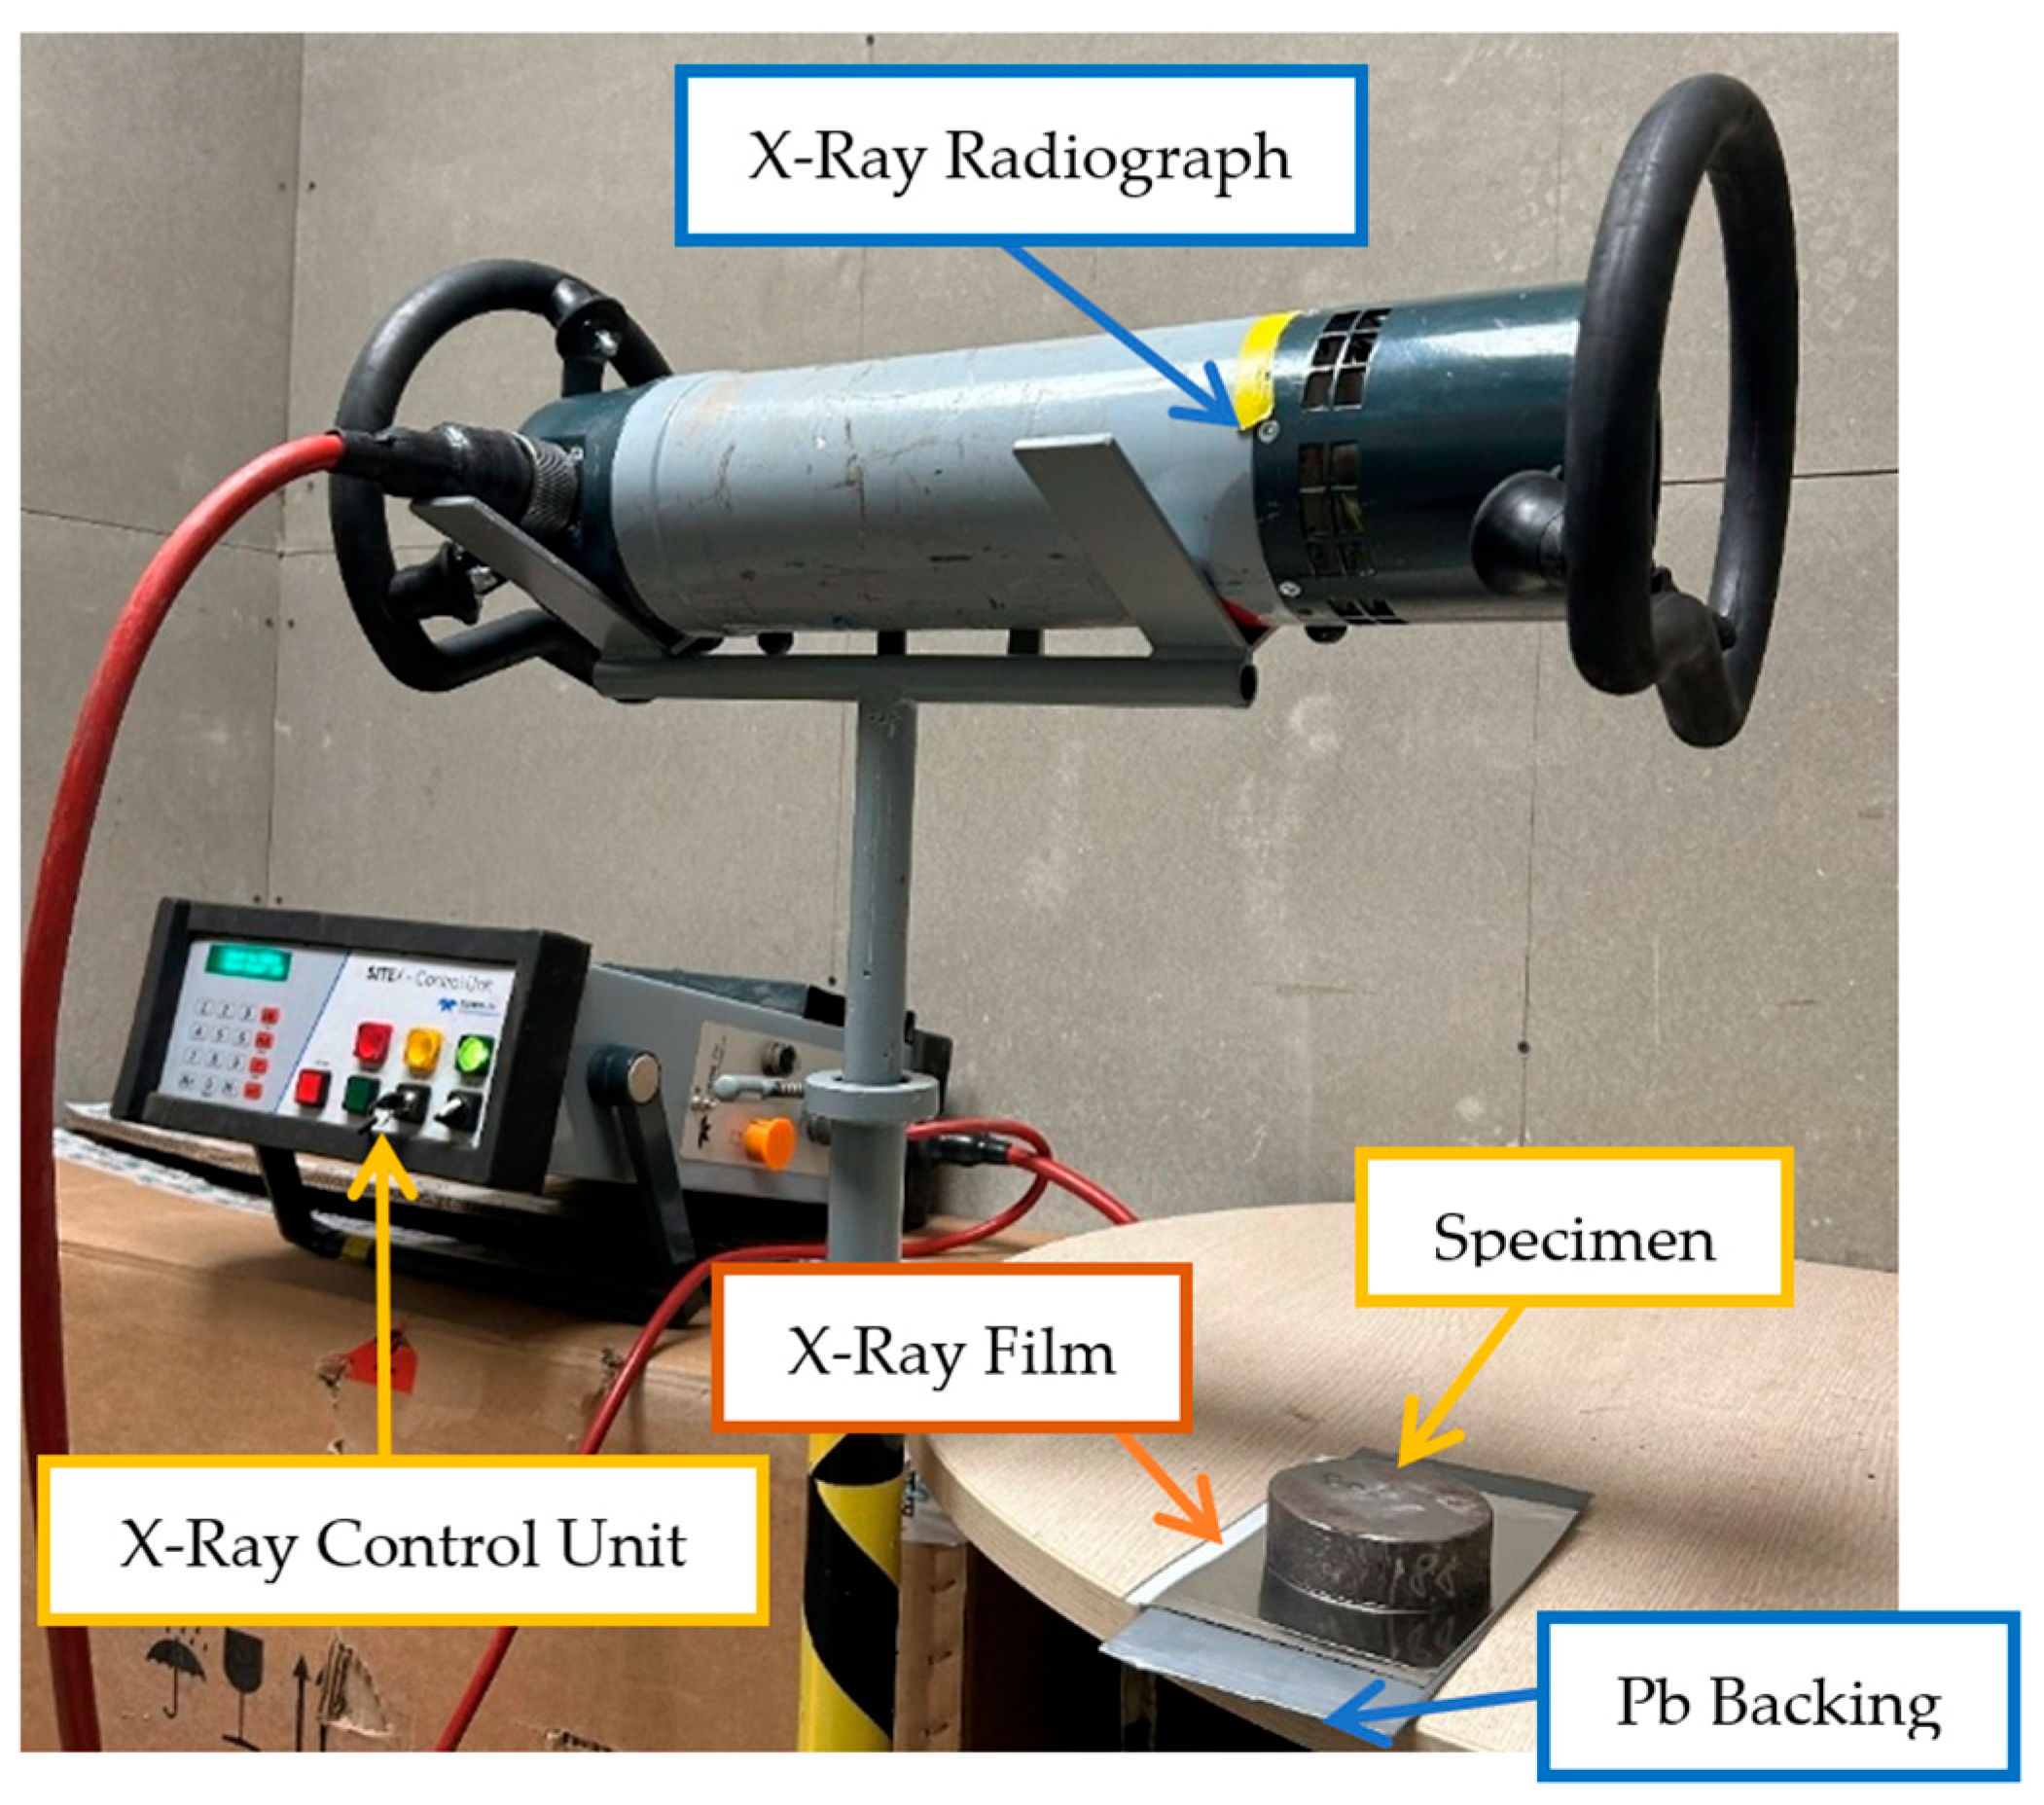
Radiography has a significant advantage over many other NDT methods because it does not require special surface preparation. In addition, the method is less sensitive to various deposits or dirt formed on the object being inspected. RT according to ISO 17636-1:2022 [57] plays an important role in the assessment of the internal structure and integrity of materials, and its implementation in this experiment involved the examination of the three different specimens previously considered: SC, FS and CW. This non-destructive testing method uses X-rays to penetrate the material, creating an image that can reveal internal defects, irregularities, voids or other abnormalities. The test was carried out in the X-ray department of the Metals Testing Laboratory of UAB IREMAS (Figure 9).
The X-ray examination provided a detailed picture of the internal structure of the white metal coatings and the metal substrate, allowing the identification of any possible defects that were not visible during the inspections of the surface and the interlayers. This method is particularly valuable in ensuring the reliability and safety of the coated components, as it allows the detection of internal defects that may affect the technical parameters of the coatings. The results of the RT examination provide valuable insights into the internal integrity of white metal coatings produced by different casting methods. This information is essential to assess the overall quality of the coatings and to further improve the casting processes to meet stringent industry standards and application requirements [68].
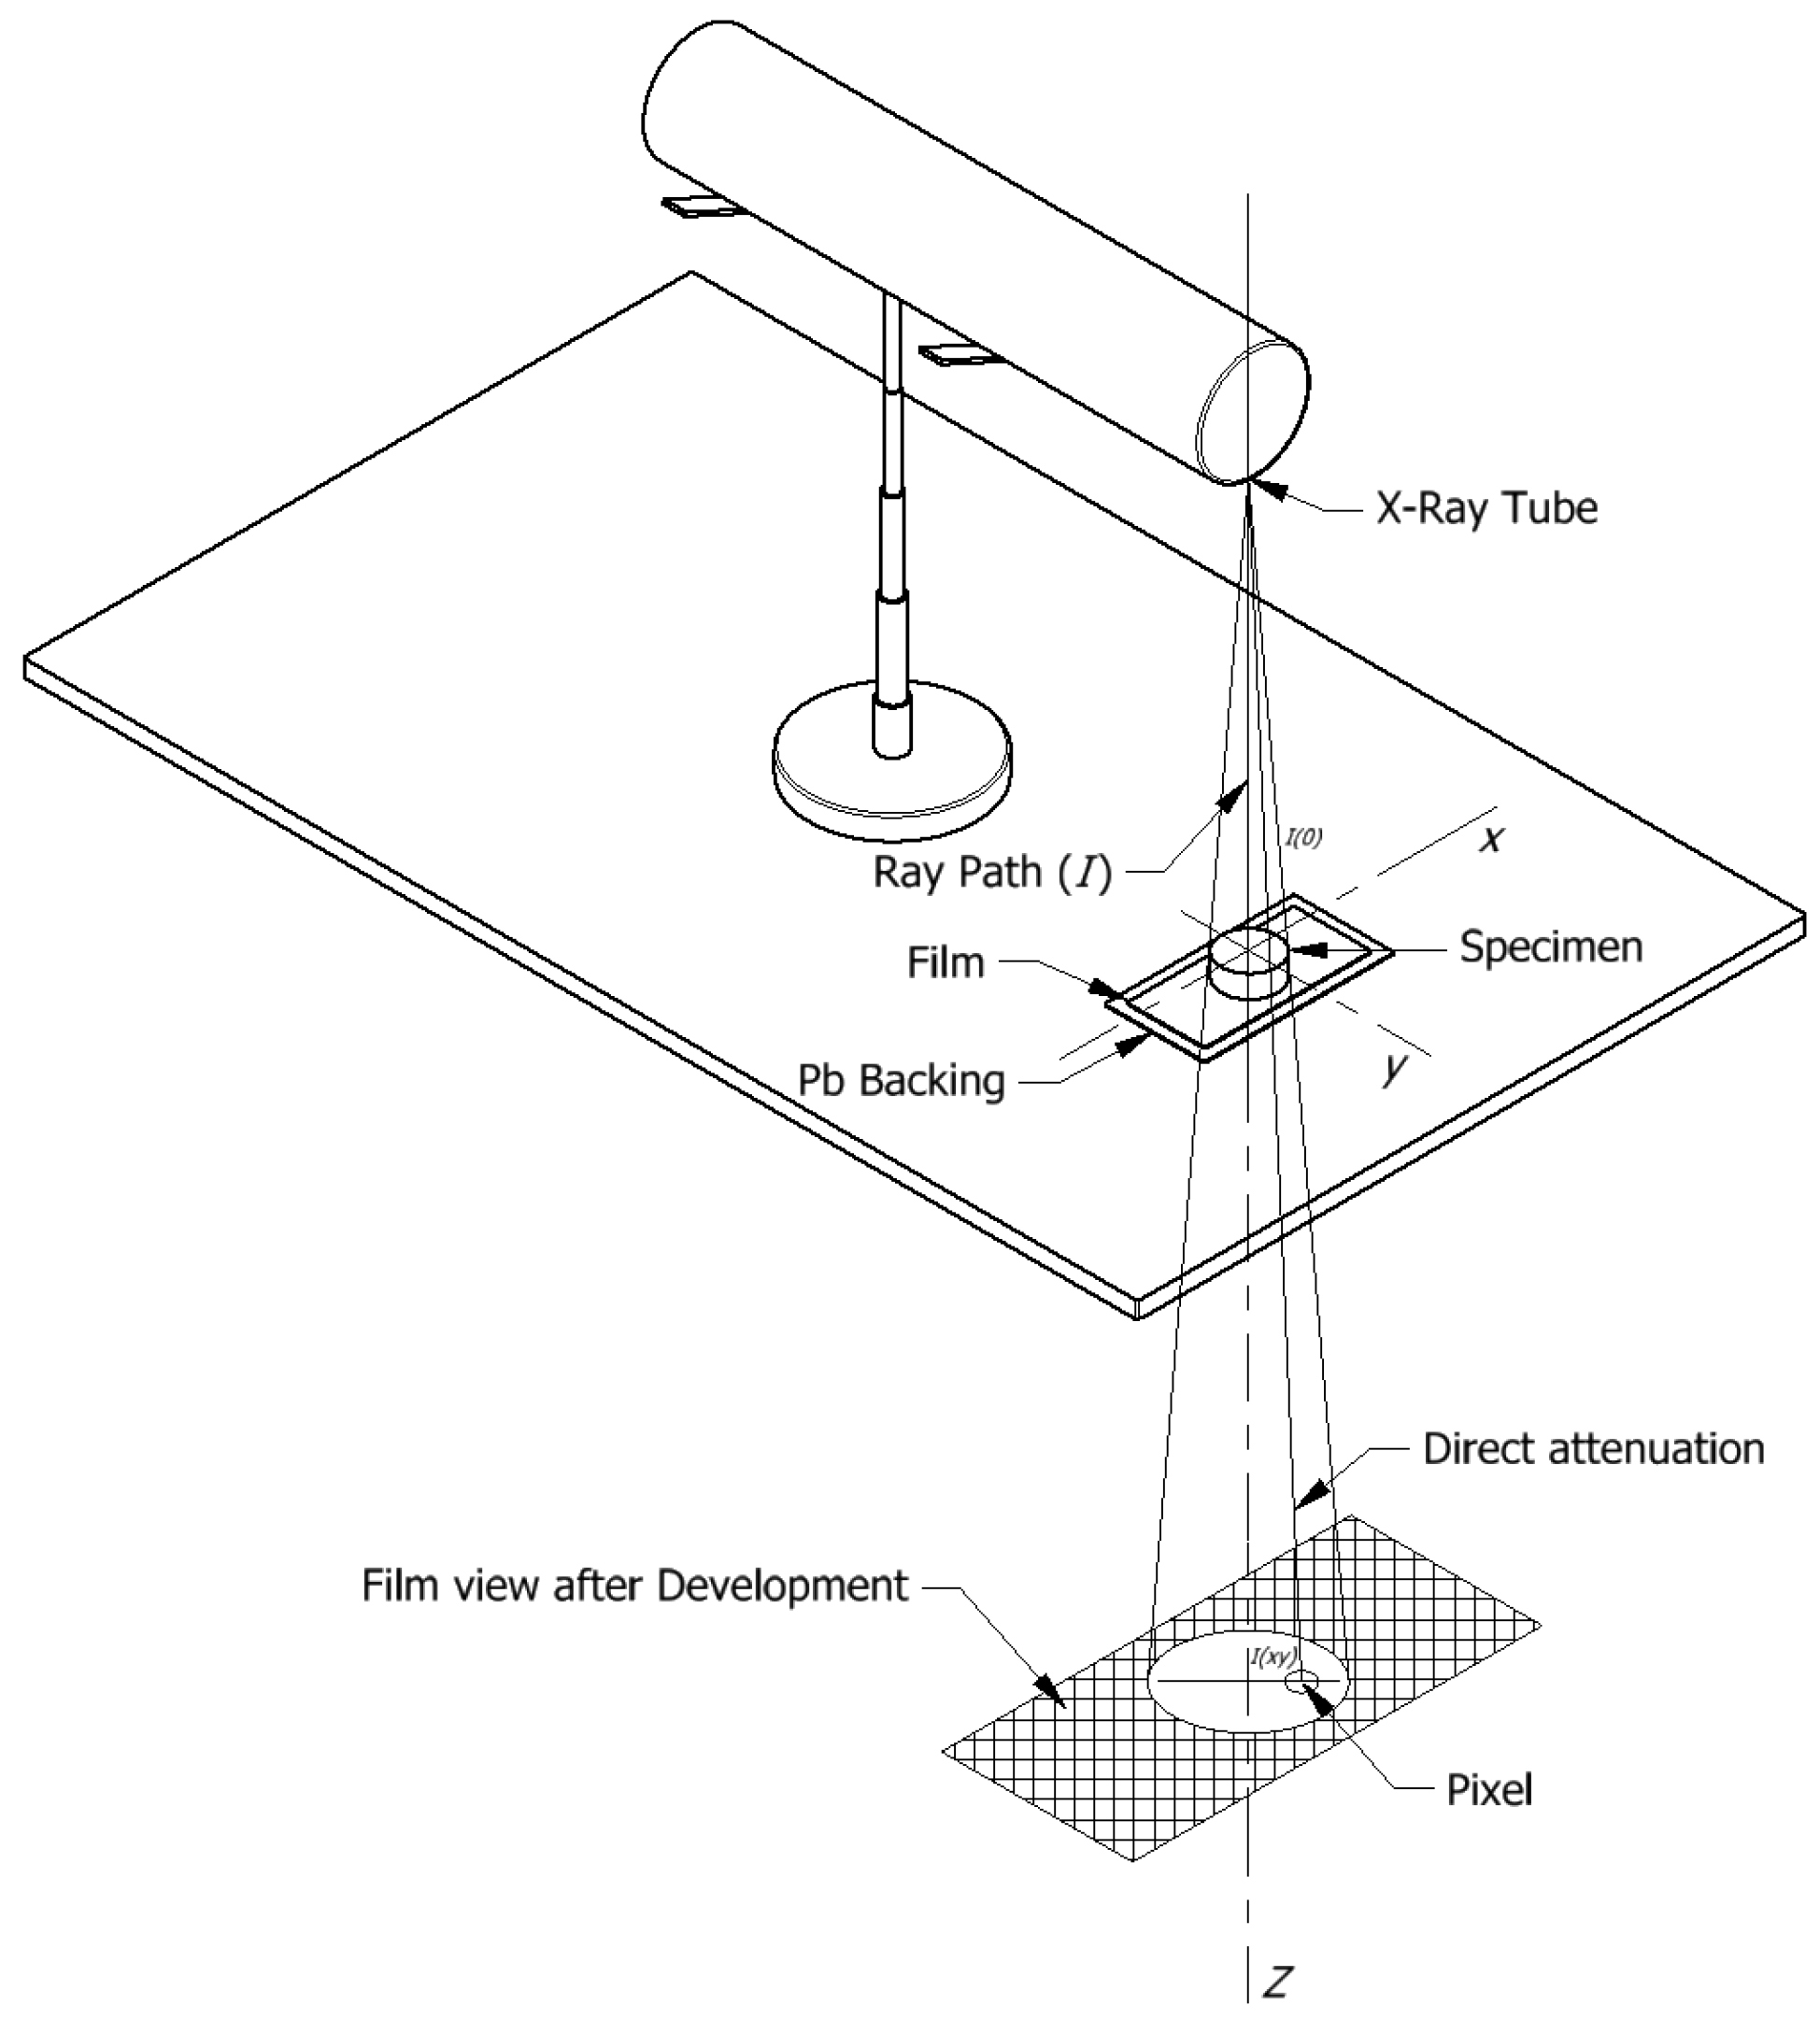
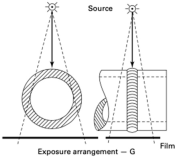
This experimental test relies on the principles of X-ray imaging to reveal the internal structure of materials. In our experiment, the X-ray generator played a key role in this process. An X-ray generator produces high-energy electromagnetic X-rays that pass through the material under investigation. The interaction of the X-rays with the internal structure of the material leads to different levels of attenuation, creating a shadow of the structure’s image on the film on the opposite side (Figure 10) [27].
The X-ray generator emits a controlled beam of X-rays that penetrates the object to be examined. Thicker and denser areas of the material absorb more X-rays and appear as darker areas on the highlighted film. Conversely, areas with less thickness or density transmit more X-rays, resulting in lighter areas on the film. This differential attenuation gives a detailed picture of the internal properties, including defects, irregularities and density changes [69]. For the radiographic testing in this experimental study, a special film is used to capture the X-ray image. The film, placed behind the specimen, captures the transmitted radiation, forming a latent image which becomes visible after development. The resulting radiograph is then analyzed for damage or structural problems in the material.
The combination of an X-ray generator and a special film for radiographic studies allows the internal structure of materials to be studied, providing valuable insights into the integrity and quality of the specimens tested. The equipment used in this test is given in Table 2, and the test parameters in Table 3.
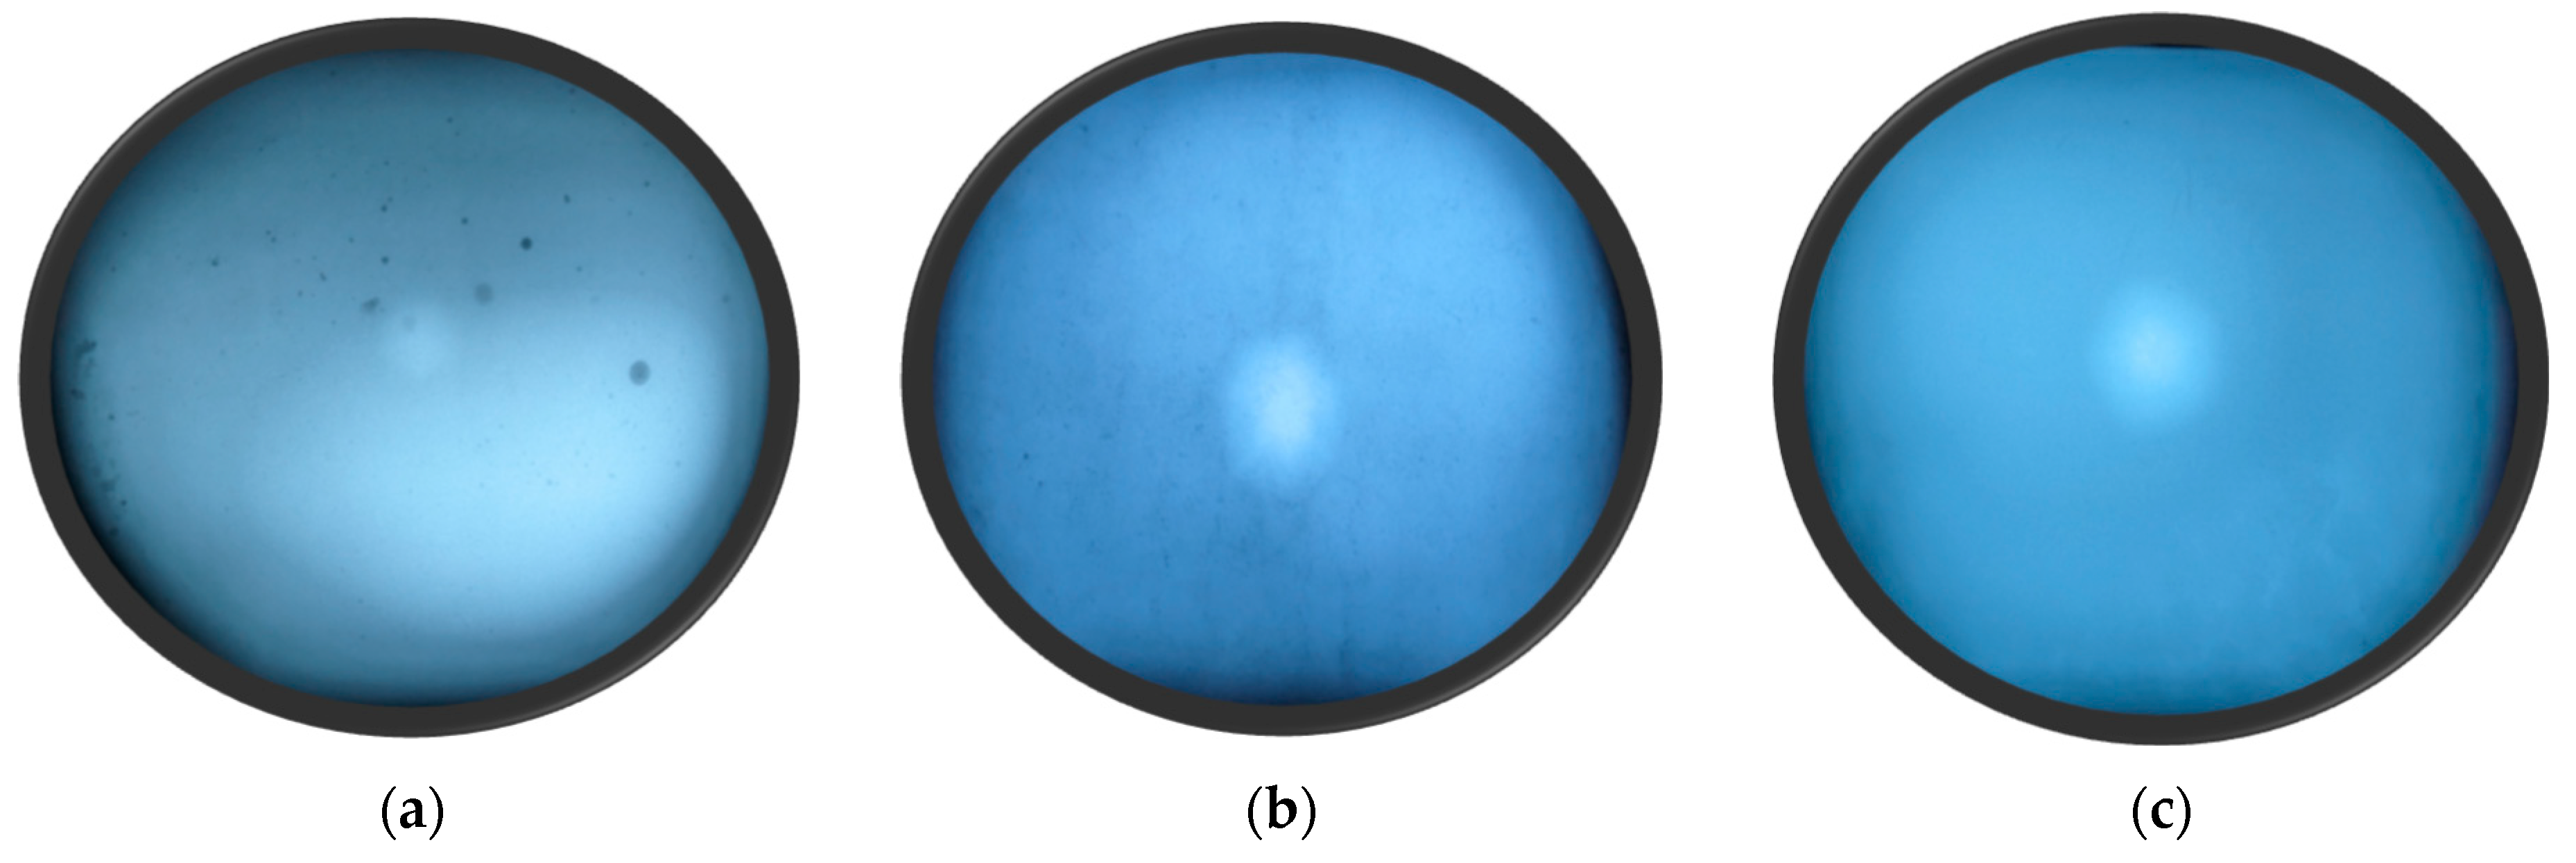
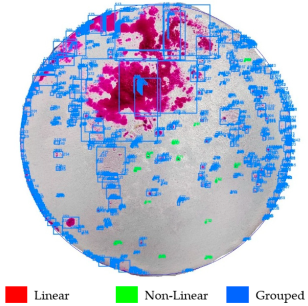
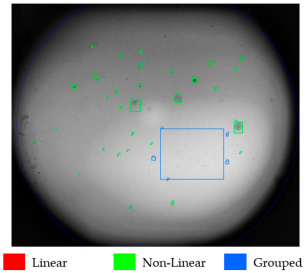
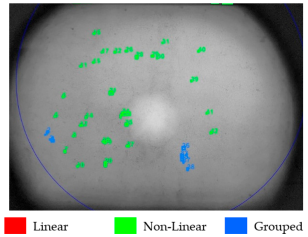
It is worth mentioning that the test is based on ISO 17636-1:2022 [57], even if it does not specify white metal in its scope. Although traditional radiographic testing (RT) using physical films is inherently a qualitative method and typically evaluated visually under a negatoscope, this study demonstrates that quantitative analysis is indeed possible through computational post-processing. While the standard EN ISO 10675-1 [70] remains oriented toward conventional weld inspection and visual interpretation, our work introduces a digital processing approach that enables defect quantification, classification and standards-based evaluation from captured physical radiographic films (Figure 11).
By enhancing grayscale contrast, applying adaptive histogram equalization and using image segmentation techniques, the captured film images are converted into analyzable datasets [71,72]. Although the optical density and lighting conditions during film scanning differ from negatoscope visualization, the method compensates by isolating relative contrast variations that correspond to defect morphology [73].
The RT workflow begins with image acquisition of scanned physical X-ray films, followed by spatial calibration, where pixel-to-millimeter conversion is performed using a reference distance marked by the user with the ginput and sqrt functions. Unlike penetrant testing, RT images are already in grayscale and thus do not require color space transformations. The image is contrast-enhanced using adapthisteq to improve the visibility of low-contrast internal features such as pores or inclusions [71,72]. Image inversion is then applied using imcomplement to highlight dark defect areas as bright regions. Segmentation is performed with imbinarize, tuned for high sensitivity to subtle gray-level differences often present in film-based radiography [73]. Morphological preprocessing follows, using structuring elements defined with strel and operations like hole filling (imfill), closing (imclose) and noise removal (bwareaopen) to clean the binary mask. A circular mask is applied to restrict the evaluation to a defined inspection zone, typically 100 mm in diameter, using meshgrid and radial distance calculation (sqrt) to generate the spatial filter. The development of a custom MATLAB code enabled the automated detection and quantification of internal defects, such as voids or inclusions, based on grayscale density variations in scanned radiographic films, offering a reliable and standards-compliant approach for evaluating journal bearing quality under ISO 4386-3.
The radiographic evaluation process included the key steps of preprocessing, adaptive thresholding, morphological filtering, grouping and classification.
Evaluation parameters were defined to increase sensitivity to small and low-contrast indications by the following code snippet:
evaluationLevel = 'B';
structuringElementSize = 15;
minRegionSize = 15;
minRegionArea_mm2 = 0.035;
maxRegionArea_mm2 = 1500;
minCompactness = 0.1;
minGroupSpan_mm = 2;
minGroupSize = 4;
groupingDistance = 2;
aspectRatioThreshold = 3;
minContrast = 3.5;
criteria = struct( ...
    'A', struct('linearMax', 0, 'nonlinearMax', 3, 'areaPerDm2', 10), ...
    'B', struct('linearMax', 0, 'nonlinearMax', 4, 'areaPerDm2', 20), ...
    'C', struct('linearMax', 0, 'nonlinearMax', 5, 'areaPerDm2', 50), ...
    'D', struct('linearMax', 0, 'nonlinearMax', 6, 'areaPerDm2', 125), ...
    'E', struct('linearMax', 7, 'nonlinearMax', 8, 'areaPerDm2', 250));
crit = criteria.(evaluationLevel);
Images were converted to grayscale and calibrated against a known 100 mm reference diameter by
image = imread('sample_RT_image.png');
if size(image,3) == 3, image = rgb2gray(image); end
grayImage = image;
if isempty(pixelPerMm)
    figure; imshow(image); title('Click 2 points across 100 mm');
    [x, y] = ginput(2);
    pixelPerMm = sqrt((x(2)-x(1))^2 + (y(2)-y(1))^2) / 100;
    close;
end
Adaptive histogram equalization and local thresholding improved indication visibility by
enhanced = adapthisteq(image);
inverted = imcomplement(enhanced);
bw = imbinarize(inverted, 'adaptive', 'Sensitivity', 0.2);
se = strel('disk', structuringElementSize);
bw = imclose(bw, se);
bw = imfill(bw, 'holes');
bw = bwareaopen(bw, minRegionSize);
Only the 100 mm circular zone was analyzed by
[rows, cols] = size(bw);
center = [cols, rows] / 2;
[X,Y] = meshgrid(1:cols, 1:rows);
r = sqrt((X - center(1)).^2 + (Y - center(2)).^2);
bw(r > (50 * pixelPerMm)) = 0;
Merged regions were separated using a distance-based watershed transform by
D = -bwdist(~bw); D(~bw) = -Inf;
L = watershed(D); bw(L==0) = 0;
Candidate indications were filtered based on size, compactness and local contrast by
labeled = bwlabel(bw);
stats = regionprops(labeled, 'Ar-ea','BoundingBox','Centroid','MajorAxisLength', ...
    'MinorAxisLength','Perimeter','PixelIdxList');
areas_mm2 = [stats.Area] / pixelPerMm^2;
compactness = (4 * pi * [stats.Area]) ./ ([stats.Perimeter].^2);
valid = [];
for i = 1:numel(stats)
    pix = stats(i).PixelIdxList;
    regionVals = double(grayImage(pix));
    borderMask = imdilate(labeled == i, strel('disk',2)) & ~(labeled == i);
    backgroundVals = double(grayImage(borderMask));
    if isempty(regionVals) || isempty(backgroundVals), continue; end
    contrastDiff = abs(mean(regionVals) - mean(backgroundVals));
    if areas_mm2(i) >= minRegionArea_mm2 && areas_mm2(i) <= maxRegionArea_mm2 && ...
            compactness(i) > minCompactness && contrastDiff >= minContrast
        valid(end+1) = i;
    end
end
stats = stats(valid);
labeled = ismember(labeled, valid);
Indications were merged into groups if within a 2 mm threshold by
groupLabels = 1:numel(stats);
minBoxDistance = @(b1, b2) sqrt( ...
    max(0, max(b1(1), b2(1)) - min(b1(1)+b1(3), b2(1)+b2(3)))^2 + ...
    max(0, max(b1(2), b2(2)) - min(b1(2)+b1(4), b2(2)+b2(4)))^2 );
changed = true;
while changed
    changed = false;
    for i = 1:numel(stats)
        for j = i+1:numel(stats)
            d = minBoxDistance(stats(i).BoundingBox, stats(j).BoundingBox) / pixelPerMm;
            if d <= groupingDistance && groupLabels(i) ~= groupLabels(j)
                minLabel = min(groupLabels(i), groupLabels(j));
                groupLabels(groupLabels == groupLabels(j)) = minLabel;
                changed = true;
            end
        end
    end
end
Regions were classified as linear, non-linear or grouped by
for g = unique(groupLabels)
    idx = find(groupLabels == g);
    coords = reshape([stats(idx).Centroid], 2, []).';
    span_mm = max(pdist(coords)) / pixelPerMm;
    if numel(idx) >= minGroupSize && span_mm >= minGroupSpan_mm
        shape = "Grouped"; status = "FAIL (Grouped)";
    else
        for k = idx
            major = stats(k).MajorAxisLength / pixelPerMm;
            minor = stats(k).MinorAxisLength / pixelPerMm;
            aspect = major / minor;
            shape = "Non-linear"; status = "PASS"; sizeVal = (major + minor)/2;
            if aspect >= aspectRatioThreshold && major > 2
                shape = "Linear"; sizeVal = major; status = "FAIL";
            elseif sizeVal > crit.nonlinearMax
                status = "FAIL";
            end
        end
    end
end
Detected indications were visualized with bounding boxes and color coding by
imshow(image); hold on;
for i = 1:length(results)
    box = results(i).BoundingBox;
    switch results(i).Shape
        case "Linear", col = [1 0.2 0.2];
        case "Non-linear", col = [0.2 1 0.2];
        case "Grouped", col = [0.2 0.5 1];
        otherwise, col = [0.8 0.8 0.8];
    end
    rectangle('Position', box, 'EdgeColor', col, 'LineWidth', 2);
    text(box(1), box(2)-10, num2str(results(i).Index), 'Color', col, ...
         'FontSize', 9, 'FontWeight', 'bold');
end

3. Results

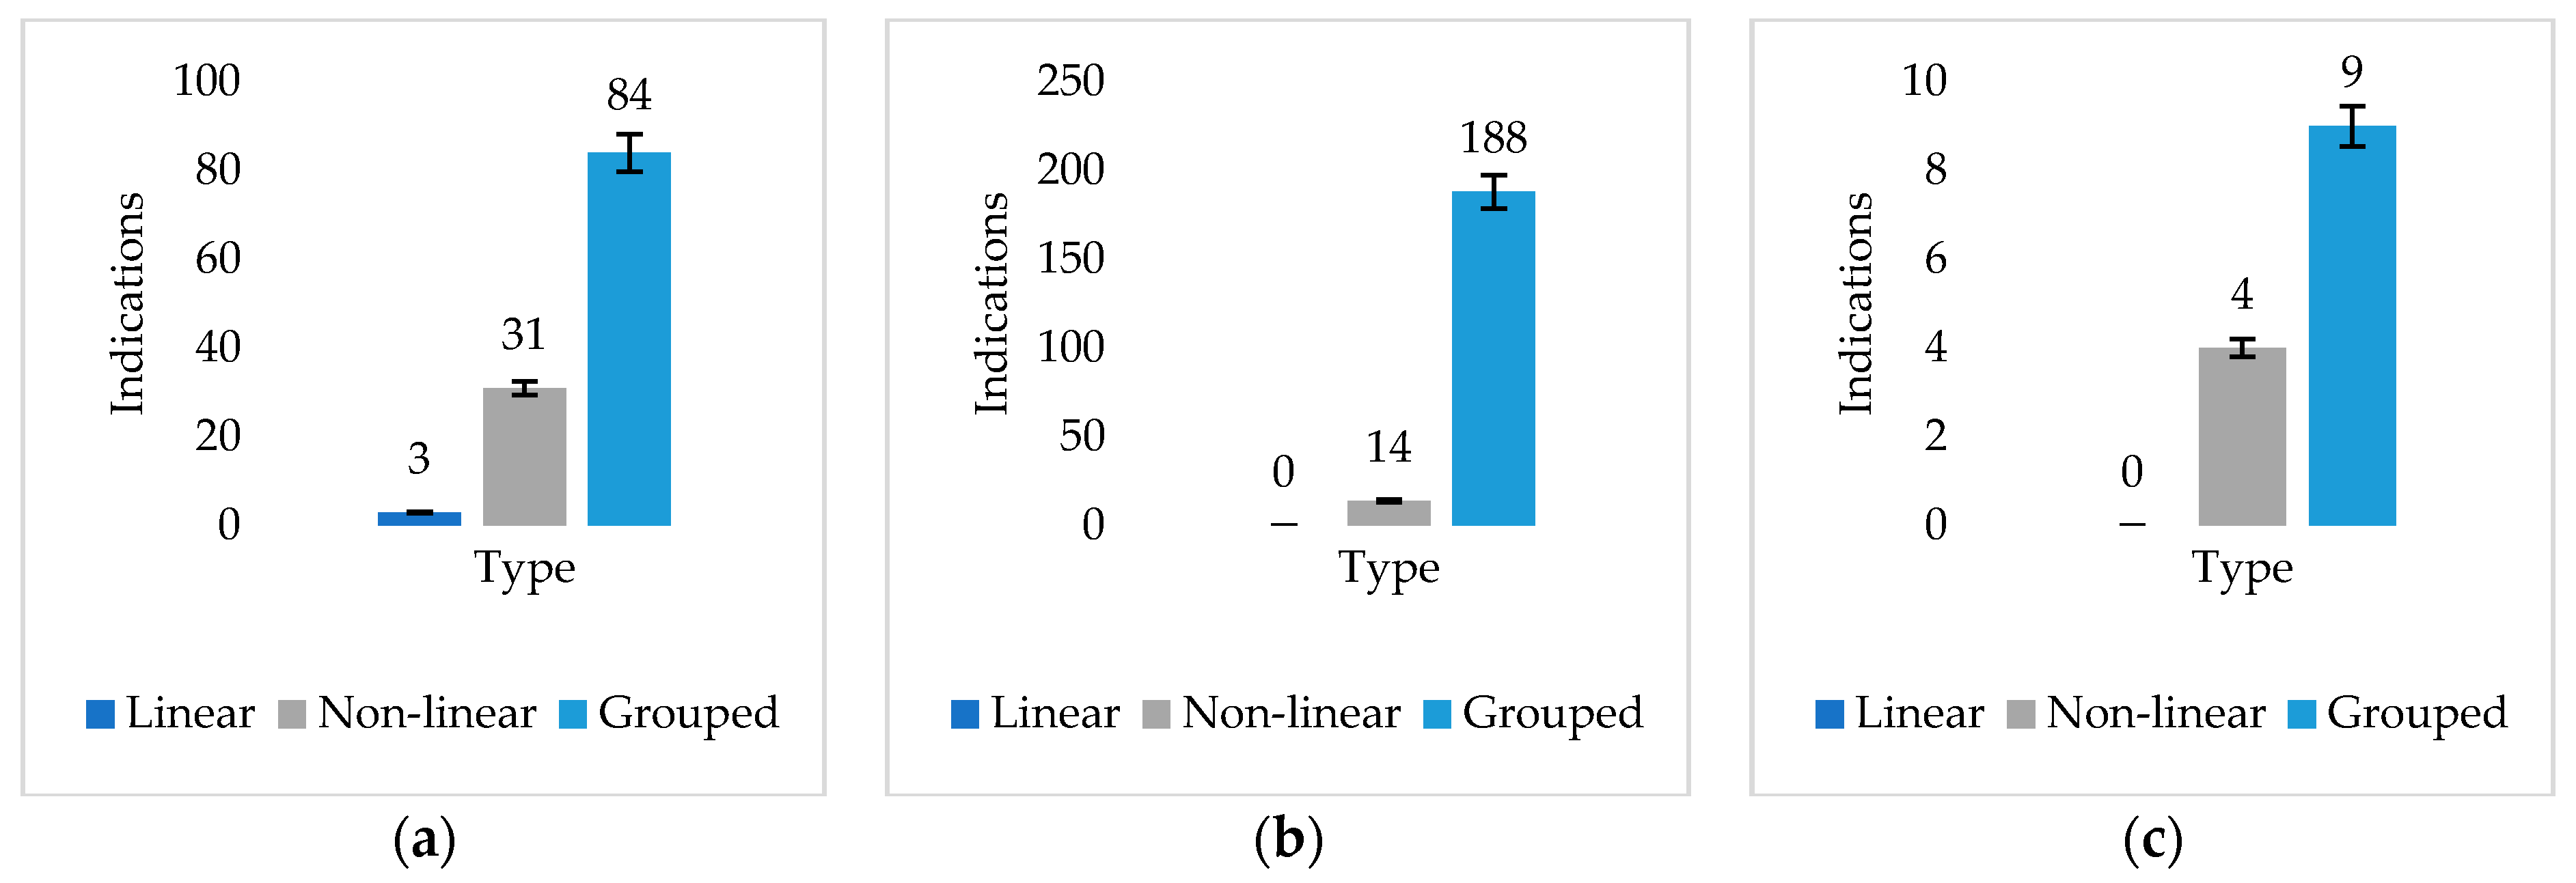
The obtained results showed that the reconstructed and processed images significantly improved the interpretability and measurability of defects, rather than solely enhancing their detectability [74]. The system’s primary strength lies in its ability to transform raw inspection data—whether from radiographic films or penetrant-tested surfaces—into structured, measurable outputs aligned with acceptance criteria from ISO 4386-3 (Table 4 and Figure 12) [60]. By isolating and quantifying defect parameters such as area (mm2), count per dm2, geometry (linear, non-linear, grouped), and spatial relationships between indications, the method enables consistent and repeatable pass/fail assessments based on standard-defined thresholds. For example, non-linear indication density and grouped span violations are automatically calculated and evaluated per level-specific limits, removing ambiguity and reducing human error in manual interpretation [75]. This approach ensures objective and documented decision-making, especially in complex cases like journal bearing inspection, where traditional visual methods struggle to consistently count, group and classify indications across surfaces [75,76]. While not optimized for detecting the smallest or faintest defects, the system excels in formalizing the evaluation process—offering a scalable solution for regulated manufacturing environments where compliance and repeatability take precedence over pure detection sensitivity [75].
The results of the penetrant tests provided key insights into the porosity levels of white metal coatings produced by different methods. These findings are very important for assessing the quality and structural integrity of the coatings. Firstly, the surface porosity of the specimen created directly from the crucible by static casting was 2852.33 mm2 per dm2. This high porosity indicates that the coating is defective. This suggests that the SC method may need to be further optimized to reduce porosity and improve the overall quality of the white metal coating. In contrast, the coating produced using the FS method had a higher porosity of 2866.98 mm2 per dm2. While the FS method exhibited a marginally higher surface porosity value compared to the SC method (2866.98 vs. 2852.33 mm2/dm2), this difference of 14.65 mm2/dm2 falls within the expected measurement uncertainty of the MATLAB-based analysis system. Therefore, the distinction between the two methods cannot be attributed solely to porosity magnitude. Instead, the FS specimens demonstrated a more uniform distribution of pores across the surface, whereas the SC specimens showed extensive merging of pores into large localized clusters. Such clustering is more detrimental to coating performance, as it creates zones of concentrated weakness that may act as initiation sites for crack propagation and accelerated wear. Thus, despite the slightly higher porosity value, the FS method was considered comparatively superior in terms of defect distribution and coating uniformity. However, further improvements can be made to reduce porosity and improve the performance of the coating. The CW method produced a surface with a porosity of 8.82 mm2/dm2. This value lies well below the ISO 4386-3 level B acceptance threshold of 20 mm2/dm2, thereby classifying the specimen as compliant and of high quality. Compared to the SC and FS methods, which exceeded the acceptance criteria by a considerable margin, the CW method demonstrates exceptional effectiveness in minimizing surface porosity. The test results after casting are shown in Table 5.
Additional studies have been carried out to better understand the depth and extent of porosity in white metal coatings. As in the original test, the porosity remained when the layer structure was opened up, but it is worth noting that this time it is visually much smaller. For a fair comparison, the calculations were again performed in MATLAB (Table 6).
The retest showed a significant reduction in the porosity level of the white-metal-coated specimens. Previously, the surface porosity was measured at 243.63 mm2 per dm2 for SC and 533.53 mm2 per dm2 for FS. However, after subsequent grinding and penetrant testing at different coating depths, the porosity of both methods was reduced to values of approximately 8.5% and 18.6% of primary porosity. This reduction in porosity in the SC specimen is a promising development, indicating that grinding has had a positive effect in reducing surface defects. Nevertheless, caution must be exercised in interpreting these results, as it is necessary to assess whether this trend is consistent and to investigate all the main factors contributing to the observed changes.
Following the final surface grinding, the penetrant testing revealed that the CW (coated workpiece) maintained an exceptionally uniform surface with no visible porosity indications, confirming its structural consistency and coating integrity. In contrast, the SC and FS exhibited a higher density of indications, suggesting variability in application quality. This outcome underlines the mechanical robustness of the CW and indicates the necessity for further investigation into the origin of surface discrepancies observed across other specimens (Table 7).
In summary, a deeper investigation of the white-metal-coated specimens revealed a promising trend of decreasing porosity levels. Upon reassessment, it became evident that the porosity decreased significantly as the layers of cover were penetrated. In particular, the SC method now shows a low porosity of 62.25 mm2 per dm2, which is a high benchmark achieved compared to the original measurements. Similarly, the FS method, which had a porosity of 533.53 mm2 per dm2 in the previous tests, has achieved a porosity of 402.57 mm2 per dm2 at a greater depth of the coating, which means flame soldering technology develops high porosity at all depths. These findings indicate variations in the coating process that result in coatings with higher surface defects. At the same time, the CW method has consistently demonstrated outstanding performance, maintaining a porosity of 17.15 mm2 per dm2 at the final test, despite indications being from specimen borders, where non-fusion is inevitable (Figure 13). It is important to note that these results reflect the porosity of the coating layers and do not consider possible other defects between the different layers.
The differences in porosity between the methods underline the need for further research to pinpoint the underlying factors responsible for these discrepancies. Although a decrease in porosity is observed at different depths, the SC and FS specimens did not meet the quality parameters set out in ISO 4386-3 level B, where non-linear defects can be present up to a maximum of 4 units per 16 dm2 and the maximum possible defect area is 20 mm2 per 1 dm2 [60]. Although the CW specimen highlighted the incomparable differences of the clad welding method, for the highest quality, it is necessary to carry out internal defect testing without destroying the specimens, i.e., without grinding. This would check that the specimens do not have hidden defects that the penetration test did not reveal. To achieve this goal, a radiographic examination was performed.
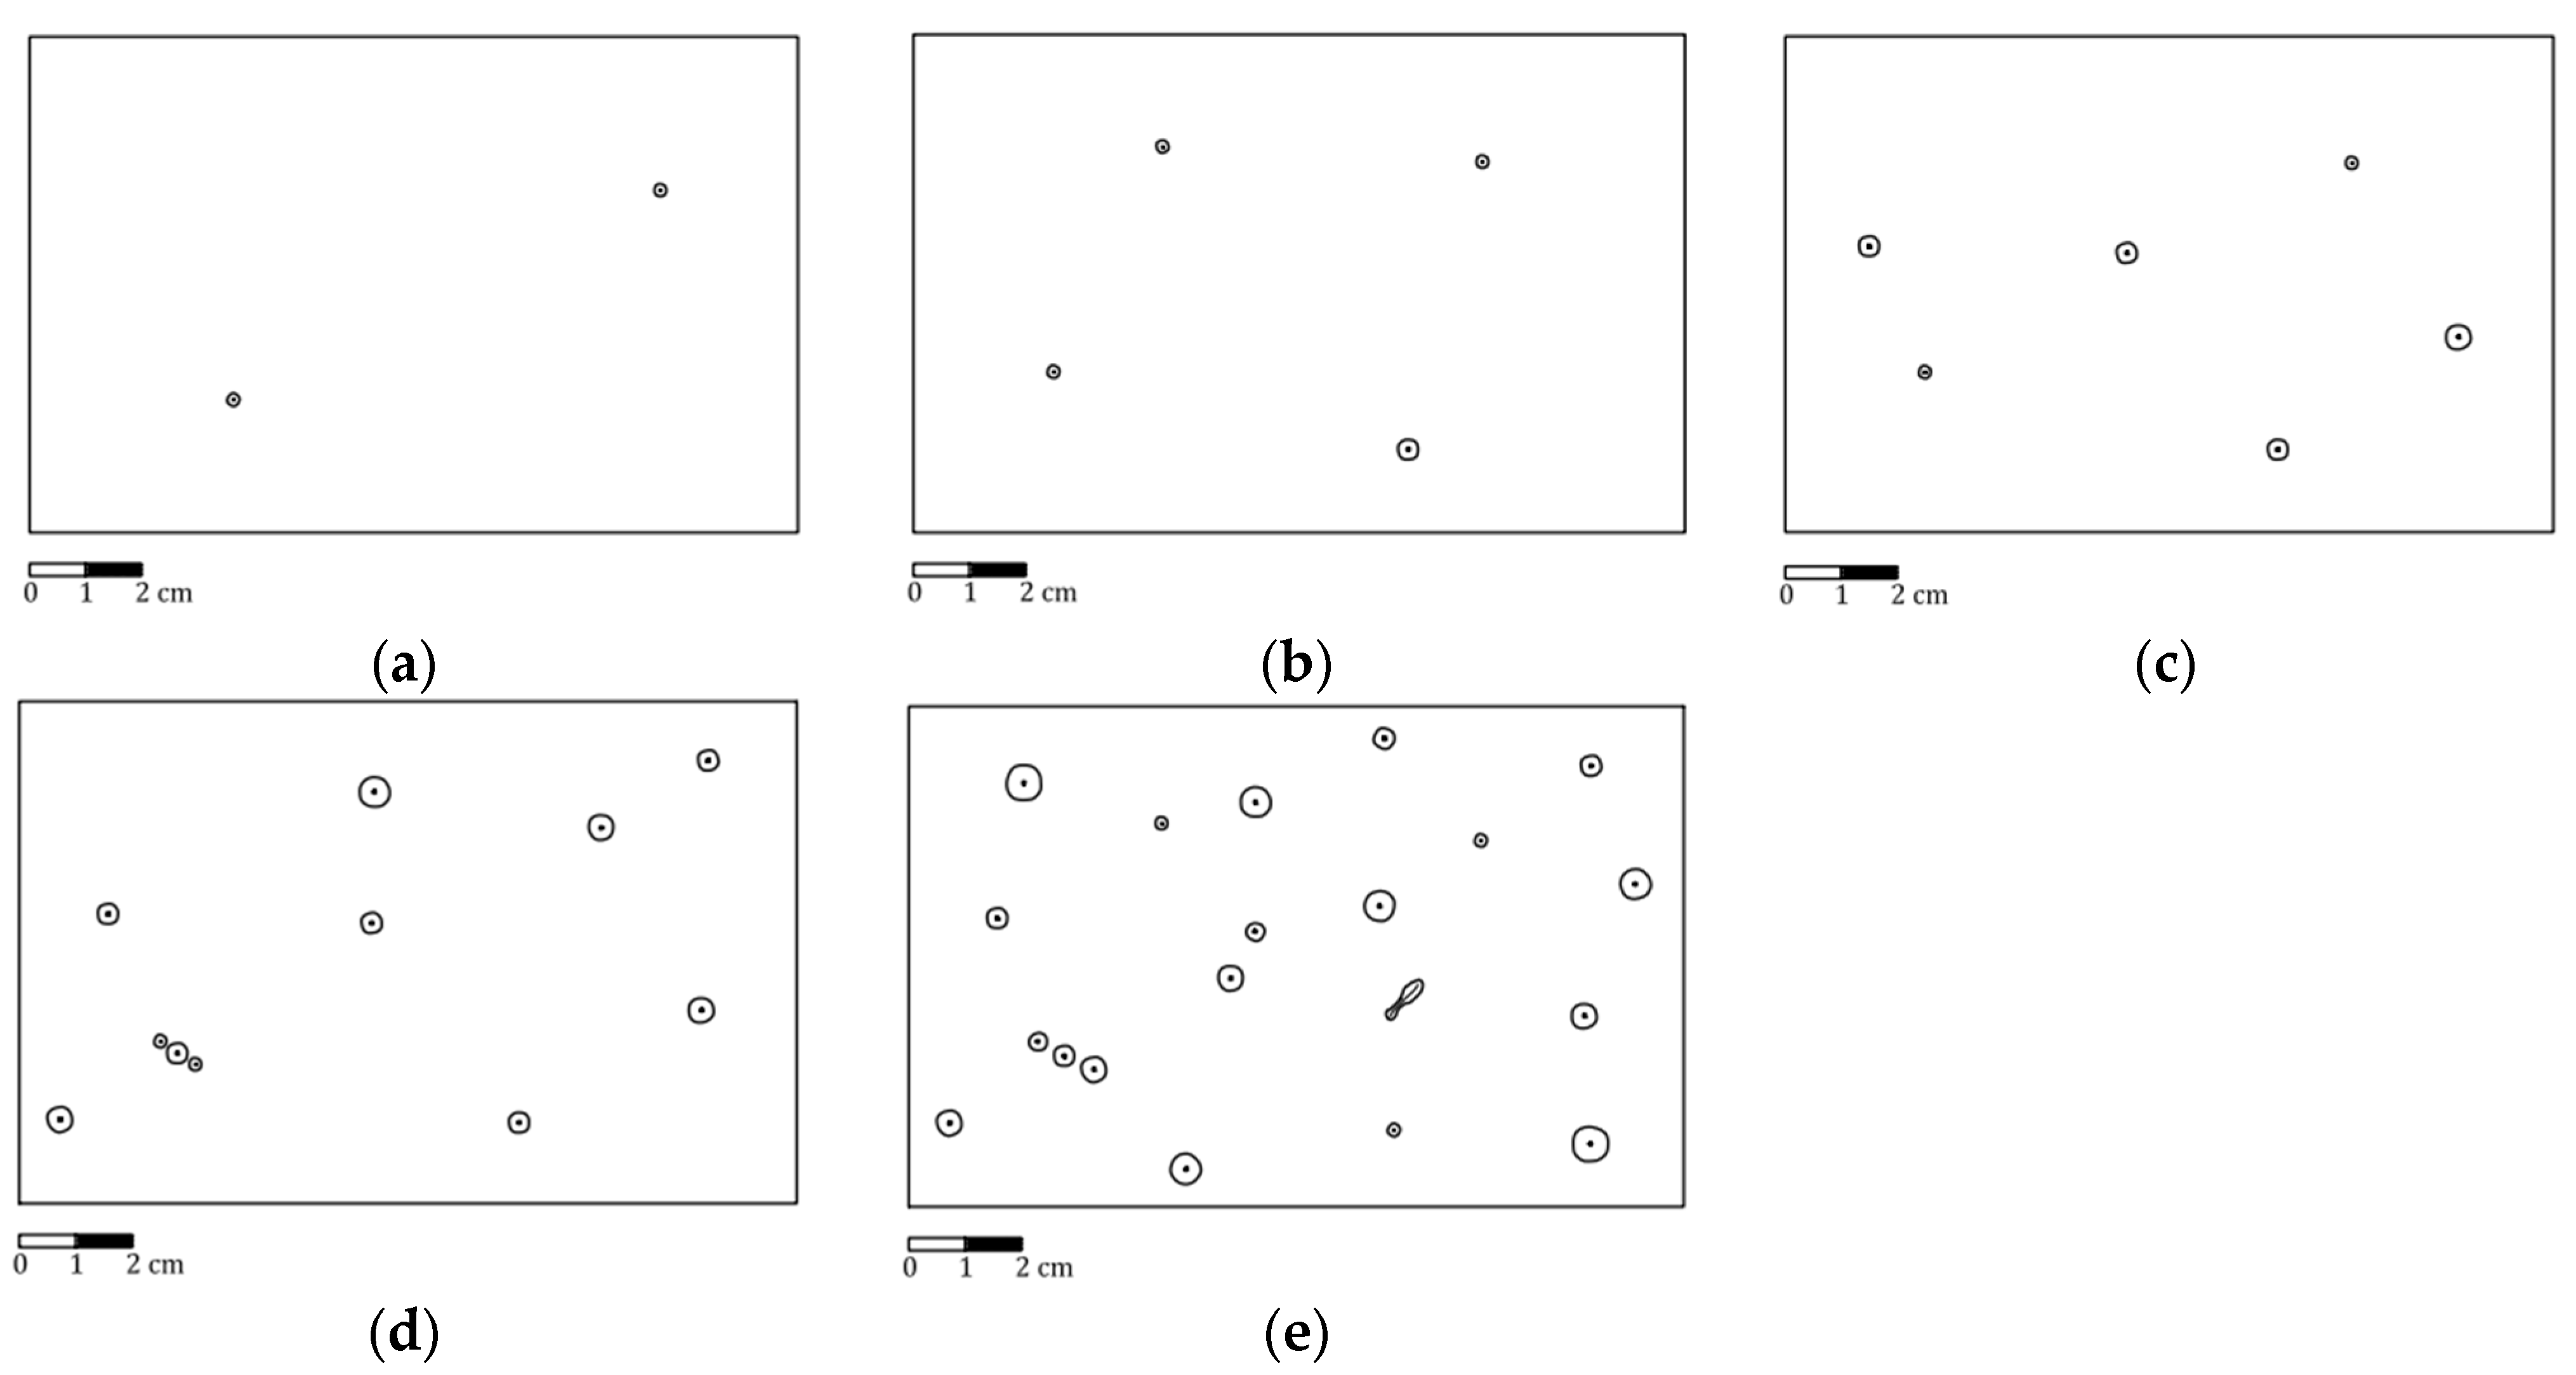
Just as the penetration test showed high porosity in the SC and FS specimens, the RT shows a similar trend. However, in this experiment, the specimens cast using the FS and SC methods show a relatively lower number of indications than the surface defect analysis. The FS specimen does not show any change in the type of indications, but is characterized by fine pores, which are more difficult to see in a digital image than in an analog image. The SC specimen is characterized by pores of large diameter on the outside as well as on the inside but does not exhibit large accumulations as seen on the surface. Compared to the penetration test, the image seen in the photographs can be compared to the SC specimen in Table 3 and the FS specimen in Table 4. The specimen coated with a tungsten electrode in an inert gas environment continues to exhibit perfect quality with zero indications (Table 8).
In summary, this method did not reveal unknown defects, but confirmed the results of the previous method by analyzing the different interlayers, and showed that surface irregularities are not reflected in the X-ray photographs, and it was hypothesized that the X-rays overlap the indications, so that random indications are visible in the different layers. It can be argued that both surface defect detection and non-destructive inspection methods for internal defects are necessary for a correct assessment.

4. Discussion

The penetration test shows marked differences, whereas the CW specimen is almost perfect, with no pores. In contrast, the FS method is characterized by high porosity, while the SC coating is characterized not only by high porosity but also by the grouping of pores into localized areas. The X-ray examination confirms the results of the penetration test and does not reveal any other defects such as cracks or heterogeneities [77].
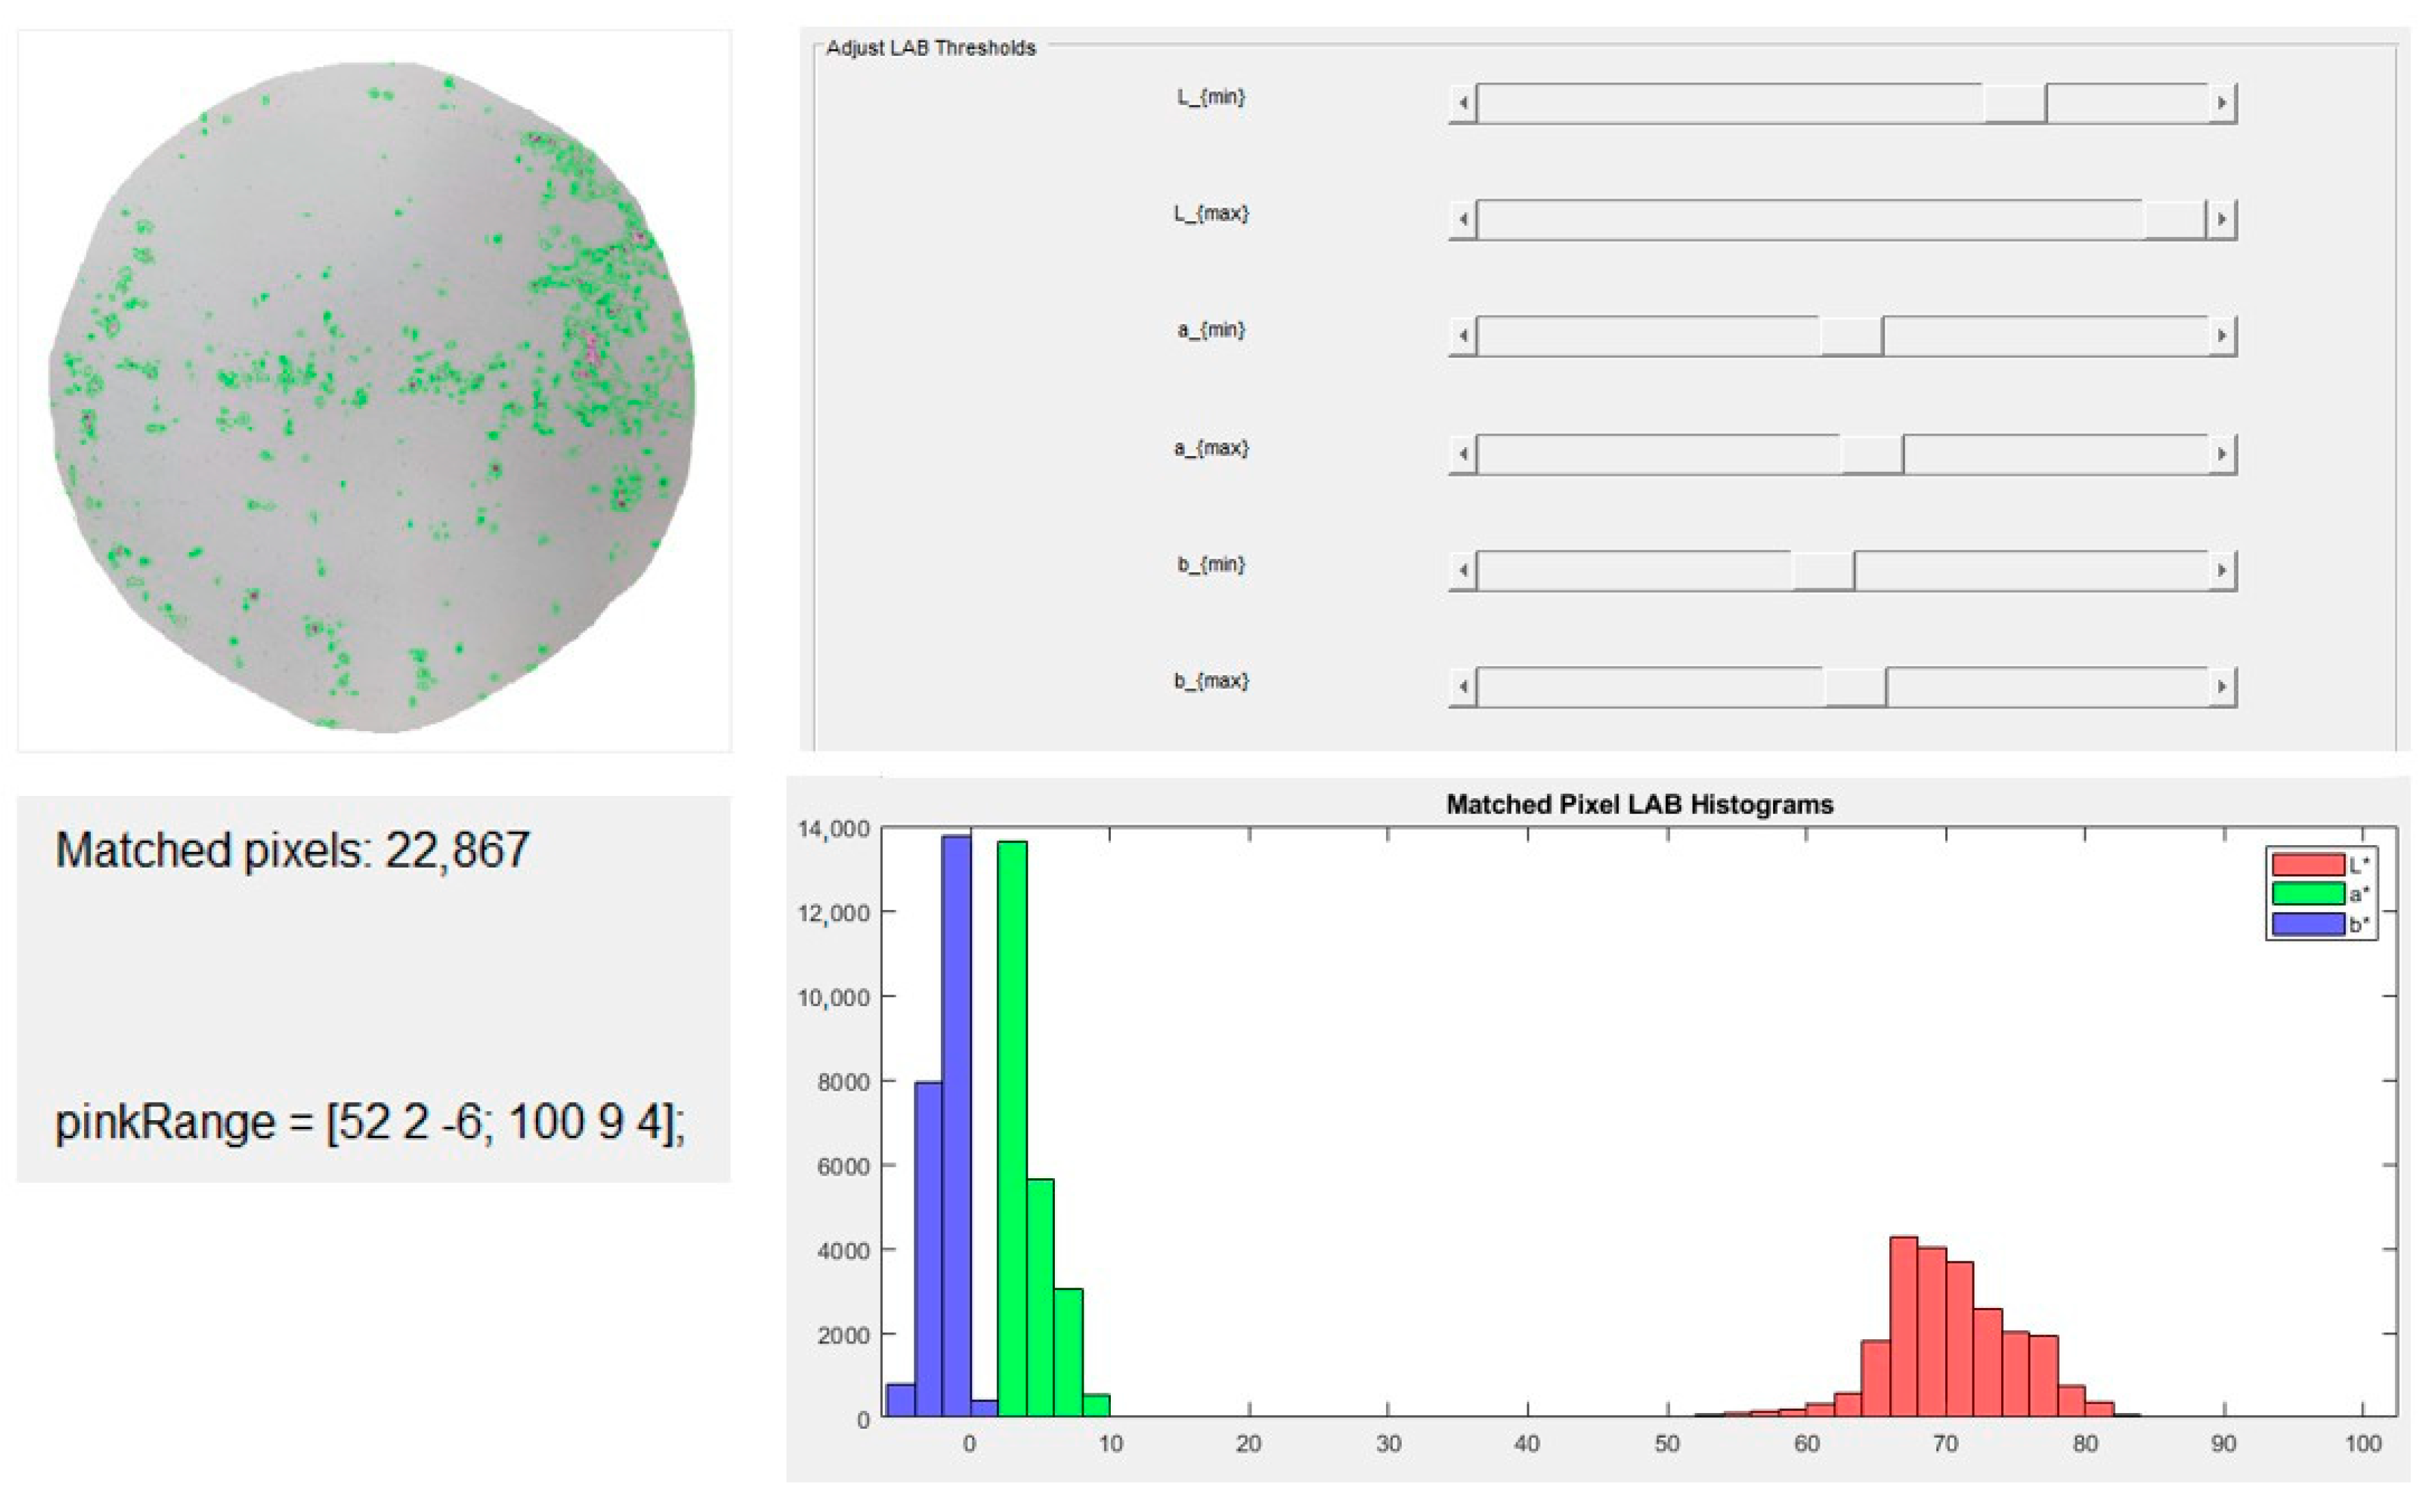
To support precise tuning of pink dye detection parameters in penetrant testing images, we developed an interactive MATLAB utility, labPinkRangeTuner (Figure 14). This standalone graphical tool enables real-time adjustment and visualization of segmentation thresholds in the CIE Lab* color space, which is particularly well suited for separating chromatic information from luminance [78]. The tool is built around an interactive graphical user interface (GUI) that allows users to manually adjust six slider-controlled parameters: minimum and maximum values for the L*, a* and b* channels. As thresholds are modified, the binary mask overlay is updated dynamically on the original image, with perimeter visualization and pixel count feedback. This makes it especially useful for calibrating pink indication masks under varying lighting or material conditions [79].
Additionally, the tool features a histogram panel that displays the distribution of matched pixels in each LAB channel, assisting users in understanding the chromatic composition of the selected indications. Users can export the generated binary mask or copy the resulting pinkRange variable to the clipboard for direct use in main image processing scripts [79]. An automated cluster-based feature is also integrated, where k-means clustering is used to identify potential pink color regions in the image based on proximity to reference a* and b* values typically observed in dye indications [78]. This automation assists in finding suitable threshold ranges for new datasets, particularly when preparing images from different test batches or lighting environments.
In contrast, the RT workflow uses the same image processing structure but interprets brightness and contrast variations instead of color. After loading, the image is converted to grayscale and contrast-enhanced using adaptive histogram equalization (adapthisteq), followed by inversion (imcomplement) to highlight dark defect regions as bright features. Segmentation is then performed using adaptive thresholding (imbinarize) with increased sensitivity to detect low-contrast features common in radiographic films [80].
To confine analysis to the defined inspection region—typically a circular evaluation area—a geometric mask is generated using meshgrid and sqrt, creating a spatial filter based on radial distance [77]. A key contribution of this work is a robust region grouping and classification algorithm. For dense or touching defect clusters, the binary mask is processed with a distance transform and watershed segmentation (bwdist, watershed) to separate merged regions into individual indications [80]. The properties of each region are measured using regionprops, extracting size, area, and aspect ratio.
A custom iterative merging process checks bounding box distances and assigns group labels when defects are within 2 mm, classifying valid groups of three or more indications as “Grouped” if proximity-based logic (pdist) finds overlapping or adjacent defects within a threshold span (groupingDistance = 2 mm) [68]. Non-linear for general round or irregular indications and linear features, if the aspect ratio exceeds a threshold (aspectRatioThreshold = 3), are discriminated. Each indication is quantified by its size, shape, area and position and then evaluated against ISO 4386-3 thresholds specific to the selected quality level (A–E). Each indication is assigned a PASS or FAIL status, and a global verdict is generated based on whether any criteria are exceeded [68]. All results are visualized with color-coded bounding boxes and index numbers and exported as annotated images.
Inter-defect distances are calculated with pdist and used to identify grouped indications based on proximity thresholds, while additional classification logic is implemented via struct, cellfun and arrayfun. For internal defect detection, the same logic is used on radiographic images, where density-based contrast reveals porosity, voids or inclusions [68]. This dual applicability across both surface (penetrant) and internal (X-ray) inspection demonstrates the method’s versatility [74].
In order to ensure a reproducible and quantitative analysis of surface and internal indications in journal bearing components, a set of mathematical expressions was developed and applied. These formulas enable spatial calibration, indication characterization and compliance verification with ISO 4386-3 acceptance criteria [68]. Each step of the image processing algorithm corresponds to a specific analytical formulation, described below.
To begin with, pixel-to-millimeter conversion was achieved through geometric calibration. The pixel density (pixels per mm) was calculated using two user-defined points corresponding to a 100 mm reference distance, as shown in Equation (1) [81]:
p i x e l s   p e r   m m =   ( x 2 x 1 ) 2 + ( y 2 y 1 ) 2 100
This formula converts image pixel distances to physical millimeters using two user-selected points across 100 mm.
Next, a standardized circular inspection area of 100 mm diameter (radius = 50 mm) was defined, and its physical area in square decimeters was determined using Equation (2) [82]:
s a m p l e   a r e a d m 2 =   π · ( 50   m m ) 2 10,000 = 0.7854   d m 2
For penetrant testing, which relies on color indication development, color filtering was performed in the CIE Lab* color space. The a* and b* chromatic channels were thresholded based on an empirically validated range for pink indications [83], as defined in Equation (3):
p i n k   r a n g e a * b * = [ 75,5 , 15 ; 100,60,20 ]
A logical binary mask for each pixel was defined by the condition in Equation (4):
m a s k   ( i ,   j ) = 1 ,     i f   L   ϵ   75 ,   100     a * 5,60     b * [ 15,20 ] 0 ,         o t h e r w i s e
For both RT and PT images, the area of each segmented indication region (in mm2) was computed from pixel count using the pixel density squared, as expressed in Equation (5) [84]:
A i ,   m m 2 =   A i ,     p x ( p i x e l s   p e r   m m ) 2
In addition, to ensure the validity of detected regions, a grayscale contrast check was performed between the region of interest and its immediate background. This formula helps filter weak/noise regions by enforcing minimum grayscale contrast difference [82]. The absolute contrast difference was evaluated using Equation (6):
Δ C = μ r e g i o n μ b a c k g r o u n d
where µregion = mean grayscale value of region; µbackground = mean grayscale value of background ring.
Only indications with ΔC ≥ 3.5 were considered valid.
Compactness, also known as circularity, was calculated using Equation (7) to assess the morphological quality of each detected indication [82,85]:
c o m p a c t n e s s =   4 π A P 2
Here, a variable is the area in pixels, and another variable is the perimeter in pixels.
To assess proximity between indications and enable grouping analysis, the Euclidean distance between centroids was used (Equation (8)):
D i j = ( x i x j ) 2 + ( y i y j ) 2
Grouping was assigned when
D i j g r o u p i n g   d i s t a n c e   m m s a m e   g r o u p
Shape classification was supported by aspect ratio analysis (Equation (9)), where a high ratio indicates a linear defect [82,85]:
A s p e c t   r a t i o =   m a j o r   a x i s   l e n g t h m i n o r   a x i s   l e n g h t
Classification rule:
If aspect ratio ≥ 3 and major axis > 2 mm → linear
Else → Non-linear
Grouped indication span was computed by the maximum pairwise centroid distance normalized by pixel density, as per Equation (10):
s p a n g r o u p = m a x ( p d i s t C i ) p i x e l s   p e r   m m
where Ci are centroids of grouped indications, used for determining whether the group exceeds the minimal span and counts to be considered a grouped indication.
Indication density was then computed for non-linear indications per unit area using Equation (11) [83]:
C o u n t d m 2 n o n l i n e a r =   N n l A d m 2
where Nnl = total count of non-linear indications; A = sample area.
Similarly, the total indicated area was normalized to the unit surface area (Equation (12) [85]:
A d m 2 t o t a l =   N i = 1 A i A d m 2
where Ai = area of each valid indication.
ISO 4386-3 acceptance criteria defined per level (A to E):
Max linear indication:
N L T h r e s h o l d
Max non-linear count per dm2:
N d m 2 n l T h r e s h o l d
Max total indication area per dm2:
A d m 2 t o t a l A m a x
Grouped indications allowed only if
c o u n t g r o u p G m a x ,     s p a n g r o u p   S m a x
Example for level B:
N L m a x = 4 ,     n o n l i n e a r   c o u n t 0.25 d m 2 ,     A r e a 20   m m 2 d m 2 ,     g r o u p e d = 0
These parameters were evaluated against the ISO 4386-3 acceptance thresholds corresponding to selected evaluation levels (A–E). As the example shows, level B imposes a non-linear count limit of 0.25 indications per dm2 and a total area threshold of 20 mm2 per dm2. Any grouping, linearity or area parameter that exceeded defined limits resulted in automatic classification as “FAIL”.
Quantitative results, including the number of indications per unit area, total indicated area per dm2, and compliance with defined acceptance levels, are exported using struct2table and writetable functions. The methodology further includes a fully integrated automated reporting module using mlreportgen.report.* and mlreportgen.dom.*, which generates a structured report, in pdf format, containing annotated images, summary tables, chaptered evaluations with pass/fail assessments, a chart showing defect distribution and final pass/fail classification per ISO 4386-3:2018 criteria [60].
Although PT and RT were both employed in this study, it is important to recognize that these techniques probe different defect domains. PT relies on the capillary action of liquid penetrants to reveal open-to-surface defects, such as pores, cracks or incomplete fusions that reach the specimen surface. In contrast, RT detects internal volumetric discontinuities through differential X-ray absorption, identifying voids, inclusions, or subsurface porosity that may not manifest at the surface.
As a result, the number and size of indications observed in PT are not always directly comparable to those found in RT. Surface porosity detected by PT may not correspond to internal porosity detected by RT, particularly when pores are shallow or confined to the outer layer. Conversely, RT may reveal hidden porosity clusters or inclusions that remain undetected in PT due to the absence of surface openings.
In this study, the CW specimens demonstrated both low PT indications and low RT indications, suggesting overall coating homogeneity. In contrast, SC and FS specimens exhibited high PT porosity values, but RT analysis revealed that not all of these surface indications corresponded to large internal defects because some were limited to the outer surface layer. Thus, PT provided a more sensitive measure of surface quality, whereas RT confirmed whether such surface discontinuities were linked to underlying structural weaknesses.
Overall, PT and RT should be regarded as complementary rather than equivalent methods. PT offers high sensitivity to surface-breaking defects, while RT validates whether such indications extend internally. This dual modality approach strengthens the reliability of defect evaluation, particularly for journal bearing coatings where both surface and internal porosity compromise mechanical integrity.
In practice, this complexity places a significant burden on manual inspectors, who must detect, measure, classify and judge indications across curved surfaces—often using only visual examination and manual tools. Counting, grouping and measuring all indications according to strict geometrical classification rules is labor-intensive and error-prone, especially when assessing curved journal bearing zones with up to 100 mm diameter [77].
This study is subject to several limitations that must be acknowledged when interpreting the results. First, the analysis was conducted on a limited sample size of three specimens (SC, FS, CW), which restricts the statistical robustness of the findings and their generalizability to broader manufacturing contexts. Second, the testing conditions were specific to journal bearing coatings produced from white metal alloy on carbon steel substrates, under controlled laboratory environments. Therefore, the results may not directly extrapolate to other materials, coating chemistries or industrial field conditions. Third, while the developed MATLAB-based algorithm demonstrated high accuracy in detecting and classifying indications, its performance may be constrained when applied to complex images characterized by irregular lighting, uneven surface reflections or significant background noise. Additionally, penetrant testing relies on color-based detection, which may be sensitive to variations in penetrant application or developer thickness, whereas radiographic testing may underrepresent fine porosity due to overlap and scattering effects in film-based imaging. Future work should address these limitations by expanding the sample set, performing validation across a wider range of materials and coating technologies, and refining the algorithm for robustness under diverse image acquisition conditions.
The proposed MATLAB-based framework holds direct applicability in industries where journal bearings and coated sliding surfaces are critical to operational reliability. In heavy-duty rotating machinery such as hydroelectric turbines, petrochemical compressors, and large-scale rolling mills, journal bearings coated with white metal alloy are routinely exposed to severe loads and continuous lubrication cycles. Surface porosity detected via penetrant testing is often associated with reduced adhesion between the coating and the steel substrate, leading to localized delamination under cyclic loading. Internal porosity revealed by radiographic testing correlates with void nucleation and subsequent crack propagation, which are well-documented root causes of catastrophic bearing seizure. The developed dual-modality system ensures compliance with ISO 4386-3 by providing quantitative verification of indication density, grouped defect spans and total porosity per dm2. By automating these evaluations, the framework enables predictive maintenance scheduling, supports root-cause failure analysis and strengthens technical documentation for regulatory inspection. Beyond journal bearings, the methodology can be extended to coated thrust pads, turbine shaft sleeves and high-load industrial bushings, where defect morphology and distribution critically influence tribological performance and service life.
Building upon the current findings, several future research avenues are recommended. First, the integration of advanced deep learning techniques, such as convolutional neural networks (CNNs), could significantly enhance sensitivity and robustness in defect detection, particularly for subtle or low-contrast indications that may elude rule-based segmentation. Second, future studies should focus on increasing the sample size and incorporating more varied metal coating processes to strengthen the statistical validity and reliability of the results. Additionally, coupling radiographic testing with digital detectors rather than scanned physical films may further improve resolution and enable more precise volumetric quantification. Moreover, a transition towards real-time image analysis is planned, ensuring that evaluations will no longer be constrained by the limitations of image capture technology. Finally, the integration of hybrid approaches, combining classical image processing with physics-informed modeling, could provide deeper insights into defect formation mechanisms, thereby linking quality evaluation more directly with manufacturing process parameters.

5. Conclusions

The obtained research results and literature review allowed the following conclusions to be drawn:
This study addressed the need for objective, repeatable and standardized evaluation of surface and internal defects in journal bearing specimens using NDT techniques. Recognizing the limitations of visual interpretation in penetrant and radiographic testing, a novel computational framework was proposed for indication quantification and classification in accordance with the ISO 4386-3 standard. The research aimed to develop and validate a MATLAB-based algorithm capable of automating the evaluation process and supporting quantitative decision-making in industrial quality control.
The implemented methodology integrated image acquisition from both PT and RT inspections with pixel-level segmentation, morphological filtering, and ISO-based acceptance logic. A total of three journal bearing specimen types (SC, FS, CW) were analyzed. Calibration was achieved via pixel-to-millimeter scaling, followed by classification of indications as linear, non-linear or grouped and quantification of key metrics such as indication density and total area per dm2. Color filtering was applied in the CIE Lab* space for PT images, while grayscale contrast filtering and morphological segmentation were employed in RT evaluations. Results were compiled into structured reports with annotated visual outputs and automatic pass/fail conclusions.
The SC and FS specimens failed to meet ISO 4386-3 level B criteria in both PT and RT inspections. In PT, the FS specimen demonstrated the highest non-linear indication count (257.19 pcs/dm2) and total indicated area (402.57 mm2/dm2), followed closely by the SC specimen. RT results further revealed significant internal porosity in SC (511.20 mm2/dm2) and excessive grouped indications in FS, which are not permissible under the specified level. In contrast, the CW specimen remained within acceptable thresholds across all metrics: PT yielded 16.55 pcs/dm2 and 17.15 mm2/dm2, while RT produced only 2 pcs/dm2 and 7.81 mm2/dm2, with no grouped indications observed. These results consistently identified the CW sample as the only conforming component in both surface and volumetric assessments.
The presented computational framework demonstrated high effectiveness in classifying and quantifying defects for both PT and RT modalities. The comparative analysis highlighted discrepancies between surface and internal quality that would not be visible through single-method inspection. Notably, SC exhibited low surface indication density but failed under RT, emphasizing the importance of volumetric testing for integrity assurance. FS, affected by both surface and internal defects, showed poor manufacturing consistency. The CW specimen’s conformity across all indicators validated the algorithm’s ability to distinguish high-quality components. Overall, the dual-modality approach supported by automated ISO compliance logic significantly enhances defect detection accuracy and supports robust, scalable integration into digital NDT workflows.
These non-destructive inspection methods improve the detection of defects and prevent them from progressing to further stages of manufacturing. This allows for more detailed examination of critical areas, such as the adhesion of the coating to the base metal and other hard-to-reach areas where defects could occur.

Author Contributions

Concept of research, T.K. and S.B.; formal analysis, T.K.; methodology, T.K. and S.B.; validation, T.K.; visualization, S.B.; investigation, T.K.; resources, S.B.; data curation, T.K.; writing—original draft preparation, S.B.; supervision, T.K.; writing—review and editing, S.B. and T.K.; analyzed the data, T.K.; project administration, S.B. All authors have read and agreed to the published version of the manuscript.

Funding

This research received no external funding.

Institutional Review Board Statement

Not applicable.

Informed Consent Statement

Not applicable.

Data Availability Statement

The original contributions presented in this study are included in the article. Further inquiries can be directed to the corresponding author.

Acknowledgments

The authors gratefully acknowledge the UAB IREMAS Metal Testing Laboratory for the opportunity to prepare specimens and conduct experimental studies.

Conflicts of Interest

The authors declare no conflict of interest. The funders had no role in the design of the study; in the collection, analyses, or interpretation of data; in the writing of the manuscript, or in the decision to publish the results.

References

  1. Ratkovac, M.; Gerards-Wunsche, P.; Thiele, M.; Brackrock, D.; Stamm, M. Detection and monitoring of fatigue crack growth on welds—Application-oriented use of NDT methods. Procedia Struct. Integr. 2024, 57, 560–568. [Google Scholar] [CrossRef]
  2. Deepak, J.R.; Bupesh Raja, V.K.; Srikanth, D.; Surendran, H.; Nickolas, M.M. Non-destructive testing (NDT) techniques for law carbon steel welded joints: A review and experimental study. Mater. Today Proc. 2021, 44, 3732–3737. [Google Scholar] [CrossRef]
  3. Aramburu, A.B.; da Cruz, J.A.; da Silva, A.A.X.; Acosta, A.P.; Minillo, L.Q.; de Avila Delucis, R. Non-destructive testing techniques for pressure vessels manufactured with polymer composite materials: A systematic review. Measurement 2025, 246, 116729. [Google Scholar] [CrossRef]
  4. Waqar, M.; Memon, A.M.; Sabih, M.; Alhems, L.M. Composite pipelines: Analyzing defects and advancements in non-destructive testing techniques. Eng. Fail. Anal. 2024, 157, 107914. [Google Scholar] [CrossRef]
  5. Pasupulla, A.P.; Agisho, H.A.; Seetharaman, S.; Vijayakumar, S. Characterization and analysis of TIG welded stainless steel 304 alloy plates using radiography and destructive testing techniques. Mater. Today Proc. 2022, 51, 935–938. [Google Scholar] [CrossRef]
  6. Yenumula, L.; Acharya, R.V.; Lingade, B.M.; Borgohain, A.; Maheshwari, N.K.; Kumar, U.; Selvam, T.P.; Dash, A. Radiographic evaluation of gas tungsten arc welding joints used in nuclear applications by X- and gamma-rays. NDT E Int. 2019, 102, 144–152. [Google Scholar] [CrossRef]
  7. Song, Z.; Du, K.; Li, K.; Wang, F.; Xu, M.; Ma, C.; Xiao, T. Nondestructive testing of defects at pixel level with move contract X-ray imaging. NDT E Int. 2025, 155, 103400. [Google Scholar] [CrossRef]
  8. Lin, L.; Xie, M.; Wang, J.; Li, X.; Chen, F.; Wang, Y.; Xing, F.; Bai, Y. Enhancing carbonation assessment in cementitious materials using X-ray computed tomography: A greyscale calibration approach. Constr. Build. Mater. 2025, 489, 142234. [Google Scholar] [CrossRef]
  9. Assias, S.L.G.; Camerini, C.G.; Kotik, H.G.; Ipina, J.E.P. 3D characterization of splits in tested fracture mechanics specimens using X-ray computed tomography. JTMS 2024, 5, 100033. [Google Scholar] [CrossRef]
  10. Revenko, A.G.; Tsvetyansky, A.L.; Eritenko, A.N. X-ray fluorescence analysis of solid-state films, layers, and coatings. Rad. Phys. Chem. 2022, 197, 110157. [Google Scholar] [CrossRef]
  11. Valdez, J.J.R.; De la Cruz Terrazas, E.C.; Conzalez, E.R. Design, construction and Programming of a low-cost pulsed high-voltage direct current power supply for the electrophoretic deposition of silicon carbide mixed with graphite and/or alumina for thermoelectric applications. Inventions 2024, 9, 40. [Google Scholar] [CrossRef]
  12. Kohlscheen, J.; Bareiss, C. Combinatorial deposition and wear testing of HiPIMS W-C films. Coatings 2025, 15, 115. [Google Scholar] [CrossRef]
  13. Aliasghari, S.; Skeldon, P.; Zhou, X.; Gholinia, A.; Zhang, X.; Valizadeh, R.; Pira, C.; Junginger, T.; Burt, G.; Withers, P.J. X-ray computed tomographic and focused ion beam/electron microscopic investigation of coating defects in niobium coated copper superconducting radio-frequency cavities. Mater. Chem. Phys. 2021, 273, 125062. [Google Scholar] [CrossRef]
  14. Ferreira, C.G.; Lopes, R.T.; dos Santos, T.M.P.; Oliveira, D.F.; Martins, F.D.F.; Pereira, G.R. Non-destructive inspection of laminated pipe joints in polymeric composite material reinforced by fiberglass. Nucl. Instrum. Meth. A 2020, 954, 161154. [Google Scholar] [CrossRef]
  15. Florian, T.; Schricker, K.; Zenz, C.; Otto, A.; Schmidt, L.; Diegel, C.; Friedmann, H.; Seibold, M.; Hellwig, P.; Frohlich, F.; et al. Combining in situ synchrotron X-ray imagining and Multiphysics simulation to reveal pore formation dynamics in laser welding of copper. Int. J. Mach. Tools Manuf. 2025, 204, 104224. [Google Scholar] [CrossRef]
  16. Moreno, M.; Andersson, J.M.; Eriksson, J.; Alm, P.; Hedstrom, K.; Saoubi, R.M.; Schramm, I.C.; Schell, N.; Johansson-Joessar, M.P.; Oden, M.; et al. Strain and phase evolution in TiAIN coatings during high-speed metal cutting: An in operando high-energy x-ray diffraction study. Acta Mater. 2024, 263, 119538. [Google Scholar] [CrossRef]
  17. Sun, S.; Miller, J.D.; Choi, Y.R.; Turk, S.; Donnelly, D. Detectability by X-ray micro computed tomography of fatigue initiating void defects in laser powder-bed additively manufactured Ti-6Al-4V coupons. Addit. Manuf. 2024, 81, 103986. [Google Scholar] [CrossRef]
  18. Hu, Y.; He, N.; Xie, L.; Chen, D.; Gao, C.; Ding, H. Improved automatic defect detection from X-ray scans for aluminum conductor composite core wire based on modified Skip-GANomaly. NDT E Int. 2024, 143, 103050. [Google Scholar] [CrossRef]
  19. Hangai, Y.; Kawato, D.; Ando, M.; Ohashi, M.; Morisada, Y.; Ogura, T.; Fujii, H.; Nagahiro, R.; Amagai, K.; Utsunomiya, T.; et al. Nondestructive observation of pores during press forming of aluminum foam by X-ray radiography. Mater. Charact. 2020, 170, 110631. [Google Scholar] [CrossRef]
  20. Gorgannejad, S.; Martin, A.A.; Nicolino, J.W.; Strantza, M.; Guss, G.M.; Khairallah, S.; Forien, J.-B.; Thampy, V.; Liu, S.; Quan, P.; et al. Localized keyhole pore prediction during laser powder bed fusion via multimodal process monitoring and X-ray radiography. Addit. Manuf. 2023, 78, 103810. [Google Scholar] [CrossRef]
  21. Sufian, A.; Russell, A.R. Microstructural pore changes and energy dissipation in Gosford sandstone during pre-failure loading using X-ray CT. Int. J. Rock Mech. Min. Sci. 2013, 57, 119–131. [Google Scholar] [CrossRef]
  22. Serrano-Munoz, I.; Roveda, I.; Kupsch, A.; Muller, B.R.; Bruno, G. Synchrotron X-ray refraction detects microstructure and porosity evolution during in-situ heat treatment. Mat. Sci. Eng. A Struct. 2022, 838, 142732. [Google Scholar] [CrossRef]
  23. Galos, J.; Ghaffari, B.; Hetrick, E.T.; Jones, M.H.; Benoit, M.J.; Wood, T.; Sanders, P.G.; Easton, M.A.; Mouritz, A.P. Novel non-destructive technique for detecting the weld fusion zone using a wire of high x-ray contract. NDT E Int. 2021, 124, 102537. [Google Scholar] [CrossRef]
  24. Liu, M.; Xie, J.; Hao, J.; Zhang, Y.; Chen, X.; Chen, Y. A lightweight and accurate recognition framework for signs of X-ray weld imagines. Comput. Ind. 2022, 135, 103559. [Google Scholar] [CrossRef]
  25. Nielsen, M.-A.; Gloy, J.F.; Lott, D.; Sun, T.; Muller, M.; Staron, P. Automatic melt pool recognition in X-ray radiography images from laser-molten Al alloy. J. Mater. Res. Technol. 2022, 21, 3502–3513. [Google Scholar] [CrossRef]
  26. Cho, H.M.; Cho, H.S.; Kim, K.S.; Lim, H.W.; Park, S.Y.; Lee, S.R.; Kim, K.C.; Je, U.K.; Park, Y.O.; Hong, D.K.; et al. Experimental study on the application of a compressed-sensing (CS)-based deblurring method in x-ray nondestructive testing and its image performance. NDT E Int. 2015, 75, 1–7. [Google Scholar] [CrossRef]
  27. Kim, K.S.; Kang, S.Y.; Kim, W.S.; Cho, H.S.; Park, C.K.; Lee, D.Y.; Kim, G.A.; Park, S.Y.; Lim, H.W.; Lee, H.W.; et al. Improvement of radiographic visibility using an image restoration method based on a simple radiographic scattering model for x-ray nondestructive testing. NDT E Int. 2018, 98, 117–122. [Google Scholar] [CrossRef]
  28. Forien, J.-B.; Calta, N.P.; DePond, P.J.; Guss, G.M.; Roehling, T.T.; Mattews, M.J. Detecting keyhole pore defects and monitoring process signature during laser powder bed fusion: A corelation between in situ pyrometry and ex situ X-ray radiography. Addit. Manuf. 2020, 35, 101336. [Google Scholar] [CrossRef]
  29. Ramirez, I.S.; Marquez, F.P.G.; Papaelias, M. Review on additive manufacturing and non-destructive testing. J. Manuf. Syst. 2023, 66, 260–286. [Google Scholar] [CrossRef]
  30. Ding, Y.; Liu, R.; Yao, J.; Zhang, Q.; Wang, L. Stellite alloy mixture hardfacing via laser cladding for control valve seat sealing surfaces. Surf. Coat. Tech. 2017, 329, 97–108. [Google Scholar] [CrossRef]
  31. Nowodzinski, A.; Ndjoye-Kogou, O.; Mourier, V.; Nonglaton, G.; Bouchu, D.; Fain, B.; Giroud, S. Capacitive micromachined ultrasonic transducers leak detection by dye penetrant test. Microelectron. Reliab. 2020, 114, 113908. [Google Scholar] [CrossRef]
  32. Guirong, X.; Xuesong, G.; Yuliang, Q.; Yan, G. Analysis and innovation for penetrant testing for airplane parts. Procedia Eng. 2015, 99, 1438–1442. [Google Scholar] [CrossRef]
  33. Tan, Y.T.; Yu, T.; Dutta, S.; Sinha, A.; Feirstein, D.; Lizotte, A.; Karigiannis, J.; Liu, S.; Chang, Q. Hierarchical robot learning method for industrial fluorescent penetrant inspection. Manuf. Lett. 2024, 41, 1334–1341. [Google Scholar] [CrossRef]
  34. Shipway, N.J.; Huthwaite, P.; Lowe, M.J.S.; Barden, T.J. Using ResNets to perform automated defect detection for fluorescent penetrant inspection. NDT E Int. 2021, 119, 102400. [Google Scholar] [CrossRef]
  35. Stolt, R.; Elgh, F.; Andersson, P. Design for inspection—Evaluating the inspectability of aerospace components in the early stages of design. Procedia Manuf. 2017, 11, 1193–1199. [Google Scholar] [CrossRef]
  36. Guo, Z.; Liu, X.; Rao, X.; Yuan, C. Effect of defects on the structural integrity of ship piping welds under simulated piping conditions. Ocean Eng. 2024, 308, 118372. [Google Scholar] [CrossRef]
  37. Jalaja, K.; Ranjith, R.; Krishna, S.C.; Manwatkar, S.K.; Gupta, R.K.; Karhikeyan, M.K.; Bajargan, G. Investigation of crack-like defect in 15CDV6 (ESR) steel forging for aerospace applications. Eng. Fail. Anal. 2024, 159, 108040. [Google Scholar] [CrossRef]
  38. de Oliveira, B.J.S.; Campanelli, L.C.; Oliveira, D.P.; de Bribean Guerra, A.P.; Bolfarini, C. Surface characterization and fatigue performance of a chemical-etched Ti-wAl-4V femoral stem for cementless hip arthroplasty. Surf. Coat. Techn. 2017, 309, 1126–1134. [Google Scholar] [CrossRef]
  39. Wang, Q.; Chen, F.Q.; Zhang, L.; Li, J.D.; Zhang, J.W. Microstructure evolution and high temperature corrosion behavior of FeCrBSi coatings prepared by laser cladding. Ceram. Int. 2020, 46, 17233–17242. [Google Scholar] [CrossRef]
  40. Guo, Y.; Ruhge, F.R. Comparison of detection capability for acoustic thermography, visual inspection and fluorescent penetrant inspection on gas turbine components. In AIP Conf. Proc. Review of Progress in Quantitative Nondestructive Evaluation, Proceedings of the 35th Annual Review of Progress in Quantitative Nondestructive Evaluation, Chicago, IL, USA, 20–25 July 2008; AIP Publishing: Melville, NY, USA, 2009; Volume 1096, pp. 1848–1854. [Google Scholar] [CrossRef]
  41. Tran, Y.H.; Vo, T.T.G.; Nguyen, N.-N.; Vo, H.V. Investigation of the permeability of concrete by penetration method and numerical analysis. In Proceedings of the Third International Conference on Sustainable Civil Engineering and Architecture, Proceedings of the Sustainable Civil Engineering and Architecture, Da Nang City, Vietnam, 19–21 July 2023; Reddy, J.N., Wang, C.M., Luong, V.H., Le, A.T., Eds.; Springer: Singapore, 2024; pp. 876–883. [Google Scholar]
  42. Mohamed, A.M.; Tayeh, B.A.; Ahmed, T.I.; Bashir, M.O.; Tobbala, D.E. Influence of nano=silica and nano-ferrite particles on mechanical and durability of sustainable concrete: A review. Nanotechnol. Rev. 2025, 14, 20250151. [Google Scholar] [CrossRef]
  43. Ismail, M.F.; Sultan, M.T.H.; Hamdan, A.; Shah, A.U.M.; Jawaid, M. Low velocity impact bahaviour and post-impact characteristics of kenaf/glass hybrid composites with various weight ratios. J. Mater. Res. Technol. 2019, 8, 2662–2673. [Google Scholar] [CrossRef]
  44. Mozammil, S.; Verma, R.; Karloopia, J.; Jha, P.K. Investigation and measurement of porosity in Al+4.5Cu/6wt%TiB2 in situ composite: Optimization and statistical modelling. J. Mater. Res. Technol. 2020, 9, 8041–8057. [Google Scholar] [CrossRef]
  45. Deivanai, S.; Soni, M. Non destructive testing and analysis of friction stir welded aluminium alloy 2024 pipes. Mater. Today Proc. 2022, 56, 3721–3726. [Google Scholar] [CrossRef]
  46. Reddy, K.A. Non-destructive testing, evaluation of stainless steel materials. Mater. Today Proc. 2017, 4, 7302–7312. [Google Scholar] [CrossRef]
  47. Dell’Avvocato, G.; Rashkovets, M.; Mancini, E.; Contuzzi, N.; Casalino, G.; Palumbo, D.; Galietti, U. Innovative non-destructive thermographic evaluation of mechanical properties in dissimilar aluminium probeless friction stir spot welded (P-FSSW) joints. Eng. Fail. Anal. 2025, 177, 109675. [Google Scholar] [CrossRef]
  48. Manikandan, K.R.; Sivagurunathan, P.A.; Ananthan, S.S.; Moshi, A.A.M.; Bharathi, S.R.S. Study on the influence of temperature and vibration on indications of liquid penetrant testing of A516 low carbon steel. Mater. Today Proc. 2021, 39, 1559–1564. [Google Scholar] [CrossRef]
  49. Ou, Y.; Xu, T.; Fan, J.; Xu, B.; Cai, H.; Zhao, J. Vision-based quality evaluation method towards automated penetrant testing. NDT E Int. 2025, 153, 103334. [Google Scholar] [CrossRef]
  50. Karigiannis, J.; Liu, S.; Harel, S.; Bian, X.; Zhu, P.; Xue, F.; Bouchard, S.; Cantin, D.; Beaudoin-pouliot, M.; Bewlay, B.P.; et al. Multi-robot system for automated fluorescent penetrant indication inspection with deep neural nets. Procedia Manuf. 2021, 53, 735–740. [Google Scholar] [CrossRef]
  51. Zheng, J.; Xie, W.F.; Viens, M.; Birglen, M.; Mantegh, I. Design of an advanced automatic inspection system for aircraft parts based on fluorescent penetrant inspection analysis. Insight Non-Destr. Test. Cond. Monit. 2015, 57, 18–34. [Google Scholar] [CrossRef]
  52. Michael, M.; Al Fath, T.; Alexander, V.; Hasibuan, G.C.R.; Syukri, M.; Ginting, M.H.S.; Sidabutar, R.; Dalimunthe, N.F. MATLAB empowered brightness defect prediction system in pulp processing bleaching stage: An empirical modelling approach. Case Stud. Chem. Environ. Eng. 2024, 10, 100934. [Google Scholar] [CrossRef]
  53. Zou, J.; Li, Z.; Liu, X.; Tong, H. MSCPDPLab: A MATLAB toolbox for transfer learning based multi-source cross-project defect prediction. SoftwareX 2023, 21, 101286. [Google Scholar] [CrossRef]
  54. Vagga, A.; Aherrao, S.; Pol, H.; Borkar, V. Flow visualization by Matlab based image analysis of high-speed polymer melt extrusion film casting process for determining necking defect and quantifying velocity profiles. Adv. Ind. Eng. Polym. Res. 2022, 5, 1–11. [Google Scholar] [CrossRef]
  55. Kumar, R.; Singh, J.; Sharma, S.; Li, C.; Krolczyk, G.; Eldin, E.M.T.; Wojciechowski, S. Identification of localized defects and fault size estimation of taper roller bearing (NBC_30205) with signal processing using the Shannon entropy method in MATLAB for automotive industries applications. Heliyon 2022, 8, e12053. [Google Scholar] [CrossRef] [PubMed]
  56. ISO 3452-1:2021; Non-Destructive Testing—Penetrant Testing. Part 1: General Principles. International Organization for Standartization: Geneve, Switzerland, 2021.
  57. ISO 17636-1:2022; Non-Destructive Testing of Welds—Radiographic Testing. Part 1: X-and Gamma-Ray Techniques with Film. International Organization for Standartization: Geneve, Switzerland, 2022.
  58. Niccolai, A.; Caputo, D.; Chieco, L.; Grimaccia, F.; Mussetta, M. Machine learning-based detection technique for NDT in industrial manufacturing. Mathematics 2021, 9, 1251. [Google Scholar] [CrossRef]
  59. García-Pérez, A.; Gómez-Silva, M.J.; de la Escalera Hueso, A. Automated defect recognition of castings using neural networks. J. Nondestruct. Eval. 2022, 41, 1–15. [Google Scholar] [CrossRef]
  60. ISO 4386-3:2018; Plain Bearings—Metallic Multilayer Plain Bearings—Part 3: Non-Destructive Penetrant Testing. International Organization for Standartization: Geneve, Switzerland, 2018.
  61. ISO 5817:2023; Welding—Fusion-Welded Joints in Steel, Nickel, Titanium and Their Alloys (Beam Welding Excluded)—Quality Levels for Imperfections. International Organization for Standartization: Geneve, Switzerland, 2023.
  62. Lee, S.-H.; Park, S.-J. Automatic detection of welding defects in radiographic images using faster R-CNN. Appl. Sci. 2020, 10, 8629. [Google Scholar] [CrossRef]
  63. Torbali, M.; Taktak, M.; Polat, Y.; Sabuncu, A.; Aytekin, H.; Karakoc, H.K. A state-of-the-art review of non-destructive testing image fusion and critical insights on the inspection of aerospace composites towards sustainable maintenance repair operations. Appl. Sci. 2023, 13, 2732. [Google Scholar] [CrossRef]
  64. Say, D.; Zidi, S.; Qaisar, S.M.; Krichen, M. Automated categorization of multiclass welding defects using X-ray image augmentation and convolutional neural network. Sensors 2023, 23, 6422. [Google Scholar] [CrossRef]
  65. Hütten, N.; Alves Gomes, M.; Hölken, F.; Andricevic, K.; Meyes, R.; Meisen, T. Deep learning for automated visual inspection in manufacturing and maintenance: A survey of open-access papers. Appl. Syst. Innov. 2024, 7, 11. [Google Scholar] [CrossRef]
  66. Singh, R. Penetrant testing. In Applied Welding Engineering, 3rd ed.; Elsevier Inc.: Amsterdam, The Netherlands, 2020; pp. 339–345. [Google Scholar] [CrossRef]
  67. ISO 3452-2:2021; Non-Destructive Testing—Penetrant Testing. Part 2: Testing of Penetrant Materials. International Organization for Standartization: Geneve, Switzerland, 2021.
  68. Sahoo, S.K.; Narasimha Rao, R.; Srinivas, K.; Buragohain, M.K.; Sri Chaitanya, C. A novel NDE approach towards evaluating adhesive bonded interfaces. Mater. Today Proc. 2020, 26, 1191–1197. [Google Scholar] [CrossRef]
  69. Witte Robert, S.; Witte John, S. Statistics, 11th ed.; John Wiley & Sons, Inc.: Hoboken, NJ, USA, 2017; p. 496. [Google Scholar]
  70. ISO 10675-1:2021; Non-Destructive Testing of Welds—Acceptance Levels for Radiography Testing. Part 1: Steel, Nickel, Titanium and Their Alloys. Organization for Standartization: Geneve, Switzerland, 2021.
  71. Boaretto, N.; Centeno, T.M. Automated detection of welding defects in pipelines from radiographic images DWDI. NDT E Int. 2017, 86, 7–13. [Google Scholar] [CrossRef]
  72. Yun, G.-h.; Oh, S.-j.; Shin, S.-c. Image preprocessing method in radiographic inspection for automatic detection of ship welding defects. Appl. Sci. 2022, 12, 123. [Google Scholar] [CrossRef]
  73. Buckman, J.; Bankole, S.A.; Board, S.J.; Bridges, C.J.; Smalley, P.C. Quantifying porosity through automated image collection and batch image processing: Case study of three carbonates and an aragonite cemented sandstone. Geosciences 2017, 7, 70. [Google Scholar] [CrossRef]
  74. Gonzalez, R.C.; Woods, R.E. Digital Image Processing, 4th ed.; Pearson Education Limited: New York, NY, USA, 2017; p. 1024. ISBN 1-292-22304-9. [Google Scholar]
  75. Kountchev, R.K.; Todorov, V.; Kountcheva, R. Defects detection in X-ray imagines and photos. In Proceedings of the 10th WSEAS International Conference on Signal Processing, Robotics and Automation, Cambridge, UK, 20–22 February 2011; Available online: https://www.researchgate.net/publication/228638382 (accessed on 4 April 2025).
  76. Stoev, K. Development of radiographic image processing algorithms at CNL. In Proceedings of the NDT in Canada 2019, Edmonton, AB, Canada, 18–20 June 2019; Available online: https://www.researchgate.net/publication/335169622 (accessed on 7 April 2025).
  77. Lu, M.; Chen, C.-L. Detection and classification of bearing surface defects based on machine vision. Appl. Sci. 2021, 11, 1825. [Google Scholar] [CrossRef]
  78. Bora, D.J.; Gupta, A.K.; Khan, F.A. Comparing the performance of L*A*B* and HSV color spaces with respect to color image segmentation. arXiv 2015, arXiv:1506.01472. [Google Scholar]
  79. Woo, J.; Lee, H. Nonlinear and dotted defect detection with CNN for multi-vision-based mask inspection. Sensors 2022, 22, 8945. [Google Scholar] [CrossRef] [PubMed]
  80. Zhang, W.; Liu, W.; Yu, X.; Kang, D.; Xiong, Z.; Lv, X.; Huang, S.; Li, Y. Deep learning-based automated detection of welding defects in pressure pipeline radiograph. Coatings 2025, 15, 808. [Google Scholar] [CrossRef]
  81. Xu, H.; Yan, Z.; Ji, B.; Huang, P.; Cheng, J. Defect detection in welding radiographic images based on semantic segmentation methods. Measurement 2022, 188, 110569. [Google Scholar] [CrossRef]
  82. Song, Y.; Wu, X. An analytical solution for vertical coils near a multi-layered metallic pipe in Pulsed Eddy Current Testing. NDT E Int. 2022, 125, 102570. [Google Scholar] [CrossRef]
  83. Zhu, P.; Cheng, Y.; Banerjee, P.; Tamburrino, A. A novel machine-learning model for eddy-current testing with uncertainty estimation. NDT E Int. 2019, 101, 104–112. [Google Scholar] [CrossRef]
  84. Prabhakar, D.V.N.; Sreenivasa Kumar, M.; Gopala Krishna, A. A novel hybrid transform approach with integration of fast fourier, discrete wavelet and discrete shear let transforms for prediction of surface roughness on machined surfaces. Measurement 2020, 164, 108011. [Google Scholar] [CrossRef]
  85. Lujan-Moreno, G.A.; Howard, P.R.; Rojas, O.G.; Montgomery, D.C. Design of experiments and response surface methodology to tune machine learning hyperparameters, with a random forest case-study. Expert Syst. Appl. 2018, 109, 195–205. [Google Scholar] [CrossRef]
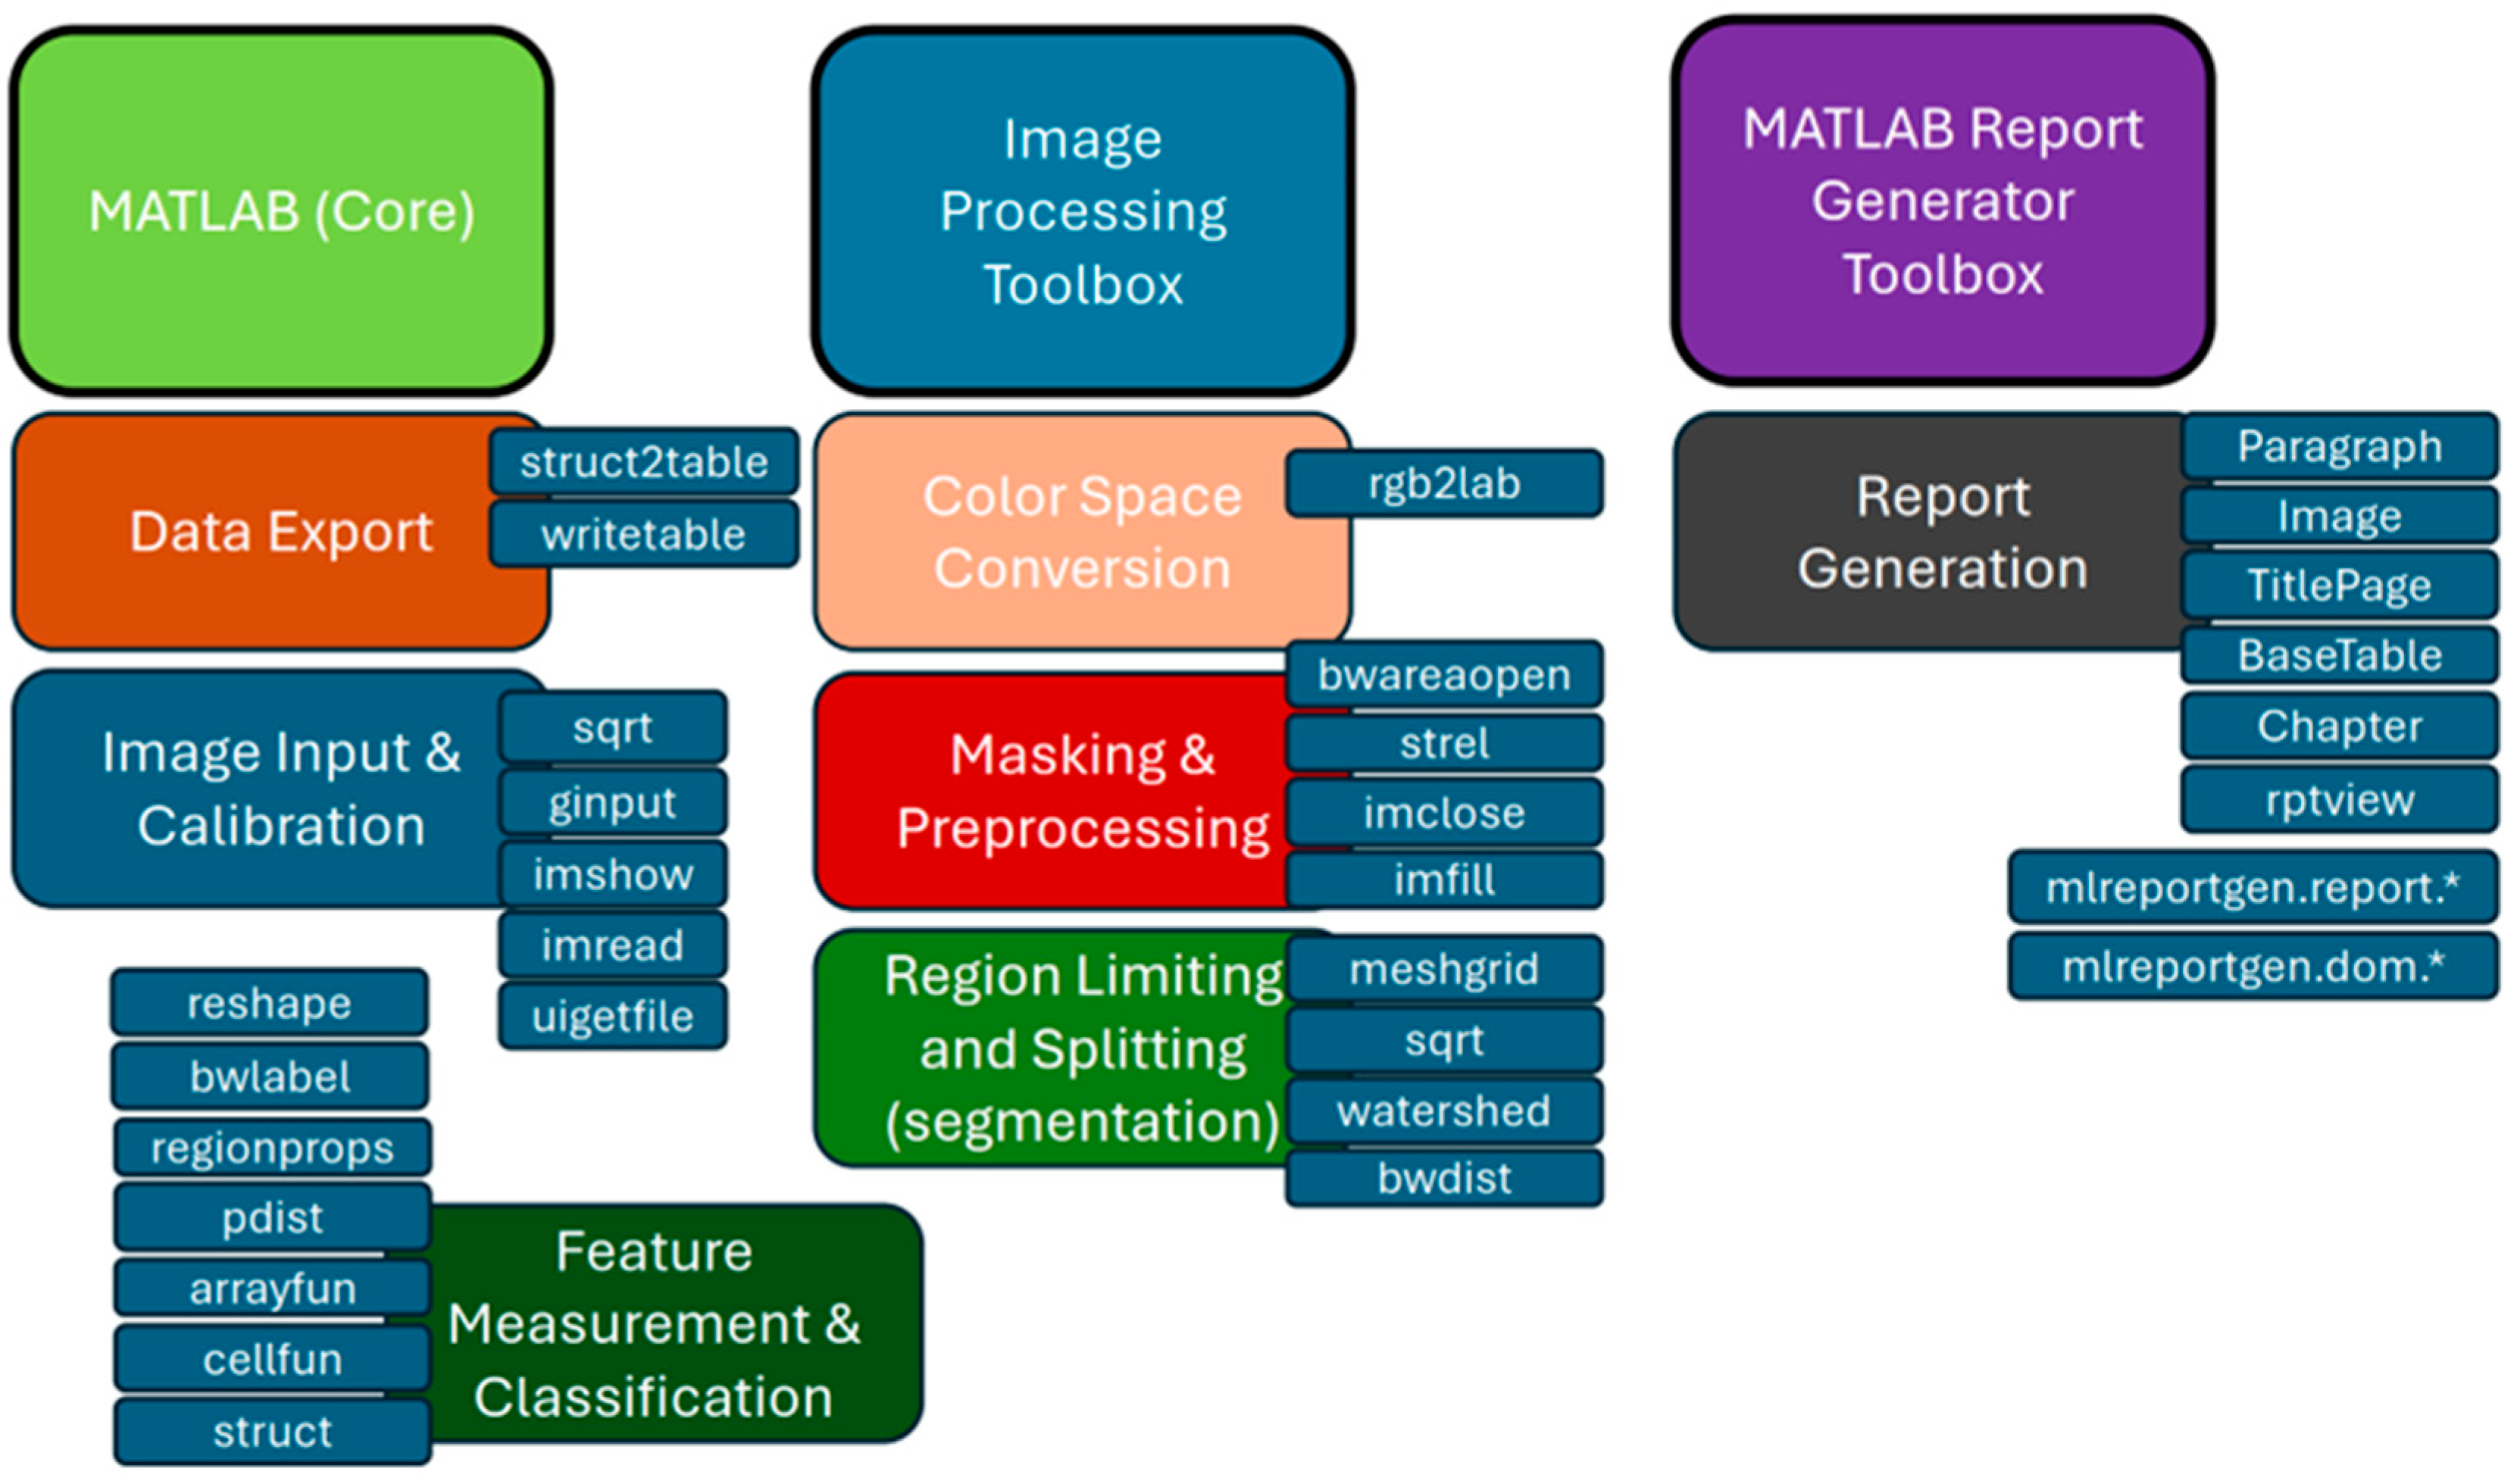
Figure 1. Principal scheme of MATLAB tools and functions used in code.
Inventions 10 00071 g001
Figure 2. “O-shaped” specimen type: (a) specimen model; (b) sketch of the specimen; (c) manufactured specimen.
Inventions 10 00071 g002
Figure 3. Specimens during the penetration test: (a) preparation of the samples for the penetrant test; (b) specimens after application of the penetrant.
Inventions 10 00071 g003
Figure 4. Scheme for indication classification criteria: (a) non-linear, (b) linear, (c) grouped indications; assessment geometry criteria.
Inventions 10 00071 g004
Figure 5. Surface of specimens during penetration testing: (a) SC specimen; (b) FS specimen; (c) CW specimen.
Inventions 10 00071 g005
Figure 6. MATLAB output data from Penetrant Testing Code.
Inventions 10 00071 g006
Figure 7. Retesting with penetrators on smooth surfaces: (a) after applying the penetrator; (b) after brightening.
Inventions 10 00071 g007
Figure 8. Specimens after final testing, image prepared for MATLAB analysis: (a) SC specimen; (b) FS specimen; (c) CW specimen.
Inventions 10 00071 g008
Figure 9. RT testing of obtained specimens using Teledyne ICM SiteX D1802 Radiograph.
Inventions 10 00071 g009
Figure 10. Shadow mapping scheme of an X-ray-crossed object.
Inventions 10 00071 g010
Figure 11. Radiographic results: (a) SC specimen; (b) FS specimen; (c) CW specimen.
Inventions 10 00071 g011
Figure 12. Shape and location of indications: (a) Class A; (b) Class B; (c) Class C; (d) Class D; (e) Class E [60].
Inventions 10 00071 g012
Figure 13. Indication type distribution: (a) SC specimen; (b) FS specimen; (c) CW specimen.
Inventions 10 00071 g013
Figure 14. Image of real-time adjustment and visualization of segmentation thresholds.
Inventions 10 00071 g014
Table 1. Chemical composition of white metal alloy.
Chemical elementFeAlCuAsPbZnSbBiSn
Amount [wt.%]0.0900.0025.600.0070.0940.00613.400.001Bal.
Table 2. Equipment used in the radiographic test.
Row NoName of EquipmentManufacturer, Model NameTechnical Characteristics, Specification
1X-ray radiographerTeledyne ICM SiteX D18020.8 × 0.8 mm (EN 12543-2:2021)
2NegatoscopeKowolux M1 (NDT Supply. Com, Inc., 7952 Nieman Road, Lenexana, KS, USA)Optical density up to 4.15
3DensitometerKowotest Densorapid D (NDT Supply. Com, Inc., 7952 Nieman Road, Lenexana, KS, USA)Optical density up to 5.0
4X-ray filmCarestream Industrex MX125 contacktpakC3 (EN ISO 11699-1:2008) lead (Pb)
5Screens for radiation suppressionLead (Pb)Front—0.027; rear—0.027; additional distance from the rear—0.2 mm
6Film-developing apparatusDURR XR 24 NDTAutomatic
7Developer volumeXR D NDT Developer-
8Fixer volumeXR F NDT Fixer-
Table 3. Radiographic test parameters.
Row No.ParameterSet/Controlled ValueNotes
1Ambient temperature, °C+20 °CRh 25%
2Illumination, lx500 lxArtificial
3.1Test scheme according to ENNo. 11/12 Inventions 10 00071 i001EN ISO 17636-1:2022
3.2ASME test schemeT-271.2(b)(2)
Inventions 10 00071 i002
ASME BPVC
Section V edition 2021
4Object thickness, mm25.00 mmPrimary metal with coating
5Object material(s)White metal/carbon steel2 materials
6Focal length, mm500 mmFixed
7Anode voltage, kV180 kVMax. 180 kV
8Anode current, mA2.0 mAMax. 3 mA, at 180 kV—2 mA
9Exposure time, min9.6 minSiteX software
10Sensitivity indicator positionFrom the sourcePoints 3.1 and 3.2
11Sensitivity indicator type10FEENISO 19232-1:2013
12Sensitivity indicator minimum sensitivityW14ISO 19232-1:2013
13Film sensitivity, mm0.016 mmISO 19232-1:2013
14Resulting optical density2.8Kowotest Densorapid D
Table 4. Evaluation criteria and acceptance levels according to ISO 4386-3 [60].
Indication TypeEvaluation Criteria
ABCDE
Linear indicationNot allowedNot allowedNot allowedNot alloweda > 7 mm
Non-linear indicationa > 3 mma > 4 mma > 5 mma > 6 mma > 8 mm
Grouped indicationsNot allowedNot allowedNot allowedl > 10 mml > 16 mm
Non-linear indications per area2/6.3 dm24/16 dm26/40 dm211/100 dm220/250 dm2
Maximum indication area10 mm2/dm220 mm2/dm250 mm2/dm2125 mm2/dm2250 mm2/dm2
Table 5. Estimation of the surface porosity of the specimens after molding.
No.ResultsImage Analysis
SC Specimen
1Non-linear indications per dm2: 1440.03 pcs.
Allowed for level B: 4 pcs per 16 dm2.
Inventions 10 00071 i003
2Indicated area per dm2: 2852.33 mm2.
Allowed for level B: 20.00 mm2.
3Grouped indications: 1112 pcs.
Accepted grouped indication: not allowed (level B).
4Total indicated area: 2240.21 mm2.
Allowed maximum for level B: 20.00 mm2 per dm2.
5Sample area: 0.79 dm2.
Indicated area per dm2: 2852.33 mm2.
FS Specimen
1Non-linear indications per dm2: 3278.59 pcs.
Allowed for level B: 4 pcs per 16 dm2.
Inventions 10 00071 i004
2Indicated area per dm2: 2866.98 mm2.
Allowed for level B: 20.00 mm2.
3Grouped indications: 2562 pcs.
Accepted grouped indication: not allowed (level B).
4Total indicated area: 2251.72 mm2.
Allowed maximum for level B: 20.00 mm2 per dm2.
5Sample area: 0.79 dm2.
Indicated area per dm2: 2866.98 mm2.
CW Specimen
1Non-linear indications per dm2: 53.48 pcs.
Allowed for level B: 4 pcs per 16 dm2.
Inventions 10 00071 i005
2Indicated area per dm2: 8.82 mm2.
Allowed for level B: 20.00 mm2.
3Grouped indications: 32 pcs.
Accepted grouped indication: not allowed (level B).
4Total indicated area: 6.93 mm2.
Allowed maximum for level B: 20.00 mm2 per dm2.
5Sample area: 0.79 dm2.
Indicated area per dm2: 8.82 mm2.
Table 6. Evaluation of the surface porosity of the specimens after grinding.
No.ResultsImage Analysis
SC Specimen
1Non-linear indications per dm2: 315.76 pcs.
Allowed for level B: 4 pcs per 16 dm2.
Inventions 10 00071 i006
2Indicated area per dm2: 243.63 mm2. Allowed for level B: 20.00 mm2.
3Grouped indications: 209 pcs. Accepted grouped indication: not allowed (level B).
4Total indicated area: 191.35 mm2. Allowed maximum for level B: 20.00 mm2 per dm2.
5Sample area: 0.79 dm2. Indicated area per dm2: 243.63 mm2.
FS Specimen
1Non-linear indications per dm2: 482.56 pcs.
Allowed for level B: 4 pcs per 16 dm2.
Inventions 10 00071 i007
2Indicated area per dm2: 533.53 mm2.
Allowed for level B: 20.00 mm2.
3Grouped indications: 355 pcs.
Accepted grouped indication: not allowed (level B).
4Total indicated area: 419.03 mm2.
Allowed maximum for level B: 20.00 mm2 per dm2.
5Sample area: 0.79 dm2. Indicated area per dm2: 533.53 mm2.
CW Specimen
1Non-linear indications per dm2: 0 pcs.
Allowed for level B: 4 pcs per 16 dm2.
Inventions 10 00071 i008
2Indicated area per dm2: 0 mm2.
Allowed for level B: 20.00 mm2.
3Grouped indications: 0 pcs.
Accepted grouped indication: not allowed (level B).
4Total indicated area: 0 mm2.
Allowed maximum for level B: 20.00 mm2 per dm2.
5Sample area: 0.79 dm2. Indicated area per dm2: 0 mm2.
Table 7. Estimation of surface porosity of specimens after final grinding.
No.ResultsImage Analysis
SC Specimen
1Non-linear indications per dm2: 146.42 pcs.
Allowed for level B: 4 pcs per 16 dm2.
Inventions 10 00071 i009
2Indicated area per dm2: 62.25 mm2. Allowed for level B: 20.00 mm2.
3Grouped indications: 84 pcs.
Accepted grouped indication: not allowed (level B).
4Total indicated area: 48.89 mm2. Allowed maximum for level B: 20.00 mm2 per dm2.
5Sample area: 0.79 dm2. Indicated area per dm2: 62.25 mm2.
FS Specimen
1Non-linear indications per dm2: 257.19 pcs.
Allowed for level B: 4 pcs per 16 dm2.
Inventions 10 00071 i010
2Indicated area per dm2: 402.57 mm2. Allowed for level B: 20.00 mm2.
3Grouped indications: 188 pcs.
Accepted grouped indication: not allowed (level B).
4Total indicated area: 316.17 mm2. Allowed maximum for level B: 20.00 mm2 per dm2.
5Sample area: 0.79 dm2. Indicated area per dm2: 402.57 mm2.
CW Specimen
1Non-linear indications per dm2: 16.55 pcs. Allowed for level B: 4 pcs per 16 dm2.Inventions 10 00071 i011
2Indicated area per dm2: 17.15 mm2. Allowed for level B: 20.00 mm2
3Grouped indications: 9 pcs.
Accepted grouped indication: not allowed (level B).
4Total indicated area: 13.47 mm2. Allowed maximum for level B: 20.00 mm2 per dm2.
5Sample area: 0.79 dm2. Indicated area per dm2: 17.15 mm2.
Table 8. Estimation of internal porosity of specimens.
No.ResultsImage Analysis
SC Specimen
1Non-linear indications per dm2: 50.93 pcs. Allowed for level B: 4 pcs per 16 dm2.Inventions 10 00071 i012
2Indicated area per dm2: 325.44 mm2. Allowed for level B: 20.00 mm2.
3Grouped indications: 13 pcs.
Accepted grouped indication: not allowed (level B).
4Total indicated area: 650.88 mm2. Allowed maximum for level B: 20.00 mm2 per dm2.
5Sample area: 0.79 dm2.
Indicated area per dm2: 511.20 mm2.
FS Specimen
1Non-linear indications per dm2: 56.02 pcs. Allowed for level B: 4 pcs per 16 dm2.Inventions 10 00071 i013
2Indicated area per dm2: 48.46 mm2. Allowed for level B: 20.00 mm2.
3Grouped indications: 20 pcs.
Accepted grouped indication: not allowed (level B).
4Total indicated area: 96.93 mm2.
Allowed maximum for level B: 20.00 mm2 per dm2.
5Sample area: 0.79 dm2.
Indicated area per dm2: 76.12 mm2.
CW Specimen
1Non-linear indications per dm2: 2 pcs. Allowed for level B: 4 pcs per 16 dm2.Inventions 10 00071 i014
2Indicated area per dm2: 4.97 mm2. Allowed for level B: 20.00 mm2.
3Grouped indications: 0 pcs.
Accepted grouped indication: not allowed (level B).
4Total indicated area: 9.91 mm2. Allowed maximum for level B: 20.00 mm2 per dm2.
5Sample area: 0.79 dm2.
Indicated area per dm2: 7.81 mm2.
Disclaimer/Publisher’s Note: The statements, opinions and data contained in all publications are solely those of the individual author(s) and contributor(s) and not of MDPI and/or the editor(s). MDPI and/or the editor(s) disclaim responsibility for any injury to people or property resulting from any ideas, methods, instructions or products referred to in the content.