1. Introduction
With the global energy transition accelerating toward greener and low-carbon systems, solar energy—as a renewable, zero-emission, and clean energy source—has garnered increasing attention worldwide [
1]. In the transportation sector, integrating solar energy into road infrastructure to create “solar roads” has emerged as a promising approach for advancing green mobility and sustainable development [
2,
3]. Solar roads not only enable energy reutilization of road surfaces and improve land-use efficiency, but also offer multifunctional potential, such as on-site power generation and intelligent interactivity [
4,
5]. However, as roads are subjected to sustained vehicular loads and environmental influences, the mechanical performance, safety, and service life of the solar pavement surface have become key challenges restricting the widespread adoption of solar road technologies. Therefore, a comprehensive understanding of the structural and mechanical characteristics of solar photovoltaic (PV) panels, including their deformation behavior and failure mechanisms, is of great significance for enhancing structural safety and engineering feasibility.
Solar pavements integrate photovoltaic panels into road surfaces to provide power-generating functionality. Since the concept was first proposed in 2006 by the American couple Scott and Julie Brusaw, extensive research on prefabricated PV pavements has been carried out worldwide [
6,
7,
8,
9,
10], generally categorized into applications for light- and heavy-duty traffic. For light-duty applications, the Brusaws designed hexagonal modular PV panels, which were installed in a public plaza, but the system failed within one week of installation [
11]. Subsequently, George Washington University built a solar sidewalk composed of 27 PV panels embedded within internal cavities and insulated from mechanical stress, yielding a peak power output of approximately 400 W [
12]. From 2014 to 2016, the Netherlands Organization for Applied Scientific Research (TNO) launched the world’s first solar bike path pilot project alongside the N203 highway in Krommenie [
13]. In 2019, a solar landscape walkway (GES) with a 25 m
2 area and 1.8 kW capacity was constructed at the State Grid Electric Power Research Institute in China [
14]. These applications, primarily in pedestrian walkways, bike lanes, and landscaped paths, have demonstrated the technical feasibility of solar roads for light traffic, with minimal structural damage observed due to low service loads.
In contrast, heavy-duty traffic applications have encountered considerable challenges. In 2016, the French company COLAS, building on earlier tests of flexible solar panels adhered to asphalt surfaces, constructed a 1000 m long, 2.8 m wide solar roads (Wattway) in Tourouvre, Normandy. Within three years, the road surface experienced severe cracking and delamination, with power output halving annually and maintenance costs soaring—ultimately rendering the project unsuccessful [
15,
16]. In 2017, the Qilu Transportation Development Group built China’s first solar highway on the Jinan Ring Expressway, comprising a 1080 m long, 5.45 m wide modular pavement system. After only eight months of service under complex vehicular loading, the surface suffered widespread structural failures, and the project was eventually discontinued [
17,
18]. In 2019, drawing on experience from light-traffic solar roads, TNO initiated pilot sections for heavy-duty traffic in Haarlem and Spijkenisse, the Netherlands. A 50 m heavy-load vehicle lane and a 100 m bus lane were constructed and tested for noise and skid resistance, with satisfactory performance recorded. However, both segments sustained visible damage within one week of operation [
14].
These cases indicate that while significant progress has been made in the areas of photovoltaic conversion efficiency and surface anti-slip performance, there remains a notable lack of research focused on the mechanical behavior of solar panels as structural elements, particularly under heavy traffic conditions. Some scholars have explored the overall structural performance through load-bearing tests and finite element simulations [
19,
20,
21], demonstrating preliminary load capacities. However, systematic investigations into the mechanical behavior of individual panel units—particularly regarding the influence of geometrical shapes and dimensional parameters on structural response and failure modes—are still limited. Moreover, as solar pavements typically adopt modular assembly, the impact of various panel joint configurations on structural stability and stress transmission pathways has not been thoroughly evaluated. Existing studies largely focus on static performance or experimental observations and lack a multiscale analytical framework grounded in microscale mechanisms.
To address these research gaps, this study employs the discrete element method (DEM) to analyze the mechanical behavior of solar PV panels under varying geometrical configurations (triangular, square, regular pentagonal, and regular hexagonal) and size parameters. The investigation focuses on stress distribution, deformation behavior, and crack propagation patterns, while further evaluating critical performance metrics such as ultimate bearing capacity and energy dissipation. Additionally, typical modular joint configurations are examined to assess their effects on the collaborative load-bearing capacity and overall structural stability. This research aims to uncover the intrinsic mechanisms by which geometric design influences the mechanical performance of PV panels, and to propose optimized structural design strategies for engineering applications. The outcomes are expected to provide theoretical guidance and technical solutions for the mechanical design, module arrangement, and long-term durability enhancement of solar roads systems.
2. Materials and Methods
2.1. Overview of Discrete Element Method and Its Applicability in Photovoltaic Panel Design
The discrete element method (DEM) is a numerical technique used to simulate and analyze the mechanical behavior of granular materials and discrete structures. It is particularly effective in studying particle motion, contact interactions, and mechanical responses. The typical contact behavior between particles is illustrated in
Figure 1 [
22]. By tracking interactions among individual particles or discrete elements, DEM can effectively capture microscopic failure mechanisms, deformation characteristics, and dynamic behaviors of materials under external loads [
23]. The core concept of DEM is to discretize a continuum into individual elements, each of which follows Newton’s laws of motion. Interaction forces between elements are computed using appropriate contact mechanics models. Compared with the traditional finite element method (FEM), the discrete element method has the following characteristics: (1) Applicable to non-continuous media: It can effectively simulate granular materials, rock materials, crushed media and complex contact problems; (2) Able to describe the destruction and fracture process of materials: Since the unit body can move independently, DEM can clearly capture the initiation, expansion and final destruction of cracks; (3) Efficiently handle large deformation problems: Under large deformation or large displacement conditions, DEM can avoid mesh distortion problems, thereby improving calculation stability; (4) Applicable to multi-scale analysis: It can combine macroscopic structural analysis with microscopic particle behavior research to achieve mechanical properties analysis from microscopic to macroscopic.
In the context of solar roads photovoltaic (PV) panels, the basic units must satisfy requirements for load-bearing capacity, durability, and interlocking stability. The mechanical performance of the panels is significantly influenced by the geometry of individual units and their assembly configurations. Due to the involvement of multiple interacting units, complex contact behavior, and potential failure mechanisms, DEM is particularly well-suited for this area of research. DEM allows for the evaluation of stress distribution, deformation patterns, and stability of different panel geometries under load, enabling the identification of optimal shapes. Since solar roads PV panels are typically assembled into large-area structures through various connection methods—such as overlapping, interlocking, or adhesive bonding—DEM can simulate the mechanical interactions between these joints. This provides insights into how different connection strategies affect overall structural integrity and helps to optimize the joint design for improved road stability.
Furthermore, DEM can effectively simulate stress concentration, crack initiation, and crack propagation processes under different loading conditions, making it possible to predict likely failure modes and develop corresponding design improvements. By incorporating variable material properties, DEM can also assess the mechanical response of different materials under external loads, offering guidance for material optimization to enhance both durability and structural performance.
In summary, DEM provides a powerful theoretical foundation for the design and optimization of solar roads PV panels. Through DEM, researchers can thoroughly investigate the mechanical behavior associated with varying unit geometries, connection methods, and material properties. This facilitates structural optimization and improves the durability and stability of PV panels under complex environmental and loading conditions. Therefore, DEM serves as an effective and essential analytical tool in the study of solar roads PV panels, laying the groundwork for the mechanical analyses and optimization strategies discussed in subsequent sections.
2.2. Choice of Basic Unit Form
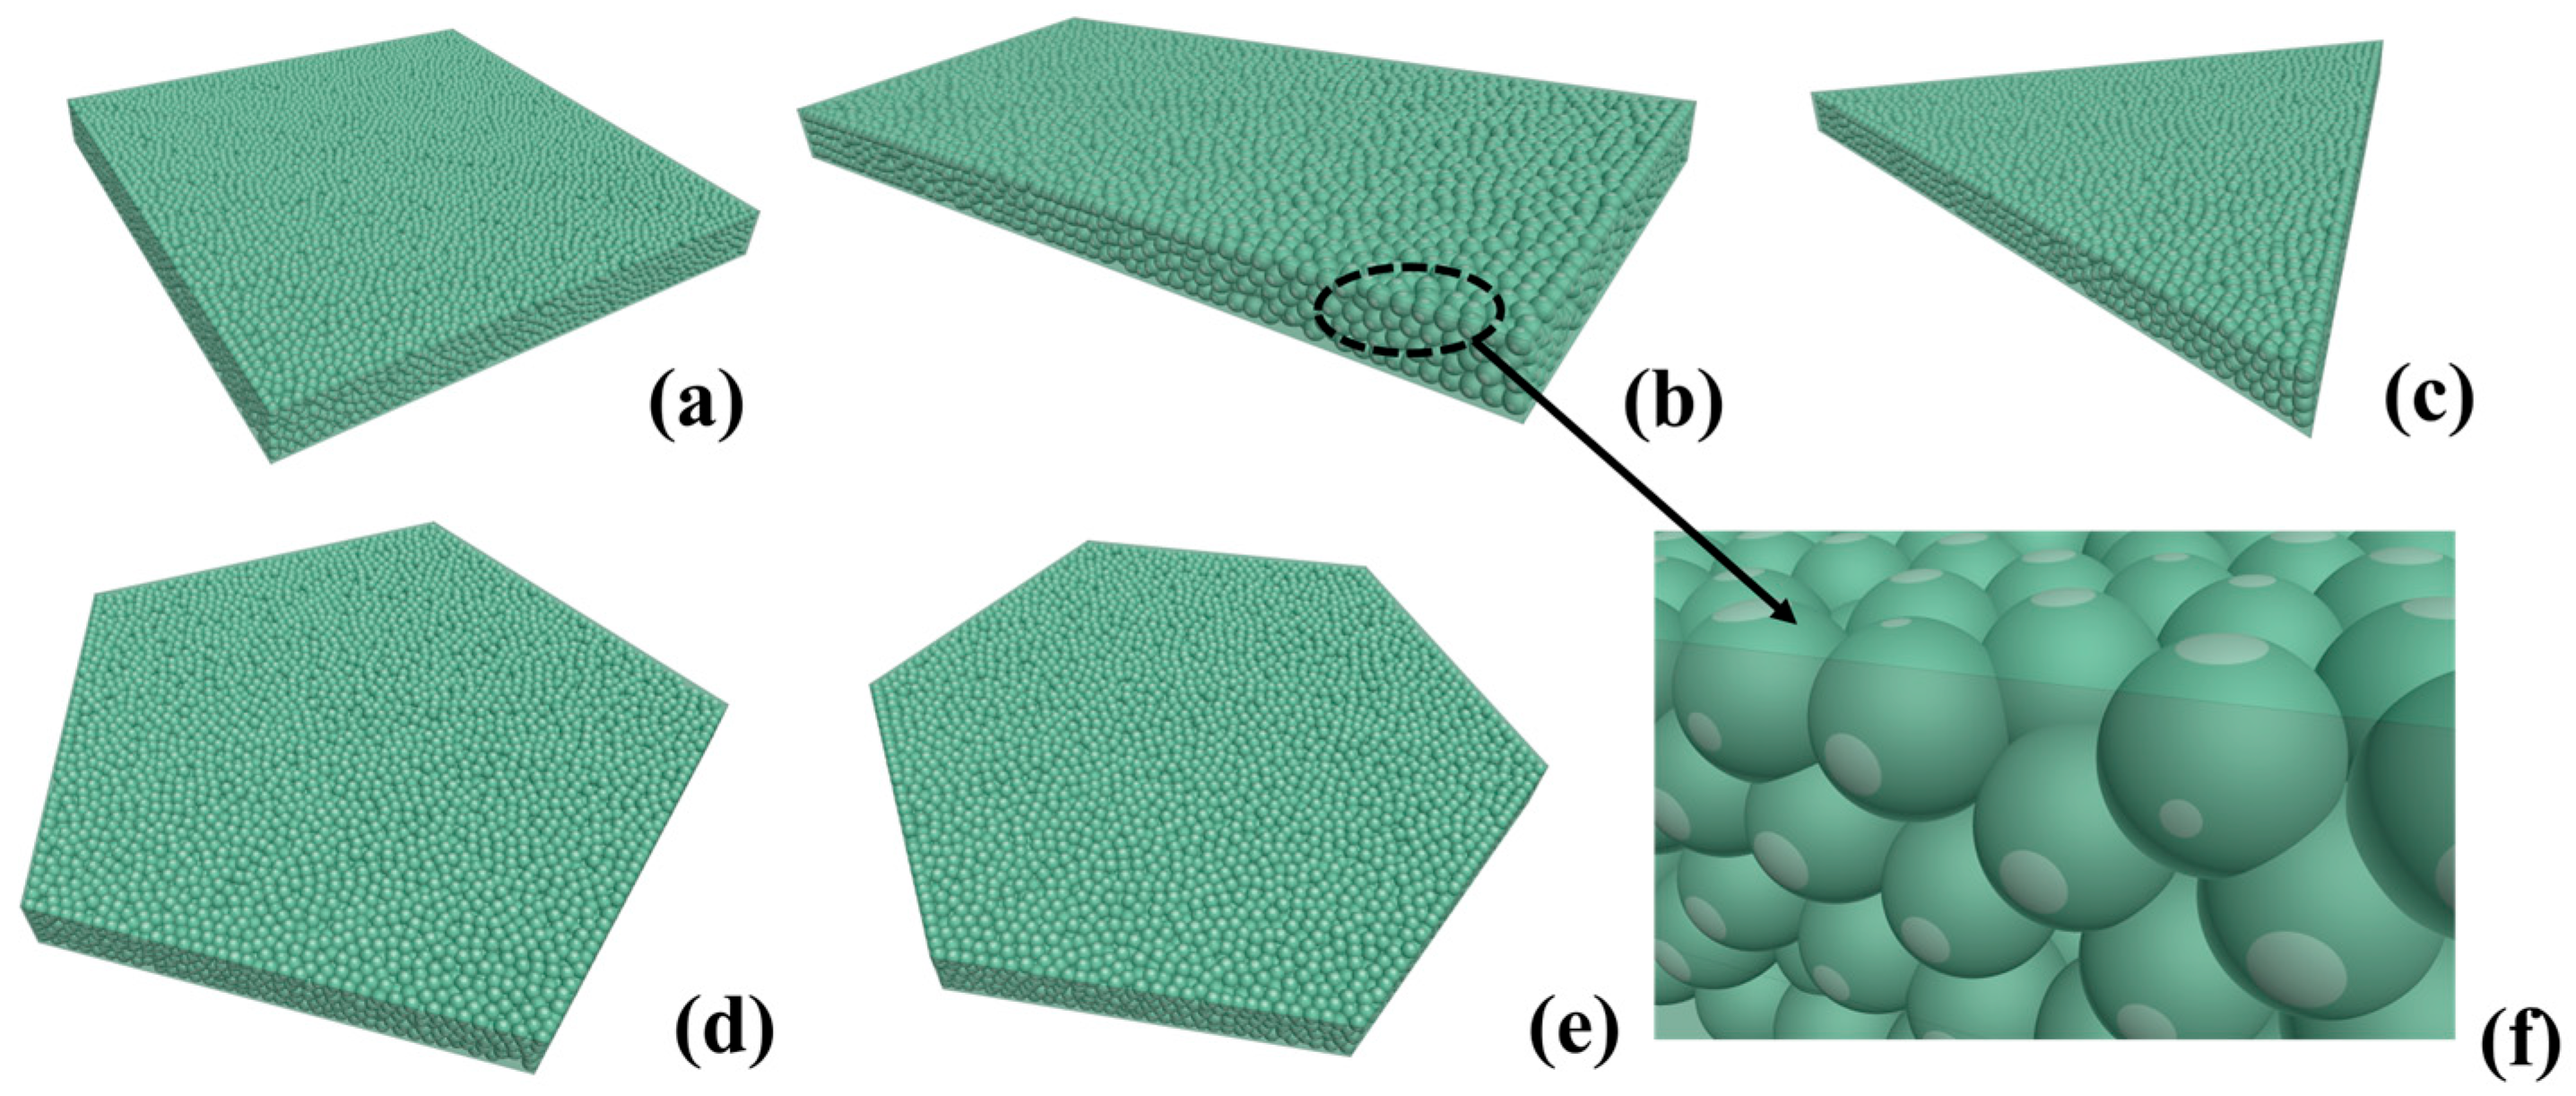
In the design of solar roads photovoltaic panels, the choice of the basic unit form directly affects the mechanical properties, splicing method, construction convenience, and material utilization of the structure. The ideal unit form should meet the following requirements: uniform stress distribution under load, avoid local stress concentration, and ensure structural strength and stability; the units should be able to be closely spliced to reduce the splicing gap and improve the uniformity of the overall structure; the unit shape should be easy to manufacture, transport and construct, improve construction efficiency and reduce costs; minimize material waste and improve resource utilization efficiency; the geometric form of the road should be considered to ensure that the unit can flexibly adapt to different road layouts. Based on the above requirements, this paper focuses on analyzing five-unit forms: square, rectangle, triangle, pentagon, and hexagon, and evaluates their applicability in solar roads photovoltaic panels, as shown in
Figure 2.
2.3. Establishment of Computational Model and Determination of Parameters
To study the influence of different unit shapes and splicing methods on the mechanical properties of solar roads photovoltaic panels, this paper uses the DEM to establish a computational model. Photovoltaic panel units with different geometric shapes such as square, rectangular, triangular, pentagonal, and hexagonal are constructed (
Figure 3). DEM is used to simulate the particle crushing behavior and overall stability of the panel under stress. To simplify the calculation, the model assumes that the material is homogeneous and isotropic, ignores the internal micro defects of the photovoltaic panel, and assumes standard environmental conditions and uniform load. In addition, the preliminary calculation does not consider long-term fatigue damage and only analyzes short-term mechanical responses. In PFC3D, microscopic parameters need to be calibrated by comparing them with macroscopic experimental data [
24]. In this study, the numerical inversion method [
25] is used to ensure that the model is consistent with the actual material behavior in terms of macroscopic mechanical response. The detailed calculation parameters are shown in
Table 1.
2.4. Calculation Conditions
In order to comprehensively analyze the mechanical properties of solar roads photovoltaic panels in different application scenarios, this study sets a variety of calculation conditions based on the DEM, mainly considering the shape and size of the unit photovoltaic panel on the stress characteristics of the overall structure. The detailed working condition settings are shown in
Table 2. All panels have a uniform thickness of 10 cm, and the loading rate is 1.0 mm/min to ensure consistent boundary and loading conditions. In terms of shape, five typical geometries were selected: square, rectangle (aspect ratio 1:2), triangle, regular pentagon, and regular hexagon. These represent common or structurally meaningful forms used in modular pavement design.
In terms of size, this study varies the side lengths only for square panels (0.707 m, 1.0 m, and 1.5 m), while keeping the area of other shapes equivalent to the medium-sized square panel (1.0 m × 1.0 m). This selective variation was adopted to avoid redundancy and to ensure a clear and controlled investigation of the size effect. Since square panels exhibit straightforward geometry and uniform stress paths, they were chosen as the representative shape for size-dependent analysis. The conclusions from these square panel tests were then used as a reference framework to interpret the performance of other shapes under equivalent conditions.
3. Results and Discussion
3.1. Stress Distribution and Deformation Characteristics of Different Shapes
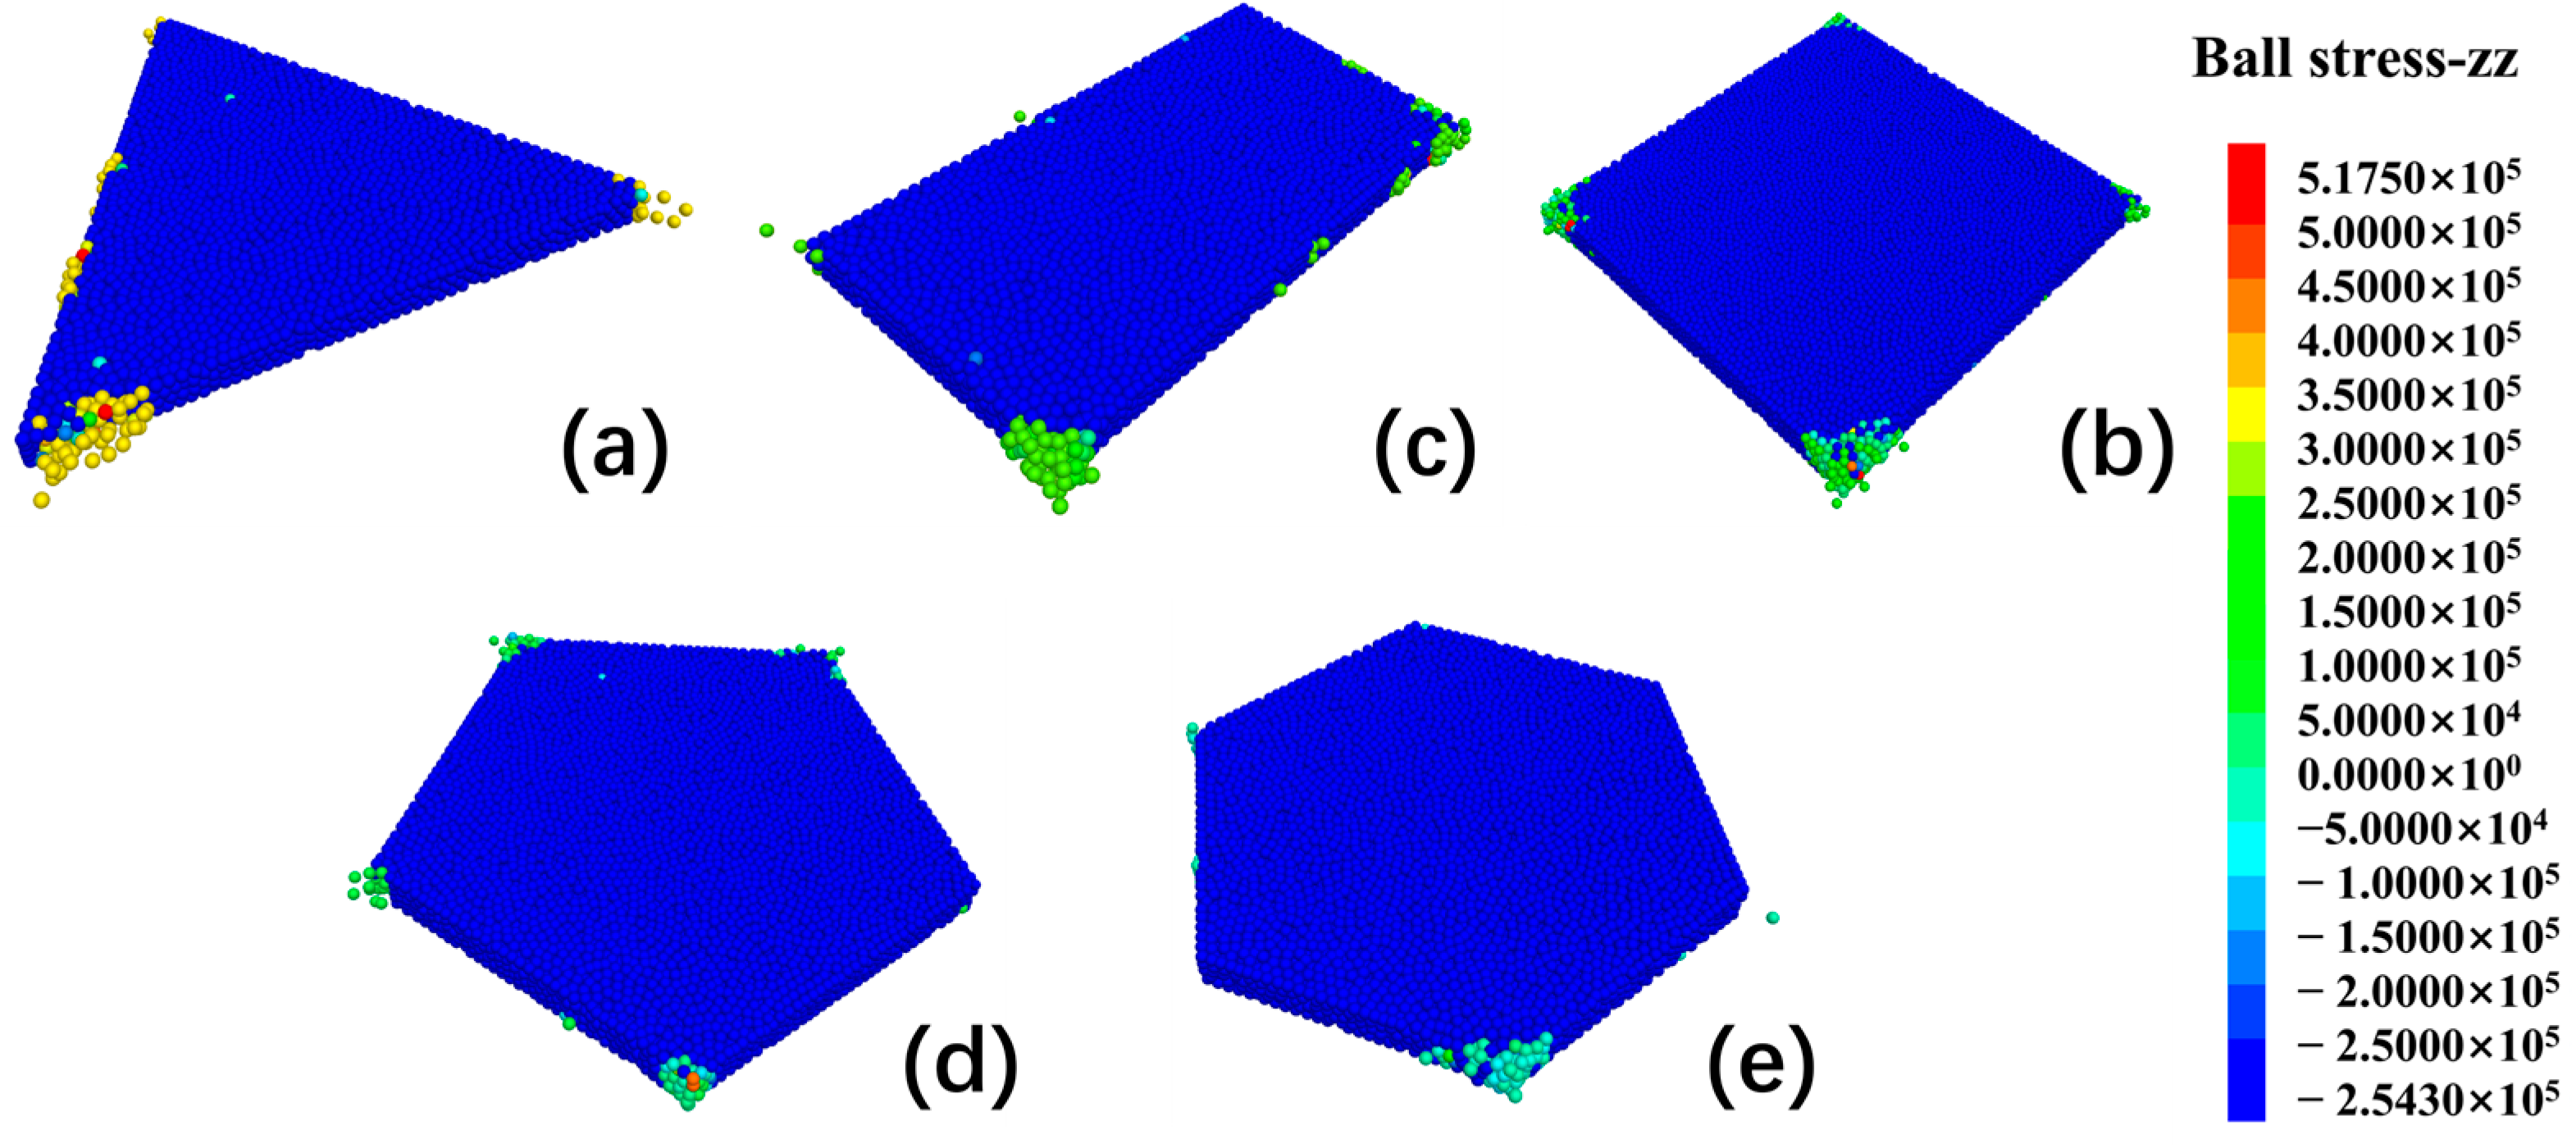
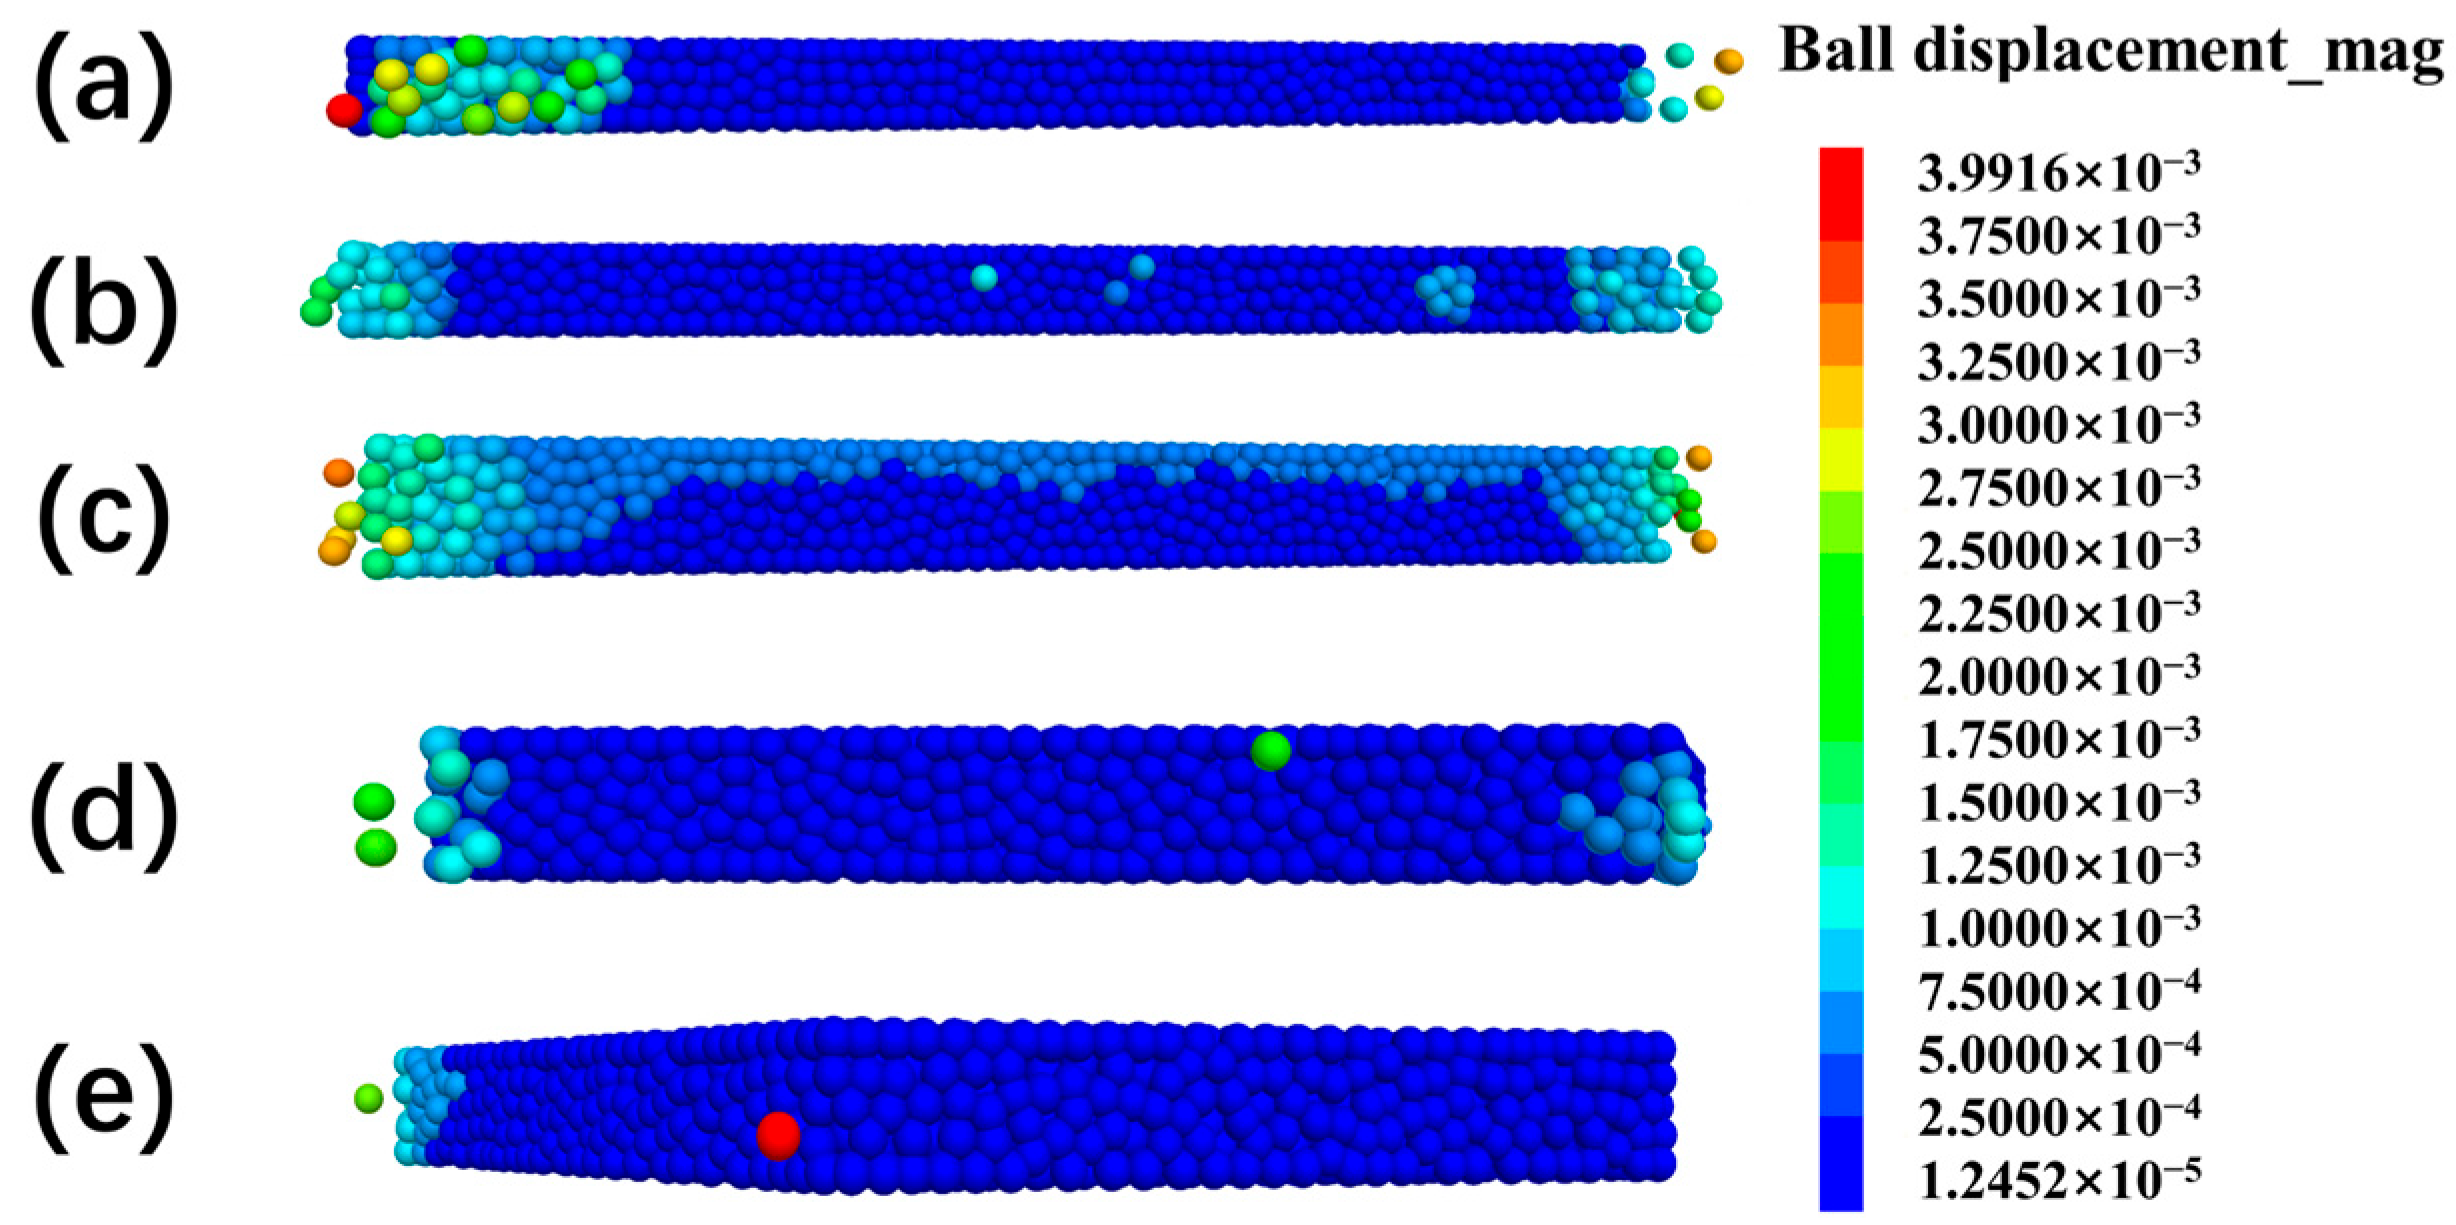
To investigate the differences in mechanical responses of solar roads panels with various geometric units under identical boundary conditions (i.e., same loading method, cross-sectional area, and thickness), this study employs discrete element method (DEM) simulations on five typical unit shapes: triangle, rectangle, square, regular pentagon, and regular hexagon. The stress field distributions (
Figure 4) and deformation field patterns (
Figure 5) for each geometry are analyzed accordingly.
As shown in
Figure 4, stress concentration is primarily located along the edges of the units, and the uniformity and intensity of stress distribution vary significantly with shape. The triangular panel (
Figure 4a) exhibits the most pronounced stress concentration, with a maximum compressive stress of 5.18 × 10
5 Pa along the loading direction and intense high-stress zones (in red) near the corners, indicating poor stress diffusion. In contrast, the regular hexagonal unit (
Figure 4e) shows the most uniform stress distribution, with a significantly lower peak stress around 5.00 × 10
4 Pa, and a wide area of low-concentration stress illustrated by a smooth blue-to-green gradient. This suggests that the hexagon’s high geometric symmetry and multiple edges allow effective load dispersion, leading to superior mechanical stability. The rectangular and square units (
Figure 4b,c) exhibit intermediate behavior, but still show local stress concentrations at the corners and edges.
In terms of deformation (
Figure 5), the maximum particle displacements along the loading direction also vary notably among different shapes. The triangular unit (
Figure 5a) experiences the largest displacement of 3.99 × 10
−3 m, mainly concentrated at the front-loading edge, indicating the lowest stiffness and a tendency for warping. In comparison, the regular pentagon and hexagon units (
Figure 5d,e) exhibit smaller maximum displacements of 1.75 × 10
−3 m and 1.24 × 10
−3 m, respectively, reflecting higher structural stiffness and better resistance to deformation. Additionally, the displacement distribution in the hexagonal unit is more uniform across all directions, with no evident displacement clusters, confirming its excellent deformation coordination.
These results highlight that geometric shape plays a critical role in the stress and deformation performance of solar roads panels. Triangular units, due to sharp angles and inefficient stress transfer, suffer from the most severe deformation and stress concentration. Conversely, regular hexagons exhibit optimal performance in terms of structural balance, load diffusion, and deformation coordination. This underscores the strong engineering potential of hexagonal units in pavement and modular road design, with the capacity to significantly enhance the structural stability and service life of solar roads.
3.2. Stress Distribution and Deformation Characteristics of Different Sizes
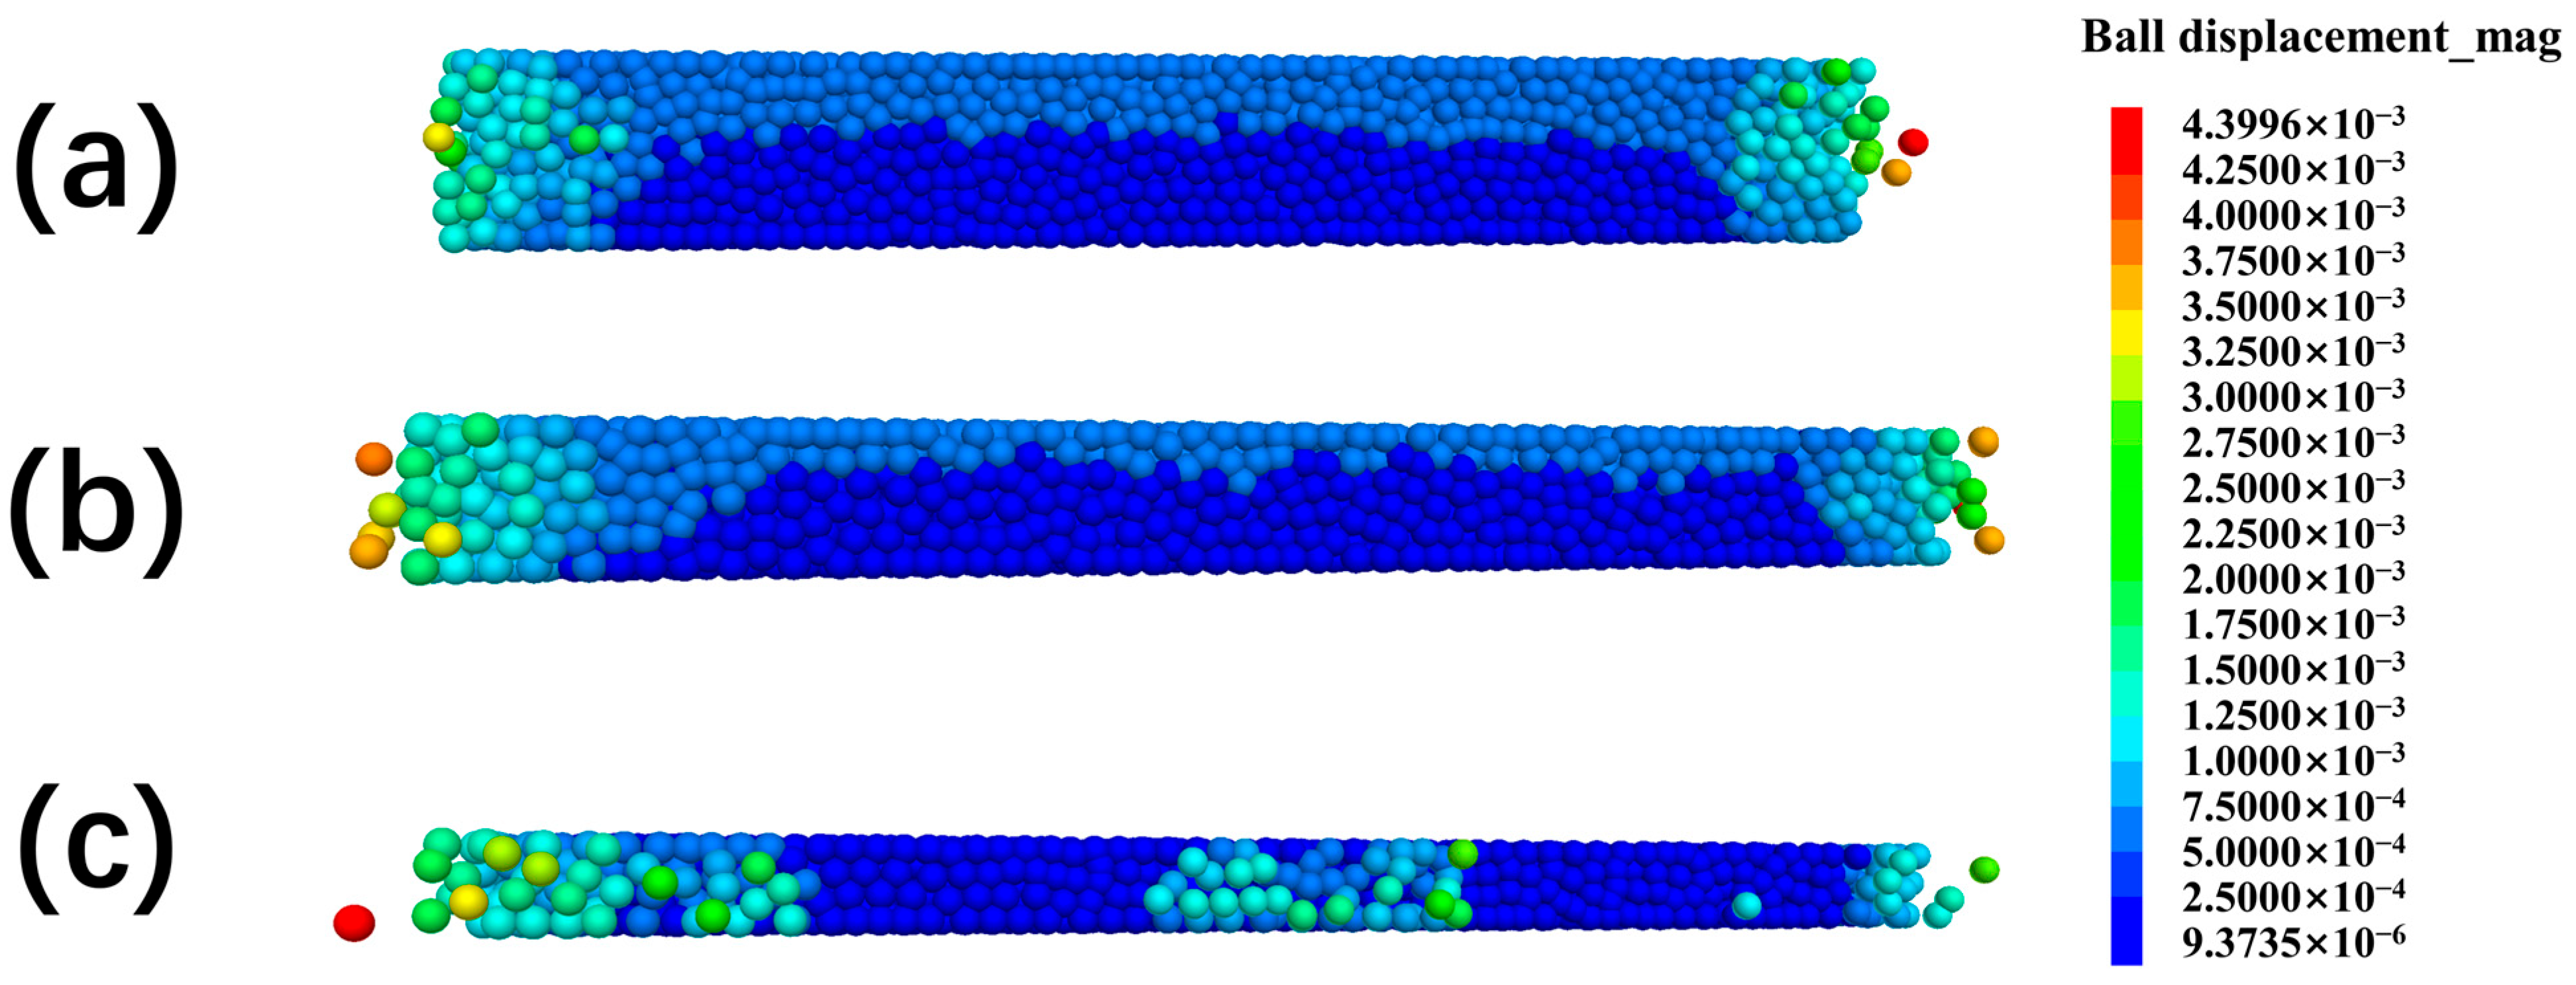
This section presents numerical simulations of square solar panel units with side lengths of 0.707 m, 1.0 m, and 1.5 m (under consistent cross-sectional area and loading conditions in the thickness direction) to investigate the influence of panel size on load-bearing capacity and deformation performance.
Figure 6 and
Figure 7 illustrate the stress distribution and particle displacement characteristics, respectively, under vertical loading.
As shown in the stress distribution results (
Figure 6), panel size has a significant impact on stress concentration at edges and corners. The 0.707 m panel (
Figure 6a) exhibits minor stress concentrations at the four corners, with a maximum stress of approximately 5.16 × 10
4 Pa. The stress transitions smoothly in green-blue tones, indicating a relatively uniform distribution. As the size increases to 1.0 m (
Figure 6b), the number of high-stress points around the corners increases, with localized yellow-green transition zones emerging, suggesting that larger panels experience stronger boundary effects and more pronounced stress concentrations. In the largest panel (1.5 m,
Figure 6c), extensive high-stress areas in red and yellow appear at the edges and corners, with the peak compressive stress rising to 2.86 × 10
5 Pa, indicating greater stress accumulation and less uniform stress distribution as size increases.
The deformation fields in
Figure 7 further reveal the impact of panel size on structural stiffness. The 0.707 m panel (
Figure 7a) has a maximum displacement of approximately 3.00 × 10
−3 m, mainly concentrated at the front edge of the loaded area, reflecting good overall stiffness. With the 1.0 m panel (
Figure 7b), the maximum displacement increases slightly to around 3.25 × 10
−3 m, indicating a slight reduction in stiffness and a broader load-bearing region. In the case of the 1.5 m panel (
Figure 7c), both edge and central displacements are noticeably higher, with a maximum displacement of about 4.40 × 10
−3 m. The panel also shows increased deformation across the central body, revealing a significant decrease in stiffness due to size enlargement. Notably, as the panel size increases, the structure exhibits a more pronounced “thinning” effect after loading. This is reflected not only in the increase in maximum displacement but also in the broader deformation zones and weakened stiffness in the thickness direction. For the 1.5 m panel, large deformations are observed at both the edges and center, suggesting a loss of cooperative load-bearing behavior typical of plate structures and a shift toward a flexible structural response mode. This thinning effect essentially stems from localized stiffness reduction and uneven load distribution caused by the increase in panel size.
Further analysis of the deformation field shows that larger panels have wider loaded areas and reduced deformation gradients, indicating a flattening of load transfer paths and a decrease in local bending stiffness. While larger panel sizes can provide greater surface coverage, they also pose risks to structural integrity and resistance to deformation. Under extreme conditions such as concentrated loads or wind pressure, this thinning tendency may become a critical trigger for structural failure.
3.3. Failure Mode and Fracture Behavior Analysis
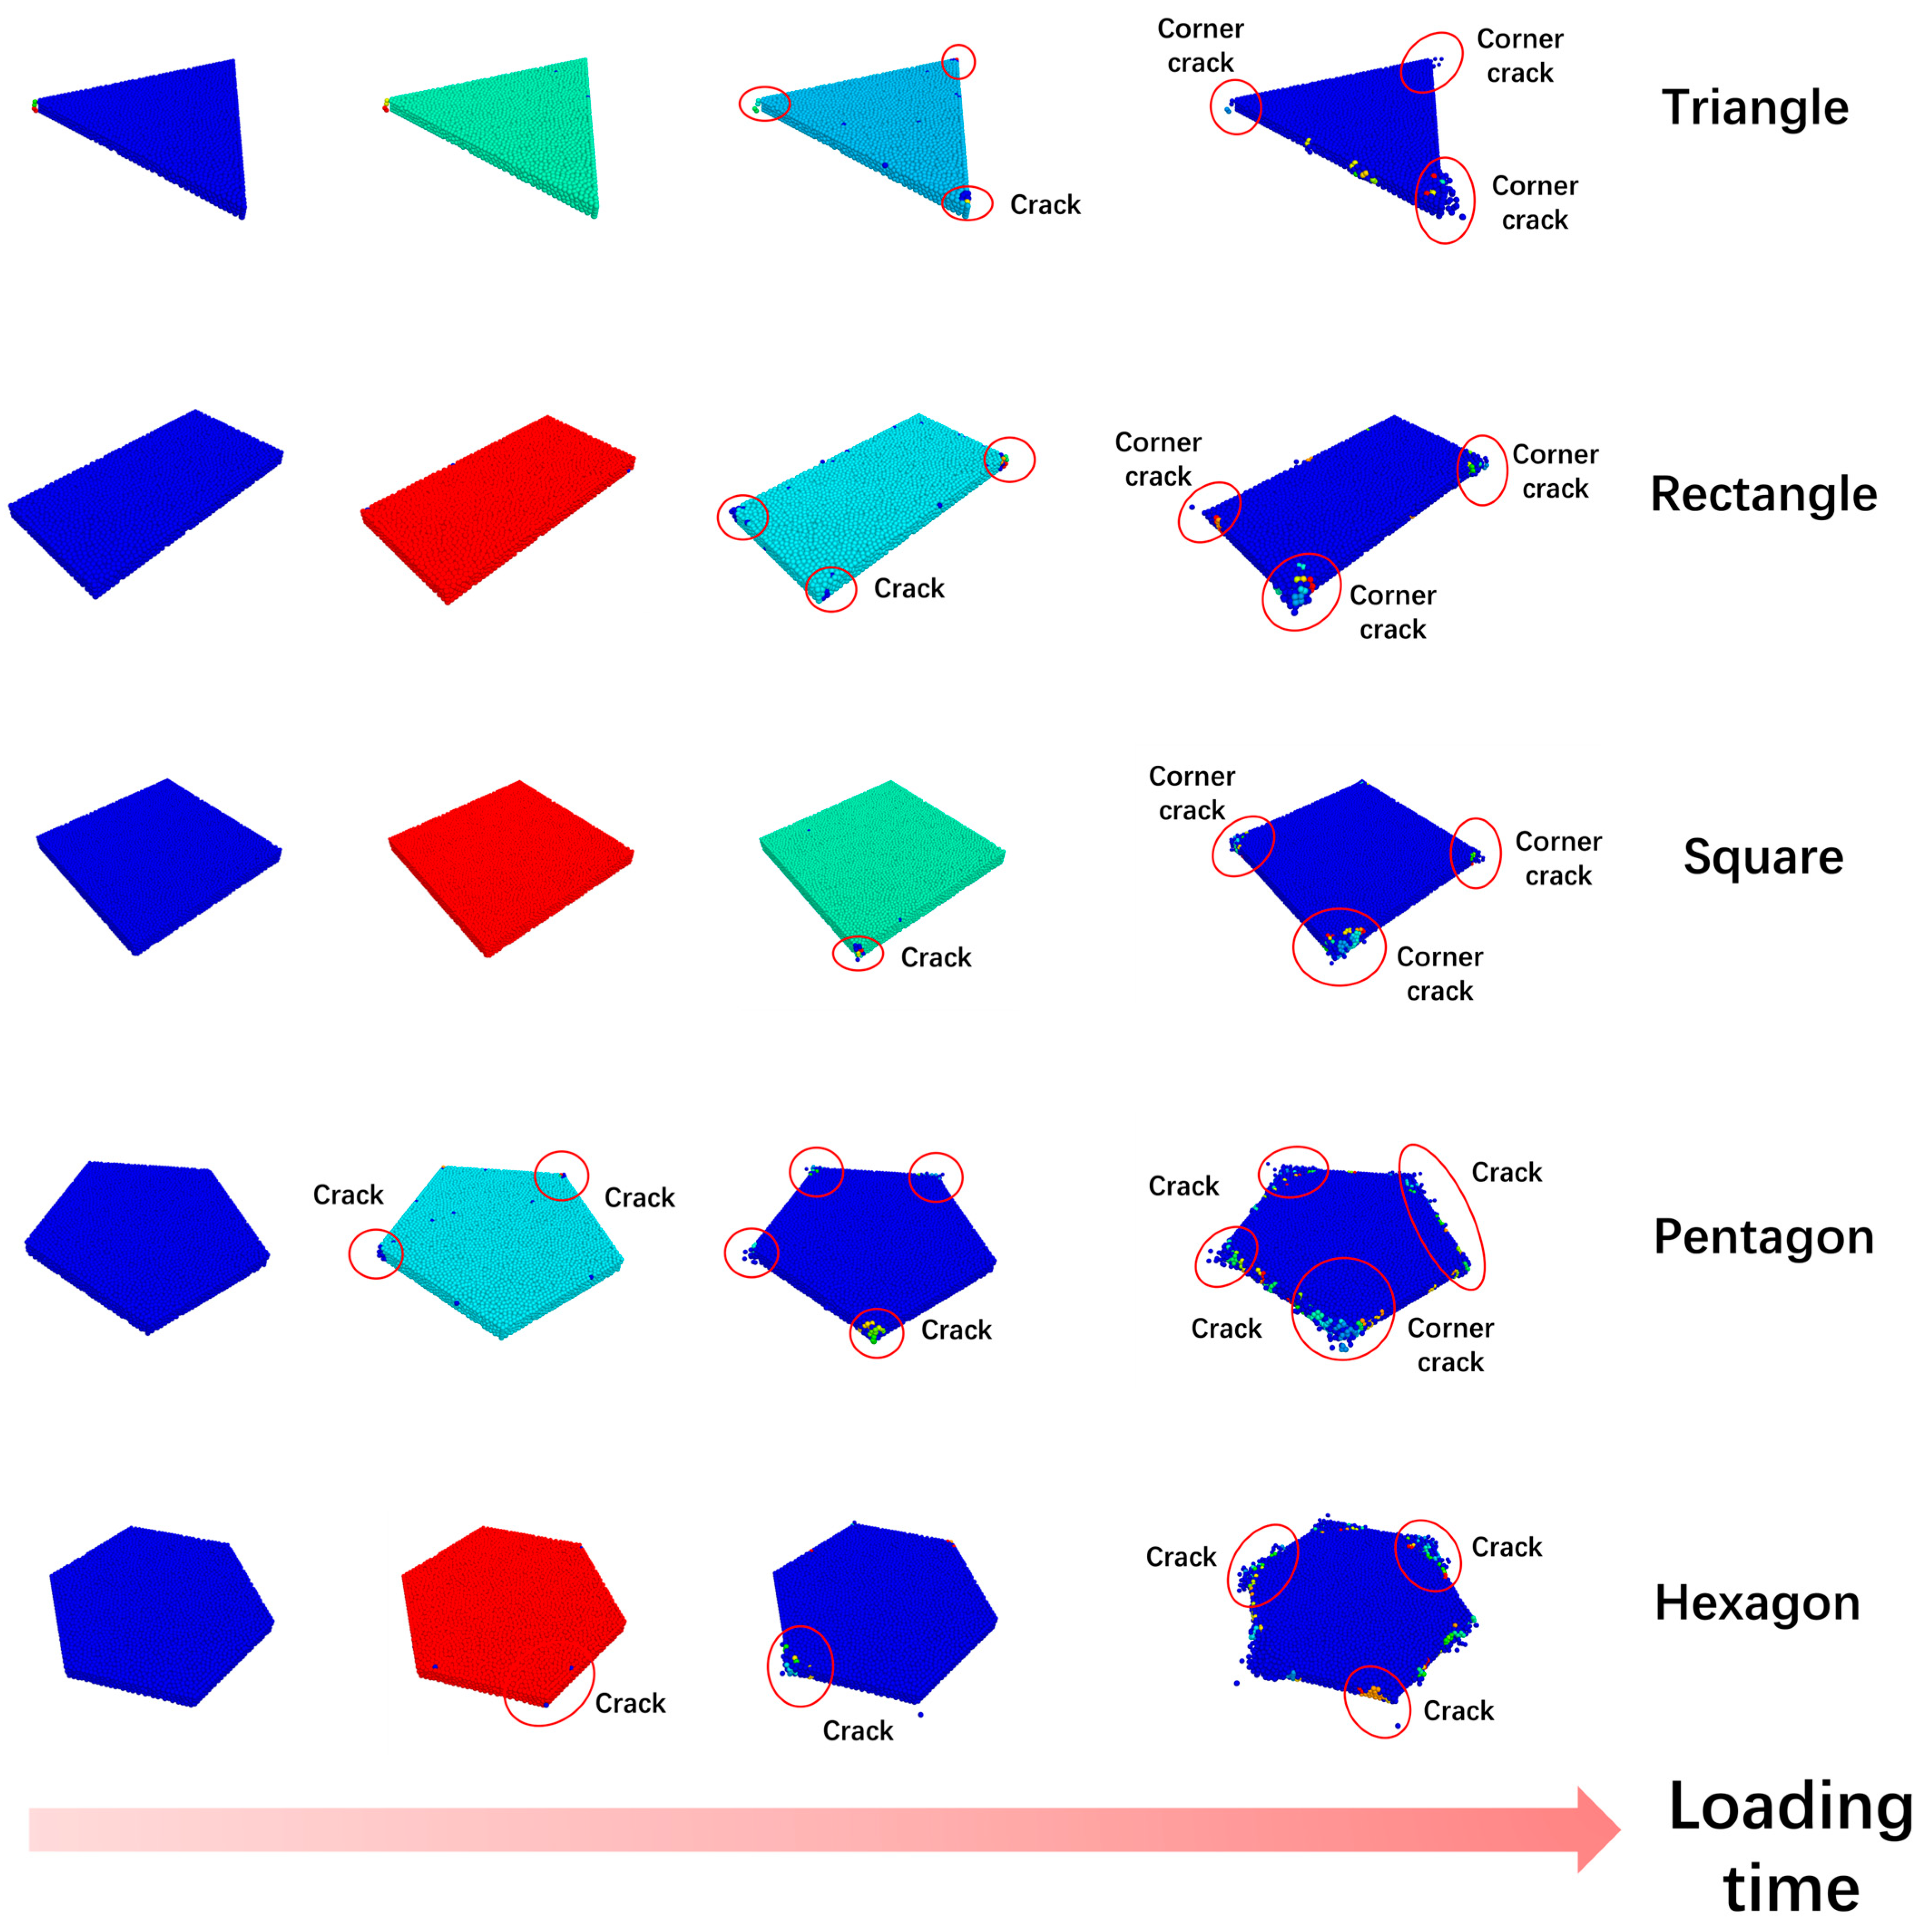
This study systematically investigates the influence of structural geometry on the mechanical failure processes of solar roads panels through finite element simulations of various cross-sectional shapes (
Figure 8) and sizes (
Figure 9). In the discrete element simulations, the stress in all models initially concentrated around the corners, where cracks first emerged—particularly at sharp angles—and then rapidly propagated along the principal stress directions, eventually forming a variety of characteristic failure patterns. The fractured units, shown in red in the simulation images, clearly depict the crack propagation paths and failure processes, illustrating a complete evolution from crack initiation to structural disintegration.
Concerning the influence of cross-sectional shape on fracture modes (
Figure 8), panels with triangular and rectangular geometries exhibited crack initiation predominantly at sharp corners, with cracks quickly propagating along the structural boundaries to form prominent primary fracture planes, ultimately leading to failure along the geometrical symmetry axis. In square panels, cracks radiated from the center towards the four corners, forming a distinct cross-shaped fracture pattern with regular and symmetric crack paths. For panels with more corners, such as pentagons and hexagons, cracks are initiated simultaneously at multiple edges, producing intricate and intersecting propagation paths. This led to fragmentation into numerous irregular pieces, indicating a highly shattered failure mode. This fragmentation mechanism represents a shape-dependent transition in failure mode, from centralized crack propagation to distributed micro-breakage, governed by the panel geometry’s effect on stress flow and energy dissipation. The particle breakage diagrams at the bottom further confirm this process: a greater number and denser distribution of broken particles, along with prominent intersecting cracks, suggest more diverse internal crack evolution paths and more intense energy release during failure. This behavior can be qualitatively explained by Griffith’s fracture theory [
26], which states that when the stress intensity factor
K exceeds the material’s critical fracture toughness
Kc, cracks propagate unstably. In shapes with more corners, the stress distribution becomes increasingly complex, enhancing multidirectional crack propagation and promoting fragmentation.
On the other hand, the size effect analysis in
Figure 9 shows that, for a given panel shape, increasing the structural size significantly accelerates the time scale of failure evolution. In small panels (0.707 m), crack initiation was relatively delayed, with sparse particle breakage and a largely intact structure. In medium-sized panels (1.0 m), cracks emerged earlier, with increased breakage density and noticeable fragmentation. In large panels (1.5 m), cracks propagated rapidly in the early loading stages, with multiple corners failing simultaneously, leading to widespread breakage and near-complete structural disintegration. This size effect aligns with the energy release rate theory in fracture mechanics, where the stress intensity factor at the crack tip is proportional to the square root of the structure’s size. Larger structures present longer potential crack paths and higher stress concentrations, which more readily satisfy fracture criteria, allowing cracks to propagate and destabilize the structure earlier. Moreover, increased panel size reduces overall stiffness, resulting in greater deflections under the same load and thereby accelerating crack propagation.
In summary, the fracture behavior of solar roads panels is jointly governed by their geometric shape and size. Geometry determines the initiation points and propagation paths of cracks, influencing the symmetry and fragmentation degree of failure patterns. Size, on the other hand, affects the timing of crack initiation and the rate of energy release, controlling the temporal scale and extent of structural failure. These findings have significant implications for the optimized design of solar roads panels. It is recommended to avoid sharp-cornered geometries and to carefully control panel dimensions to enhance fracture resistance and extend service life.
3.4. Solar Panel Load Capacity and Durability Comparison
To quantify the structural performance of solar panels of different shapes or sizes, this paper introduces the following indicators: (1) the ultimate bearing capacity per unit area Fmax, which is used to compare the bearing capacity of the structure for concentrated loads and can be calculated by Formula (1); (2) the total energy absorbed by the structure before failure E, which represents the “toughness” of the structure before failure. The calculation diagram is shown in
Figure 10 [
25], and the calculation formula is shown in Formula (2).
where
Fmax is the ultimate bearing capacity per unit area;
A is the cross-sectional area of the solar panel;
δ is the loading displacement.
To comprehensively evaluate the structural strength and durability performance of different solar panel units, this study analyzed their ultimate bearing capacity
Fmax, maximum deformation, and fracture energy
E, as summarized in
Table 3 and
Table 4. As shown in
Table 3, significant differences exist in the mechanical responses among panels of different cross-sectional shapes. The triangular unit exhibited the highest ultimate bearing capacity, reaching 5.18 × 10
5 N, and also absorbed the greatest amount of fracture energy 1.03 × 10
6 mJ), indicating superior strength and energy absorption capacity. However, this was accompanied by the largest deformation (3.99 mm), suggesting weaker stiffness and limited structural stability. In stark contrast, the regular hexagonal unit showed the lowest ultimate bearing capacity 5.00 × 10
4 N, but also the smallest deformation (1.24 mm) and the least energy dissipation 3.10 × 10
4 mJ, reflecting excellent structural rigidity and deformation coordination. These results reveal a “high-strength–low-stability” characteristic for triangular structures and a “low-strength–high-stability” mechanism for hexagonal structures, highlighting a notable shape-performance coupling relationship.
Regarding the size effect,
Table 4 shows that as the panel side length increased from 0.707 m to 1.5 m, the ultimate bearing capacity rose from 5.16 × 10
4 N to 2.86 × 10
5 N, and the fracture energy significantly increased from 7.74 × 10
4 to 6.29 × 10
5 mJ. This indicates that enlarging the panel size enhances both load-bearing capacity and energy dissipation ability. However, the maximum deformation also increased from 3.00 mm to 4.40 mm, reflecting reduced stiffness and intensified stress concentration near the boundaries. These findings corroborate the stress accumulation and displacement diffusion phenomena observed in
Table 3 and
Table 4. Thus, although larger panels offer greater load reserves, they also carry a higher risk of edge failure, which must be mitigated through structural reinforcement strategies—such as stiffening ribs or optimized corner designs—to balance strength improvement with long-term durability.
In conclusion, the structural performance of solar panels is significantly influenced by the coupled effects of shape and size. Shape governs the load transfer paths and deformation coordination, affecting local stability and crack propagation tendencies. The size determines the load-bearing threshold and stress distribution range, playing a decisive role in overall durability. Therefore, in practical engineering design, unit shape and size should be reasonably selected according to pavement conditions and service requirements to achieve an optimal balance of strength, stiffness, and durability.
4. Discussion on the Performance of the Overall Splicing Structure of Photovoltaic Panels on Solar Roads
The service performance of solar roads depends not only on the strength and durability of individual photovoltaic (PV) panels but also significantly on the configuration of their overall assembly. A well-designed panel interlocking system can enhance the global deformation resistance, distribute concentrated stresses, delay crack propagation, and improve both service life and engineering adaptability. Building upon the previous systematic investigation of mechanical properties across various panel geometries, this section further explores how different layout patterns of panel assembly influence structural performance.
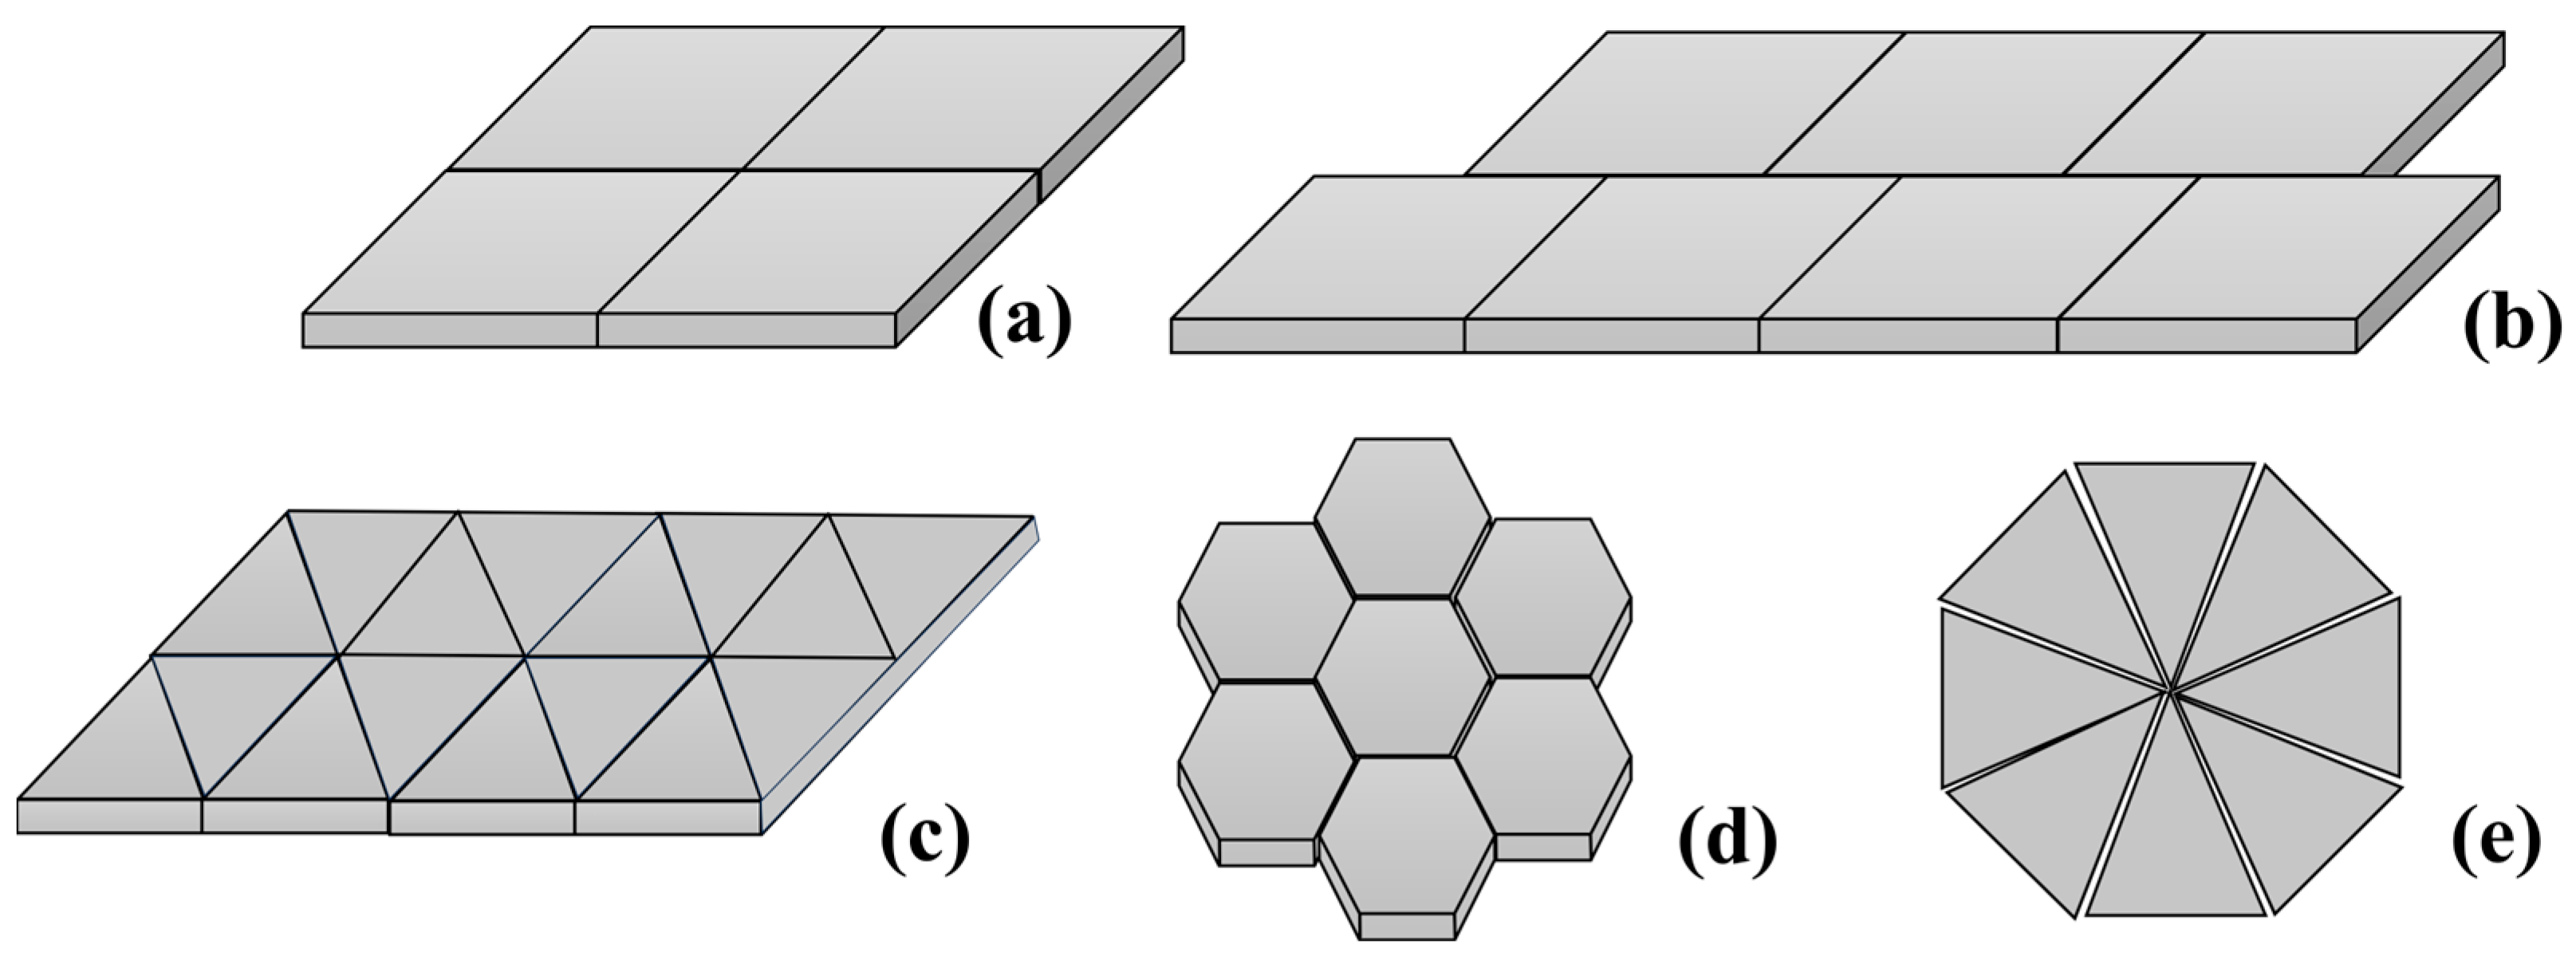
Common PV panel interconnection methods include: regular grid arrangement, staggered configuration, honeycomb nesting, and radial/concentric layout (as shown in
Figure 11 and
Table 5). The regular grid arrangement typically involves square or rectangular panels aligned for high standardization and ease of installation, making it suitable for large, linear road sections. However, this configuration is prone to stress concentration at the panel joints, particularly under repeated longitudinal loads or thermal expansion and contraction, where cracks tend to initiate and propagate along the symmetrical seams, compromising overall durability. In contrast, staggered arrangements place adjacent panel rows in offset positions, effectively disrupting continuous stress paths and reducing the likelihood of straight-line crack propagation. This configuration exhibits superior shear stiffness and deformation coordination, especially under shear-dominant structural responses, and is analogous to the brick bonding method in masonry, offering enhanced structural ductility and fatigue resistance—ideal for PV pavements under heavy traffic loads.
The honeycomb nesting pattern, based on regular hexagonal panels, forms a seamless tessellation in the 2D plane and is currently considered the most mechanically promising layout. As analyzed in
Section 3, the hexagonal shape offers high geometric symmetry and excellent load dispersion capability. The resulting honeycomb network allows for multi-directional load transfer, significantly reducing-edge stress concentrations and the risk of localized warping. Additionally, this configuration maximizes material utilization, ensures tight interlocking, and minimizes joint cracking or panel uplift, making it highly attractive for engineering application and scaling. However, it is important to note that hexagonal panels, while mechanically advantageous, present certain construction challenges. These include increased manufacturing complexity, the need for customized molds, and more intricate alignment during installation compared to square or rectangular modules. To address this, modular prefabrication strategies, standardized interlocking mechanisms, and automated laying techniques (e.g., robotic or track-guided placement) should be explored in future research to improve construction efficiency and scalability. In practical applications, the choice of panel shape must strike a balance between performance optimization and ease of fabrication and deployment. For irregular road sections—such as roundabouts, intersections, and other complex geometries—radial or concentric layouts may be employed. Although these configurations lack high standardization, they enable close conformity to curved surfaces and can optimize load paths and stress distributions through gradient transitions, effectively preventing stress accumulation caused by geometric discontinuities. Such designs require customization of panel sizes and angles to maintain structural continuity and integrity following local geometry.
In addition to structural optimization, the environmental implications of panel layout and system integration must be considered. Unlike standalone solar farms that require dedicated land, solar PV pavements generate energy on already-developed transportation corridors, making them highly land-efficient. Layouts that maximize panel density and minimize unused surface area—such as hexagonal or staggered patterns—can improve the energy yield per unit of road area without increasing land footprint. This dual use of infrastructure not only enhances spatial efficiency but also aligns with sustainable development goals by avoiding the ecological and agricultural land trade-offs associated with ground-mounted solar installations. From a sustainability standpoint, the use of structurally optimized panels (e.g., hexagonal units with better fatigue resistance) is expected to reduce lifecycle greenhouse gas emissions by minimizing the frequency of repairs or replacements. However, we acknowledge that this expectation is currently based on theoretical assumptions, and no direct carbon emission data has been presented in this study. From a lifecycle perspective, the selection and assembly of PV panels significantly influence the carbon footprint of solar roads. Modular systems with high durability, low maintenance needs, and optimized structural performance tend to have longer service lives and reduced life-cycle greenhouse gas emissions. For example, staggered or honeycomb layouts that reduce crack propagation and panel failure may extend the operational period of a solar pavement beyond its nominal design life, thereby increasing the total energy output and improving the system’s GWP recovery ratio. To support these assumptions with evidence, future research will incorporate quantitative life cycle assessment (LCA) to evaluate the embodied carbon emissions, maintenance-related emissions, and environmental returns associated with different panel shapes and assembly strategies. This will help establish a more accurate environmental impact profile for solar road systems.
In summary, the interconnection strategy of solar roads PV panels plays a crucial role in determining the overall mechanical performance and service safety of the system. Regular grid arrangements are suitable for standard segments, staggered configurations enhance structural stability, honeycomb nesting offers superior load dispersion and fatigue resistance, and radial layouts improve adaptability to complex terrains. It is recommended that design decisions not only consider mechanical performance but also account for constructability, material standardization, and lifecycle environmental impacts. It is recommended that engineers select panel layouts based on actual roadway geometries and service conditions, and optimize design parameters through finite element simulations and prototype testing, to achieve optimal integration of structural functionality and engineering performance.
5. Conclusions and Outlook
5.1. Main Conclusions
This study, based on the discrete element method (DEM), systematically analyzes the mechanical responses, deformation behaviors, and failure modes of photovoltaic (PV) panels with various geometric shapes (including triangles, rectangles, squares, regular pentagons, and regular hexagons) and different dimensions under typical loading conditions. It further investigates how panel assembly configurations affect overall structural performance. The main conclusions are as follows.
(1) Geometric shape significantly influences the structural performance of PV panels. Although triangular units exhibit the highest ultimate load-bearing capacity (5.18 × 10⁵ N) and fracture energy (1.03 × 10⁶ mJ), they are prone to severe stress and deformation concentration (peak stress 5.18 × 10⁵ Pa and large deformation 3.99 mm), leading to poor structural stability. In contrast, regular hexagonal units demonstrate superior stress dispersion (peak stress 5.00 × 10⁴ Pa), uniform displacement distribution (maximum displacement 1.24 mm), and reduced energy release (3.10 × 10⁴ mJ), resulting in higher stiffness and service safety. Therefore, hexagonal geometry is the preferred unit shape for solar road panels.
(2) Panel dimensions affect load-bearing capacity and stiffness. As the size increases from 0.707 m to 1.50 m, the ultimate load capacity improves from 5.16 × 10⁴ N to 2.86 × 10⁵ N, and fracture energy increases from 7.74 × 10⁴ mJ to 6.29 × 10⁵ mJ, indicating a certain reserve of structural capacity. However, maximum deformation and stress concentration zones also expand significantly, leading to a reduction in structural stiffness and an increased risk of edge failure due to the “thinning effect.” Therefore, large-size panels require structural reinforcement in practical applications to maintain integrity.
(3) Failure modes are governed by the coupling of shape and size. Geometric shape dictates the crack initiation points and propagation paths: sharp angles tend to cause stress concentrations and induce radial cracking, while an increase in edge number leads to interlaced crack evolution and fragmentation. Larger panel sizes accelerate failure evolution: compared with small panels (0.707 m), large panels (1.50 m) exhibit earlier crack onset, more intense fracture density, and complete fragmentation, due to higher stress intensity and energy release rate. This highlights the need for optimized panel sizing based on fracture control principles.
(4) Optimizing the assembly layout is key to improving overall performance. Honeycomb structures built with regular hexagonal units offer excellent mechanical stability and crack resistance, along with high space utilization and adaptability to complex pavements, making them promising for solar roads applications. It is recommended to prioritize highly symmetrical geometries with strong stress-dispersing capabilities in design and adopt staggered arrangements to alleviate local stress concentrations.
5.2. Research Limitations and Further Research Ideas
In conclusion, the structural design of PV panels should achieve multi-factor synergy among shape, size, and assembly patterns to balance strength, stiffness, and durability, thereby providing theoretical guidance and a practical basis for constructing safe, stable, and cost-effective solar roads systems. Despite revealing the mechanical influence of panel geometry and size through DEM simulations, the study still has limitations. First, the model does not account for environmental factors such as temperature variation, moisture ingress, or coupled traffic loading, which may lead to an underestimation of the panel’s complex real-world responses. Second, the interface between the panel and sublayer is simplified, limiting insights into how structural integrity affects mechanical performance. Third, the panel material is assumed to be ideally homogeneous, neglecting the layered structure and material heterogeneity of actual PV modules. Fourth, the current model has not been calibrated or validated against laboratory load tests, which restricts the accuracy and reliability of the simulation results. Future work will incorporate experimental testing to verify and refine the DEM model, thereby enhancing its practical relevance. In addition, the observed “thinning effect” as the panel size increases may indicate a potential structural transition-from plate-like bending dominance to membrane-like tensile behavior-under vertical loading. This transition suggests a scale-dependent shift in load-bearing mechanisms due to the redistribution of stiffness and changes in boundary constraint ratios. Further investigation using shell theory and experimental validation is warranted to confirm this behavior and improve structural optimization strategies. Moreover, although the study considers geometric shapes with varying numbers of sides, it does not yet explore the direct influence of interior angles on stress concentration and fracture behavior. Since interior angles significantly affect local mechanical response—particularly at sharp corners—this factor will be included in future research through parametric geometry modeling and failure analysis.
Future research should address these gaps by (1) incorporating multi-physics coupling to simulate real-world service conditions, including the effects of dynamic traffic loading, temperature-induced stresses (e.g., daily and seasonal thermal cycles), and freeze–thaw actions, which are known to induce fatigue damage, crack propagation, and interfacial debonding in pavement structures, (2) developing more sophisticated material models to capture interlayer behavior and aging effects, (3) analyzing the role of interior angles in governing stress distribution and crack evolution, and (4) validating and refining simulations with experimental data to enhance predictive accuracy and engineering applicability, ultimately achieving an integrated structure–performance optimization of solar roads systems.


