Review

Machine Learning Applications for Diagnosing Parkinson’s Disease via Speech, Language, and Voice Changes: A Systematic Review

Telemedicine and Telepharmacy Centre, School of Medicinal and Health Products Sciences, University of Camerino, 62032 Camerino, Italy
*
Authors to whom correspondence should be addressed.
Inventions 2025, 10(4), 48; https://doi.org/10.3390/inventions10040048
Submission received: 29 April 2025 / Revised: 20 June 2025 / Accepted: 24 June 2025 / Published: 27 June 2025

Abstract

Parkinson’s disease (PD) is a progressive neurodegenerative disorder leading to movement impairment, cognitive decline, and psychiatric symptoms. Key manifestations of PD include bradykinesia (the slowness of movement), changes in voice or speech, and gait disturbances. The quantification of neurological disorders through voice analysis has emerged as a rapidly expanding research domain, offering the potential for non-invasive and large-scale monitoring. This review explores existing research on the application of machine learning (ML) in speech, voice, and language processing for the diagnosis of PD. It comprehensively analyzes current methodologies, highlights key findings and their associated limitations, and proposes strategies to address existing challenges. A systematic review was conducted following PRISMA guidelines. We searched four databases: PubMed, Web of Science, Scopus, and IEEE Xplore. The primary focus was on the diagnosis, detection, or identification of PD through voice, speech, and language characteristics. We included 34 studies that used ML techniques to detect or classify PD based on vocal features. The most used approaches involved free speech and reading-speech tasks. In addition to widely used feature extraction toolkits, several studies implemented custom-built feature sets. Although nearly all studies reported high classification performance, significant limitations were identified, including challenges in comparability and incomplete integration with clinical applications. Emerging trends in this field include the collection of real-world, everyday speech data to facilitate longitudinal tracking and capture participants’ natural behaviors. Another promising direction involves the incorporation of additional modalities alongside voice analysis, which may enhance both analytical performance and clinical applicability. Further research is required to determine optimal methodologies for leveraging speech and voice changes as early biomarkers of PD, thereby enhancing early detection and informing clinical intervention strategies.

1. Introduction

Parkinson’s disease (PD) is the second most prevalent age-related neurodegenerative disorder and is characterized by a broad spectrum of motor and cognitive impairments [1]. It affects millions of individuals globally and results from the degeneration of dopamine-producing neurons in specific regions of the brain [2]. These neurons are essential to produce dopamine, a neurotransmitter critical for regulating motor functions and other higher brain functions. As dopamine levels decrease, individuals begin to show symptoms such as slowed or lost motor reflexes, speech difficulties, cognitive decline, and behavioral changes [3]. A key challenge in clinical diagnosis is distinguishing between typical age-related cognitive decline and the early manifestations of PD [1].
More than 90% of individuals with PD develop hypokinetic dysarthria, a speech disorder characterized by reduced vocal loudness, monotone speech, a restricted fundamental frequency range, imprecise articulation of consonants and vowels, breathiness, and irregular pauses [4]. Previous research has demonstrated that speech signals may serve as valuable clinical markers for differentiating individuals with PD from healthy controls. Notably, vocal impairments are among the earliest manifestations of PD [5,6]. Consequently, the precise detection of these vocal abnormalities through speech analysis could serve as a tool for early diagnosis, which is important for starting therapeutic interventions aimed at slowing down the worsening of symptomatology.
Several studies have used speech and language as crucial sources of clinical information for PD, from foundational qualitative research to recent advancements in computational speech technology [7,8,9]. The potential of speech as a biomarker for PD arises from several key factors including easy recordability and longitudinal tracking. Significant advancements in speech analysis technologies were offered by developments in artificial intelligence (AI) and machine learning (ML) over the past decade.
Data-driven tools like AI and ML in healthcare open novel avenues for clinicians to enhance their services with greater efficiency. ML technologies offer accessible and cost-effective clinical solutions [10], as evidenced by recent studies focusing on their application in the diagnosis of diseases [9,11,12]. Studies explore leveraging language and voice data collected through various means and employing computational speech processing for tasks such as diagnosis, prognosis, and modeling PD progression [13,14,15,16]. This technology encompasses techniques for recognizing, analyzing, and comprehending spoken discourse, suggesting that at least a portion of the PD detection process is feasible. ML methods have played a pivotal role in this research, as they involve the development of predictive models directly from data, with the learner improving their performance through exposure to more data, akin to gaining experience. The exploration of automatic processing of speech and language through AI and ML methods has shown promising results and has garnered increasing interest in the field.
Several studies have reviewed the application of AI technologies in the diagnosis of PD. A systematic review and meta-analysis conducted by Pu et al. [17] explored the role of voice treatment and speech therapy in improving PD symptoms. Altham et al. [18] demonstrated the potential of ML in detecting and diagnosing cognitive impairment in PD. Their review focused on studies investigating cognitive impairment in PD patients through speech analysis, electroencephalography (EEG), and medical imaging. Similarly, Hecker et al. [19] reviewed studies analyzing voice characteristics for the diagnosis of various neurological disorders, including PD. Additionally, Idrisoglu et al. [20] examined research on diagnosing voice-affected conditions and disorders.
All the systematic reviews identified in our search primarily were focused on diagnosing voice-related disorders or assessing voice-based treatments in neurodegenerative diseases. However, no review articles specifically addressed the use of voice, speech, or language for the detection or diagnosis of PD through ML applications.
The purpose of this systematic review is to evaluate studies that employ AI and ML for diagnosing PD based on language, voice, and speech biomarkers for PD detection, classification, and diagnosis through ML techniques. We have (1) synthesized current evidence on ML applications in voice, speech, and language analysis for PD, (2) identified predominant methodological approaches and available datasets, and (3) examined ML models gaining prominence in this field and the underlying reasons for their adoption. Through this analysis, we hope to establish a foundation for future research and contribute to the formulation of guidelines for both academic inquiry and practical applications.

2. Methods

A systematic review was conducted on primary studies that estimated diagnosis or classification or identified PD based on speech, language, or voice changes using ML or DL methods. This study adhered to the Preferred Reporting Items for Systematic Reviews and Meta-Analyses (PRISMA) 2020 protocol by Page et al. [21]. The following sections detail the information sources, search strategy, eligibility criteria, study selection, data extraction, data items, risk of bias assessment, and data synthesis.

2.1. Information Sources

This review focuses on ML techniques within a specific research domain, which is predominantly medical rather than purely computational. Therefore, it is essential to consider sources from both medical and computational perspectives simultaneously, as relying solely on general sources may overlook relevant areas. In this work, four electronic databases: PubMed, Web of Science, IEEE Xplore, and Scopus, were searched for relevant articles, as those databases are among the most comprehensive and well-structured resources for academic research. Additionally, we manually reviewed the literature from the past ten years to identify studies that met the inclusion criteria.

2.2. Search Strategy

To ensure the retrieval of all relevant literature, a set of search keywords was carefully selected for querying the above database. These keywords included (Parkinson’s disease OR Parkinson OR PD), AND (voice, OR speech, OR language), AND (machine learning, OR deep learning), AND (diagnose, OR identify, OR detect, OR classify). Boolean operators were applied to combine these terms, generating a search string personalized to each database. Each search string used for retrieval of the article from the database we added in Supplementary Table S2: Search strings. Additionally, specific search parameters were set, including the publication year range (2014–2024), article type restricted to “Article”, language limited to “English” and full-text availability. The Mendeley reference manager was used for managing study records and identifying and removing duplicated studies.

2.3. Inclusion and Exclusion Criteria

To ensure the alignment with the objectives of this review and to provide a comprehensive overview of the research scope on PD, specific inclusion and exclusion criteria were established. The inclusion criteria are listed below.
a.
Studies that focused on the classification, diagnosis, detection, or identification of PD.
b.
Studies that Applied ML/DL techniques for data processing and modeling.
c.
Studies that used datasets involving voice, speech, and/or language processing.
d.
Studies published in peer-reviewed journals, available as full-text papers in English, and open-access.
Studies were excluded if they met the following criteria:
  • Research was not conducted on human participants.
  • Studies do not include voice biomarkers.
  • Studies provided a limited or insufficient description of data modalities, study subjects, and ML methods used.
  • Reviews, meta-analyses, conference abstracts, and editorial papers were excluded.

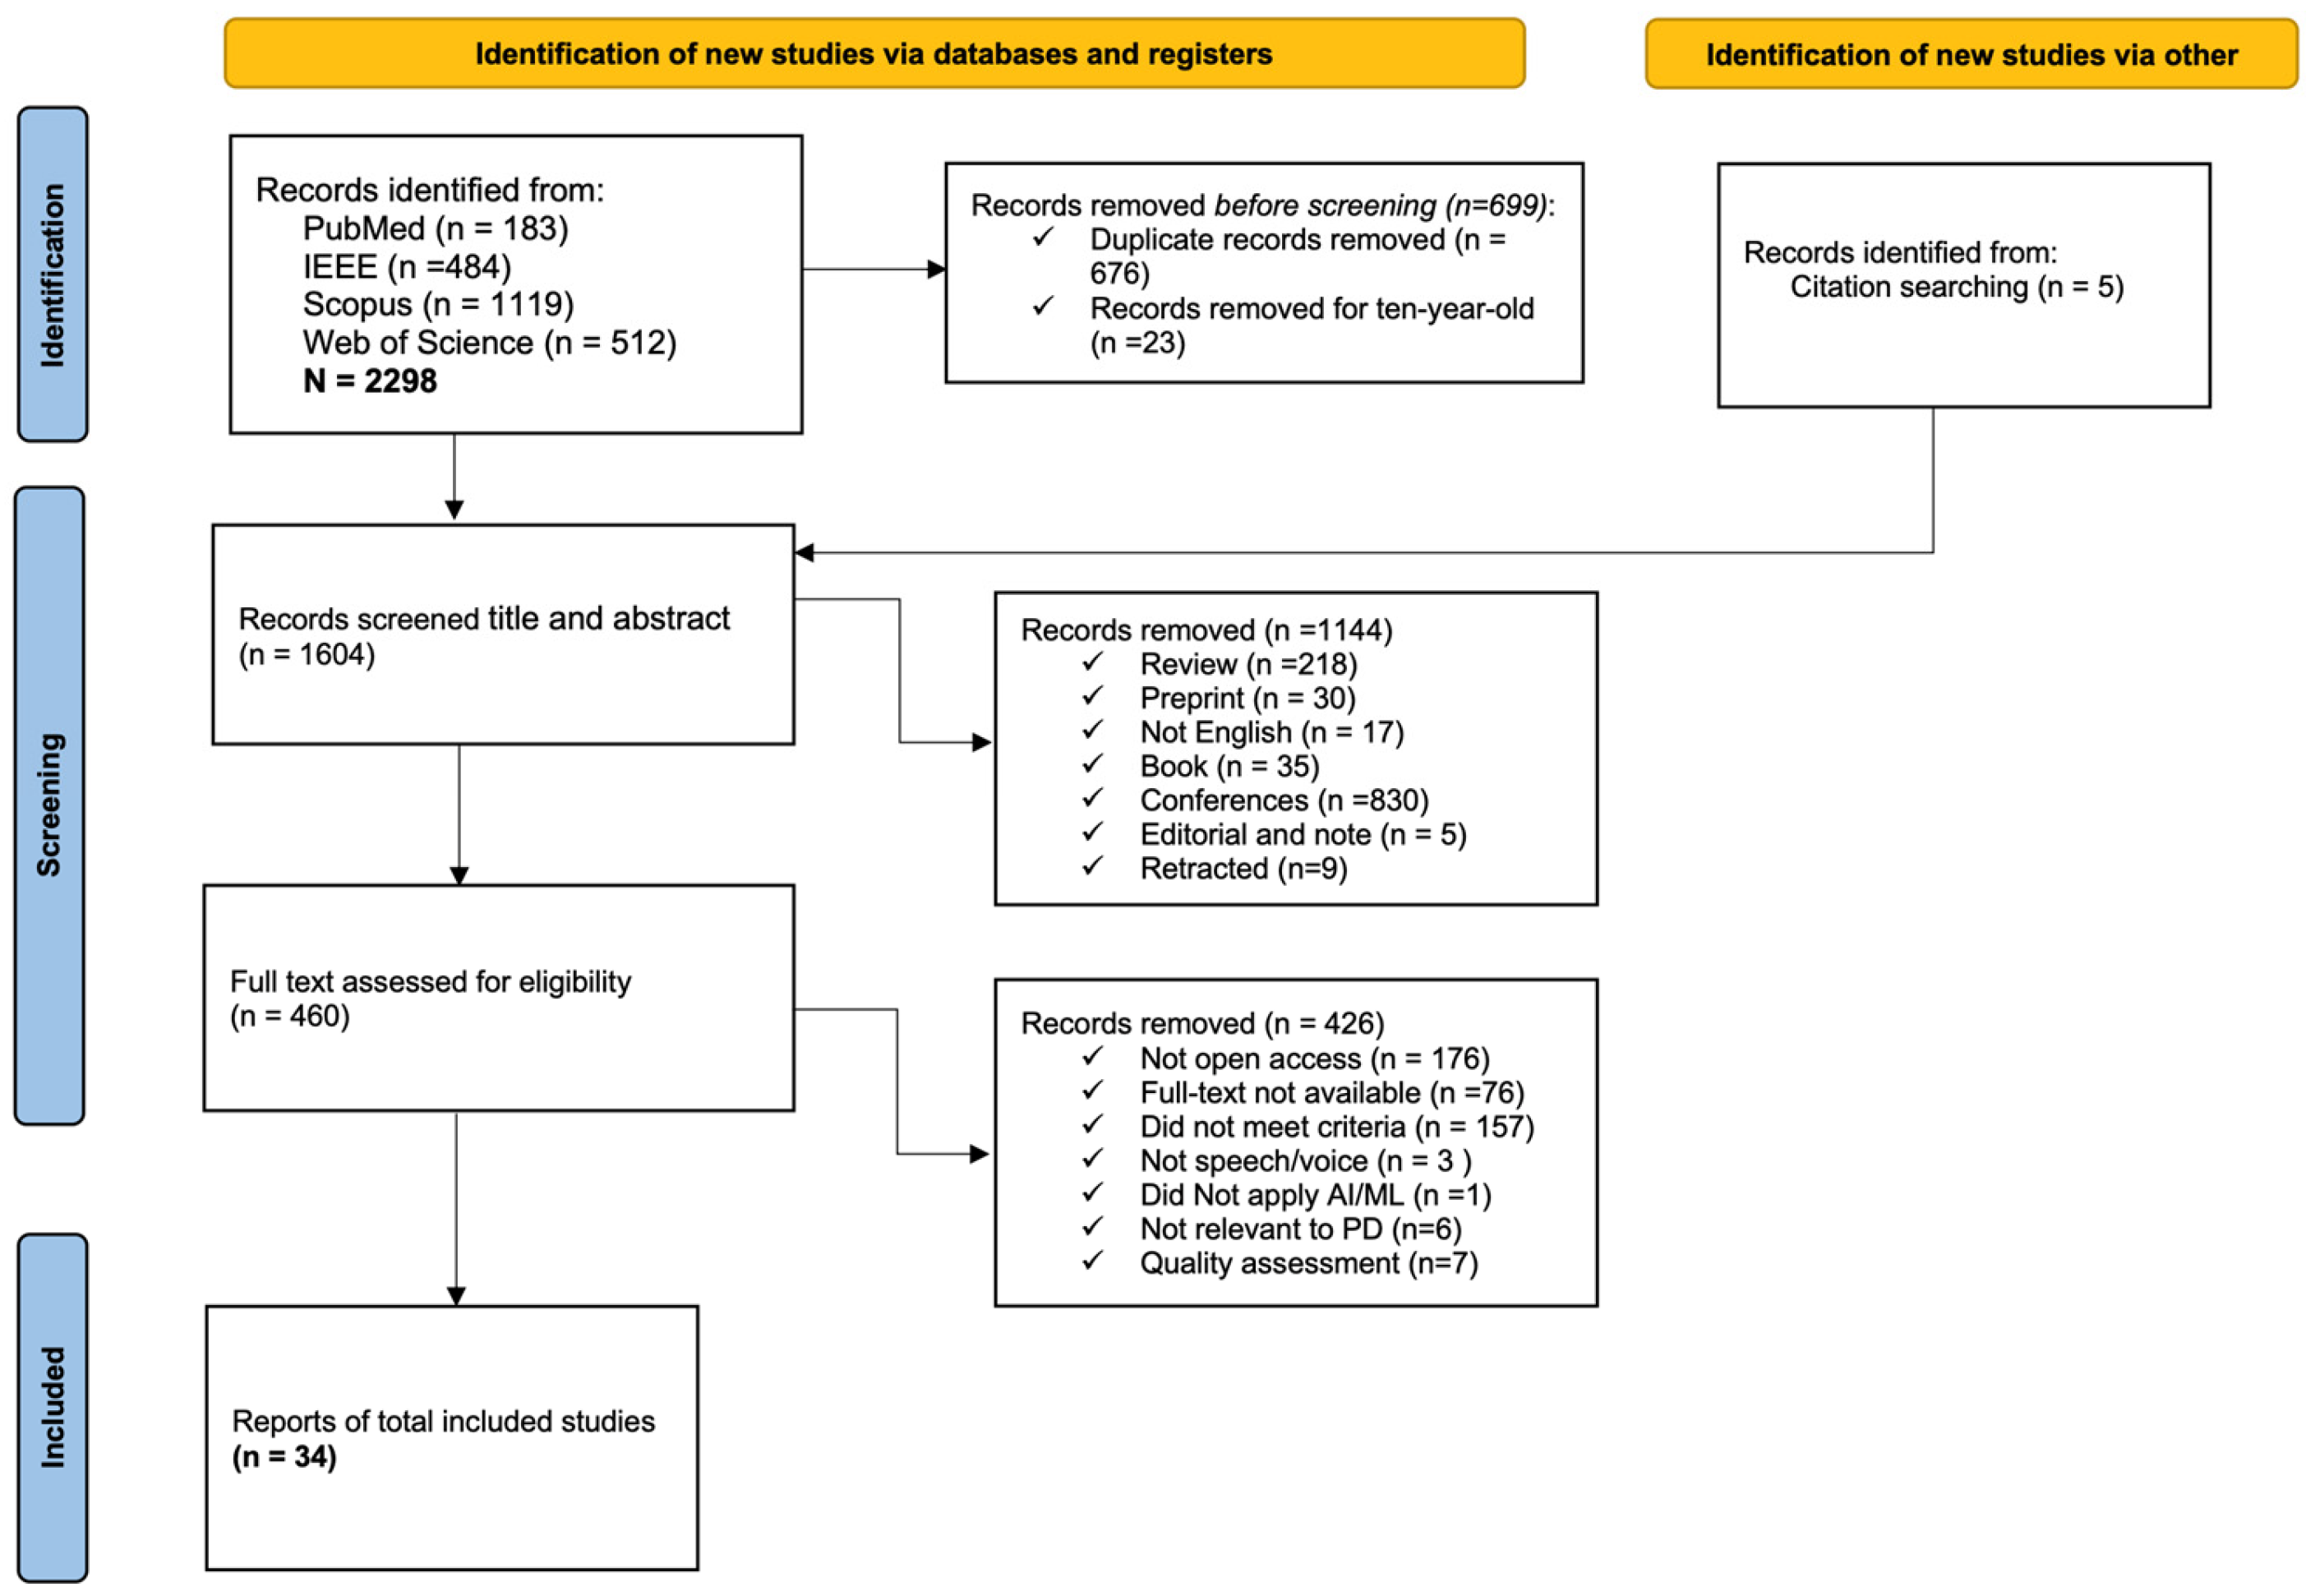
2.4. Study Selection

The study selection process followed a two-phase screening approach based on pre-established eligibility criteria. In the first phase, titles and abstracts were screened using Mendeley, applying the exclusion criteria. This phase adopted a more inclusive approach, considering any study where the title or abstract did not explicitly indicate a focus on PD, the application of ML or DL techniques, or whether the article was written in English.
In the second phase, full-text articles were reviewed for studies that could not be definitively included or excluded based on their titles and abstracts. Papers that did not meet the eligibility criteria underwent careful examination to ensure a thorough selection process. Studies without full-text availability were excluded.
All full-text articles selected for review underwent a quality assessment procedure based on the framework proposed by Kitchenham and Charters [22] to ensure the inclusion of high-quality research. For the paper selection and data extraction process, we identified and applied 19 questions indicated in Supplementary Table S3. If any studies did not answer a minimum of 12 questions, then we excluded those studies. Seven studies excluded papers that failed in this assessment process (Supplementary Table S4). Any disagreement with this quality assessment was resolved by group discussions between authors.
While our inclusion criteria did not explicit minimum sample size threshold, this review acknowledges the inclusion of studies with relatively small cohorts (n < 50). Such studies were retained based on their methodological innovation, use of unique or hard-to-access datasets, or contribution to emerging areas within speech-based Parkinson’s disease diagnostics. Their inclusion reflects both the exploratory status of this research domain and the limited availability of large, open-access datasets in the field.

2.5. Data Extraction

De la Fuente Garcia et al. [23] explained that SPICMO (study aim, population, intervention, comparisons, methodology, and outcomes) tables are used to extract information for papers. It contains Population, Interventions, Comparison groups, Outcomes of interest, Study aim/design, and Methodology. We examined each study’s aim to answer our first research questions. Then the dataset used for processing information relevant to computational feature extraction, ML or DL techniques, and the overall systems built by the researcher to answer our 2nd research questions were considered. Finally, the outcomes of each study to answer our final and 3rd questions were investigated.

2.6. Data Collection

We gathered information from selected papers and stored it for subsequent analysis. To ensure consistency in the review criteria, one author searched and extracted all the necessary data. Data items were extracted through the elaboration of three tables we added to supplementary files. These tables are as follows:
SPICMO: Contains information, study aims, population, interventions, comparison groups, methodology, and outcomes. (Supplementary Table S5)
Voice and language resources: Covers dataset name, data collection procedure, Domain, diagnostics tools, ethical background, Language, availability and number of studies used this dataset between our selected studies. (Supplementary Table S6)
Methods and Results: This table contains tasks, dataset name, features, ML/DL technique, evaluation method, and best performance shown in the study. (Supplementary Table S7).

2.7. Risk of Bias Assessment

This review focuses on diagnostic and prognostic tests rather than clinical interventions, so the concept of risk of bias does not apply in the traditional sense. We did not assess the risk of bias in study selection due to the heterogeneity of the included studies, which range from clinical trials to exploratory ML research with no immediate clinical use.
However, bias is still a concern, especially in ML-based studies where datasets are often imbalanced or lack demographic diversity (e.g., age, gender, disease severity). When creating speech databases, it is important to ensure balanced and representative samples.
In ML and DL studies, bias frequently arises from issues related to data preparation and modeling strategies. A common example is overfitting, which occurs when a model is trained and evaluated on the same dataset without appropriate separation into training and test sets. Such practices can produce deceptively high-performance metrics that do not generalize to unseen data. Additional sources of bias include imbalanced datasets, inadequate sample sizes, inappropriate selection of evaluation metrics, and a lack of contextual interpretation of results.
To systematically address these concerns, we present a risk assessment subsection in the discussion that includes key indicators such as dataset balance, appropriateness of performance metrics, and overfitting of the model.

2.8. Data Synthesis

Given the field’s characteristics and the extensive details covered in the tables, we anticipate a thorough discussion of the deficiencies and inconsistencies that future research should address. Consequently, data were summarized in a narrative form, adhering to the structure outlined by the features in each table.

2.9. Effect Measures

In this study, we used ML as the intervention method. The evaluation metrics explained how ML models were assessed in the resulting studies. The performance of ML models is typically evaluated using hold-out or cross-validation procedures, with metrics such as error rate, accuracy, precision (the ratio of correctly predicted positive cases out of all predicted positive cases), recall (the ratio of correctly identified positive cases out of all actual positive cases), F-scores (combining precision and recall), and receiver operating characteristic or area under the curve (ROC-AUC) scores. These metrics were extracted and compared in this study. Therefore, we did not draw any conclusions related to treatment implementation.

3. Results

This study conducted a comprehensive literature search across five digital databases, resulting in an initial yield of 2298 studies. Following automated deduplication using Mendeley, 676 duplicate records were removed. Additionally, 23 studies published over ten years ago were excluded, leaving 1604 records for preliminary screening based on titles and abstracts. During this phase, records were excluded if they were not open access, lacked full-text availability, were not published in English, or were categorized as review articles, systematic reviews, conference proceedings, or editorials. Subsequently, eligibility and inclusion criteria were applied, and a quality assessment led to the exclusion of seven additional studies. After full-text screening, a total of 34 studies were deemed eligible for in-depth analysis. The detailed process of literature identification, screening, and selection is illustrated in Figure 1.
Figure 2 shows the distribution of selected studies per year across the years covered by this review. Although the review spans studies from 2014 to 2024, those meeting our inclusion criteria only began to emerge in 2017. Many relevant studies were published from 2021 to 2023.
Figure 3 reports the countries associated with the research organizations mentioned in the selected papers, based on the affiliations of all authors involved in the studies. Papers included in this review originated from research teams across North and South America, Europe, Asia, Africa, and Oceania, indicating that this topic is a prominent area of research worldwide. The highest number of papers originated from research teams in Italy and China, followed by significant contributions from Turkey, Saudi Arabia, the USA, Korea, India, and Japan. All papers were published by researchers affiliated with universities, educational institutes, or their collaborative laboratories.
The Supplementary Material contains information extracted from the papers, organized into three distinct Tables. These include a general Table summary of the usual clinical features of interest based on the SPICMO framework and two more specific Tables detailing data specifics, dataset information, and methodology. When interpreting the Tables, it is important to consider the conventions and acronyms used during the information extraction process. This information is provided within Tables in the Supplementary Material.

3.1. Voice and Language Resources (Supplementary Table S6)

To develop an automated ML tool for detecting PD, or other pathologies, data plays a vital role. Without adequate data, we cannot train or build accurate models. This review highlights studies based on a well-curated speech/voice database. Constructing such a database demands meticulous planning. Key steps in the initial phase include determining recording conditions, establishing data collection protocols, selecting appropriate speech tasks, ensuring the right acquisition and storage hardware, choosing informants, and organizing and labeling the data. Given the sensitive nature of medical data, ethical considerations, along with data security and safety, must be prioritized.
As interest in this field grows, the number of available resources has expanded. Supplementary Table S6: Voice and Language Resources, presents key databases frequently cited in scientific literature, summarizing their data collection procedure, population size, languages, countries, and availability. These databases are essential for developing ML tools. Additionally, the use of similar databases across different studies by various researchers employing diverse methodologies establishes a common ground for evaluating and comparing performance.
PC-GITA or PD-GITA [24] is one of the largest and fastest-growing datasets for PD, containing speech recordings captured under noise-controlled conditions. The dataset includes sustained vowels, DDK exercises, and both simple and complex sentence readings. Currently, it features recordings from 50 PD patients and 50 healthy controls, with participants ranging in age from 33 to 77 years, all of whom are Spanish speakers from Colombia. We identified seven freely accessible studies [25,26,27,28,29,30,31] utilizing this dataset in their work.
The Oxford PD detection dataset [32], which is available in the UCI repository, contains 36 s phonation recordings of sustained vowels. It includes 31 participants (23 PD, 8 healthy controls) aged 45 to 85, and all of them are native English speakers. Seven [1,8,33,34,35,36,37] of our selected studies used this dataset for PD classification. Sakar et al. [38] have released a speech dataset of Turkish individuals, consisting of recordings from 252 participants (188 PD, 64 healthy controls) between the ages of 33 and 87. The dataset includes sustained vowels and various acoustic recordings obtained in clinical settings and is published on the UCI platform. Five studies [8,15,39,40,41] in our review utilized the full dataset, while one study published results based on a partial dataset.
The MDVR-KCL [42] dataset is another publicly available resource, consisting of text reading and spontaneous dialogs recorded via smartphones. It includes data from 16 PD patients and 21 healthy participants, all native English speakers, though no age data is provided. Three studies [25,43,44] analyze the MDVR-KCL dataset in their work to detect PD people. The Parkinson’s Telemonitoring dataset [45], which captures daily activity data from 42 early-stage PD patients using smartphones, was analyzed by Wan et al. [46] and B. E. Sakar et al. [35] for PD classification.
The mPower database [47] is a comprehensive and continuously growing resource that encompasses various data types, including voice recordings, gait measurements, walking data, mobile tapping, and daily movement patterns. Data are collected via an iPhone app, where participants are instructed to sustain the phonation of “Aaaaah” into their phone’s microphone for 10 s at a consistent volume. The dataset currently includes records from 9520 participants, of whom 1087 self-identified as having PD, and 5581 reported no PD. Participants are 18 years or older, reside in the United States, and are proficient in English. Goni et al. [13] have studied the mPower dataset to classify PD and healthy individuals.
SVD [48] is a German-language dataset featuring recordings of sustained vowels at high, low, and normal pitches, captured under noise-controlled conditions. It contains data from 130 participants, with 88 PD patients and 42 healthy controls. Pah et al. [26] used this dataset in their work along with the PC-GITA dataset. Ibarra et al. [27] have used the SVDD dataset as a train set to build and train their model.
Mondol et al. [49] published a study analyzing the InhaPD dataset including voice recordings of 101 Korean individuals with PD, aged between 42 and 81, focusing on sustained vowel sounds in Korean. Unfortunately, it does not contain data from healthy controls. Three additional datasets, PD-Neurovoz [50], PD-Czech [51], and PD-German [52] involve Spanish, Czech, and German participants, respectively. These datasets include various speech tasks such as sustained vowels, DDK tests, reading tests, and picture descriptions in their respective languages. PD-Neurovoz consists of 44 PD patients and 47 healthy controls, while PD-Czech and PD-German each include 50 and 88 participants for both PD and healthy groups. These datasets are available on request from the respective authors. Ibarra et al. [27] used all three datasets to test and evaluate their models trained from the SVD dataset. Eyigoz et al. [30] used PD-Czech and PD-German along with the PC-GITA datasets in their study.
ItalianPVS [53] is a database containing audio and text data of the native Italian language. Di Mauro et al. [53] collected and created this dataset, and it is available on request to authors. Scimeca et al. [28] analyze PD-Czech, ItalianPVS, and the PC-GITA dataset with three native Italian language private datasets in their work.
Arora et al. [54] utilizes smartphone voice recordings and clinical data from participants in the Oxford Discovery cohort to evaluate symptoms of PD and Rapid Eye Movement Sleep Behavior Disorder (RBD). The dataset included three groups: controls (n = 92), PD patients (n = 335), and RBD patients (n = 112), comprising 136 female and 376 male participants. The authors did not specify the availability of this dataset.
Several other voice databases for PD are available in Chinese, Mandarin, Italian, Portuguese, Taiwanese, Japanese, Spanish, and Swedish. However, detailed information about these datasets is limited, as much is not publicly accessible. The most used and publicly accessible datasets have been described above, with further details on language, region, and population available in the Supplementary file. The data collection procedure, modalities, ethical background, and data availability of each dataset with their reference are included in the Supplementary Table S6.

3.2. Machine Learning

The application of speech analysis in diagnosing PD holds significant promise as a potentially useful, non-invasive, cheap, and straightforward method. Automating this process enables rapid, accurate, and cost-effective monitoring over time. Initially, speech-based tests for detecting these pathologies were primarily conducted by linguists, who designed these tests to extract linguistic characteristics from speech. The speech analysis process for PD diagnosis can be divided into several key steps: data preparation, training and validation, optimization, and deployment. The graphical representation of the process is shown in Figure 4. In the data preparation stage, the extraction, optimization, and normalization of features take place.
During the training and validation stage, the data is typically divided into two subsets: training (70–90%) and testing (10–30%). These subsets can be generated randomly multiple times, with the results averaged to increase confidence, a process known as cross-validation. The test subset is then used to evaluate the model’s performance.
In the optimization stage, the model’s parameters are refined to enhance its accuracy. This step often involves selecting the most relevant and significant features related to the target variable. Once the parameters are updated and the best features are selected, the model undergoes another round of training and validation. Finally, in the deployment stage, the model is ready to be used for classifying individuals with PD or identifying healthy individuals based on new, unseen data.

3.3. Machine Learning/Deep Learning Models (Supplementary Table S7: Methods and Results)

The classification process entails assigning a new observation to one of several predefined categories, based on a set of training categories to which previous observations have already been assigned. This process follows the extraction and selection of the most pertinent features, after which classification is applied to categorize the dataset under consideration. When the distribution or patterns of the data are known, the application of an appropriate model can yield optimal results. Nevertheless, ML has gained significant prominence due to its capacity to make accurate predictions, even in the context of unstructured, high-dimensional data. Neural networks, which are versatile models inspired by the human brain, consist of multiple layers that process inputs and generate outputs. The architecture of these networks—including the number of layers, the number of units within each layer, and the behavior of each layer (such as fully connected, convolutional, or recurrent)—can be adjusted to optimize performance for a specific dataset. Despite the widespread use of such techniques, designing models with numerous parameters often necessitates a substantial amount of training data. Supplementary Table S7: Methods and results, column ML/DL technique presents the most utilized models by the selected studies of this review. Below we grouped studies into ML and DL subgroups based on ML/DL techniques they utilize in their work. There are 14 studies (≈41%) utilized on the ML model, 4 studies (≈12%) on the DL model, and both techniques were used by 11 studies (≈32%), and also 5 studies (≈15%) used hybrid models.
ML Models: we observed that Support Vector Machine (SVM) is the most popular classification model. A total of 64.70% (22/34) of studies applied SVM to analyze voice, speech, or language data for diagnosing PD. The second most used model is K-nearest neighbors (KNN), featured in 50% (17/34) studies. The random forest (RF) model is third highest 35.3% (12/34) of studies in the review. Other supervised learning models Logistic regression (LR) used in six studies, Naïve Bayes (NB), and Decision tree (DT) were employed in nine studies. Some studies also used boosting algorithms such as GNB, XGBoost (XGB), and LightGBM (LGB).
DL Models: Among neural networks, the most frequently used models were multilayer perception (MLP), artificial neural networks (ANN), Conventional neural network (CNN), and Long-Short-Time-Memory (LSTM), applied in five, three, five, and two studies, respectively. Pre-trained models like ResNet, VGG, Mobile Net, and Inception V3 are also quite popular in the classification of PD from images. They convert audio signals to images to feed the models.

3.4. Diagnostic Performance and Evaluation (Supplementary Table S7: Methods and Results)

3.4.1. Model Validation

When comparing the performance of this model to other reported systems, it is crucial to use a consistent metric and a well-defined testing method or setup. Without this, it becomes challenging to accurately measure how the model or algorithm performs relative to others. In this section, we will review various ML/DL algorithms and systems used in the selected studies. Supplementary Table S7: methods and results, performance column, summarizes the top performances reported by the authors. We also outline the tasks, datasets, and feature types used, the ML/DL models constructed, the testing and validation techniques, and the performance outcomes across all 34 studies.
Table 1 highlights the validation techniques commonly used in the reviewed studies. These techniques were chosen based on the dataset characteristics and algorithms employed to develop models for classifying and detecting PD. Cross-validation emerged as the most frequently applied method, used to evaluate model performance on independent datasets while mitigating overfitting. By dividing data into training and testing subsets multiple times, cross-validation ensures that the model’s performance is not biased toward specific partitions of the data. The most common cross-validation techniques in the selected studies were 10-fold, 5-fold, and Leave-One-Subject-Out (LOSO). The 10-fold and 5-fold cross-validation split the dataset into 10 or 5 parts, respectively, with one-fold used as the test set and the remaining folds for training. The final performance is the average across all folds. LOSO cross-validation uses each instance in the dataset as a test set once, with the remainder used for training. Thirteen selected studies validate their model with 10-fold cross-validation. Six studies validated their model using LOSOCV. There are two studies for each 5-fold and K-fold cross-validation technique in our designated work. Wan et al. [46] validated models with K-fold and LOSOCV. Cai et al. [37] also applied K-fold cross-validation in their analysis. Three studies [1,44,55], applied 3-fold, Grid-Search, and nested cross-validation methods to obtain the best result of their model.

3.4.2. Evaluation

To evaluate a model’s performance or quality, several metrics are commonly used: Accuracy, Area Under the Curve (AUC), F1-score, Recall (or sensitivity), Precision, and specificity. Accuracy represents the percentage of correct classifications, whether positive or negative. A perfect model, with no false positives or false negatives, would achieve 100% (or 1.0) accuracy. Recall measures the proportion of actual positive cases correctly identified by the model. A perfect model would have zero false negatives, resulting in a recall value of 1.0 (or 100%). Precision indicates the proportion of positive predictions made by the model that are correct. A perfect model with zero false positives would achieve a precision value of 1.0. AUC quantifies a model’s ability to distinguish between classes. It is calculated by plotting the true positive rate (TPR) against the false positive rate (FPR) to create a curve. A higher AUC generally indicates a better-performing model. F1-score is the harmonic means of precision and recall, providing a balanced measure of a model’s accuracy when dealing with imbalanced datasets. Authors select evaluation metrics based on the model’s architecture and the nature of the training data. These metrics provide insights into the model’s performance and quality for diagnosing PD.

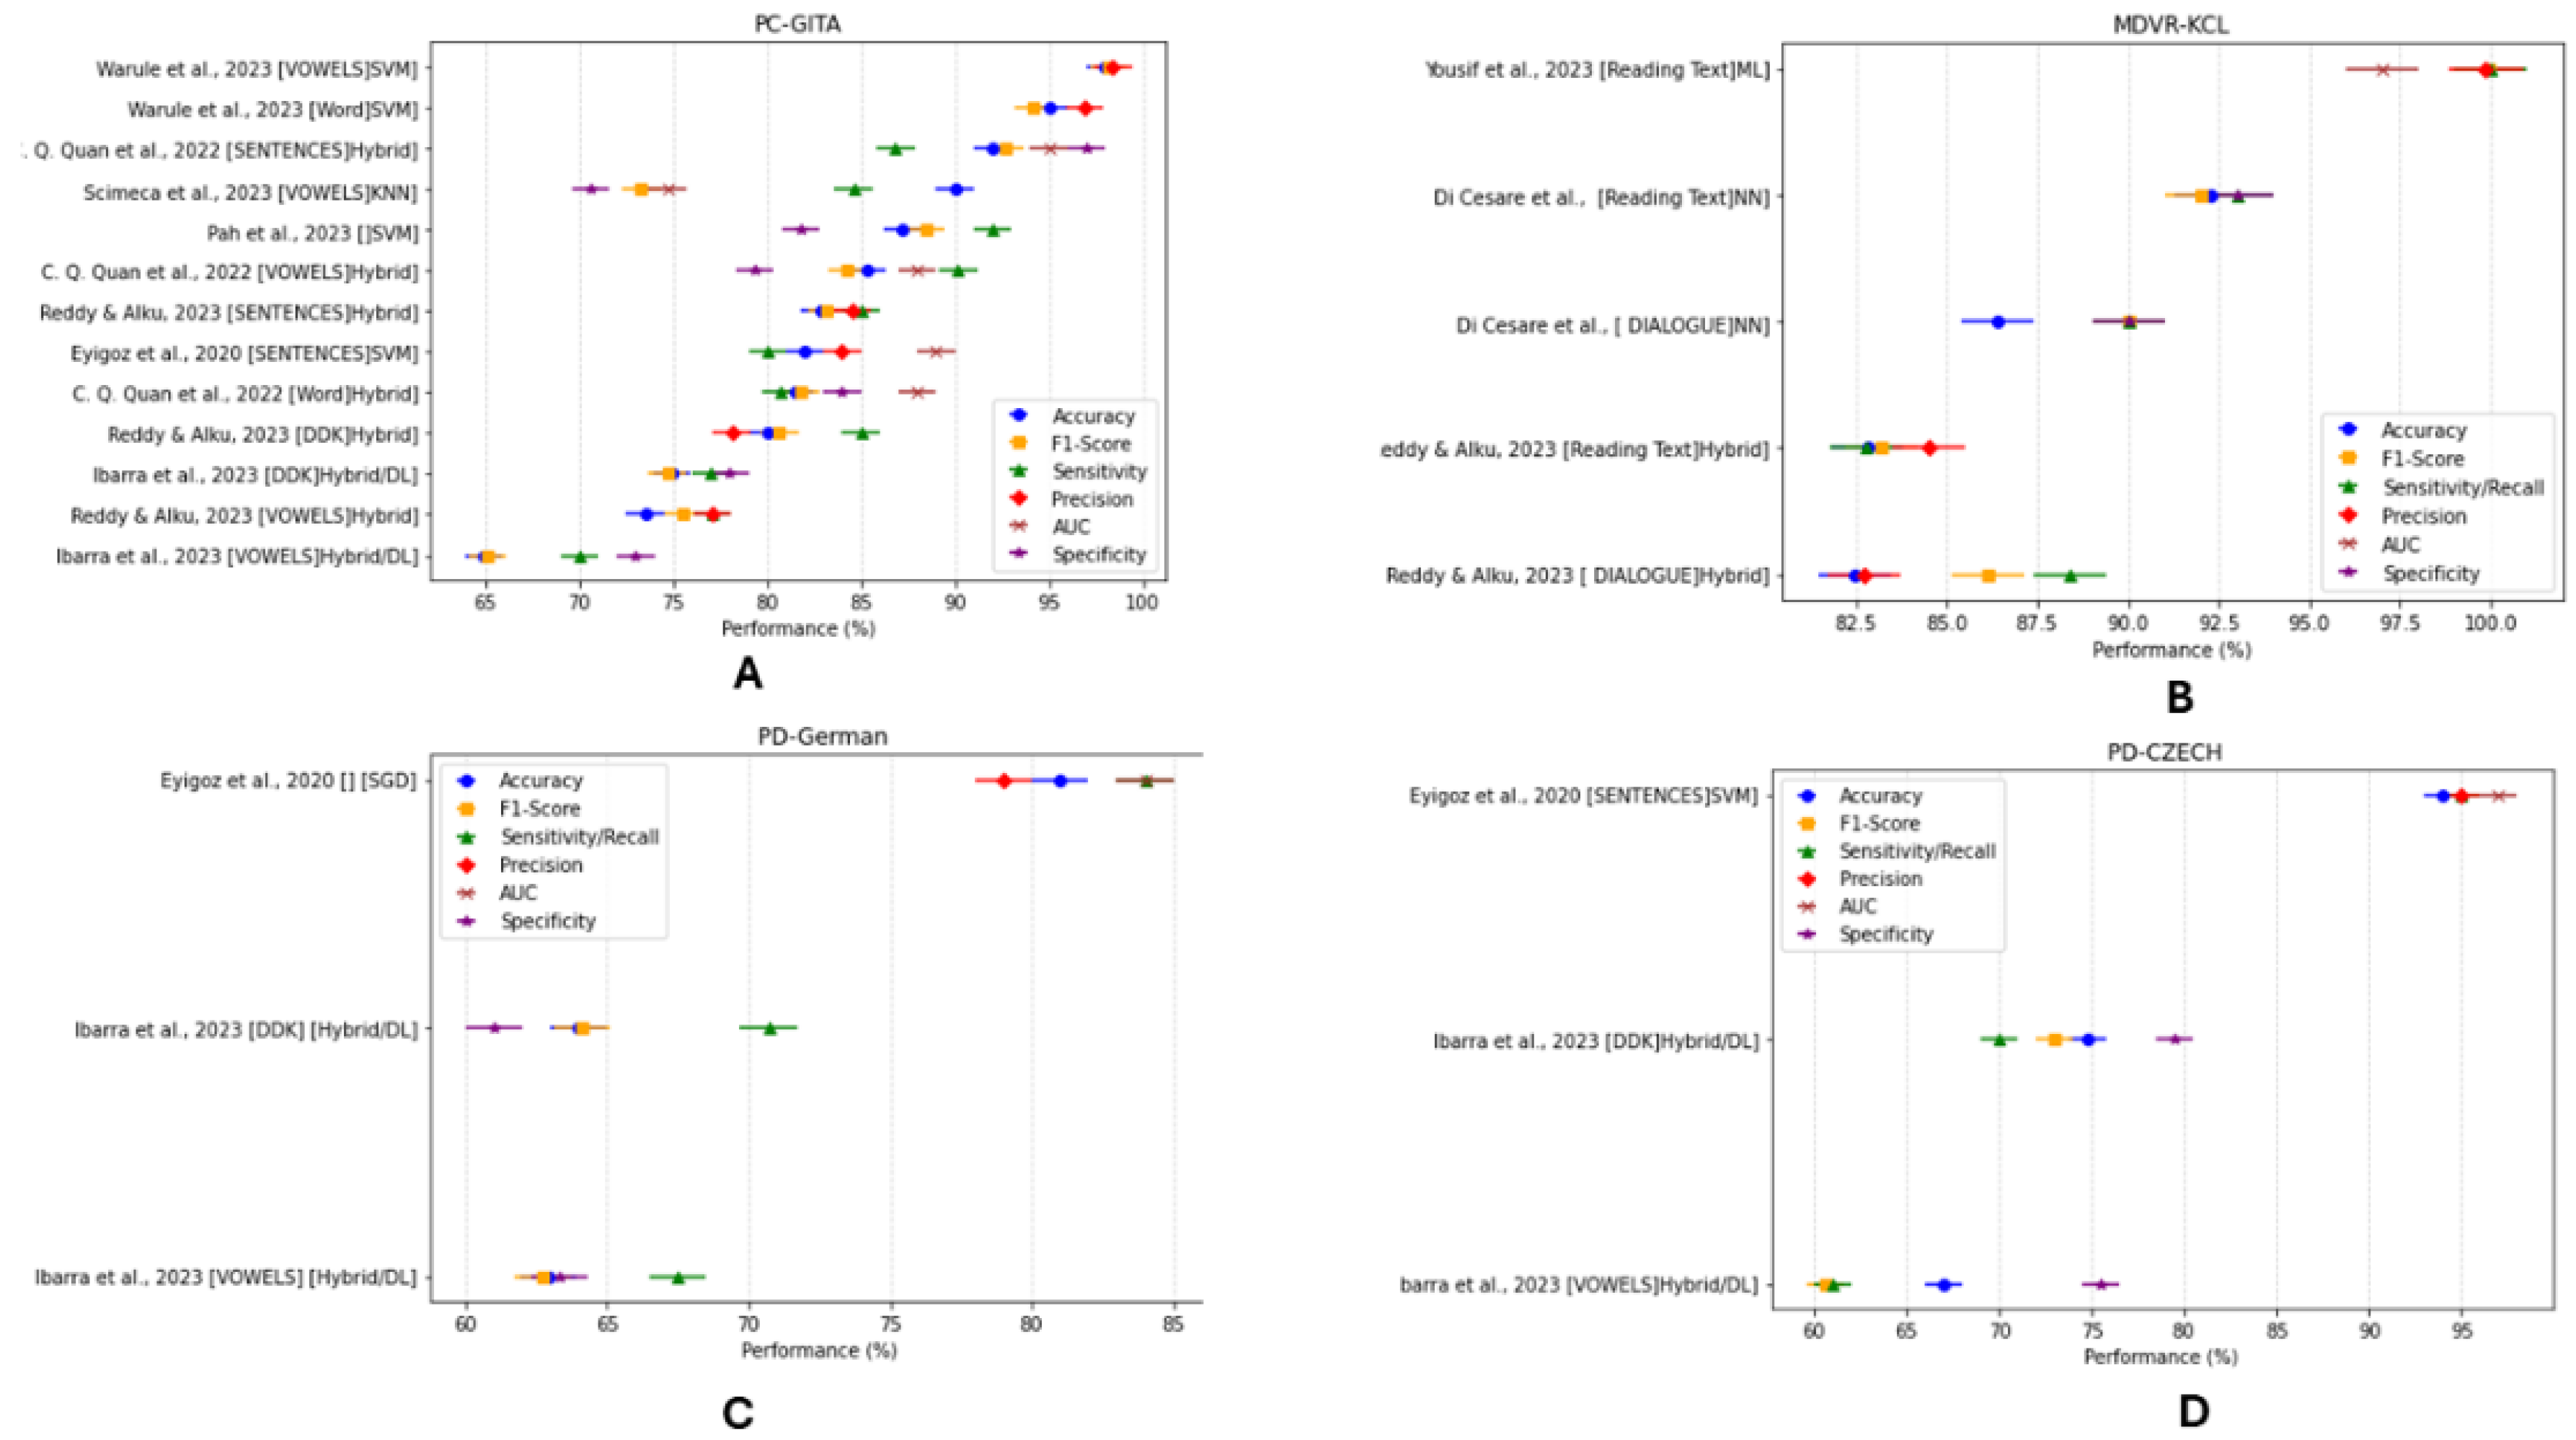
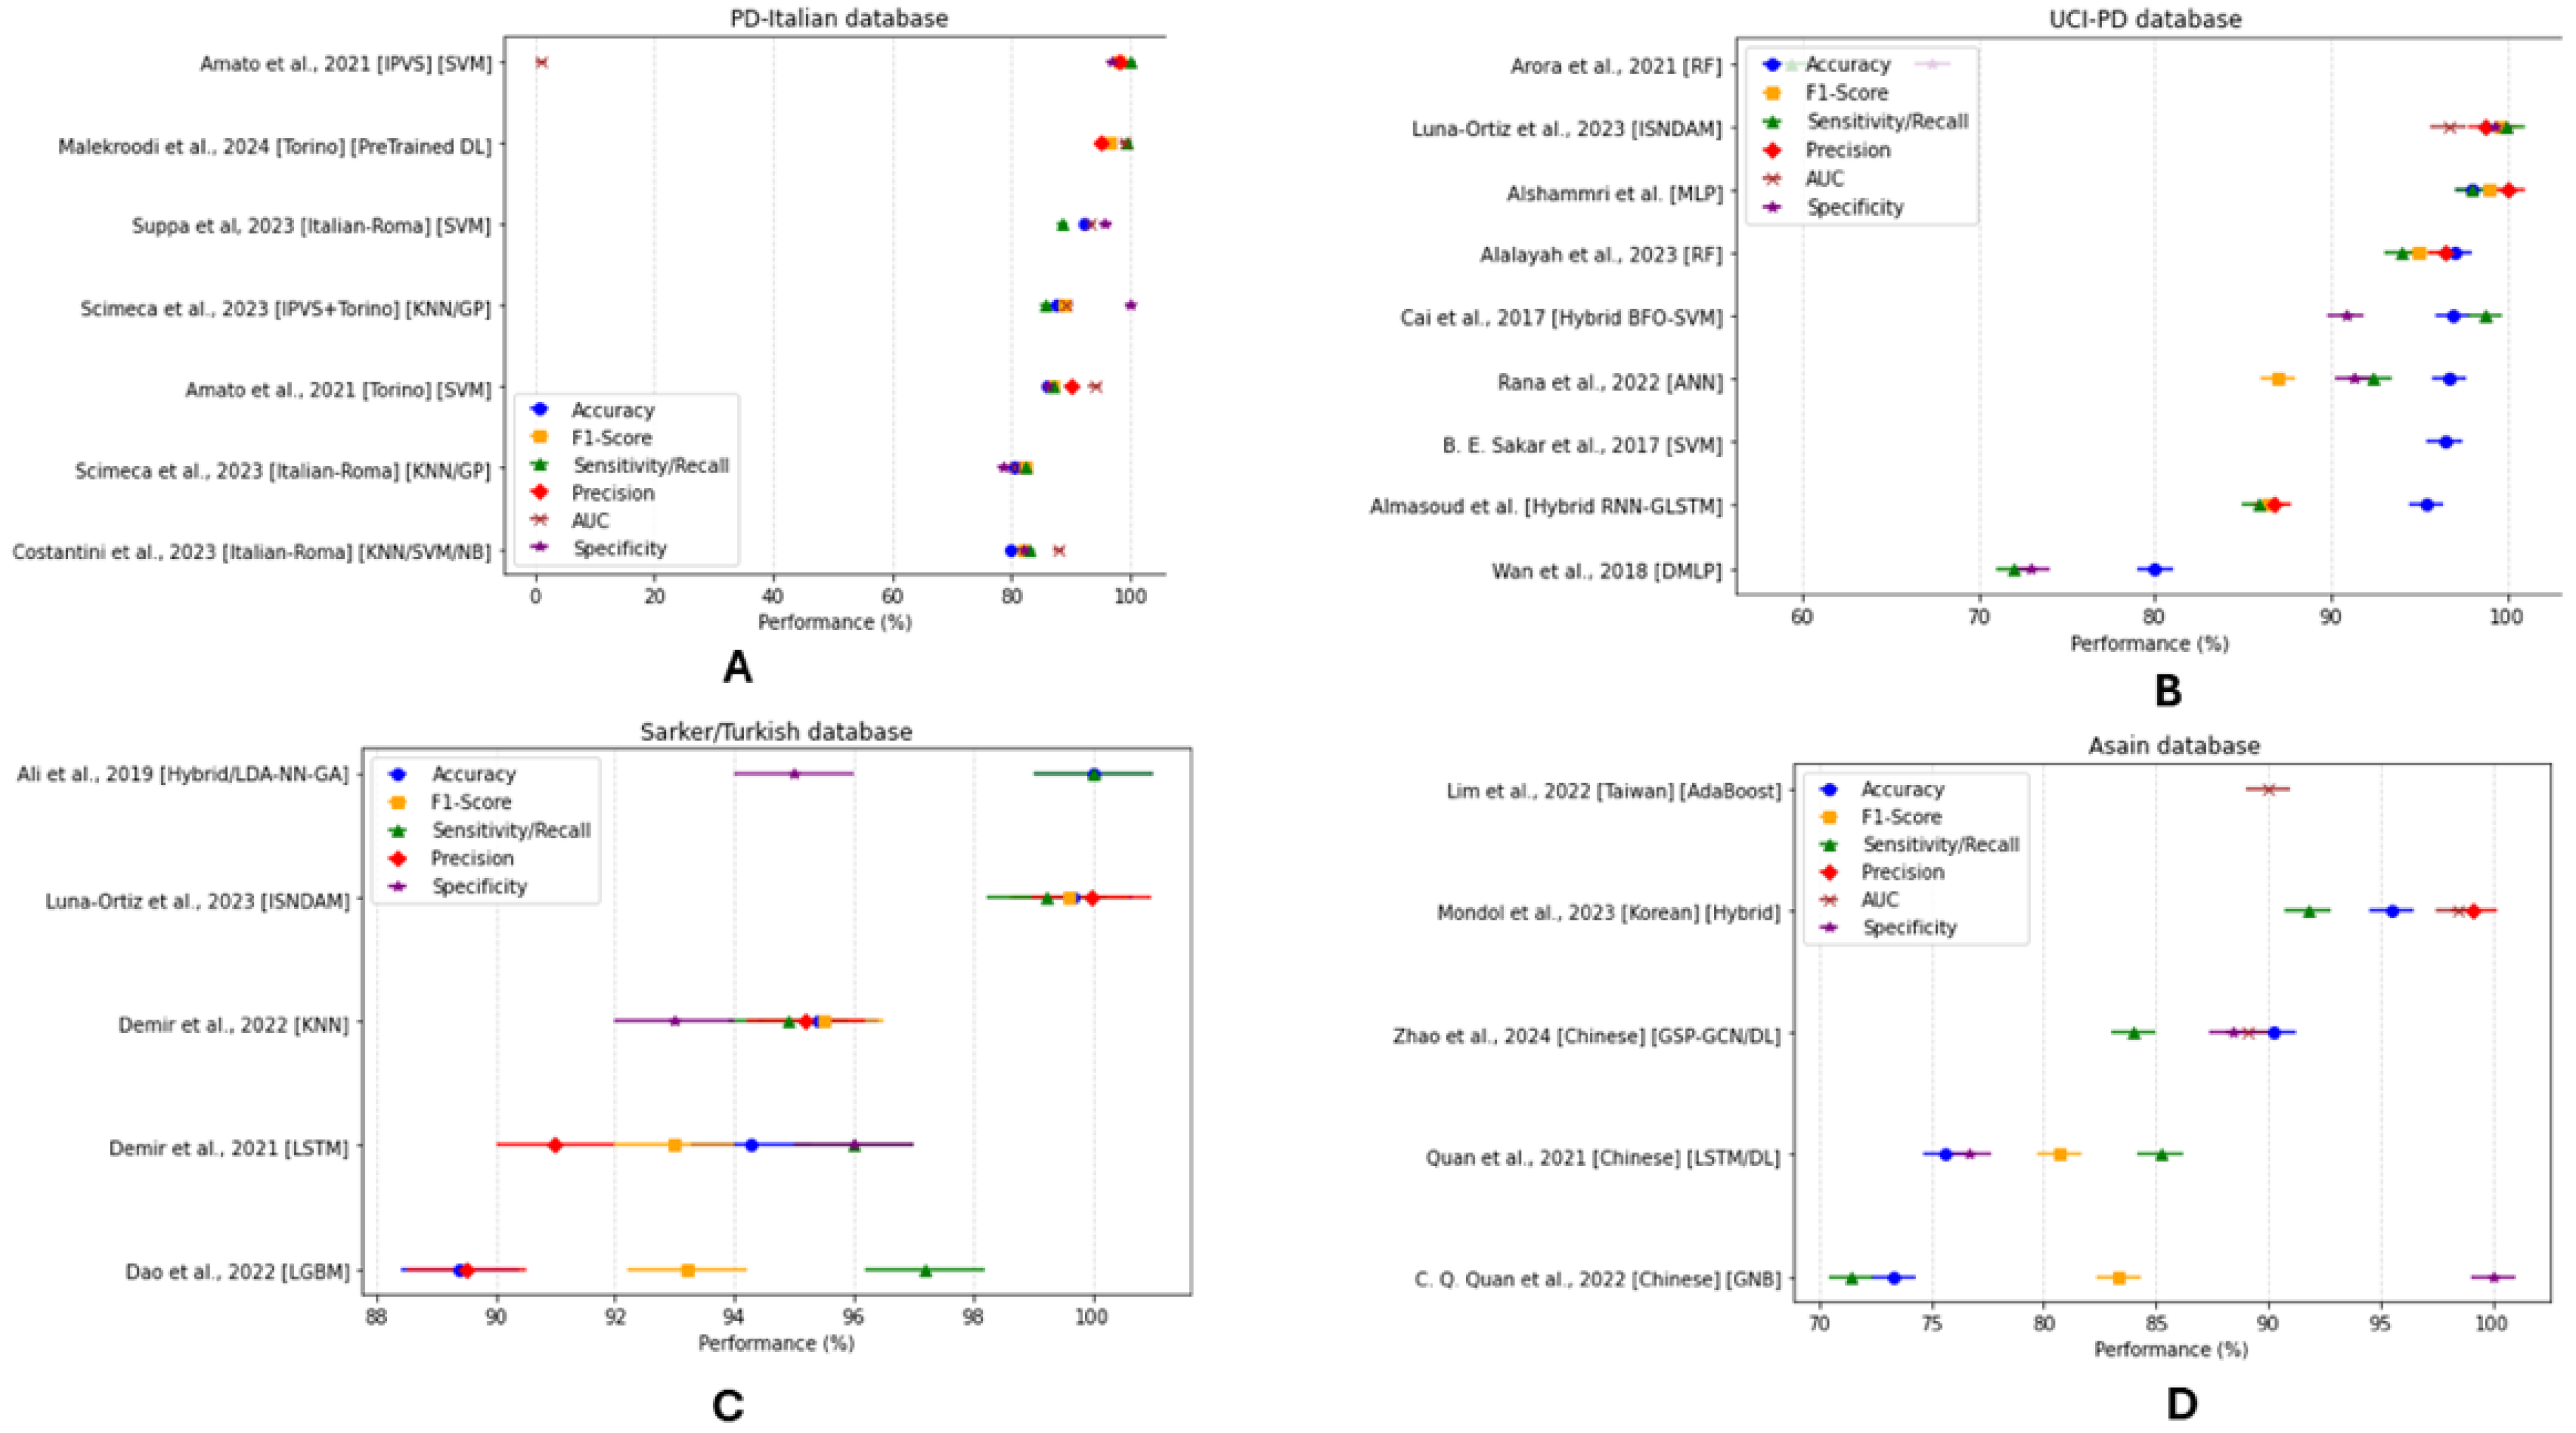
3.4.3. Classification Model Performance

The studies included in this review evaluated the performance of classification models using a variety of metrics. We add the best performance reported by each study in the column of Supplementary Table S7: Methods and results. This section provides a summary of the diagnostic capabilities of these models, organized by dataset, to emphasize the types of models and validation techniques employed for specific datasets or data modalities. It is important to note that this analysis does not aim to compare performance across studies.
Figure 5 and Figure 6 present a broad overview of the classification performance of various ML and DL models used for PD detection from speech. These figures synthesize data from numerous studies and illustrate key performance metrics including accuracy, F1-score, sensitivity (recall), precision, specificity, and AUC across various combinations of models, tasks, and datasets.
Each subplot in Figure 5 and Figure 6 represents a distinct speech dataset, with participants grouped according to their native language. For instance, Spanish: PC-GITA (Figure 5A); English: MDVR-KCL (Figure 5B); German: PD-German (Figure 5C); Czech: PD-Czech (Figure 5D); Italian: PD-Italian (Figure 6A); English (U.S.): UCI-PD (Figure 6B); Turkish (Figure 6C); and a collection of datasets in various Asian languages (Figure 6D). Performance metrics include Accuracy (blue), F1-Score (orange), Sensitivity/Recall (green), Precision (red), AUC (pink), and Specificity (purple). Horizontal markers indicate the range of values reported for each metric per study. This organization facilitates direct comparison of model performance across different algorithmic approaches (e.g., SVM, hybrid models, neural networks) as well as across diverse linguistic and dataset characteristics.
In Figure 5, the PC-GITA dataset (A) demonstrates considerable variability in model performance, indicating sensitivity to both the nature of the speech tasks (e.g., sustained vowels, diadochokinetic [DDK] tasks, reading passages) and underlying model architecture. Support Vector Machine (SVM)-based, and hybrid approaches (feature-engineering + ML combinations) generally outperform traditional classifiers, frequently achieving superior accuracy and F1 scores. In contrast, the MDVR-KCL (B) and PD-Czech (D) datasets yield more consistent results across studies, particularly when employing hybrid and deep learning models. This consistency may be attributed to higher data quality, greater task standardization, or more homogeneous recording conditions.
Figure 6 expands this analysis to additional datasets. The UCI-based PD corpus (B), widely recognized as a benchmark dataset, consistently achieves high performance, particularly with Random Forest and hybrid SVM-based models. Numerous studies report classification metrics exceeding 95% in terms of accuracy and sensitivity. The PD-Italian (A) and Turkish (C) datasets also exhibit strong performance, albeit with slightly greater variability, potentially due to differences in recording environments, participant demographics, sample sizes, or linguistic characteristics. Although fewer in number, the Asian language datasets (D) similarly show better results, especially when using hybrid and ensemble-based modeling approaches. This figure highlights both the variability of evaluation metrics within individual datasets and the common tendency for studies to emphasize accuracy, sometimes at the expense of more informative performance indicators such as sensitivity and specificity.
Approximately 73.46% of the reviewed paper reported accuracy above 80%, with overall accuracy ranging from 64% to 100%. Sensitivity scores varied between 59.4% and 100%, while specificity ranged from 67.4% to 99.31%, highlighting substantial variability in detecting true positives and negatives across different approaches. F1 scores, reflecting the balance between precision and recall, ranged from 60.6% to 99.6%.
Collectively, these visualizations underscore the multifactorial complexity of PD speech classification. They highlight that model performance is influenced not only by the choice of algorithm but also by dataset characteristics, types of speech tasks, and feature extraction methodologies. The forest plots serve as an effective tool for identifying optimal combinations of models, datasets, and speech tasks, while also emphasizing the critical need for standardized benchmarks and enhanced cross-study reproducibility. Nonetheless, the relatively high standard deviations observed in certain metrics point to underlying heterogeneity, likely arising from variations in dataset composition, recording conditions, feature extraction strategies, speech task types (e.g., sustained vowels, diadochokinetic sequences, sentence reading), and model architectures.

4. Discussion

This systematic review has assessed the effectiveness of ML in diagnosing and detecting PD through the analysis of voice, speech, and language. A comprehensive evaluation of the selected studies underscores the considerable potential of these techniques to improve diagnostic accuracy and offer non-invasive alternatives to conventional assessment methods. Our findings indicate that ML is effective in analyzing voice, speech, and language for the identification of PD. Notably, the application of ensemble learning models, particularly SVM, yielded promising results across multiple studies, demonstrating robustness in handling diverse datasets. Furthermore, ML techniques have shown potential in detecting early voice biomarkers of PD, often before clinical manifestation, which can be crucial for facilitating timely interventions to mitigate disease progression. Several studies have also reported high diagnostic accuracy, suggesting that ML could substantially enhance the precision of the diagnostic process.

4.1. Voice and Speech Features

PD leads to progressive brain function decline, including language impairments that worsen over time. Early symptoms include word-finding difficulties, incorrect word substitutions, and increased speech pauses. As PD advances, verbal fluency declines, comprehension deficits intensify, and speech may become limited to echolalia and stereotyped phrases, mirroring dementia-related communication challenges. Speech deficits in early PD involve semantic impairments, vowel articulation issues, and word retrieval difficulties, often causing hesitations and pronunciation errors. Later stages worsened articulation, prosodic abnormalities, and phonological fluency loss.
There are several speech and language tasks applied to record audio signals including verbal fluency tests, spontaneous speech, and dialog or conversational speech. In the Supplementary Table S6: voice and language resource data collection columns, we highlighted the tasks utilized to record audio signal.
The reviewed literature does not indicate a consistent approach to feature extraction and utilization. Some studies rely on conventional metrics, while others implement advanced methodologies incorporating multiple feature sets and parameters. Nevertheless, all studies report encouraging results, with high classification accuracy. The Intervention Columns of SPICMO (Supplementary Table S5) summarize the voice and speech task and cognitive features described below.

4.1.1. Voice and Speech Tasks

Spontaneous speech: A widely used task for analyzing spontaneous speech in PD is the reading text. Speech and linguistics tasks also included sustained phonation of vowels, sentence repetition, counting backward, subtraction exercises, and phonemic and semantic verbal fluency. To detect PD using linguistic features or language-based tasks, researchers incorporated various activities during data collection, such as story reading and story recall, which also serve as memory assessments. Categorical fluency tasks were utilized to evaluate both linguistic and cognitive function. Almost 88% (30/34) studies of reviewed utilized speech tasks.
Spontaneous dialog or conversational speech has become a promising new approach for collecting speech signals in PD research. In this approach, participants are encouraged to engage in natural conversations about their daily routines, personal preferences, interests, hobbies, or favorite places and sports, with one or more people. In this review, we identified two notable databases: mPower and MDVR-KCL, that have collected spontaneous dialog audio recordings. However, this area remains relatively underdeveloped and has not been fully explored. Only four studies (≈12%) we reviewed used conversational speech.
These dialogs were primarily recorded using smartphones, highlighting the potential for leveraging everyday technology for future research. Given the ubiquity of smartphones in daily communication, the development of methods to analyze speech from daily conversations could significantly enhance the application of AI and ML techniques for the diagnosis and continuous monitoring of PD patients.

4.1.2. Cognitive and Clinical Features

Cognitive and clinical assessments are standard components of PD diagnosis. Several studies analyzed data from these tasks to classify or detect PD patients, Movement Disorder Society (MDS) sore, Sponsored Revision of the Unified Parkinson’s Disease Rating Scale (UPDRS), UPDRS-III score, and Montreal Cognitive Assessment (MoCA)

4.1.3. Multilingual Classification Systems

There is an increasing focus on developing multilingual systems for the automatic detection of PD. The reviewed studies included promising findings from voice and speech analyses across multiple languages. Data sources included audio and text formats in English, Italian, Spanish, German, Czech, French, Swedish, Dutch, Japanese, Korean, Mandarin Chinese, Portuguese, Turkish, and Taiwanese. For additional information on datasets, languages, and countries of origin. Almost 20% (7/34) of studies used datasets from two or more languages. Three studies [27,28,31] present results on multiple language data.

4.2. Data Collection (Supplementary Table S6: Voice and Language Resources)

The reviewed studies utilized data obtained from human participants due to its authenticity and relevance. Direct engagement with participants enhances the quality and depth of findings by capturing real-world patient perspectives. While alternative data sources offer value, firsthand data collection remains fundamental to advancing medical knowledge and treatment approaches. In Supplementary Table S6: Voice and language resources, the data collection column provides the procedure and steps researchers follow to record the voice data from participants. A total of 20% of studies used voice data recorded with smartphones with real-world activities. Almost 80% voice signal was recorded in the noise control room. All studies mentioned that each participant, healthy and PD was instructed to perform some specific tasks designed by the researcher. They also followed some guidelines provided to them.

4.3. ML and DL Technique

This review highlights the extensive use of traditional ML and DL approaches for detecting PD from speech. Among traditional methods, Support Vector Machines (SVMs), Random Forests (RF), and K-Nearest Neighbors (KNN) are the most frequently employed, often achieving high classification accuracy, sometimes exceeding 99%, particularly on datasets such as UCI-PD and PC-GITA.
Deep learning models, particularly Convolutional Neural Networks (CNNs) and hybrid architectures demonstrate superior performance on more complex tasks, including spontaneous dialog and sentence reading. These models typically achieve accuracy ranging from 72% to 95%, along with strong sensitivity and F1-scores, indicating their ability to handle high-dimensional and unstructured input data effectively.
Figure 7 presents the number of studies falling into three broad accuracy bands: ≥90%, 80–89%, and <80%, categorized by model type. The total number of studies evaluated per model is also overlaid as a line plot. SVM emerged as the most frequently evaluated model type, with a substantial number of studies (n = 17) reporting accuracies ≥80%, followed by K- KNN and Hybrid models (feature-engineering + ML combinations). Hybrid architectures in particular showed strong consistency in high accuracy, with few studies falling below the 80% threshold. Similarly, CNNs and Ensemble/Boosting models (e.g., AdaBoost, XGBoost) tended to achieve higher accuracies more frequently than traditional ML models such as DT and LR.
Interestingly, pre-trained deep learning models were relatively underrepresented, with few studies evaluating their effectiveness, likely due to dataset size constraints or domain mismatch. MLP and Neural Networks demonstrated inconsistent performance, with a notable portion of studies reporting sub <80% accuracies.
Figure 5 and Figure 6 illustrate how model performance varies depending on dataset characteristics and task type. For instance, tasks involving sentence reading and spontaneous dialog tend to benefit from DL and hybrid models, while tasks based on simpler acoustic features such as vowel or word articulation, often yield better results with traditional models like SVMs.
In summary, the optimal model choice is highly dependent on the nature of the speech task and the structure of the dataset. Traditional ML models are generally well-suited for simpler, lower-dimensional inputs, whereas DL models excel in capturing complex patterns in more diverse and unstructured data. Hybrid models that integrate both approaches offer a promising balance, enhancing generalizability and robustness across different tasks. It is also important to note that the relatively limited size of most available datasets poses a challenge, particularly for training deep neural networks, which typically require large amounts of data to achieve optimal performance.

4.4. Risk of Bias

This section outlines potential sources of systematic error and factors that may introduce bias into the results.
Data balance: Balancing the target class, age, and gender is essential for generating unbiased results in experimental studies. Since PD primarily affects older adults, most datasets and studies include participants aged between 40 and 90 years. The “Population” column in Supplementary Table S5 (SPICMO) summarizes the class, age, and gender distribution of participants used in each study. Approximately 20% of the reviewed studies employed datasets balanced by class and gender. Similarly, the “Population” column in Supplementary Table S6: voice and language resource shows that only 8 out of 24 datasets are both class- and gender-balanced. Comparing these two sources, it is evident that a lack of data balance is a major limitation. This highlights the need for researchers to prioritize balanced data collection in future work.
Appropriate metrics: Choosing suitable performance metrics is critical for accurately evaluating machine learning (ML) models and avoiding biased results. In class-imbalanced datasets, accuracy alone is not a reliable metric and should not be used in isolation. In our review, 88% of studies reported accuracy, while fewer studies included additional metrics: recall (≈38%), F1-score (≈30%), precision (≈18%), specificity (≈32%), and AUC (≈12%). Given the difficulty of achieving perfect class balance in medical datasets, researchers should report multiple metrics to provide a more comprehensive evaluation of model performance.
Overfitting: Overfitting is a significant source of bias in ML-based studies. To reduce this risk, researchers should use both cross-validation (CV) and separate test sets during model training and evaluation. CV should be used when tuning hyperparameters, and final testing should be performed on strictly unseen data. While 85% of the reviewed studies reported using CV, only 60% used a separate test set. Ideally, each ML model should be trained, validated, and tested on distinct datasets; however, only three studies followed this best practice. Due to the limited size of available datasets, most studies used the same data for both training and validation, increasing the likelihood of overfitting.
Several studies included in this review showed methodological limitations that may affect the validity of their reported results. Notably, we identified eleven studies did not employ an independent test set or relied solely on cross-validation without reserving a separate held-out dataset. Two studies [43,44] used minimal test sets (approximately 10% of the total data), which were disproportionately smaller than their corresponding training sets. Four studies [31,33,35,41] did not describe how CV was applied, raising concerns about overfitting and data leakage. Additionally, one study [54] reported only sensitivity, three [9,59,60] reported only AUC, and three [14,35,49] others reported only accuracy without including essential evaluation metrics such as precision, recall, or F1-score. These metrics are particularly important when evaluating model performance on imbalanced datasets, as is often the case in PD diagnosis.
These methodological concerns are documented in Supplementary Table S7, which includes a dedicated column “methodological flaw”. To enhance the robustness and reproducibility of future research, we recommend the adoption of standardized validation frameworks, such as nested cross-validation or the use of external test sets. Moreover, researchers should consistently report a comprehensive set of evaluation metrics to provide a more complete and reliable assessment of model performance.
Overall, the review reveals a clear need for larger and more balanced datasets to address key sources of bias in ML-based PD detection. With larger datasets, it would be more feasible to follow rigorous methodologies, such as using separate training, validation, and test sets, and implement systematic strategies to minimize overfitting.

4.5. Research Challenges and Recommendations

Based on the comparative analysis across multiple studies and datasets, several key challenges emerge in the application of machine learning to Parkinson’s Disease detection from speech.

4.5.1. Methodological and Technical Challenges

Many studies in PD detection from speech use small and homogeneous datasets often fewer than 50 subjects, which limits model reliability and generalizability. While models like SVMs and Random Forests show strong results on structured datasets (e.g., UCI-based PD), performance varies across datasets such as MDVR-KCL and PD-German, highlighting the need for more diverse and larger cohorts. This is particularly important for deep learning models that require extensive data to perform well.
A lack of detailed reporting on model design, preprocessing, and validation strategies is another issue, making it difficult to reproduce or compare studies. Inconsistent classification of disease stages also complicates the development of standardized benchmarks. Furthermore, many models are only tested on the datasets they were trained on, without external validation, which limits their clinical usefulness.

4.5.2. Translational Challenges

Most ML models are developed in research settings and are not easily integrated into clinical workflows. Clinical use requires compatibility with electronic health records (EHRs), simple interfaces, and interpretable outputs to support clinician decision-making.
Another major concern is the limited diversity in training data. Models trained on specific languages or populations often fail to generalize across different regions or cultures, leading to potential bias. Language and accent differences pose challenges for speech-based models.
Regulatory approval (e.g., FDA, EMA) and ethical considerations such as privacy and bias must be addressed for clinical adoption. In addition, the field lacks large, standardized, and publicly available datasets, which restricts benchmarking and reproducibility.
Finally, beyond achieving high accuracy, models must prove cost-effective and practical in real-world clinical environments and areas that are still underexplored in current research.

4.6. Study Limitations

During the study selection process, we excluded articles that were not written in English, did not provide full-text access, or were not openly accessible. This was mainly due to limitations in interpreting non-English texts and the inability to evaluate studies without full access. As a result, some valuable research offering relevant insights or diagnostic methods for PD may have been unintentionally excluded. Also, the literature search was limited to the four databases specified in the Methods section. The exclusion of other databases may have restricted the scope of retrieved studies. Furthermore, the specific keywords used in the search may have contributed to limitations in identifying all relevant articles.

5. Conclusions

The purpose of this systematic review was to explore the application of AI methods in diagnosing PD and monitoring its progression. Specifically, it focused on utilizing voice, speech, and language to extract digital biomarkers for machine learning models. The review synthesized findings from 34 selected studies.
The extensive number and diversity of studies highlight the significant potential of this field. Despite challenges associated with data types and methodological variations, nearly all studies reported high performance. Compared to traditional neuropsychological assessments, speech and language technologies demonstrated comparable or superior discriminative power in distinguishing between patient groups. Common speech and language tasks included analyzing spontaneous speech, spontaneous dialog, sustained vowels, verbal fluency tasks, linguistic features, and diadochokinetic (DDK) rates. Most studies employed cross-validation as the primary evaluation method, although many performed feature selection outside the cross-validation framework. This approach often involves using both training and testing data to identify relevant features for classifiers, a practice that could impact the reliability and generalizability of the resulting models. Additionally, machine learning models were typically optimized using metrics such as accuracy, AUC, F1-score, sensitivity, specificity, and precision. However, few studies explicitly tested their models on entirely unseen datasets, which would provide more robust validation.
The limitations observed in these studies can often be attributed to the small size and variable quality of the datasets, making it challenging to maintain the integrity of experimental groups while creating adequate subsets. This underscores the importance of establishing standardized methodologies and datasets. Data collection in this field is particularly challenging due to ethical constraints and the personally identifiable nature of speech data. Developing a standard dataset is essential to set baselines for detecting PD, as well as for constructing regression models capable of predicting cognitive scores. One underexplored resource in this field is conversational dialog data, which has the potential to yield better results compared to monolog data, despite its methodological challenges. Future research should consider leveraging such data to improve outcomes.
In conclusion, AI and machine learning offer significant advantages in leveraging voice and speech data to build diagnostic and detection tools for PD. This review summarized and analyzed the research focus, aims, datasets, methodologies, and performance of existing studies. While the field has advanced, gaps remain, particularly due to insufficient data and demographic information.
To advance research in this area, future studies should prioritize the following objectives:
  • Exploring novel approaches to construct automated, end-to-end systems.
  • Reporting per-class metrics for better performance evaluation and system reliability.
  • Investigating innovative techniques for the early detection of PD.
  • Establish standardized datasets to set benchmarks for classification and regression tasks.
  • Strengthening collaboration between researchers and clinical practitioners to facilitate the development of clinically relevant applications.
Addressing these challenges will contribute to the advancement of more reliable and generalizable AI-driven diagnostic tools, ultimately improving early detection and intervention strategies for PD.

Supplementary Materials

The following supporting information can be downloaded at: https://www.mdpi.com/article/10.3390/inventions10040048/s1.

Author Contributions

Conceptualization, M.A.H., and F.A.; methodology, M.A.H., E.T., and F.A.; software, M.A.H.; validation, M.A.H., E.T., and F.A.; formal analysis, M.A.H., and E.T.; investigation, M.A.H., and F.A.; resources, M.A.H., and E.T.; data curation, E.T., and M.A.H.; writing—original draft preparation, M.A.H., and E.T.; writing—review and editing, M.A.H., E.T., and F.A.; visualization, M.A.H.; supervision, F.A.; project administration, F.A.; funding acquisition, F.A. All authors have read and agreed to the published version of the manuscript.

Funding

This work was supported by an institutional grant from the University of Camerino.

Institutional Review Board Statement

Not applicable.

Informed Consent Statement

Not applicable.

Data Availability Statement

No new data were created or analyzed in this study. Data sharing does not apply to this article.

Acknowledgments

We are grateful to the staff of the Telemedicine and Telepharmacy Center at the University of Camerino for helpful suggestions and discussion.

Conflicts of Interest

No author has any conflicts during the preparation and publication of the manuscript.

References

  1. Alshammri, R.; Alharbi, G.; Alharbi, E.; Almubark, I. Machine Learning Approaches to Identify Parkinson’s Disease Using Voice Signal Features. Front. Artif. Intell. 2023, 6, 1084001. [Google Scholar] [CrossRef] [PubMed]
  2. Poewe, W.; Seppi, K.; Tanner, C.M.; Halliday, G.M.; Brundin, P.; Volkmann, J.; Schrag, A.-E.; Lang, A.E. Parkinson Disease. Nat. Rev. Dis. Primers 2017, 3, 17013. [Google Scholar] [CrossRef] [PubMed]
  3. DeMaagd, G.; Philip, A. Parkinson’s Disease and Its Management: Part 1: Disease Entity, Risk Factors, Pathophysiology, Clinical Presentation, and Diagnosis. Pharm. Ther. 2015, 40, 504–532. [Google Scholar]
  4. Moya-Galé, G.; Levy, E.S. Parkinson’s Disease-Associated Dysarthria: Prevalence, Impact and Management Strategies. Res. Rev. Park. 2019, 9, 9–16. [Google Scholar] [CrossRef]
  5. Auclair-Ouellet, N.; Lieberman, P.; Monchi, O. Contribution of Language Studies to the Understanding of Cognitive Impairment and Its Progression over Time in Parkinson’s Disease. Neurosci. Biobehav. Rev. 2017, 80, 657–672. [Google Scholar] [CrossRef]
  6. Harel, B.; Cannizzaro, M.; Snyder, P.J. Variability in Fundamental Frequency during Speech in Prodromal and Incipient Parkinson’s Disease: A Longitudinal Case Study. Brain Cogn. 2004, 56, 24–29. [Google Scholar] [CrossRef]
  7. Suppa, A.; Asci, F.; Costantini, G.; Bove, F.; Piano, C.; Pistoia, F.; Cerroni, R.; Brusa, L.; Cesarini, V.; Pietracupa, S.; et al. Effects of Deep Brain Stimulation of the Subthalamic Nucleus on Patients with Parkinson’s Disease: A Machine-Learning Voice Analysis. Front. Neurol. 2023, 14, 1267360. [Google Scholar] [CrossRef]
  8. Luna-Ortiz, I.; Aldape-Pérez, M.; Uriarte-Arcia, A.V.; Rodríguez-Molina, A.; Alarcón-Paredes, A.; Ventura-Molina, E. Parkinson’s Disease Detection from Voice Recordings Using Associative Memories. Healthcare 2023, 11, 1601. [Google Scholar] [CrossRef]
  9. Iyer, A.; Kemp, A.; Rahmatallah, Y.; Pillai, L.; Glover, A.; Prior, F.; Larson-Prior, L.; Virmani, T. A Machine Learning Method to Process Voice Samples for Identification of Parkinson’s Disease. Sci. Rep. 2023, 13, 20615. [Google Scholar] [CrossRef]
  10. Al Kuwaiti, A.; Nazer, K.; Al-Reedy, A.; Al-Shehri, S.; Al-Muhanna, A.; Subbarayalu, A.V.; Al Muhanna, D.; Al-Muhanna, F.A. A Review of the Role of Artificial Intelligence in Healthcare. J. Pers. Med. 2023, 13, 951. [Google Scholar] [CrossRef]
  11. Ucuzal, H.; Arslan, A.K.; Çolak, C. Deep Learning Based-Classification of Dementia in Magnetic Resonance Imaging Scans. In Proceedings of the 2019 International Artificial Intelligence and Data Processing Symposium (IDAP), Malatya, Turkey, 21–22 September 2019; pp. 1–6. [Google Scholar]
  12. Koh, D.-M.; Papanikolaou, N.; Bick, U.; Illing, R.; Kahn, C.E.; Kalpathi-Cramer, J.; Matos, C.; Martí-Bonmatí, L.; Miles, A.; Mun, S.K.; et al. Artificial Intelligence and Machine Learning in Cancer Imaging. Commun. Med. 2022, 2, 133. [Google Scholar] [CrossRef]
  13. Goni, M.; Eickhoff, S.B.; Far, M.S.; Patil, K.R.; Dukart, J. Smartphone-Based Digital Biomarkers for Parkinson’s Disease in a Remotely-Administered Setting. IEEE Access 2022, 10, 28361–28384. [Google Scholar] [CrossRef]
  14. Costantini, G.; Cesarini, V.; Di Leo, P.; Amato, F.; Suppa, A.; Asci, F.; Pisani, A.; Calculli, A.; Saggio, G. Artificial Intelligence-Based Voice Assessment of Patients with Parkinson’s Disease Off and On Treatment: Machine vs. Deep-Learning Comparison. Sensors 2023, 23, 2293. [Google Scholar] [CrossRef] [PubMed]
  15. Demir, F.; Siddique, K.; Alswaitti, M.; Demir, K.; Sengur, A. A Simple and Effective Approach Based on a Multi-Level Feature Selection for Automated Parkinson’s Disease Detection. J. Pers. Med. 2022, 12, 55. [Google Scholar] [CrossRef] [PubMed]
  16. Amato, F.; Borzi, L.; Olmo, G.; Artusi, C.A.; Imbalzano, G.; Lopiano, L. Speech Impairment in Parkinson’s Disease: Acoustic Analysis of Unvoiced Consonants in Italian Native Speakers. IEEE Access 2021, 9, 166370–166381. [Google Scholar] [CrossRef]
  17. Pu, T.; Huang, M.; Kong, X.; Wang, M.; Chen, X.; Feng, X.; Wei, C.; Weng, X.; Xu, F. Lee Silverman Voice Treatment to Improve Speech in Parkinson’s Disease: A Systemic Review and Meta-Analysis. Park. Dis. 2021, 2021, 3366870. [Google Scholar] [CrossRef]
  18. Altham, C.; Zhang, H.; Pereira, E. Machine Learning for the Detection and Diagnosis of Cognitive Impairment in Parkinson’s Disease: A Systematic Review. PLoS ONE 2024, 19, e0303644. [Google Scholar] [CrossRef]
  19. Hecker, P.; Steckhan, N.; Eyben, F.; Schuller, B.W.; Arnrich, B. Voice Analysis for Neurological Disorder Recognition–A Systematic Review and Perspective on Emerging Trends. Front. Digit. Health 2022, 4, 842301. [Google Scholar] [CrossRef]
  20. Idrisoglu, A.; Dallora, A.L.; Anderberg, P.; Berglund, J.S. Applied Machine Learning Techniques to Diagnose Voice-Affecting Conditions and Disorders: Systematic Literature Review. J. Med. Int. Res. 2023, 25, e46105. [Google Scholar] [CrossRef]
  21. Page, M.J.; McKenzie, J.E.; Bossuyt, P.M.; Boutron, I.; Hoffmann, T.C.; Mulrow, C.D.; Shamseer, L.; Tetzlaff, J.M.; Akl, E.A.; Brennan, S.E.; et al. The PRISMA 2020 Statement: An Updated Guideline for Reporting Systematic Reviews. BMJ 2021, 372, n71. [Google Scholar] [CrossRef]
  22. Kitchenham, B.; Charters, S. Guidelines for Performing Systematic Literature Reviews in Software Engineering; Keele University: Keele, UK, 2007; Volume 2. [Google Scholar]
  23. De La Fuente Garcia, S.; Ritchie, C.W.; Luz, S. Artificial Intelligence, Speech, and Language Processing Approaches to Monitoring Alzheimer’s Disease: A Systematic Review. J. Alzheimer’s Dis. 2020, 78, 1547–1574. [Google Scholar] [CrossRef] [PubMed]
  24. Orozco-Arroyave, J.R.; Arias-Londoño, J.D.; Vargas-Bonilla, J.F.; González-Rátiva, M.C.; Nöth, E. New Spanish Speech Corpus Database for the Analysis of People Suffering from Parkinson’s Disease. In Proceedings of the Ninth International Conference on Language Resources and Evaluation (LREC’14), Reykjavik, Iceland, 26–31 May 2014; Calzolari, N., Choukri, K., Declerck, T., Loftsson, H., Maegaard, B., Mariani, J., Moreno, A., Odijk, J., Piperidis, S., Eds.; European Language Resources Association (ELRA): Reykjavik, Iceland, 2014; pp. 342–347. [Google Scholar]
  25. Reddy, M.K.; Alku, P. Exemplar-Based Sparse Representations for Detection of Parkinson’s Disease from Speech. IEEE/ACM Trans. Audio Speech Lang. Process. 2023, 31, 1386–1396. [Google Scholar] [CrossRef]
  26. Pah, N.D.; Indrawati, V.; Kumar, D.K. Voice-Based SVM Model Reliability for Identifying Parkinson’s Disease. IEEE Access 2023, 11, 144296–144305. [Google Scholar] [CrossRef]
  27. Ibarra, E.J.; Arias-Londoño, J.D.; Zañartu, M.; Godino-Llorente, J.I. Towards a Corpus (and Language)-Independent Screening of Parkinson’s Disease from Voice and Speech through Domain Adaptation. Bioengineering 2023, 10, 1316. [Google Scholar] [CrossRef]
  28. Scimeca, S.; Amato, F.; Olmo, G.; Asci, F.; Suppa, A.; Costantini, G.; Saggio, G. Robust and Language-Independent Acoustic Features in Parkinson’s Disease. Front. Neurol. 2023, 14, 1198058. [Google Scholar] [CrossRef]
  29. Warule, P.; Mishra, S.P.; Deb, S. Time-Frequency Analysis of Speech Signal Using Chirplet Transform for Automatic Diagnosis of Parkinson’s Disease. Biomed. Eng. Lett. 2023, 13, 613–623. [Google Scholar] [CrossRef]
  30. Eyigoz, E.; Courson, M.; Sedeño, L.; Rogg, K.; Orozco-Arroyave, J.R.; Nöth, E.; Skodda, S.; Trujillo, N.; Rodríguez, M.; Rusz, J.; et al. From Discourse to Pathology: Automatic Identification of Parkinson’s Disease Patients via Morphological Measures across Three Languages. Cortex 2020, 132, 191–205. [Google Scholar] [CrossRef]
  31. Quan, C.; Ren, K.; Luo, Z.; Chen, Z.; Ling, Y. End-to-End Deep Learning Approach for Parkinson’s Disease Detection from Speech Signals. Biocybern. Biomed. Eng. 2022, 42, 556–574. [Google Scholar] [CrossRef]
  32. Little, M.A.; McSharry, P.E.; Hunter, E.J.; Spielman, J.; Ramig, L.O. Suitability of Dysphonia Measurements for Telemonitoring of Parkinson’s Disease. IEEE Trans. Biomed. Eng. 2009, 56, 1015–1022. [Google Scholar] [CrossRef]
  33. Rana, A.; Dumka, A.; Singh, R.; Rashid, M.; Ahmad, N.; Panda, M.K. An Efficient Machine Learning Approach for Diagnosing Parkinson’s Disease by Utilizing Voice Features. Electronics 2022, 11, 3782. [Google Scholar] [CrossRef]
  34. Almasoud, A.S.; Eisa, T.A.E.; Al-Wesabi, F.N.; Elsafi, A.; Al Duhayyim, M.; Yaseen, I.; Hamza, M.A.; Motwakel, A. Parkinson’s Detection Using RNN-Graph-LSTM with Optimization Based on Speech Signals. Comput. Mater. Contin. 2022, 72, 871–886. [Google Scholar] [CrossRef]
  35. Sakar, B.E.; Serbes, G.; Sakar, C.O. Analyzing the Effectiveness of Vocal Features in Early Telediagnosis of Parkinson’s Disease. PLoS ONE 2017, 12, e0182428. [Google Scholar] [CrossRef]
  36. Alalayah, K.M.; Senan, E.M.; Atlam, H.F.; Ahmed, I.A.; Shatnawi, H.S.A. Automatic and Early Detection of Parkinson’s Disease by Analyzing Acoustic Signals Using Classification Algorithms Based on Recursive Feature Elimination Method. Diagnostics 2023, 13, 1924. [Google Scholar] [CrossRef]
  37. Cai, Z.; Gu, J.; Chen, H.L. A New Hybrid Intelligent Framework for Predicting Parkinson’s Disease. IEEE Access 2017, 5, 17188–17200. [Google Scholar] [CrossRef]
  38. Sakar, C.; Serbes, G.; Gunduz, A.; Nizam, H.; Sakar, B. Parkinson’s Disease Classification. UCI Mach. Learn. Repos. 2018, 10, C5MS4X. [Google Scholar]
  39. Ali, L.; Zhu, C.; Zhang, Z.; Liu, Y. Automated Detection of Parkinson’s Disease Based on Multiple Types of Sustained Phonations Using Linear Discriminant Analysis and Genetically Optimized Neural Network. IEEE J. Transl. Eng. Health Med. 2019, 7, 2000410. [Google Scholar] [CrossRef]
  40. Demir, F.; Sengur, A.; Ari, A.; Siddique, K.; Alswaitti, M. Feature Mapping and Deep Long Short Term Memory Network-Based Efficient Approach for Parkinson’s Disease Diagnosis. IEEE Access 2021, 9, 149456–149464. [Google Scholar] [CrossRef]
  41. Dao, S.V.T.; Yu, Z.; Tran, L.V.; Phan, P.N.K.; Huynh, T.T.M.; Le, T.M. An Analysis of Vocal Features for Parkinson’s Disease Classification Using Evolutionary Algorithms. Diagnostics 2022, 12, 1980. [Google Scholar] [CrossRef]
  42. Jaeger, H.; Trivedi, D.; Stadtschnitzer, M. Mobile Device Voice Recordings at King’s College London (MDVR-KCL) from Both Early and Advanced’s Disease Patients and Healthy Controls; King’s College London (KCL) Hospital: London, UK, 2019. [Google Scholar]
  43. Yousif, N.R.; Balaha, H.M.; Haikal, A.Y.; El-Gendy, E.M. A Generic Optimization and Learning Framework for Parkinson Disease via Speech and Handwritten Records. J. Ambient. Intell. Humaniz. Comput. 2023, 14, 10673–10693. [Google Scholar] [CrossRef]
  44. Di Cesare, M.G.; Perpetuini, D.; Cardone, D.; Merla, A. Machine Learning-Assisted Speech Analysis for Early Detection of Parkinson’s Disease: A Study on Speaker Diarization and Classification Techniques. Sensors 2024, 24, 1499. [Google Scholar] [CrossRef]
  45. Tsanas, A.; Little, M.A.; McSharry, P.E.; Ramig, L.O. Accurate Telemonitoring of Parkinson’s Disease Progression by Noninvasive Speech Tests. IEEE Trans. Biomed. Eng. 2009, 57, 884–893. [Google Scholar] [CrossRef] [PubMed]
  46. Wan, S.; Liang, Y.; Zhang, Y.; Guizani, M. Deep Multi-Layer Perceptron Classifier for Behavior Analysis to Estimate Parkinson’s Disease Severity Using Smartphones. IEEE Access 2018, 6, 36825–36833. [Google Scholar] [CrossRef]
  47. Bot, B.M.; Suver, C.; Neto, E.C.; Kellen, M.; Klein, A.; Bare, C.; Doerr, M.; Pratap, A.; Wilbanks, J.; Dorsey, E.R.; et al. The MPower Study, Parkinson Disease Mobile Data Collected Using ResearchKit. Sci. Data 2016, 3, 160011. [Google Scholar] [CrossRef]
  48. Koreman, J.C. A German Database of Patterns of Pathological Vocal Fold Vibration; Institut für Sexualwissenschaft: Berlin, Germany, 1997. [Google Scholar]
  49. Mondol, S.I.M.M.R.; Kim, R.; Lee, S. Hybrid Machine Learning Framework for Multistage Parkinson’s Disease Classification Using Acoustic Features of Sustained Korean Vowels. Bioengineering 2023, 10, 984. [Google Scholar] [CrossRef]
  50. Moro-Velazquez, L.; Gomez-Garcia, J.A.; Godino-Llorente, J.I.; Villalba, J.; Rusz, J.; Shattuck-Hufnagel, S.; Dehak, N. A Forced Gaussians Based Methodology for the Differential Evaluation of Parkinson’s Disease by Means of Speech Processing. Biomed. Signal Process. Control 2019, 48, 205–220. [Google Scholar] [CrossRef]
  51. Rusz, J.; Cmejla, R.; Tykalova, T.; Ruzickova, H.; Klempir, J.; Majerova, V.; Picmausova, J.; Roth, J.; Ruzicka, E. Imprecise Vowel Articulation as a Potential Early Marker of Parkinson’s Disease: Effect of Speaking Task. J. Acoust. Soc. Am. 2013, 134, 2171–2181. [Google Scholar] [CrossRef]
  52. Skodda, S.; Grönheit, W.; Schlegel, U. Intonation and Speech Rate in Parkinson’s Disease: General and Dynamic Aspects and Responsiveness to Levodopa Admission. J. Voice 2011, 25, e199–e205. [Google Scholar] [CrossRef]
  53. Dimauro, G.; Di Nicola, V.; Bevilacqua, V.; Caivano, D.; Girardi, F. Assessment of Speech Intelligibility in Parkinson’s Disease Using a Speech-To-Text System. IEEE Access 2017, 5, 22199–22208. [Google Scholar] [CrossRef]
  54. Arora, S.; Lo, C.; Hu, M.; Tsanas, A. Smartphone Speech Testing for Symptom Assessment in Rapid Eye Movement Sleep Behavior Disorder and Parkinson’s Disease. IEEE Access 2021, 9, 44813–44824. [Google Scholar] [CrossRef]
  55. Malekroodi, H.S.; Madusanka, N.; Lee, B.-I.; Yi, M. Leveraging Deep Learning for Fine-Grained Categorization of Parkinson’s Disease Progression Levels through Analysis of Vocal Acoustic Patterns. Bioengineering 2024, 11, 295. [Google Scholar] [CrossRef]
  56. Zhao, S.; Dai, G.; Li, J.; Zhu, X.; Huang, X.; Li, Y.; Tan, M.; Wang, L.; Fang, P.; Chen, X.; et al. An Interpretable Model Based on Graph Learning for Diagnosis of Parkinson’s Disease with Voice-Related EEG. NPJ Digit. Med. 2024, 7, 3. [Google Scholar] [CrossRef] [PubMed]
  57. Quan, C.; Ren, K.; Luo, Z. A Deep Learning Based Method for Parkinson’s Disease Detection Using Dynamic Features of Speech. IEEE Access 2021, 9, 10239–10252. [Google Scholar] [CrossRef]
  58. Wang, Q.; Fu, Y.; Shao, B.; Chang, L.; Ren, K.; Chen, Z.; Ling, Y. Early Detection of Parkinson’s Disease from Multiple Signal Speech: Based on Mandarin Language Dataset. Front. Aging Neurosci. 2022, 14, 1036588. [Google Scholar] [CrossRef] [PubMed]
  59. Laganas, C.; Iakovakis, D.; Hadjidimitriou, S.; Charisis, V.; Dias, S.B.; Bostantzopoulou, S.; Katsarou, Z.; Klingelhoefer, L.; Reichmann, H.; Trivedi, D.; et al. Parkinson’s Disease Detection Based on Running Speech Data from Phone Calls. IEEE Trans. Biomed. Eng. 2022, 69, 1573–1584. [Google Scholar] [CrossRef]
  60. Lim, W.S.; Chiu, S.I.; Wu, M.C.; Tsai, S.F.; Wang, P.H.; Lin, K.P.; Chen, Y.M.; Peng, P.L.; Chen, Y.Y.; Jang, J.S.R.; et al. An Integrated Biometric Voice and Facial Features for Early Detection of Parkinson’s Disease. NPJ Park. Dis. 2022, 8, 145. [Google Scholar] [CrossRef]
Figure 1. PRISMA flow diagram for literature search, screening, inclusion, and exclusion.
Inventions 10 00048 g001
Figure 2. Distribution of selected studies per year from 2014 to 2024.
Inventions 10 00048 g002
Figure 3. Countries from which reviewed articles originated.
Inventions 10 00048 g003
Figure 4. Flowchart of a machine learning process.
Inventions 10 00048 g004
Figure 5. Studies Performance metrics of ML models across voice datasets. Panels A–D show performance results reported in studies using the dataset (A) PC-GITA [24], studies [25,26,27,28,29,30,31], (B) MDVR-KCL [42], studies [25,43,44], (C) PD-German [52], studies [27,30], and (D) PD-Czech [51], studies [27,30]. Abbreviations: SVM: Support Vector Machine; KNN: K-Nearest Neighbors; NN: Neural Network; ANN: Artificial Neural Network; DL: Deep Learning; Hybrid: multiple model architectures; SGD: Stochastic Gradient Descent.
Inventions 10 00048 g005
Figure 6. Studies and Models Performance based on the dataset, and language. Panels A–D display the performance metrics reported in studies using the (A) PD-Italian, (B) UCI-PD, (C) Sakar/Turkish, and (D) Asian languages datasets. Subfigure (A) studies [7,14,16,28,53,55], Subfigure (B) studies [1,8,33,34,35,36,37,46,54], Subfigure (C) studies [8,15,39,40,41], Subfigure (D) studies [31,49,56,57,60]. Abbreviations: SVM: Support Vector Machine; KNN: K-Nearest Neighbors; DL: Deep Learning; RF: Random Forest; MLP: Multilayer Perceptron; DMLP: Deep MLP; LSTM: Long Short-Term Memory; ANN: Artificial Neural Network; ISNDM: Improved Smallest Normalized Difference Associative Memory; GP: Gaussian Process; NB: Naïve Bayes; GNB: Gaussian NB; LGB: Light Gradient Boosting machine; Hybrid: multiple model architectures.
Inventions 10 00048 g006
Figure 7. Model performance across included studies. Abbreviations: SVM: Support Vector Machine; KNN: K-Nearest Neighbors; DT: Decision Tree; RF: Random Forest; MLP: Multilayer Perceptron; CNN: Convolutional Neural Network; LSTM: Long Short-Term Memory; ANN: Artificial Neural Network; DL: Deep Learning; LR: Logistic Regression.
Inventions 10 00048 g007
Table 1. Validation methods and studies.
Validation MethodNumber of Studies and References
5-fold CV[25,56]
10-fold CV[7,13,14,15,16,27,28,29,34,43,49,57,58]
LOSOCV[30,36,39,46,54,59]
K-fold CV[37,46]
Nested CV[44]
3-fold CV[55]
Grid Search CV[1]
SoftMax[40,43]
5 × 2 CV[8]
Random Sampling[16]
CV: cross-validation; LOSOCV: Leave-One-Subject-Out cross-validation.
Disclaimer/Publisher’s Note: The statements, opinions and data contained in all publications are solely those of the individual author(s) and contributor(s) and not of MDPI and/or the editor(s). MDPI and/or the editor(s) disclaim responsibility for any injury to people or property resulting from any ideas, methods, instructions or products referred to in the content.

