Abstract
Methodologies to measure motion perception are vital for deepening our understanding of the vision system and the factors that influence it. While existing work has primarily focused on the fastest perceivable velocities, less attention has been paid to the lower threshold of motion (LTM; slowest perceivable velocities). In this study, we designed an optical system to measure LTM in a sample of healthy young adults and to assess the influence of retinal location (central vs. peripheral retina) and stimulus composition (broadband vs. mid-wave) on LTM. The system was based on a xenon light source and a fiber-optic cable that created a bright light stimulus that could be moved along a computer-controlled precision translation slide. The stimulus, exposed for one-second intervals at both a central (fovea) and a peripheral (33 deg) location, was moved at varying speeds to determine the slowest detectable speed. In all, 37 healthy young participants (M = 19.32 ± 1.97 years) were tested. We found substantial between-subject variability in LTM and an interaction between stimulus wavelength and retinal location. The measurement of LTM using this novel apparatus and methodology provides insights into the relationship between slow-moving, ecologically valid stimuli and perceptual detection at the slowest speeds.
1. Introduction
Motion perception is a fundamental visual process that involves seeing a stimulus move through space over time and is crucial for the construction of a normal and cohesive visual experience. In essence, motion perception requires the initial sequential activation of photoreceptors, which results from a serial change in a visual stimulus. Schouten [1] argued for a simple neural model of motion perception composed of two neurons separated by a fixed distance that feed into a movement detector. This movement detector (e.g., [2]) would only respond if the first receptor is activated and then the second is activated within a given amount of time (i.e., directional and temporal tuning).
As with most processes in vision, the ultimate perception of motion is complex and multi-level [3], evidenced by the variety of theoretical models and methodologies that exist (e.g., [4,5]). Despite the common conceptualization of the motion perception system as being composed of distinct components, all components of the system work in conjunction and are necessary for the holistic experience of motion. Nonetheless, a useful model for understanding global motion perception discriminates between the highest and lowest speeds that can be detected. There is experimental and clinical evidence that velocity-dependent information is processed in two relatively independent pathways (e.g., [6,7,8]). Most studies (reviewed by Sekuler et al. [9]) have focused on the fastest detectable speeds. Much less work has been conducted characterizing slow motion, and these studies have used widely different methodologies. For example, Boulton [6] and Lappin et al. [10] utilized drifting sinusoidal gratings while Yan et al. [11] and Nightingale et al. [12] used random dot kinematograms displayed on computer monitors.
In the present study, we investigated the image–retina model of motion perception to measure the lower threshold of motion (LTM), which represents the slowest speed that an individual can detect. Previous investigations of LTM (e.g., [6]) and slow-motion systems more generally (e.g., [13,14,15]) have commonly utilized a combination of cathode-ray tube (CRT) and liquid-crystal display (LCD) monitors to present stimuli. Computer-based paradigms displayed on monitors are highly customizable and reduce experimenter burden, which is one reason they are so commonly used. One limitation of monitors, however, is that they cannot replicate important and highly variable real-world factors that may affect slow-motion detection. For example, CRTs cannot maintain homogeneous display illumination and have limited temporal refresh rates [16]. LCDs do not have the same temporal constraints as CRTs, but they are still unable to present pure-wavelength stimuli and show drastic declines in luminance in the periphery (e.g., [17]). In a real-world scene, objects are often illuminated by sunlight, located at a distance, and affected by the optics of the atmosphere and eye. Monitors are limited in the wavelength composition of the stimuli that they can present. Consequently, they cannot always be used to test real-world scenarios where wavelength composition is an important variable (e.g., [18]).
Some of the most precise measures of slow-motion detection were developed by Liebowitz et al. [19], who tested three participants using a white reflective square moving along a linear track and concluded that motion could be detected on the order of 1 to 2 min of visual angle per second (arcmin/s) when tested in the central retina. In this study, we improved upon the design originally described by Leibowitz et al. [19] by using a light stimulus that emulated skylight to increase ecological validity and a more precise computer-based translation movement system. The goal of this study was (1) to characterize LTM in healthy young adults using “real” light (i.e., similar to what can be encountered outdoors) and (2) to assess any influences of retinal location and stimuli composition on slow-motion perception.
2. Materials and Methods
2.1. Participants
To measure LTM under optimal physiological conditions (e.g., efficient neurological processing and non-dense crystalline lens), we sought to measure healthy young people with good uncorrected vision. Consequently, we limited our sample to participants between 18 and 30 years of age. The exclusion of individuals who required corrective lenses (i.e., 20:45 uncorrected binocular Snellen visual acuity or worse, OU) minimized the influence of refractive error (which is thought to diminish motion perception sensitivity; [19]). The use of corrective spectacles or contact lenses was prohibited to reduce possible confounding for better (blur or additional scatter can sometimes be used as a motion cue) or worse. Furthermore, with the rising popularity of photochromic and other lenses with light-filtering additives, the exclusion of additional lens media prevented any influence of confounding light filters. Finally, participants were required to have good uncorrected vision (i.e., 20:40 monocular Snellen visual acuity or better, OD) to participate, as the alignment of the system was optimal for use with the right eye.
In all, 37 healthy participants ranging in age between 18 and 27 years were tested. Participants were recruited from among the undergraduate student population at the University of Georgia. Participants were also recruited from the local Athens-Clarke County, GA, community on a word-of-mouth basis. The majority were female (N = 27 female, 10 male) and White (86%); 5% were Black; 5% were Asian/Pacific Islander; and 4% were Multiracial. Twenty-two participants were right-eye-dominant (59%), and fifteen participants were left-eye-dominant (41%).
2.2. Ethics and Consent
This study protocol and all study materials were reviewed and approved by the University of Georgia’s Institutional Review Board (PROJECT00007466). All participants provided verbal and written informed consent to participate in the study and for their data to be published prior to participation. The tenets of the Declaration of Helsinki were adhered to at all times during the course of the study.
2.3. Materials and Equipment
The optical apparatus combined a xenon arc-based optical system with fiber-optic leads to create the stimulus, and a computer-controlled slide to move the stimulus smoothly and precisely. This system is shown in the schematic presented in Figure 1.
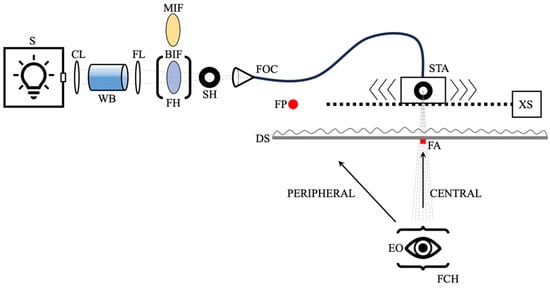
Figure 1.
A schematic of the slow-motion apparatus. S—xenon arc light source; CL—planoconvex achromatic collimating lens; WB—water bath for heat removal; FL—250 mm focal length planoconvex focusing lens; MIF—574 nm interference filter; BIF—blue-sky interference filter; FH—filter holder; SH—shutter-controlled aperture; FOC—fiber-optic cable; STA—6 mm stimulus aperture; XS—computer-controlled translation slide; FP—peripheral fixation point; DS—5 mm thick diffuser screen; FA—central fixation aid; EO—eye of the observer; FCH—forehead/chinrest assembly. Path of light is shown in light gray. Not to scale; see Section 2.3 for spacing details.
A 1000-watt xenon arc lamp (Newport Corporation; Irvine, CA, USA) was used as the light source (S in Figure 1). This broadband light source was used because the spectral composition closely matches that of mid-day sunlight (e.g., Figure 1 of [20]), which is the basis for most stimuli seen in the natural world. After exiting the lamp housing, the light was passed through a 250 mm focal length planoconvex achromatic collimating lens (~50 mm from the exit port of the light source), a 150 mm long water bath with a 20 mm × 20 mm exit aperture (~20 mm from collimating lens), a 250 mm focal length planoconvex achromatic focusing lens (~20 mm from water bath), either a “blue-sky” interference filter (LB120-40.5 Light Balancing [Minus Red]; Midwest Optical Systems, Inc.; Palatine, IL, USA) or a 574 nm interference filter (574 nm ± 8 nm bandpass), which was in a filter holder ~150 mm from the focusing lens, and a shutter-controlled aperture (that allowed all light to pass through when open; ~50 mm from filter holder) before traveling down a fiber-optic cable (~50 mm from shutter) attached to a computer-controlled translation slide (12-inch linear stage motorized XSlide; Velmex Inc.; Bloomfield, NY, USA; velmex.com). The translation slide was calibrated by the manufacturer and obtained immediately prior to use. Speeds were also initially confirmed manually using a ruler and a timer. The stimulus light then exited the fiber-optic cable through a 6 mm diameter circular aperture, traveled 40 mm to a 5 mm thick diffuser screen, and then traveled 845 mm from the diffuser screen to the eye of the observer. A forehead/chinrest assembly was used to stabilize participants’ heads. A small (~4 mm) red LED fixation point (570 mm left of and on the same plane as the fiber-optic stimulus aperture behind the diffuser screen; visual angle of ~33 degrees) was used to stabilize the participant’s gaze for peripheral stimulus presentation. This fixation point was placed behind the diffuser screen for the peripheral LTM task. For fixation in the central condition, a small (10 mm × 10 mm) central fixation aid on the diffuser screen slightly below the stimulus exposure location provided a location to stabilize the participant’s view during foveal stimulus exposure and did not occlude the stimulus. Controlling for eye movement was not necessary as participant fixation was sufficiently stabilized by the presence of these fixation points [21].
2.4. Stimuli
The resulting motion stimuli consisted of a relatively bright (~633 lux) broadband light (filtered using a “blue-sky” interference filter; Midwest Optical Systems, Inc.; Palatine, IL, USA) and a narrowband light (574 nm ± 8 nm bandpass; filtered using a 574 nm interference filter, ~90 lux) that were presented to the participant with central and peripheral fixation. The 6 mm stimulus aperture subtends approximately 23 min of visual angle, but the light then passes through a diffuser screen prior to reaching the eye of the participant. The diffuse nature of the light stimulus compromised experimenter control over the specificity of spatial frequency, but as most reflected light stimuli viewed in the environment are diffuse, this choice was made deliberately to prioritize ecological validity.
The stimulus (either the “sky blue” broadband or mid-wave light) moved either left or right at varying precise speeds using a computer-controlled translation slide. Both stimuli were presented centrally (<1-degree eccentricity) and in the periphery (33-degree eccentricity), as follows: 10 participants had central and peripheral LTM measured with both stimuli (at 2 separate study visits), 14 participants had central and peripheral LTM measured with only the broadband stimulus, and 13 participants had central and peripheral LTM measured with only the mid-wave stimulus. The order of central and peripheral measurement was randomized for each participant using a randomization program. These two stimulus wavelength compositions and two retinal locations allowed for a range of assessments and for control over the possible confounding influence of macular pigment, which is only optically significant in the macular region of the central retina [22] and is known to influence visual function [23].
2.5. Procedure
LTM thresholds were measured monocularly (OD) irrespective of ocular dominance. A soft, black, adjustable eye patch was used to completely occlude the participant’s left eye. The stimulus was moved at varying precise speeds using a computer-controlled translation slide. For each trial, the stimulus was exposed for a 1 s interval while traveling either left or right at a constant velocity between 0.2 arcmin/s and ~47 arcmin/s. Speeds at the upper end of this range produced the perception of movement easily, and this velocity was well beyond LTM values previously reported (e.g., 1 to 10 arcmin/s in [19]). All participants could detect movement centrally and peripherally at ~47 arcmin/s, while no participants could detect movement at 0.2 arcmin/s. Stimulus exposure was initiated by the experimenter when the translation slide with a mounted fiber-optic cable aperture crossed directly in front of the participant. A 1 s stimulus exposure was chosen to maximize the visibility of the stimulus and to avoid confounding the central or peripheral LTM measurements due to their underlying displacement or duration mechanisms (as described in [6]). This exposure time also replicated the 1 s stimulus exposures used by Leibowitz and colleagues [19].
The psychophysical method of limits was used to determine LTM with fixed stimulus velocities for each trial. To orient the participant to the task, two initial exposures were demonstrated: the first without movement (0 arcmin/s) and the second with fast movement (~47 arcmin/s). Once these preliminary demonstrations were completed, the experimenter used the method of limits to evaluate LTM. Prior to each trial, participants were reminded to maintain fixation. Participants then responded to each trial with whether they perceived movement and then their perceived direction of movement (i.e., either “left” or “right”). Participants were allowed to indicate that they perceived no movement, which reduced noise due to guessing. During descending measures, if a participant correctly judged the direction of movement, the speed for the next trial was decreased to further approach the threshold, and this proceeded until they could no longer reliably detect and report the direction of movement. During ascending trials, speed was increased between successive trials until movement was both detected and correctly judged. Participants were offered frequent breaks from testing and were required to take breaks after 5 trials. Thresholds were defined as the average velocity at which a participant achieved a 50% detection rate (chosen because of reduced noise in the absence of guessing).
To replicate the precision of Leibowitz and colleagues’ investigation [19], in which three observers were tested repeatedly to generate the LTM, we conducted additional trials (an average of 154 trials/participant) on three participants who were also highly trained psychophysical observers over the course of an additional testing session, each lasting approximately 90 min. The method of constant stimuli was used for these measurements to fully assess and visualize sensitivity at and around LTM. Sensitivity (see Figure 2) within given speed intervals (~2.44 arcmin/s) was derived from the number of correct responses divided by the total number of trials across the three participants.
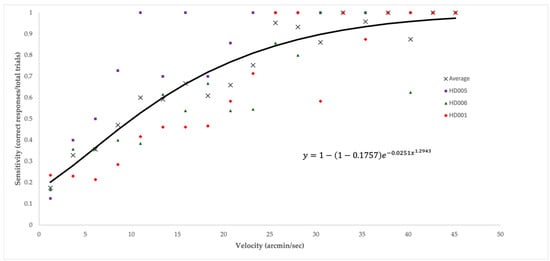
Figure 2.
Subsample average broadband peripheral lower-threshold-of-motion sensitivity curve. Average sensitivity on the y-axis (a percentage derived from the number of correct responses divided by the total number of trials within the given velocity range for the three participants) plotted vs. velocity on the x-axis (measured in arcmin/s). Squares, triangles, and diamonds represent the sensitivity of individual participants of the subsample, while each × signifies average sensitivity among the subsample at each respective velocity. A power function with a constraint y = 1 − (1 − 0.1757) e−0.0251x1.2943 closely fits the averaged data (R2 = 0.9407).
2.6. Statistical Analysis
RStudio (Version 2023.09.1 + 494) was used to compute descriptive statistics of LTM thresholds across conditions and to conduct paired-samples t-tests that assessed the influence of retinal location and stimulus composition (alpha level of 0.05 as criterion for significance in all statistical tests).
3. Results
Table 1 provides the mean, standard deviation, minimum, maximum, and range of LTM under each measurement condition for the entire sample. LTM scores within all four measurement conditions varied dramatically (on average ranging by a factor of 38.72) across individuals despite similar age, refractive state, etc., as shown in the table.

Table 1.
Descriptive statistics for lower threshold of motion (LTM) measurements. All LTM values are in arcmin/s.
In the broadband condition, central LTM (n = 24, M = 11.73 arcmin/s, SD = 8.57) ranged from a maximum of 32.99 arcmin/s to a minimum of 0.65 arcmin/s (by a factor of 50.75). This standard deviation represents 73% of its mean (meaning that there were wide individual differences). Peripheral LTM (n = 24, M = 13.26 arcmin/s, SD = 10.72) ranged from a maximum of 38.90 arcmin/s to a minimum of 1.00 arcmin/s (by a factor of 38.9). This standard deviation represents 81% of its mean.
In the mid-wave condition, central LTM (n = 23, M = 9.84 arcmin/s, SD = 7.38) ranged from a maximum of 24.69 arcmin/s to a minimum of 0.54 arcmin/s (by a factor of 45.72). This standard deviation represents 75% of its mean. Peripheral LTM (n = 23, M = 14.15 arcmin/s, SD = 9.06) ranged from a maximum of 32.99 arcmin/s to a minimum of 1.69 arcmin/s (by a factor of 19.52). This standard deviation represents 64% of its mean.
To assess the influence of stimulus composition on LTM, a paired-samples t-test was conducted using the data of participants measured in both stimulus conditions (n = 10). In the central retina, the difference between the broadband (M = 11.67, SD = 8.71) and the mid-wave (M = 8.82, SD = 6.62) conditions, with t(9) = 2.16 and p = 0.06 (two-tailed), was trending toward significance. In the peripheral retina, there was no statistically significant difference between the broadband (M = 11.72, SD = 11.69) and the mid-wave (M = 11.59, SD = 9.93) conditions, with t(9) = 0.12 and p = 0.90 (two-tailed).
To assess the influence of retinal location on LTM, paired-samples t-tests were conducted on both the broadband stimulus data and the mid-wave stimulus data. In the broadband condition (n = 24), there was no statistically significant difference between central LTM (M = 11.73, SD = 8.57) and peripheral LTM (M = 13.26, SD = 10.72), with t(23) = −0.76 and p = 0.45 (two-tailed). However, in the mid-wave condition (n = 23), there was a statistically significant difference between central LTM (M = 9.84, SD = 7.38) and peripheral LTM (M = 14.15, SD = 9.06), with t(22) = −2.80 and p = 0.01 (two-tailed).
Figure 2 shows the average LTM data in the broadband peripheral conditions for the three participants who were tested more extensively. A power function with a constraint describes the data well and provides a good fit (R2 = 0.94).
4. Discussion
The perception of motion, as a holistic phenomenon, ranges from seeing very fast stimuli to very slow stimuli, and accurate measurements of both are needed. For many species, including humans, high sensitivity to slow-moving stimuli (e.g., a large cat stalking its prey) is likely as important as seeing at the highest speeds. Motorists rely on input from their slow-motion system to avoid collisions with pedestrians and other vehicles. Individuals in specialized professions such as professional athletes and aircraft/military personnel require high sensitivity to peripheral motion for success in their respective roles. A baseball pitcher, for instance, must detect miniscule movements in their periphery to hold a baserunner on first base (to decrease the baserunner’s chances of stealing second base).
In this study, we found that under a variety of measurement conditions (i.e., central and peripheral, broadband and mid-wave), healthy young participants prescreened for optimal central acuity still varied dramatically. We also found that central detection was highest with a decline in sensitivity in the periphery. These results align with Liebowitz et al. [19], who found that slow-motion thresholds were best in the center of the retina and declined monotonically with eccentricity. They suggested that peripheral refraction correction could reduce this decline (our participants were only screened for central acuity). Given the wide individual differences in our data, even with healthy young participants, strategies (like correction) might be particularly helpful for some people with poor peripheral LTM.
As shown in Figure 2 (for a subsample of participants, but this pattern was generally true for all participants), perceptual sensitivity to slow-moving stimuli is well described by a classic psychometric function (a constrained power function). Therefore, our ability to derive thresholds with minimal measurement error was likely high. If this is so, however, then the degree of variability between the participants in this homogeneous sample is surprising.
In a recent study, Nightingale et al. [12] used a range of spectral conditions (light imposed between the eye and stimulus) to study whether different waveband veils would influence slow-motion thresholds. They found that average slow-motion thresholds (measured with kinematograms on a monitor and defined as “the lowest speed at which a correct response was recorded”) were not influenced by any of a large range of very different lighting scenarios. Based on this resilience to change, the authors argued that motion, tested in this way, represented a perceptual constancy. It should be noted that the range of individual threshold values for their sample (n = 60, 18 to 26 years of age) was substantial. For example, the values they reported ranged from 0.01 to 0.33 logdeg/s (i.e., 61.40 to 128.28 arcmin/s) in the condition without light interference. The individual differences reported by Nightingale et al. [12] (~67 arcmin/s; 2025) are comparable to those in the present study (an average range of ~31 arcmin/s, see Table 1). Both investigations demonstrate that sensitivity to slow motion varies substantially between individuals, even within a homogeneous sample with good vision. What drives these large differences in healthy young participants is an important question with interesting implications.
In the current study, we defined LTM as an absolute threshold (i.e., 50% detection rate) and measured it directly (i.e., without light interference) using a point source of light as opposed to a full-field kinematogram on a monitor. Our results demonstrate a statistically significant difference between central and peripheral LTM in the mid-wavelength condition but not in the broadband condition and a strong trend of differences between mid-wave and broadband stimuli in the central condition (evident despite the relatively small sample [n = 10] of participants tested on both wavelengths) but not in the peripheral condition. This suggests that the wavelength composition of the target itself (as opposed to the intervening veil) could have a different impact on LTM in different retinal locations. The loss of sensitivity in slow-motion perception with increasing eccentricity is consistent with previous findings (e.g., [6,19]). The masking of this effect in the broadband stimulus condition provides further evidence that wavelength composition interacts with slow-motion sensitivity. This is particularly important since it suggests that optical filtering could play a role. Athletes often wear tinted spectacle lenses and use other light filtration mechanisms to improve on-field performance (e.g., [24]). Many tinted lenses, ranging from contacts to intraocular implants, are thought to improve visual function in a variety of ways (including natural screening pigments within the retina). These data suggest the possibility that strategic filtering may be used to improve some aspects of motion processing.
The optical system created to collect these data is one of the major strengths of this study. Monitors generally lack the sensitivity necessary to approach the measurement of the slowest detectable speeds, and do not create color in the same way natural light creates color. All “colorful” stimuli presented in paradigms, such as Nightingale et al. [12], were created through metameric color mixtures. Such stimuli are sufficient for examining perceptual correlates of color but not for assessing the effect of specific wavelengths on visual function nor for investigating the effects of filtration. These methodological and apparatus differences may account for the differences in sensitivity seen between the current study and that of Nightingale et al. [12]. For example, the slowest LTM reported (~61-arcmin/s) by Nightingale et al. [12] is not only well above the fastest LTM reported by us (central: 32.99 arcmin/s; peripheral: 38.90 arcmin/s), but also faster than the ~47 arcmin/s demonstration that we used to orient the participant to the task (every participant in our study could easily see this motion centrally and peripherally). The differences in stimuli used (i.e., a wide-field kinematogram versus point-source light, LCD monitor versus xenon arc lamp, a limited temporal refresh rate producing apparent motion versus a physical stimulus moving at a precise and customizable speed) likely account for the discrepancies in motion sensitivity reported between the two studies. Our results closely align with the speeds previously reported (e.g., 1 to 10 arcmin/s in [19]) using more similar methods.
The device created for this study was designed to improve the ecological validity of LTM measurement, thus better representing differences in slow-motion sensitivity that are truly present in the real world. The primary limitation of our methodology was the difficulty/length of the testing (which is why psychophysical studies of this type tend to have small samples). Fatigue and attention can start becoming real issues with long testing sessions. This method and device may not be feasible for large-scale diagnostic testing but are ideal for characterizing the limits of slow-motion perception, which has real-world implications. Of note, auditory noise created by the stimulus moving across the translation control slide might have cued participants to the fact that the stimulus was moving. The noise, however, was minimal and not indicative of speed or direction. The volume and characteristics of the sound were relatively uniform regardless of the translation slide’s speed (even at speeds well below threshold). Also worth noting is that this study had limited diversity (i.e., 86% White and 73% female), which could limit the generalizability of our results. However, the presence of variability in LTM across participants, even within this highly homogeneous sample, reinforces the likely presence of individual differences in LTM throughout the general population.
Future studies should examine intraocular differences by measuring LTM in both eyes. This could reveal any influence of ocular dominance and inform whether the main determinate of slow-motion perception is truly entoptic (as suggested by Leibowitz et al. [19]) or further downstream in the visual system. Additionally, the measurement of both slow-motion perception and fast-motion perception in a within-subjects study would allow for the assessment of the functional relationship between the two ends of the global motion system. When considering the practical importance of slow-motion perception, this measurement could be especially valuable in assessments of driver safety or for specialized personnel such as pilots and athletes. These remaining questions and the individual differences found in this investigation confirm the need to more cohesively approach the measurement of LTM and further assess this relatively unexplored feature of human motion perception.
Author Contributions
Conceptualization, J.B.H., L.M.R.-H. and B.R.H.J.; Methodology, J.B.H., C.J.W. and B.R.H.J.; Software, J.B.H.; Validation, J.B.H., C.J.W. and S.F.S.; Formal Analysis, J.B.H.; Investigation, J.B.H. and S.F.S.; Resources, L.M.R.-H. and B.R.H.J.; Data Curation, J.B.H. and S.F.S.; Writing—Original Draft Preparation, J.B.H.; Writing—Review and Editing, J.B.H., L.M.R.-H., C.J.W., S.F.S. and B.R.H.J.; Visualization, J.B.H., C.J.W. and S.F.S.; Supervision, J.B.H., L.M.R.-H. and B.R.H.J.; Project Administration, J.B.H. and S.F.S. All authors have read and agreed to the published version of the manuscript.
Funding
This research received no external funding.
Data Availability Statement
The raw data supporting the conclusions of this article will be made available by the authors on request.
Conflicts of Interest
The authors declare no conflicts of interest.
Abbreviations
The following abbreviations are used in this manuscript:
| LTM | Lower threshold of motion |
| CRT | Cathode-ray tube |
| LCD | Liquid-crystal display |
References
- Schouten, J.F. Subjective stroboscopy and a model of visual movement detectors. In Models for the Perception of Speech and Visual Form: Proceedings of a Symposium, Boston, MA, USA, 11–14 November 1967; Wathen-Dunn, W., Ed.; MIT Press: Cambridge, MA, USA, 1967; pp. 44–55. [Google Scholar]
- Reichardt, W. Autocorrelation, a principle for evaluation of sensory information by the central nervous system. In Symposium on Principles of Sensory Communication 1959; MIT Press: Cambridge, MA, USA, 1961; pp. 303–317. [Google Scholar]
- Nishida, S.; Kawabe, T.; Sawayama, M.; Fukiage, T. Motion perception: From detection to interpretation. Annu. Rev. Vis. Sci. 2018, 4, 501–523. [Google Scholar] [CrossRef] [PubMed]
- Braddick, O. A short-range process in apparent motion. Vis. Res. 1974, 14, 519–527. [Google Scholar] [CrossRef]
- Cavanagh, P.; Mather, G. Motion: The long and short of it. Spat. Vis. 1989, 4, 103–129. [Google Scholar] [PubMed]
- Boulton, J.C. Two mechanisms for the detection of slow motion. J. Opt. Soc. Am. A Opt. Image Sci. 1987, 4, 1634. [Google Scholar] [CrossRef]
- Zihl, J.; von Cramon, D.; Mai, N.; Schmid, C.H. Disturbance of movement vision after bilateral posterior brain damage. Further evidence and follow up observations. Brain J. Neurol. 1991, 114 Pt 5, 2235–2252. [Google Scholar] [CrossRef]
- Barbur, J.L.; Watson, J.D.G.; Frackowiak, R.S.J.; Zeki, S. Conscious visual perception without V1. Brain J. Neurol. 1993, 116 Pt 6, 1293–1302. [Google Scholar] [CrossRef]
- Sekuler, R.; Watamaniuk, S.N.J.; Blake, R. Perception of visual motion. In H. Steven’s Handbook of Experimental Psychology: Sensation and Perception, 3rd ed.; Pashler, H., Yantis, S., Eds.; John Wiley & Sons Inc.: Hoboken, NJ, USA, 2002; pp. 121–176. [Google Scholar]
- Lappin, J.S.; Tadin, D.; Nyquist, J.B.; Corn, A.L. Spatial and temporal limits of motion perception across variations in speed, eccentricity, and low vision. J. Vis. 2009, 9, 30. [Google Scholar] [CrossRef]
- Yan, S.; Chen, J.; Yin, X.; Zhu, Z.; Liang, Z.; Jin, H.; Li, H.; Yin, J.; Jiang, Y.; Xia, Y. The structural basis of age-related decline in global motion perception at fast and slow speeds. Neuropsychologia 2023, 183, 108507. [Google Scholar] [CrossRef] [PubMed]
- Nightingale, J.; Brown, J.M.; Hammond, B.R., Jr. The Constancy of Perceived Motion Under Different Spectral Conditions. Vision 2025, 9, 15. [Google Scholar] [CrossRef]
- Shioiri, S.; Matsumiya, K.; Tseng, C.H. Contribution of the slow motion mechanism to global motion revealed by an MAE technique. Sci. Rep. 2021, 11, 3995. [Google Scholar] [CrossRef]
- Hülsdünker, T.; Ostermann, M.; Mierau, A. The Speed of Neural Visual Motion Perception and Processing Determines the Visuomotor Reaction Time of Young Elite Table Tennis Athletes. Front. Behav. Neurosci. 2019, 13, 165. [Google Scholar] [CrossRef] [PubMed]
- Kozak, A.; Wieteska, M.; Ninghetto, M.; Szulborski, K.; Gałecki, T.; Szaflik, J.; Burnat, K. Motion-Based Acuity Task: Full Visual Field Measurement of Shape and Motion Perception. Transl. Vis. Sci. Technol. 2021, 10, 9. [Google Scholar] [CrossRef] [PubMed]
- Bach, M.; Meigen, T.; Strasburger, H. Raster-scan cathode-ray tubes for vision research-limits of resolution in space, time and intensity, and some solutions. Spat. Vis. 1997, 10, 403–414. [Google Scholar] [CrossRef] [PubMed]
- Ghodrati, M.; Morris, A.P.; Price, N.S. The (un)suitability of modern liquid crystal displays (LCDs) for vision research. Front. Psychol. 2015, 6, 303. [Google Scholar] [CrossRef]
- Ali, A.; Roy, M.; Alzahrani, H.S.; Khuu, S.K. The effect of blue light filtering lenses on speed perception. Sci. Rep. 2021, 11, 17583. [Google Scholar] [CrossRef]
- Leibowitz, H.W.; Johnson, C.A.; Isabelle, E. Peripheral Motion Detection and Refractive Error. Science 1972, 177, 1207–1208. [Google Scholar] [CrossRef]
- Hammond, B.R., Jr.; Fletcher, L.M.; Elliott, J.G. Glare disability, photostress recovery, and chromatic contrast: Relation to macular pigment and serum lutein and zeaxanthin. Investig. Ophthalmol. Vis. Sci. 2013, 54, 476–481. [Google Scholar] [CrossRef] [PubMed]
- Fotios, S.; Uttley, J.; Cheal, C. Maintaining foveal fixation during a peripheral detection task. Light. Res. Technol. 2016, 48, 898–909. [Google Scholar] [CrossRef]
- Wooten, B.R.; Hammond, B.R. Spectral absorbance and spatial distribution of macular pigment using heterochromatic flicker photometry. Optom. Vis. Sci. 2005, 82, 378–386. [Google Scholar] [CrossRef]
- Johnson, E.J.; Avendano, E.E.; Mohn, E.S.; Raman, G. The association between macular pigment optical density and visual function outcomes: A systematic review and meta-analysis. Eye 2021, 35, 1620–1628. [Google Scholar] [CrossRef]
- Harth, J.B.; Renzi-Hammond, L.M.; Hammond, B.R., Jr. A Dietary Strategy for Optimizing the Visual Range of Athletes. Exerc. Sport Sci. Rev. 2023, 51, 103–108. [Google Scholar] [CrossRef] [PubMed]
Disclaimer/Publisher’s Note: The statements, opinions and data contained in all publications are solely those of the individual author(s) and contributor(s) and not of MDPI and/or the editor(s). MDPI and/or the editor(s) disclaim responsibility for any injury to people or property resulting from any ideas, methods, instructions or products referred to in the content. |
© 2025 by the authors. Licensee MDPI, Basel, Switzerland. This article is an open access article distributed under the terms and conditions of the Creative Commons Attribution (CC BY) license (https://creativecommons.org/licenses/by/4.0/).