Article

Physicochemical Properties of Jet-A/n-Heptane/Alcohol Blends for Turboengine Applications

1
Faculty of Applied Science and Engineering, Ovidius University of Constanta, 124 Mamaia Blvd., 900527 Constanta, Romania
2
National Research and Development Institute for Gas Turbines COMOTI, 220D Iuliu Maniu, 061126 Bucharest, Romania
3
Faculty of Aerospace Engineering, Polytechnic University of Bucharest, 1-7 Polizu Street, 011061 Bucharest, Romania
*
Authors to whom correspondence should be addressed.
Inventions 2025, 10(1), 3; https://doi.org/10.3390/inventions10010003
Submission received: 4 December 2024 / Revised: 4 January 2025 / Accepted: 8 January 2025 / Published: 12 January 2025
(This article belongs to the Section Inventions and Innovation in Applied Chemistry and Physics)

Abstract

:
This work investigated the physical properties of Jet-A blended with n-heptane and various n-alcohols. The mixtures contained 10%, 20%, and 30% n-alcohols, including n-propanol, n-butanol, n-pentanol, n-hexanol, n-heptanol, and n-octanol. These alcohols are either derived from biomass or have significant potential for bio-based production. The blends were assessed against American Society for Testing and Materials (ASTM) D1655 standards for Jet-A in terms of the density, viscosity, and flash point. Additionally, the refractive index and Fourier Transform Infrared Spectroscopy (FTIR) analysis were employed to gain insights into the blend chemical composition. Density measurements for the blends fell within the ASTM specifications (0.7939 to 0.8075 g·cm−3). Viscosity measurements at −20 °C were not directly conducted due to technical limitations. However, extrapolating viscosity–temperature data suggests that the blends would meet the ASTM standard. Flash point measurements revealed that all mixtures exhibited values below the ASTM specification of 38 °C. Regression equations were developed to estimate the density, kinematic viscosity, and refractive index of the studied mixtures as a function of alcohol volume. Furthermore, a correlation study was conducted to estimate density and viscosity from refractive index measurements, given their simplicity, and minimal sample volume requirements. The R2 values for these correlations exceeded 0.99, indicating a strong relationship between the refractive index and the other properties.

1. Introduction

Energy is crucial for sustainable development, driving economic growth, improving living standards, and fulfilling basic human needs. While traditional energy sources have been prioritized, the increasing climate changes have shifted focus towards renewable energy. These strategies offer a pathway to a more sustainable and resilient energy future.
To mitigate this issue, there is increasing interest in alternative fuels, especially biofuels [1,2,3,4,5,6,7,8,9]. By transitioning to biofuels derived from renewable sources, the aviation industry can significantly reduce its carbon footprint, providing a more environmentally friendly solution [10,11]. Biofuels offer several benefits, including reducing dependence on petroleum products, significantly lowering greenhouse gas emissions, and contributing positively to climate change policies [12,13]. While biofuels offer environmental benefits, their current production costs are high, limiting their widespread adoption. However, ongoing research and technological advancements are paving the way for the development of cost-effective and sustainable biofuels. Cabrera [14] presents reviewed production methods, logistical and technological barriers, and potential for the mass implementation of these alternative fuels.
Despite rigorous testing and safety standards, the widespread adoption of biofuels in aviation requires continued research and development to optimize their performance and minimize potential risks. In this context, we provide a summary of such studies.
Yılmaz et al. [15] highlighted the potential of biofuels as a sustainable alternative to traditional aviation fuels. They emphasized the importance of rigorous testing to ensure the safety and performance of these fuels. While challenges like a low calorific value and rapid evaporation exist for alcohol-based fuels, technological advancements offer potential solutions.
Prak et al. [16] investigated the feasibility of blending alcohols with JP-5 jet fuel for use in diesel engines, aiming to reduce carbon emissions in military operations. Various alcohol blends (10%, 20%, and 30% of ethanol, propanol, butanol, pentanol, hexanol, octanol, and a methanol/octanol mixture) were tested. While most blends met military diesel fuel density specifications, their flash points were generally lower than required. Viscosities were suitable for jet fuel but not diesel fuel. A combustion analysis revealed that increasing alcohol content lengthened ignition delay, particularly for shorter-chain alcohols. Longer-chain alcohols exhibited combustion characteristics closer to pure JP-5. Overall, the study suggests that larger alcohol molecules could be more suitable for blending with JP-5 to achieve a balance between reduced emissions and engine performance.
Fevzi [11] investigated the impact of adding various alcohols (methanol, ethanol, isopropanol) and di-EGME to JP-8 jet fuel on its density, viscosity, freezing point, and ignition point. The addition of alcohols generally had minimal effects on density and viscosity, while di-EGME significantly increased both. The ignition point decreased with the addition of alcohols but increased with di-EGME. The freezing point decreased slightly with the addition of alcohols but increased with di-EGME.
In our research groups, Cican and Mirea [17] reported the use of n-butanol blended with Jet-A fuel as a sustainable aviation fuel (SAF) for turboengines. Experimental tests were conducted on various blends to assess their impact on engine performance and emissions. The results showed that n-butanol blends can improve combustion efficiency and reduce emissions compared to pure Jet-A fuel. Higher n-butanol concentrations led to better thermal efficiency and lower SO2 and CO emissions. Cican and Mirea conducted studies on bioethanol [18] and methanol [19] blends. Bioethanol blends of 5%, 10%, and 15% with Jet-A fuel were tested in a micro-turboengine, monitoring parameters like the engine speed, generated force, temperature in front of the turbine, fuel volumetric flow rate, and vibration levels measured in both axial and radial directions. Methanol blends of 10%, 20%, and 30% with kerosene were also tested, assessing combustion temperature, fuel consumption, thrust, and emission levels. While bioethanol blends showed promising results, methanol blends demonstrated stability issues at higher concentrations, particularly 30%. These findings provide valuable insights into the feasibility and limitations of utilizing bioethanol and methanol as alternative aviation fuels.
Recent studies have assessed the efficacy of pentanol as a fuel additive. Vishwanath et al. [20] investigated the impact of adding n-pentanol to Jet-A-1 fuel and found that it significantly reduced soot formation, particularly at higher concentrations. Suchocki et al. [21] explored the combustion performance of mixtures of pentanol and aviation kerosene in a GTM-140 jet engine, observing reductions in NOx and CO emissions, lower combustion chamber temperatures, and improved fuel efficiency compared to kerosene blends with other alcohols. These findings suggest that bio-alcohols like pentanol could offer a cleaner and more sustainable fuel solution for the future.
Changwen et al. [22] studied the physical properties of a ternary mixture of n-octanol, aviation kerosene, and phosphoric acid, revealing the impact of temperature and acid concentration on density and viscosity, with a notable dilution effect from aviation kerosene.
Link et al. [23] concluded that the MacCoull correlation accurately describes the viscosity–temperature dependence of both petroleum-based and synthetic kerosene fractions, with a relative deviation of less than 5%. However, extrapolating viscosity data measured above −20 °C to predict kinematic viscosity at −40 °C for kerosene cuts boiling above 200 °C resulted in underpredictions, with a maximum relative deviation of 6.6%. Furthermore, Link found that the freezing point, determined by differential scanning calorimetry, closely matched the freezing point specified in regulations. Finally, the study observed local maxima and minima in the freezing points of distillation cuts with increasing boiling points, which were attributed to the freezing point characteristics of the constituent n-alkanes. In their respective reviews, Yang et al. [24] and Raji et al. [25] highlighted the promising future of bio-jet fuels. Yang et al. emphasized the critical role of physicochemical properties, especially aromatic content, in determining fuel performance. Raji, on the other hand, focused on the potential of bio-jet fuels to reduce emissions, improve engine performance, and enhance cold-weather operations.
The present study sought to quantify significant fuel properties (the density, viscosity, refractive index, flash point, and composition of the mixtures (FTIR)) and assess their compliance with ASTM D1655 specifications. Consequently, this work presents a characterization of the density, kinematic viscosity, refractive index, and flash point for the studied mixtures. The ultimate goal is to create a database of these parameters and propose mathematical models for Jet-A + alcohol blends to predict these properties from their compositions. Refractive index measurements are straightforward, and rapid, and require minimal sample volume. Hence, a correlation study was conducted for the blends to estimate density and viscosity from refractive index measurements, thereby eliminating the need for direct density and viscosity determinations.
The main added value of this paper consists in the fact that it brings together all the most important alcohols that can be obtained from various sources and methods. Worldwide research groups are currently assessing the use of alcohols and/or other bio-fuels as sustainable aviation fuels but none of the above-mentioned studies assess so many alcohols. Therefore, the current study represents an added value to this issue (sustainable aviation fuels), which is more and more present in the field of aviation.

2. Materials and Methods

2.1. Materials

Jet-A was provided by a local company and it contained additives, making it use-ready for aviation applications. The oil used for engine lubrication was Aeroshell 500 provided by Shell Romania (Bucharest, Romania).
n-Heptane was purchased from Lach-Ner (Neratovice, Czech Republic) with a purity of ≥99%.
n-Propanol (≥99.5%) was obtained from Lach-Ner (Neratovice, Czech Republic). n-Butanol (99.5%) was purchased from Chemical SA Company (Iasi, Romania). n-Pentanol (≥99%) was provided by Honeywell SA Company (Charlotte, NC, USA). The samples of n-hexanol (98%), n-heptanol (98%), and n-octanol (≥99%) were supplied by Sigma-Aldrich. The reagents in this work were used without any purification process. The properties of the pure components are reported in Table 1.

2.2. Preparation of Mixtures

Samples of each mixture were prepared by volumetric measurement (Table 2). The estimated precision of the volume measurement is ±0.01 mL. Prior to the analysis, these mixtures were stirred to confirm their miscibility. As expected, there was no phase separation of the components. Once the mixtures were prepared, they were stored in a hermetically sealed container.

2.3. Apparatus and Procedure

An SVM 3000 digital analyzer (manufactured by Anton Paar, Graz, Austria) was used in this work to measure densities (ρ) and viscosity (ν) for samples (pure components and their corresponding ternary blends) at temperatures T = (273.15, 278.15, 283.15, 288.15, 293.15, 298.15, 303.15, 308.15, and 313.15 K) and atmospheric pressure. The maximum value of temperature was limited by the boiling point of alcohols. The temperature in the measuring cell was regulated with Peltier elements and was measured via two integrated Pt 100 platinum resistance thermometers with a precision of ±0.01 K.
Density is measured by determining the harmonic oscillation period of a U-tube filled with the sample, induced by an electromagnetic force [27]. Viscosity is measured by the efflux time of a steel ball in the liquid sample.
The accuracies of reported density and viscosity data are equivalent to ±0.0005 g·cm−3 and ±0.35%, respectively. The instrument was calibrated at atmospheric pressure with doubly distilled water and dry air. Density and viscosity measurements were conducted in accordance with the ASTM D7042 standard [28].
The flash point measurements were performed using an Automatic flash point tester Cleveland closed-cup tester. Measurement accuracy was 1 °C. The equipment was calibrated using reference liquids, as described in ASTM D92 [29].
An ABBE refractometer (Atago 2T type) was used to measure the refractive index (nD) of pure components and their mixtures. The accuracy of the refractive index in this work is ±0.0002. The Abbe refractometer was calibrated employing deionized water. A circulating water bath was used to maintain a constant temperature of 293.15 K for the samples. The bath’s water circulated through a jacket surrounding the sample container, ensuring a temperature accuracy of ±0.1 K. Refractive index measurements were realized according to the ASTM D1218/12 standard [30].
All values presented in this study are the average of three measurements, ensuring maximum precision.
The composition of the blends was analyzed using Fourier Transform Infrared Spectroscopy (FTIR) with Attenuated Total Reflectance (ATR).

2.4. Regression Equations

Regression equations have been widely employed to estimate physicochemical properties, including the density, kinematic viscosity, and refractive index, without experimental measurement.
  • Regression with composition
This work proposes equations to calculate these properties for mixtures as a function of the alcohol percentage. The regression analysis was performed to identify the best-fitting Equation (1) for the experimental data on pseudo-ternary mixtures. The experimental data for pseudo-ternary mixtures at 293.15 K were correlated as a function of the alcohol percentage in order to determine the values of regression coefficients for the polynomial equation.
y m = a v 2 + b v + c
where ym is the density of the mixture (ρm, g·cm−3), kinematic viscosity of the mixture (νm, mm2·s−1), and refractive index of the mixture (nD,m); a, b, and c are the regression coefficients; v is the alcohol percentage.
  • Regression with temperature
The density and viscosity of the mixture are correlated with temperature using linear and polynomial regression analyses.
ρ m = a T + b
ν m = a T 2 + b T + c
where ρm is density of the mixture (g·cm−3) and νm is kinematic viscosity of the mixture (mm2·s−1); a, b, and c are the regression coefficients; T is temperature (K).

2.5. Correlations Between Properties

Density and kinematic viscosity were correlated with the refractive index values obtained for the studied mixture at a temperature of 293.15 K.
  • Density correlations with refractive index
ρ m = a n D , m 2 + b n D , m + c
  • Viscosity correlations with refractive index
ν m = a n D , m 2 + b n D , m + c
where ρm is density of the mixture (g·cm−3), νm is kinematic viscosity of the mixture (mm2·s−1), and nD,m is the refractive index of the mixture; a, b, and c are the regression coefficients.

2.6. Evaluation of Equations

The accuracy of the equations was validated using the coefficient of determination (R2) calculated based on the following formula to quantify the discrepancy between experimental and calculated values.
R 2 = 1 i = 1 N J e x p , i J c a l , i 2 i = 1 N J e x p , i J c a l , i 2
where J e x p . i and J c a l . i represent the experimental and calculated values, respectively, and N is the total number of data values.
A coefficient of determination (R2) value closer to 1 indicates a stronger correlation between the predicted values and the experimental values. By selecting the model with the highest R2, we ensured that the relationship between the variables was captured as accurately as possible. This suggests that the chosen equation provides the best fit for the data among the equations considered.

3. Results and Discussion

3.1. Physical–Chemical Properties

The main characteristics of Jet-A are shown in Table 3.
The densities of the pseudo-ternary mixtures at different temperatures (273.15–313.15 K) and atmospheric pressure are presented in Table 4.
As shown in Table 4, the blends with the lowest density were those with PR10 at 313.15 K (0.7761 g·cm−3). Conversely, the blends with the highest density were those with OC30 (0.8187 g·cm−3). The density for pseudo-ternary mixtures increases with the increase in alcohol content in the mixture.
Density measurements were compared with the standard specifications, ASTM D1655 [31].
Table 3. Fuel characteristics of Jet-A.
PropertiesUnitsTest MethodASTM D1655
Limits
Jet-A
Min.Max.
Flash point°CASTM D92 [29]38-34.6
Density at 288.15 Kkg·m−3ASTM D7042 [28]775840788.7
Sulfur, mercaptan% (m/m)ASTM D3227-23 [32]-0.0030˂0.0003
Sulfur, total% (m/m)ASTM D2622-21 [33]-0.300.0003
Lower heating valueMJ/kgASTM D3338 [34]42.8-43.337
Copper corrosion-ASTM D130-19 [35]Class 11b
Distillation temperature ASTM D86-23 [36]
Initial boiling point°C --149.9
10% recovered°C -205165.9
50% recovered°C --187.8
90% recovered°C --220.5
Final boiling point°C -300239.5
Distillation residue% (m/m)ASTM D86-23 [36]-1.51.3
Table 4. The experimental density, ρ (g·cm−3), for pseudo-ternary mixtures at different temperatures and atmospheric pressure.
SampleTemperature/K
273.15278.15283.15288.15293.15298.15303.15308.15313.15
Ke0.80500.80120.79720.79390.79080.78650.78220.77850.7747
273.15278.15283.15288.15293.15298.15303.15308.15313.15
PR100.80750.80360.79970.79580.79190.78800.78410.78010.7761
PR200.80930.80530.80140.79750.79350.78950.78570.78160.7776
PR300.81140.80730.80340.79940.79540.79130.78730.78320.7794
273.15278.15283.15288.15293.15298.15303.15308.15313.15
BU100.80830.80440.80060.79670.79280.78890.78520.78120.7773
BU200.81050.80670.80280.79890.79500.79110.78720.78320.7792
BU300.81280.80920.80530.80130.79740.79340.78950.78540.7814
273.15278.15283.15288.15293.15298.15303.15308.15313.15
PE100.80910.80520.80140.79770.79380.78990.78610.78220.7783
PE200.81170.80790.80420.80040.79650.79270.78860.78490.7808
PE300.81460.81080.80700.80330.79930.79550.79140.78770.7835
273.15278.15283.15288.15293.15298.15303.15308.15313.15
HE100.80970.80570.8020.79820.79430.79040.78660.78270.7788
HE200.81250.80860.80490.80120.79720.79340.78950.78570.7818
HE300.81570.81180.8080.80450.80050.79670.79280.78910.7850
273.15278.15283.15288.15293.15298.15303.15308.15313.15
HP100.81030.80640.80260.79870.7950.7910.78720.78320.7794
HP200.81340.80950.80570.80200.79810.79420.79040.78640.7827
HP300.81710.81310.80930.80580.80190.7980.79430.79040.7865
273.15278.15283.15288.15293.15298.15303.15308.15313.15
OC100.81150.80770.80390.80010.79630.79250.78860.78480.7810
OC200.81470.81090.80720.80340.79970.79600.79190.78820.7843
OC300.81870.81490.81120.80750.80380.80000.79620.79240.7886
The densities of the mixtures, as shown in Figure 1, ranged from 0.7958 g·cm−3 to 0.8075 g·cm−3 at a temperature of 288.15 K. Considering that the standard specification for jet fuel density is mentioned at 288.15 K, these values were within the specifications.
Highly viscous aviation fuels could cause pumping difficulties, poor atomization, incomplete combustion, and in extreme cases the blocking of fuel injectors [37].
The kinematic viscosities of pseudo-ternary mixtures at different temperatures (273.15–313.15 K) and atmospheric pressure are shown in Table 5. In this study, a direct correlation was observed between the kinematic viscosity of the mixture and the carbon chain length of the alcohols. As the carbon chain length increased, so did the kinematic viscosity.
The kinematic viscosity limit, as specified in ASTM D1655, must be less than 8 mm2/s at −20 °C. The measurements could not be made for blends at −20 °C, but by applying regression equations with temperature obtained in this study, their kinematic viscosity will be in line with the standard because viscosities of blends increase with decreasing temperature. Link et al. [23] estimated the viscosity at −40 °C using MacCoull’s equation. They reported good accuracy for the estimated viscosity (within 5%). While extrapolation to −40 °C from measurements at or above −20 °C showed a maximum 6.6% difference, exceeding the experimental reproducibility of 2.1%, it carries inherent risks of bias.
Including the flash point, a critical measure of a fuel is volatility, directly impacting its flammability risk during storage and transport. It represents the lower temperature at which the vapors of a liquid ignite in the presence of a flame. Higher flash points signify reduced ignition risk, enhancing safety during handling, storage, and transportation. As outlined in ASTM D92 [29], the minimum flash point temperature for Jet-A fuel is 38 °C. However, as illustrated in Figure 2, the measured flash point values fell below the values registered for Ke alone. As defined in Table 2, Ke is actually a mixture between Jet-A aviation fuel and 5% Aeroshelll 500 oil. The obtained results are due to the fact that 5% heptane was added to Ke; therefore, having a flash point of −4 °C, it is the first component of the mixture that evaporates. The decision to introduce heptane into these mixtures was made due to its high LHV (lower heat value, 44.566 MJ/kg) [38].
As it can be observed from Figure 2, the flash point values for n-hexane and n-heptane are the closest to the value of Jet-A aviation fuel. This aspect makes them, from this point of view, the most suitable ones to be used for sustainable aviation fuel blends.
Indeed, for increasing the flash point, there are some solutions on the market consisting of adding some additives into the mixture to increase the flash point, but adding other substances in the blends will negatively impact the combustion process in the combustion chamber, which may lead to poor engine performances and/or increased gaseous pollutant emissions.
Although not a mentioned parameter in standard specifications, the refractive index can influence engine performance. The refractive index of the fuel blends under investigation varied slightly from the reference Ke (1.4366) fuel value, as illustrated in Table 6.
Of the mixtures examined, OC10 displayed the highest refractive index at 293.15 K (1.4350), whereas PR30 exhibited the lowest (1.4240). It is worth noting that there is a lack of literature data on these particular blends.
Following the blending of various alcohols with Ke, the resulting compositions were characterized using Fourier Transform Infrared Spectroscopy with Attenuated Total Reflectance (FTIR-ATR) and refractive index measurements (Figure 3 and Figure 4).
As it can be observed, (−OH) absorption occurs between 3650 and 3150 cm−1 and as the alcohol number of carbon atoms increases, the absorbance decreases. This is due to the fact that more carbon atoms are interfering with the adsorption process. Nevertheless, the presence of oxygen within the structure of the blends should translate into a better combustion process, since the fuel requires less air to burn and uses its internal oxygen. Another important difference is shown between 2850 and 3000 cm−1 where saturated systems (alkanes) show activity, and as the number of carbon atoms within the alcohol structure increases, the absorbance increases too. At 1450 cm−1, the presence of methylene groups (−CH2) is showing a slight increase as the number of carbon atoms of the alcohol increases since more and more (−CH2) groups are present in the structure. Another large difference is shown at 1000 cm−1, representing the C−OH bond. As in the case of –OH, as the number of carbon atoms of the alcohol increases, C−OH increases.
As it can be observed in Figure 3, the −OH concentration increases as the number of carbon atoms within the alcohol decreases. This is due to the fact that low-carbon-atom alcohols are bringing into the blend more and more oxygen reporting to carbon atoms, which is actively participating in the burning reaction. Also, as the −OH concentration increases, the needed air for the stoichiometric reaction decreases; thus, the burning is more efficient, leading to the formation of CO rather than CO2. Also, since, outside, less air is needed for the stoichiometric reaction, the nitrogen from the air is less and this can lead to a decrease in NOx formation. It is well known that the formations of CO and NOx are temperature-dependent; therefore, as the less air is brought into the combustion reaction, the less CO and NOx are formed due to the fact that combustion temperature does not decrease.
Compared to methanol and ethanol, alcohols with a higher number of carbon atoms exhibit a more complex oxidation process, characterized by the production of a greater number of intermediates and lower volatility, which negatively impacts the air–fuel mixture. The evaporation properties, influenced by higher boiling points, contribute to variations in combustion efficiency, potentially leading to increased CO formation under incomplete combustion conditions. However, due to the higher internal oxygen concentration relative to carbon, short-chain alcohols remain more efficient in reducing NOx emissions and maintaining more complete combustion.
Nevertheless, the presence of alcohols (short or long chain) in the fuel mixture will lead to improvements regarding gaseous pollution emissions compared to Jet-A1 alone. As specified, the presence of oxygen in the inner chemical structure of the fuel mixture will lead to a decrease in needed air for the combustion process.
Considering the above-mentioned aspects, the first conclusion that may occur is that low-carbon-atom alcohols are more efficient in terms of the combustion process and gaseous emissions (CO and NOx).
As it can be assessed, the hydroxy (-OH) bond occurs within the mixture between 3650 and 3150 cm−1 and as the alcohol concentration increases, the absorbance also increases. This is due to the fact that more and more -OH bonds are brought into the mixture by the alcohol. This should translate into a better combustion of the blend due to the fact that self-contained oxygen is helping the combustion process; therefore, les air is needed, leading to a decrease in NOx formation. Another important modification appears at 1750 cm−1, representing the present oxygen bonded by a C atom (C-O). At 1450 cm−1, the presence of methylene groups (-CH2) is showing a slight decrease compared with Ke. The radiation absorbed at 1350 cm−1 is showing an increase in methyl groups (–CH3). Another large difference is shown at 1000 cm−1, representing the C-OH bond. As in the case of –OH, as the concentration of the alcohol increases, C-OH increases.

3.2. Regression Equations

  • Regression with composition
It should be noted that for the studied system, three parameters were required for properties’ correlation. The fitting coefficients from Equation (1), used to calculate the density, kinematic viscosity, and refractive index of mixtures, are presented in Table 7. The correlation between properties and composition, given by the empirical equation, is very good, with R2 > 0.996 for density, R2 > 0.934 for viscosity, and R2 > 0.995 for the refractive index. As shown in the table, the properties derived from the polynomial equations exhibit high R2 values (coefficient of determination), exceeding 0.987. Only PR is a bit weaker, with an R2 of 0.9347.
  • Regression with temperature
The regression coefficients, a and b from Equation (2) and a, b, and c from Equation (3), were calculated using the coefficient of determination, R2. These results are presented in Table 8. A strong correlation between properties and temperature was observed for both linear and polynomial models. The coefficient of determination (R2) exceeded 0.999 for density and 0.997 for viscosity, respectively.

3.3. Correlations Between Properties

  • Density Correlations with refractive index
Figure 5 illustrates the correlation between the density and refractive index for the studied pseudo-ternary mixtures. The figure includes the correlation equations and coefficients of determination (R2) for each mixture. As observed, all correlations are polynomial, enabling the rapid estimation of density from the refractive index for any composition of the Ke/alcohol mixture. It is evident that the density of mixtures decreases as the refractive index increases. R2 values exceed 0.99 for all mixtures. The point corresponding to pure Ke is consistent across all correlations. However, the points for each n-alcohol diverge, aligning with the values presented in Table 4 and Table 7.
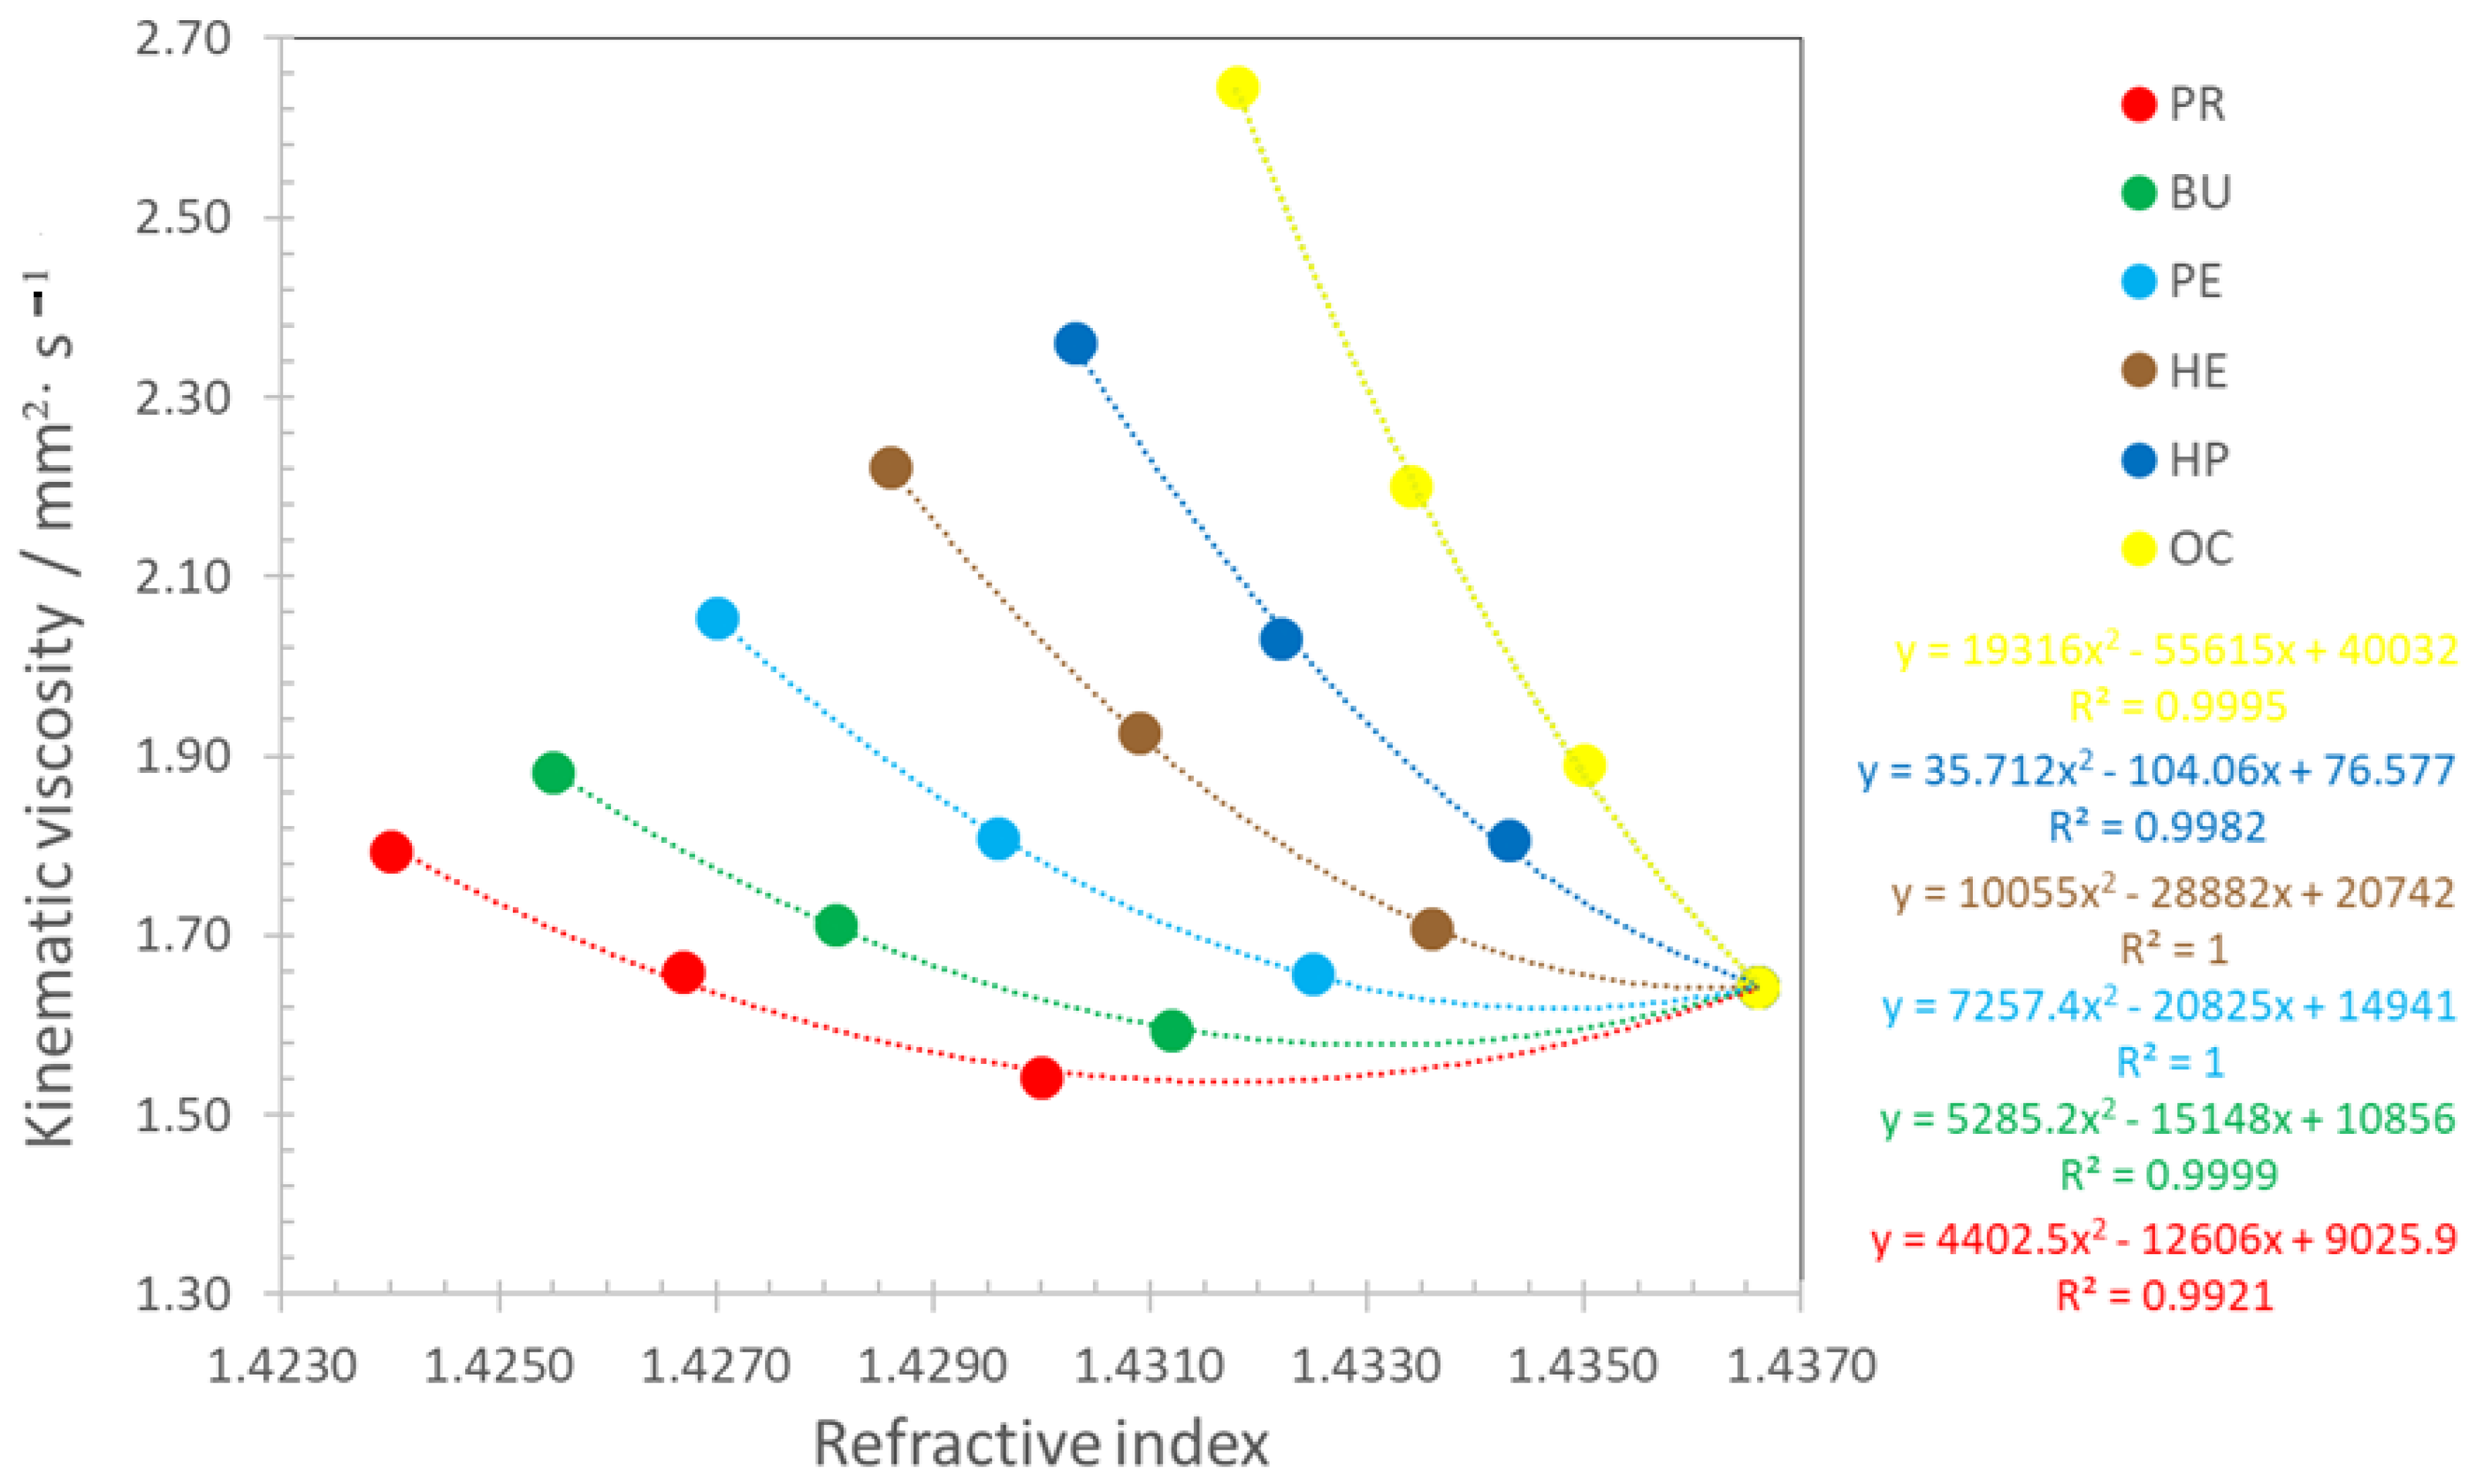
  • Viscosity Correlations with refractive index
Figure 6 presents the correlation between the viscosity and refractive index for the pseudo-ternary mixtures. Similarly to the density correlations, the figure includes the correlation equations and R2 values. Again, all correlations are polynomial, allowing the rapid estimation of viscosity from the refractive index. It is evident that the viscosity of mixtures decreases as the refractive index increases. R2 values exceed 0.99. The point corresponding to pure Ke remains consistent across all correlations. The points for each n-alcohol, while close in the absolute value, follow the values presented in Table 5 and Table 7.

4. Conclusions

This study comprehensively investigates the physicochemical properties of Jet-A fuel blended with various alcohols (n-propanol, n-butanol, n-pentanol, n-hexanol, n-heptanol, and n-octanol) at different concentrations. The primary focus lies on the impact of these blends on the density, kinematic viscosity, refractive index, and flash point.
The density and viscosity of the blends generally increase with increasing alcohol concentration and carbon chain length. However, these properties remain within acceptable limits for aviation fuel applications.
Refractive index measurements provide a rapid and non-destructive method to estimate density and viscosity. Strong correlations were observed between these properties and the refractive index, enabling accurate predictions.
The addition of alcohols reduces the flash point of the blends, potentially compromising safety during handling and storage. Further research is needed to address this issue.
FTIR Analysis: The FTIR analysis confirmed the presence of alcohol functional groups in the blends, indicating successful blending.
While these blends offer potential advantages in terms of combustion efficiency and reduced emissions, careful consideration must be given to their impact on fuel properties, particularly the flash point. Further research is necessary to optimize blend compositions and develop strategies to mitigate potential safety concerns.
Overall, this study provides valuable insights into the behavior of alcohol-blended Jet-A fuels, contributing to the development of sustainable aviation fuels.
Future works will focus on several key aspects such as the determination of the freezing point for the blends in order to assess their usability for low-temperature applications (e.g., upper atmosphere flights), the elemental analysis of the blends in order to assess the percentages among O:C:H, the theoretical calculation of the combustion reactions based on the elemental analysis, and the most important aspect: the burning of these blends in a turboengine and assessing the impact of adding alcohols to both the engine’s performances and gaseous emissions.

Author Contributions

Conceptualization, S.O. and G.C.; methodology, L.C.; software, S.O. and R.M.; validation, G.C. and S.O.; writing—original draft preparation, S.O., G.C., L.C. and R.M.; writing—review and editing, S.O., G.C., L.C. and R.M. All authors have read and agreed to the published version of the manuscript.

Funding

This research received no external funding.

Data Availability Statement

All data are in the article.

Conflicts of Interest

The authors declare no conflicts of interest.

References

  1. Peeters, P.M.; Eijgelaar, E. Tourism’s climate mitigation dilemma: Flying between rich and poor countries. Tour. Manag. 2014, 40, 15–26. [Google Scholar] [CrossRef]
  2. Luning Prak, D.J.; Hope Jones, M.; Trulove, P.; Dickerson, T.; Jim, S. Cowart Physical and Chemical Analysis of Alcohol-to-Jet (ATJ) Fuel and Development of Surrogate Fuel Mixtures. Energy Fuels 2015, 29, 3760–3769. [Google Scholar] [CrossRef]
  3. Landera, A.; Bambha, R.P.; Hao, N.; Puneet, D.S.; Moore, C.M.; Sutton, A.D.; George, A. Building Structure-Property Relationships of Cycloalkanes in Support of Their Use in Sustainable Aviation Fuels. Front. Energy Res. 2022, 9, 771697. [Google Scholar] [CrossRef]
  4. Yao, G.; Staples, M.D.; Malina, R.; Wallace Tyner, E. Stochastic techno-economic analysis of alcohol-to-jet fuel production. Biotechnol. Biofuels 2017, 10, 17. [Google Scholar] [CrossRef]
  5. Pires, A.; Han, Y.; Kramlich, J.; Garcia-Perez, M. Chemical Composition and Fuel Properties of alternative Jet Fuels. BioResources 2018, 13, 2632–2657. [Google Scholar] [CrossRef]
  6. Cican, G.; Deaconu, M.; Mirea, R.; Ceatra, L.; Cretu, M.; Dobre, T. Investigating the Use of Recycled Pork Fat-Based Biodiesel in Aviation Turbo Engines. Processes 2020, 8, 1196. [Google Scholar] [CrossRef]
  7. Mirea, R.; Cican, G. Lab Scale Investigation of Gaseous Emissions, Performance and Stability of an Aviation Turbo-Engine While Running on Biodiesel Based Sustainable Aviation Fuel. Inventions 2024, 9, 16. [Google Scholar] [CrossRef]
  8. Cican, G.; Crunteanu, D.E.; Mirea, R.; Ceatra, L.C.; Leventiu, C. Biodiesel from Recycled Sunflower and Palm Oil—A Sustainable Fuel for Microturbo-Engines Used in Airside Applications. Sustainability 2023, 15, 2079. [Google Scholar] [CrossRef]
  9. Yilmaz, N.; Atmanli, A. Sustainable alternative fuels in aviation. Energy 2017, 140, 1378–1386. [Google Scholar] [CrossRef]
  10. Graver, B.; Zheng, X.S.; Daniel, R.; Mukhopadhaya, J.; Pronk, E. Vision 2050 Aligning Aviation with the Paris Agreement; International Council on Clean Transportation: Washington, DC, USA, 2022. [Google Scholar]
  11. Yaşar, F. Investigation of the Effects of Alcohol and Anti-Icing Additives on the Properties of Jet Fuel. J. Turk. Chem. Soc. Sect. A Chem. 2024, 11, 945–958. [Google Scholar] [CrossRef]
  12. Prussi, M.; O’Connell, A.; Lonza, L. Analysis of current aviation biofuel technical production potential in EU28. Biomass Bioenergy 2019, 130, 105371. [Google Scholar] [CrossRef]
  13. Mohsin, R.; Kumar, T.; Majid, Z.A.; Kumar, I.; Wash, M.A. Assessment of Usage of Biofuel in Aviation Industry in Malaysia. Chem. Eng. Trans. 2017, 56, 277–282. [Google Scholar] [CrossRef]
  14. Cabrera, E.; Melo de Sousa, J.M. Use of Sustainable Fuels in Aviation—A Review. Energies 2022, 15, 2440. [Google Scholar] [CrossRef]
  15. Yilmaz, N.; Atmanli, A. Investigation of Alternative Fuel Utilization in Aviation. J. Sustain. Aviat. Res. 2016, 1, 3–10. [Google Scholar]
  16. Prak, D.L.; Cowart, J. Physical properties and diesel engine combustion of blends of alcohols with military jet fuel JP-5. Fuel 2024, 371, 132070. [Google Scholar] [CrossRef]
  17. Cican, G.; Mirea, R. An Experimental Insight into the Use of N-Butanol as a Sustainable Aviation Fuel. Fire 2024, 7, 313. [Google Scholar] [CrossRef]
  18. Cican, G.; Deaconu, M.; Mirea, R.; Cucuruz, A.T. Influence of Bioethanol Blends on Performances of a Micro Turbojet Engine. Rev. Chim. 2020, 71, 229–238. [Google Scholar] [CrossRef]
  19. Cican, G.; Mirea, R.; Rimbu, G. Experimental Evaluation of Methanol/Jet-A Blends as Sustainable Aviation Fuels for Turbo-Engines: Performance and Environmental Impact Analysis. Fire 2024, 7, 155. [Google Scholar] [CrossRef]
  20. Vishwanath, R.B.; Carniglia, P.A.; Weber, J.K.; Gülder, Ö.L. Effects of n-pentanol blending on soot formation in swirl-stabilized turbulent spray flames of Jet A-1 in a laboratory gas turbine combustor. Fuel 2024, 357, 129971. [Google Scholar] [CrossRef]
  21. Suchocki, T.; Kazimierski, P.; Lampart, P.; Januszewicz, K.; Białecki, T.; Gawron, B.; Janicka, A. A comparative study of pentanol (C5 alcohol) and kerosene blends in terms of gas turbine engine performance and exhaust gas emission. Fuel 2023, 334, 126741. [Google Scholar] [CrossRef]
  22. Yea, C.; Pei, X.; Liu, J.C. Measurement and Modeling of Density and Viscosity of n-Octanol–Kerosene–Phosphoric Acid Solutions in a Temperature Range 293.15–333.15 K. Russ. J. Phys. Chem. A 2016, 90, 2397–2401. [Google Scholar] [CrossRef]
  23. Link, F.; Klerk, A. Viscosity and Density of Narrow Distillation Cuts from Refined Petroleum- and Synthetic-Derived Distillates in the −60 to +60 °C Range. Energy Fuels 2022, 36, 12563–12579. [Google Scholar] [CrossRef]
  24. Yang, J.; Xin, Z.; He, Q.S.; Corscadden, K.; Niu, H. An overview on performance characteristics of bio-jet fuels. Fuel 2019, 237, 916–936. [Google Scholar] [CrossRef]
  25. Raji, A.M.; Manescau, B.; Chetehouna, K.; Ango, S.E.; Ogabi, R. Performance and spray characteristics of fossil JET A-1 and bioJET fuel: A comprehensive review. Renew. Sustain. Energy Rev. 2025, 207, 114970. [Google Scholar] [CrossRef]
  26. Yesilyurt, M.K. A detailed investigation on the performance, combustion, and exhaust emission characteristics of a diesel engine running on the blend of diesel fuel, biodiesel and 1-heptanol (C7 alcohol) as a next-generation higher alcohol. Fuel 2020, 275, 117893. [Google Scholar] [CrossRef]
  27. Cano-Gómez, J.J.; Iglesias-Silva, G.A.; Rivas, P.; Díaz-Ovalle, C.O.; Cerino-Córdova, F.D.J. Densities and viscosities for binary liquid mixtures of biodiesel + 1–butanol, + isobutyl alcohol, or + 2–butanol from 293.15 to 333.15 K at 0.1 MPa. J. Chem. Eng. Data 2017, 62, 3391–3400. [Google Scholar] [CrossRef]
  28. ASTM-D7042; Standard Test Method for Dynamic Viscosity and Density of Liquids by Stabinger Viscometer (and the Calculation of Kinematic Viscosity. ASTM—American Society for Testing and Materials: West Conshohocken, PA, USA, 2021.
  29. ASTM D92-05a; Standard Test Method for Flash and Fire Points by Cleveland Open Cup Tester. ASTM—American Society for Testing and Materials: West Conshohocken, PA, USA, 2009.
  30. ASTM D1218-12; Standard Test Method for Refractive Index and Refractive Dispersion of Hydrocarbon Liquids. ASTM—American Society for Testing and Materials: West Conshohocken, PA, USA, 2012.
  31. ASTM D1655-22a; Standard Specification for Aviation Turbine Fuels. ASTM—American Society for Testing and Materials: West Conshohocken, PA, USA, 2022.
  32. ASTM D3227-23; Standard Test Method for (Thiol Mercaptan) Sulfur in Gasoline, Kerosine, Aviation Turbine, and Distillate Fuels (Potentiometric Method). ASTM—American Society for Testing and Materials: West Conshohocken, PA, USA, 2023.
  33. ASTM D2622-21; Standard Test Method for Sulfur in Petroleum Products by Wavelength Dispersive X-Ray Fluorescence Spectrometry. ASTM—American Society for Testing and Materials: West Conshohocken, PA, USA, 2021.
  34. ASTM D3338/D3338M-20a; Standard Test Method for Estimation of Net Heat of Combustion of Aviation Fuels. ASTM—American Society for Testing and Materials: West Conshohocken, PA, USA, 2020.
  35. ASTM D130-19; Standard Test Method for Corrosiveness to Copper from Petroleum Products by Copper Strip Test. ASTM—American Society for Testing and Materials: West Conshohocken, PA, USA, 2019.
  36. ASTM D86-23; Standard Test Method for Distillation of Petroleum Products and Liquid Fuels at Atmospheric Pressure. ASTM—American Society for Testing and Materials: West Conshohocken, PA, USA, 2023.
  37. Chuck, C.J.; Donnelly, J. The compatibility of potential bioderived fuels with Jet A-1 aviation kerosene. Appl. Energy 2014, 118, 83–91. [Google Scholar] [CrossRef]
  38. Qian, Y.; Wang, X.; Zhu, L.; Lu, X. Experimental studies on combustion and emissions of RCCI (reactivity controlled compression ignition) with gasoline/n-heptane and ethanol/n-heptane as fuels. Energy 2015, 88, 584–594. [Google Scholar] [CrossRef]
Figure 1. The comparison of density at 288.15 K of mixtures as a function of volume alcohol % with the ASTM D1655 standard limits for the density.
Inventions 10 00003 g001
Figure 2. The variation in the flash point vs. alcohol concentration.
Inventions 10 00003 g002
Figure 3. The above figure is showing the spectra of pure Ke (black) (Ke is defined as pure kerosene +5% Aeroshell 500), PR10 (red), BU10 (green), PE10 (light blue), HE10 (brown), HP10 (dark blue), and OC10 (yellow).
Inventions 10 00003 g003
Figure 4. The above-shown picture is showing the differences between the fuels as the concentration of hexanol is increasing from 10 to 30% compared to Ke (Ke is defined as pure kerosene +5% Aeroshell 500). Thus, Ke (black) is used as a reference and HX10 (green), HX20 (red), and HX30 (dark blue) are compared.
Inventions 10 00003 g004
Figure 5. Correlation between density and refractive index for PR, BU, PE, HE, HP, and OC; • experimental values; − calculated values with Equation (4).
Inventions 10 00003 g005
Figure 6. Correlation between kinematic viscosity and refractive index for PR, BU, PE, HE, HP, and OC; • experimental values; − calculated values with Equation (5).
Inventions 10 00003 g006
Table 1. Properties of various alcohols [26].
PropertiesUnitPropanolButanolPentanolHexanolHeptanolOctanol
Chemical formula-C3H7OHC4H9OHC5H11OHC6H13OHC7H15OHC8H17OH
CAS 71-23-871-36-371-41-0111-27-3111-70-6111-87-5
Purity%≥99.599.5≥999898≥99
Molecular weightg·mol−160.1074.1288.15102.18116.20130.23
Carbonwt. %59.96 64.8268.1370.5272.1673.72
Hydrogenwt. %13.3113.4913.6113.7013.7113.82
Oxygenwt. %26.6221.5918.1515.7014.1312.29
Densityg·cm−30.80370.80970.81480.82180.81800.8270
Boiling point°C97117138157-195
Self-ignition temperature°C350345300285275270
Lower heating valueMJ·kg−129.8232.0132.1639.1039.9252.94
Latent heat of vaporizationkJ·kg−1727.88585.40308.05486574.95
Table 2. Volume composition of prepared ternary mixtures.
Sample
Name
Jet-A
(%)
Aeroshell (%)Heptane (%)Propanol (%)Butanol (%)Pentanol (%)Hexanol
(%)
Heptanol
(%)
Octanol (%)
Ke955-------
PR10805510-----
PR20705520-----
PR 30605530-----
BU108055-10----
BU207055-20----
BU306055-30----
PE108055--10---
PE207055--20---
PE306055--30---
HE108055---10--
HE207055---20--
HE306055---30--
HP108055----10-
HP207055----20-
HP306055----30-
OC108055-----10
OC207055-----20
OC306055-----30
Table 5. The experimental kinematic viscosity, ν (mm2·s−1), for pseudo-ternary mixtures at different temperatures and atmospheric pressure.
SampleTemperature/K
273.15278.15283.15288.15293.15298.15303.15308.15313.15
Ke2.36992.15931.96561.78921.64311.50401.39371.29911.2082
273.15278.15283.15288.15293.15298.15303.15308.15313.15
PR102.24452.02711.84191.68181.54171.41721.30901.21231.1259
PR202.47192.20551.99201.80931.66051.51741.39501.28761.1915
PR302.76332.46182.20411.98531.79421.63141.48961.37411.2628
273.15278.15283.15288.15293.15298.15303.15308.15313.15
BU102.33232.09671.90551.73971.59571.46741.33871.23901.1496
BU202.55102.29462.06991.88101.71151.56821.44091.32831.2224
BU302.89892.58412.29092.07921.88211.71011.56151.43051.3155
273.15278.15283.15288.15293.15298.15303.15308.15313.15
PE102.41632.18831.98221.81231.65671.52451.40601.30271.2075
PE202.71282.43652.19561.98561.80961.65551.52031.40161.2958
PE303.22542.84282.53562.27132.05531.86341.70031.56041.4297
273.15278.15283.15288.15293.15298.15303.15308.15313.15
HE102.51052.26832.05241.86841.70801.56821.44751.33761.2408
HE202.90722.65442.34552.12621.92571.75731.6361.48921.3791
HE303.48603.07472.74682.46072.22212.04561.85471.68531.5480
273.15278.15283.15288.15293.15298.15303.15308.15313.15
HP102.66812.35962.11581.92381.80611.60841.48851.37131.2718
HP203.14682.7442.46422.22262.03221.86211.68851.54981.4263
HP303.75443.32062.94772.63392.36162.14681.94731.80061.6243
273.15278.15283.15288.15293.15298.15303.15308.15313.15
OC102.86192.56832.31092.09071.89041.73181.58921.46281.3507
OC203.55803.10472.72722.46632.20042.01271.84401.69781.5675
OC304.27703.76433.32542.95692.64552.39072.16661.96971.7968
Table 6. The experimental refractive index (nD) for pseudo-ternary mixtures at 293.15 K and atmospheric pressure.
SamplenDSamplenDSamplenDSamplenDSamplenDSamplenD
PR101.4300BU101.4312PE101.4325HE101.4336HP101.4343OC101.4350
PR201.4267BU201.4281PE201.4296HE201.4309HP201.4322OC201.4334
PR301.4240BU301.4255PE301.4270HE301.4286HP301.4303OC301.4318
Table 7. Regression coefficients and R2 values for Equation (1).
PropertyMixturesRegression CoefficientsR2
abc
Density at 293.15 K (g·cm−3)PR3 × 10−65 × 10−50.79120.9983
BU2 × 10−60.00010.79120.9996
PE5 × 10−70.00030.79121.0000
HE5 × 10−70.00030.79120.9996
HP−3 × 10−180.00040.79130.9984
OC−2 × 10−60.00050.79130.9966
Kinematic viscosity at 293.15 K (mm2·s−1)PR0.0006−0.01191.63280.9347
BU0.0005−0.00801.63770.9875
PE0.0006−0.00351.64080.9990
HE0.00060.00221.63940.9987
HP0.00040.01131.64510.9997
OC0.00050.01831.64670.9995
Refractive index at 293.15 KPR0.0975−0.07031.43650.9959
BU0.0700−0.05741.43650.9976
PE0.0375−0.04291.43660.9992
HE0.0175−0.03191.43661.0000
HP0.0100−0.02401.43661.0000
OC−6 × 10⁻¹⁴−0.01601.43661.0000
PR, BU, PE, HE, HP, OC—for all alcohol mixtures; for example, BU represents BU10, BU20, and BU30.
Table 8. Regression coefficients and R2 values for Equations (2) and (3).
SampleDensityKinematic Viscosity
Regression Coefficients Regression Coefficients
abR2abcR2
Ke−0.00080.80500.99960.0004−0.04392.36830.9999
PR10−0.00080.80751.00000.0004−0.04192.23420.9996
PR20−0.00080.80931.00000.0004−0.04882.45240.9991
PR30−0.00080.81141.00000.0005−0.05882.74960.9996
BU10−0.0008 0.80831.00000.0004−0.04372.31770.9994
BU20−0.0008 0.81061.00000.0004−0.05002.53920.9996
BU30−0.0008 0.81310.99990.0006−0.06162.88100.9991
PE10−0.00080.80911.00000.0004−0.04532.40760.9997
PE20−0.00080.81180.99990.0005−0.05442.70130.9996
PE30−0.00080.81470.99980.0007 −0.07123.19920.9991
HE10−0.00080.80971.00000.0004 −0.04812.50130.9997
HE20−0.00080.81250.99990.0005 −0.05992.91190.9989
HE30−0.0008 0.81570.99990.0007−0.07553.45420.9986
HP10−0.00080.81031.00000.0005 −0.05352.63610.9970
HP20−0.00080.81341.00000.0006 −0.0669 3.1009 0.9973
HP30−0.00080.81700.99990.0008−0.08443.73180.9991
OC10−0.0008 0.81151.00000.0005 −0.05832.85130.9997
OC20−0.00080.81480.99990.0009−0.08343.51950.9981
OC30−0.0008 0.81871.00000.0010−0.09954.24960.9993
Disclaimer/Publisher’s Note: The statements, opinions and data contained in all publications are solely those of the individual author(s) and contributor(s) and not of MDPI and/or the editor(s). MDPI and/or the editor(s) disclaim responsibility for any injury to people or property resulting from any ideas, methods, instructions or products referred to in the content.

