1. Introduction
Over the past twenty years, various kinds of indoor navigation systems have been developed based upon different theories and equipment [
1]. These days, mobile communications technology has caused mobile devices to become nearly ubiquitous because they are multi-functional, easy to carry and are no longer very expensive. They have changed our lives in substantial ways. There are many brands of competing smartphones, using a wide variety of internal micro-electro mechanical system (MEMS) sensors, which are the basic components of indoor navigation technologies, such as Global Navigation Satellite System (GNSS) chips, accelerometers, gyroscopes, magnetometers, barometers, Bluetooth chips, and Wi-Fi chips. This makes the smartphone a potentially ideal mobile navigator. Liu et al. propose a smartphone indoor positioning engine that only uses the built-in sensor and computational resources [
2]. Though the accuracy of such MEMS-grade sensors leaves much to be desired, thanks to constant technological innovation, no one doubts that smaller size and better performance could be expected in the near future.
The Pedestrian Dead Reckoning (PDR) has been extensively studied as an effective approach for estimating two-dimensional position for pedestrian navigation. It uses inertial sensors to detect human movement patterns, noting each step and estimating heading direction. However, unavoidable errors crept in due to the algorithm itself as well as the hardware sensors. MEMS sensors are often not very accurate, humans frequently alter speed, posture, and direction, and there is no fixed relationship between the sensors in the device and the human body. In addition, possible errors in step-count caused by an inadequately tuned threshold are hard to avoid due to inconsistencies in the behavior of the user. For example, when the threshold peak detection is used along with time interval, lower energy and duration may fail to detect the user’s steps [
3], which lead to an accumulated position error. This problem is compounded because empirical formulas for estimating stride generally fail to accurately estimate users’ step-length because of various individual characteristics and walking habits. In an attempt to overcome this problem, Ho et al. have proposed an adaptive step-length estimator based on a fast Fourier transform smoother and a set of rules to estimate step length accurately [
4]. In addition, some advance methods of detecting steps and estimating their length accurately, such as waist-attached accelerometers [
5] and knee-attached gyroscope [
6]. Although these devices can measure movement much more accurately than other methods, to function correctly, the sensors need to be mounted on specific parts of the body, which general users will not be willing to do. In addition to the above errors, there is still another error source: heading (azimuth). Magnetometers and gyros are able to provide magnetic heading and angular rate, respectively, and the derived heading from a magnetometer is based upon the measurement of the Earth’s magnetic field, so no errors will accumulate with time. However, the measured magnetic field will be significantly affected by the ambient indoor environment, including magnetic materials and obstacles that interrupt smooth readings and can even block them completely [
7]. Gyroscopes, on the other hand, are relatively environment-independent sensors. Their measurement will not be affected by environmental conditions the way magnetometers can be. However, the nature of gyros causes them to require an initial heading, and their errors accumulate with time.
As stated in the previous paragraph, PDR errors accumulate step-by-step because of inaccurate step count, step length and heading estimates. In order to maintain navigational accuracy, a PDR integrated with another external positioning system is needed. Indoor RF-based localization can be considered as the external positioning system for PDR because Bluetooth and Wi-Fi chips are generally embedded in smartphones. The RF-based localization systems commonly used for indoor positioning include Wi-Fi, RFID and Bluetooth. In most studies the received signal strength index (RSSI) has been used as the main measurement to navigate an indoor environment. Mohammadi and Boonsriwai et al. all used signal strength to locate a pedestrian in indoor environments [
8,
9]. Because of the wide signal area, Wi-Fi based indoor positioning system are also employed. Fingerprinting, the pattern matching algorithm commonly used for Wi-Fi positioning, uses signal power strength to estimate position. The deployment of the fingerprinting method involves both a training and positioning phase. In the training step, signal power strength data (the location fingerprint) are collected and saved to a database. In the positioning step, the user’s signal power strength is compared to the values stored in the database, after which the algorithm compares the real-time measurement to the fingerprints obtained in training and determines a position that best fits the fingerprints. Although a Wi-Fi installation has a broad coverage, the location of the Wi-Fi service is limited by the availability of a power supply. Other disadvantages are volume, a lack of privacy, and the distribution geometry. On the other hand, the newest version is Bluetooth 4.0, which includes Bluetooth Low-Energy (BLE) technology. Traditional Bluetooth has a significantly long scan time, which limits its value for localization. However, BLE has overcome the limitations of a long scan time and is supported by most current smartphones. In addition, BLE beacons also have the following advantages: lower power consumption (usually battery powered), low cost, lower air data rate, small size, and light weight. Faragher et al. analyzed the accuracy of WiFi and BLE fingerprinting in a large indoor space with a highly accurate ultrasonic ground truth referencing system [
10]. Zhuan et al. propose an algorithm comprised of PDR and BLE beacons to improve stable performance [
11].
Activity recognition has been developed to obtain contextual information that characterizes the situation of the user, such as activity, location, preferences, and operating environment [
12]. Contextual information can be adapted to the operation environment and provides useful information to the system without user intervention. As previously mentioned, human movement, variations in device placement, and the relation between the sensor body frame and the pedestrian frame not being fixed can all lead to additional errors. Thus, reconstruction of relative relations is significant in this study. The accelerometer is one of the most commonly used sensors for activity recognition. Kern et al. used a wired and wearable accelerometer to collect contextual information of subjects sitting, standing, walking, etc. [
13]. However, a wired sensor is quite impractical for general use with a mobile device. Moschetti et al. developed a system using wearable hand and wrist sensors that recognizes nine different daily activities based on gestures [
14]. Though most of the studies have use accelerometers, some have made use of other sensors. Lara et al. used several inertial sensors, such as accelerometers and gyroscopes, to classify gestures such as eating and drinking [
15]. Altun et al. even used the intensity of the earth’s magnetic force in relation to a magnetometer as support for activity recognition. Fortunately, smartphones generally contain such embedded hardware [
16].
Though there are several algorithms for pedestrian navigation that can significantly improve navigation accuracy, these approaches generally require inconvenient preparation or have additional limitations. The main objective of this study is the development of an application that uses low cost MEMS sensors found in typical smartphones for pedestrian navigation. The proposed PNS is based on PDR, activity recognition, and RF-based localization.
2. Materials and Methods
2.1. System Calibration
Compensating for errors and making correct calibrations are always key steps for inertial sensors. MEMS inertial sensor errors are often changeable and unstable, but the preliminary analysis of errors is still valuable for performance verification and compensation [
17]. Accelerometers and gyroscopes have their own errors, including deterministic errors and random errors. Deterministic errors include biases, scale factors and non-orthogonality. The following equations are for measurements from gyros and accelerometers [
18]:
All of these variables are directly linked to the gyroscope and accelerometer:
and
are the measurements;
and
are the corrected measurements;
and
are the bias;
and
are the scale factor;
and
are the non-orthogonality;
and
are the noise; and
is the deviation from theoretical gravity.
The influences of deterministic errors are usually larger than random errors that are determined by calibration and then removed from the raw measurements. The six-position method calibrates those deterministic errors easily. The basic idea is to use symmetrical positions to get the bias by eliminating the reference value; the scale factor can also be obtain from the ratio with respect to the reference value. The equations for solving the bias and scale factor error are given below [
17]:
Where
is the bias;
is the scale factor error;
is the measurement of the upward axis;
is the measurement of the downward axis; and
is the reference value.
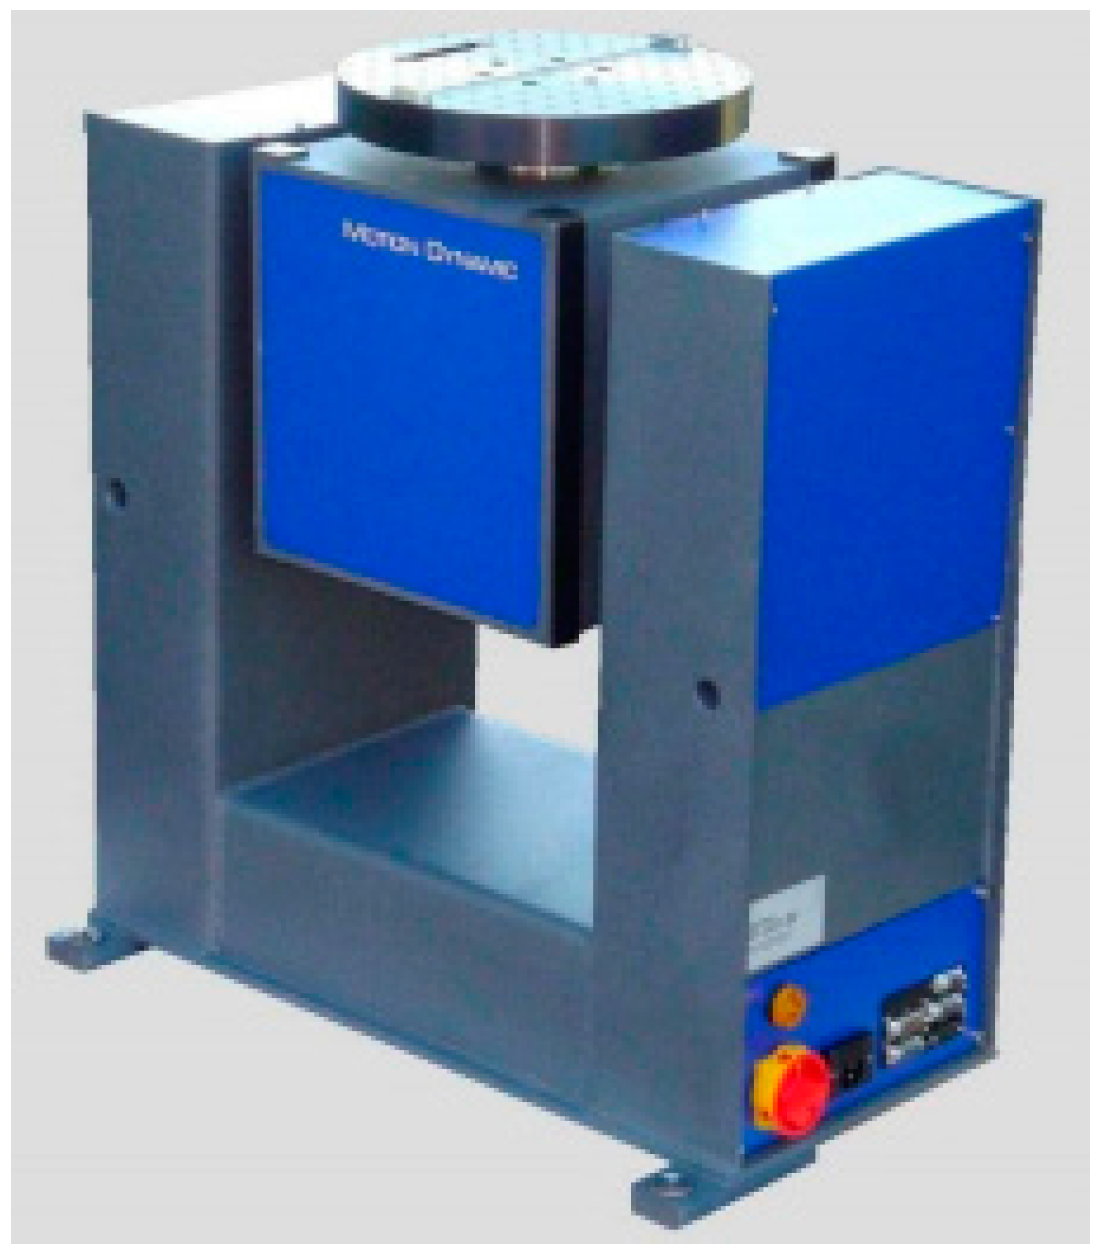
The six-position method can be implemented for both static cases and dynamic cases using a MEMS gyroscope that do not use the earth’s rotation as a reference value. Symmetrical positions in dynamic cases become symmetrical rotations. The simplified test fixes the inertial sensors on the top of a table for the three axes; the table has a fixed motion rate of 30 degrees. A static test for the accelerometer and a dynamic test for the gyro have been performed for this research using a turntable that has been leveled to the best degree possible so it can provide a constant rotation. The turntable used in this research is shown in
Figure 1. The TES-3T (Motion Dynamic, Altendorf, Switzerland) was designed for angular positioning, precise uniform rate, and angular motion profiling.
2.2. Activity Recognition
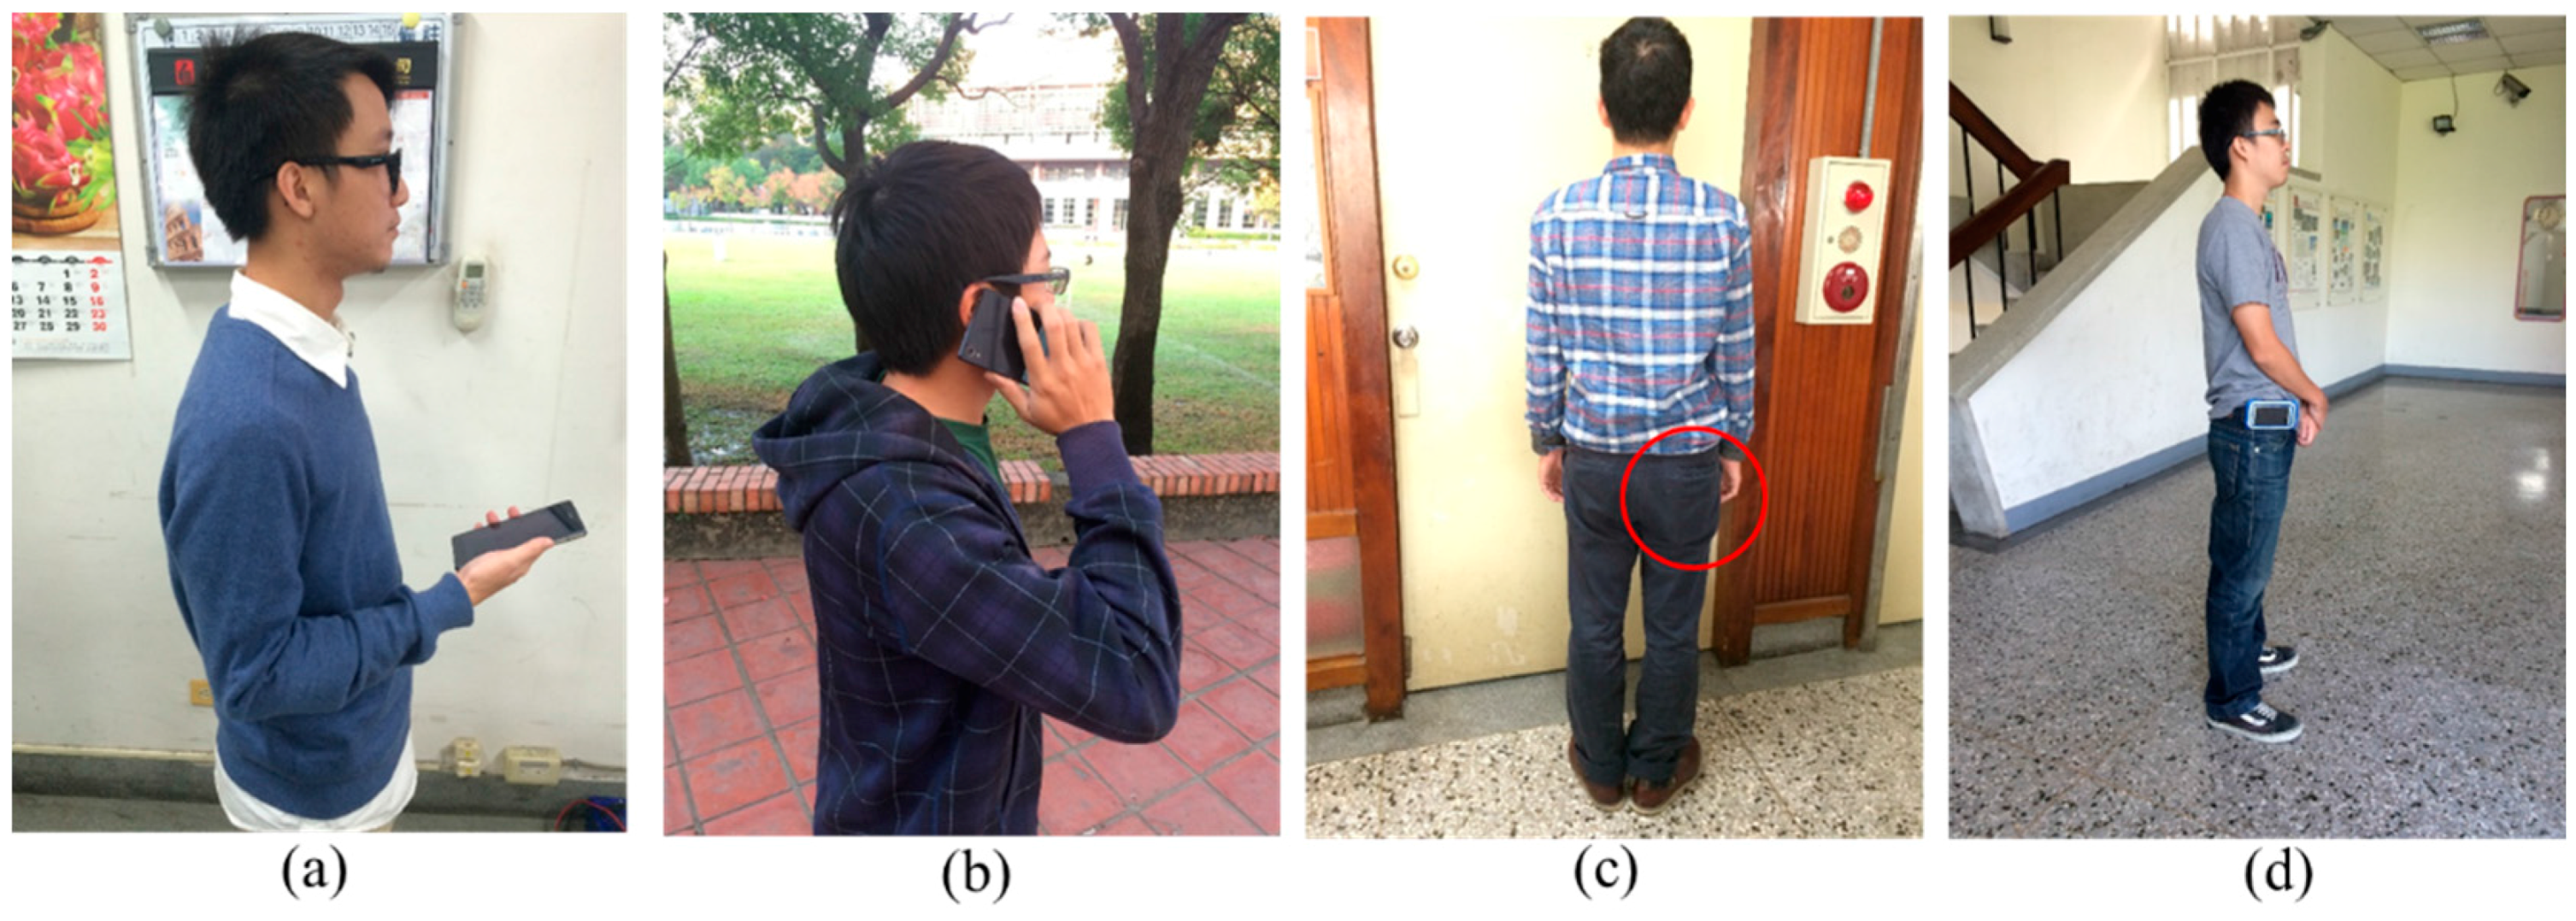
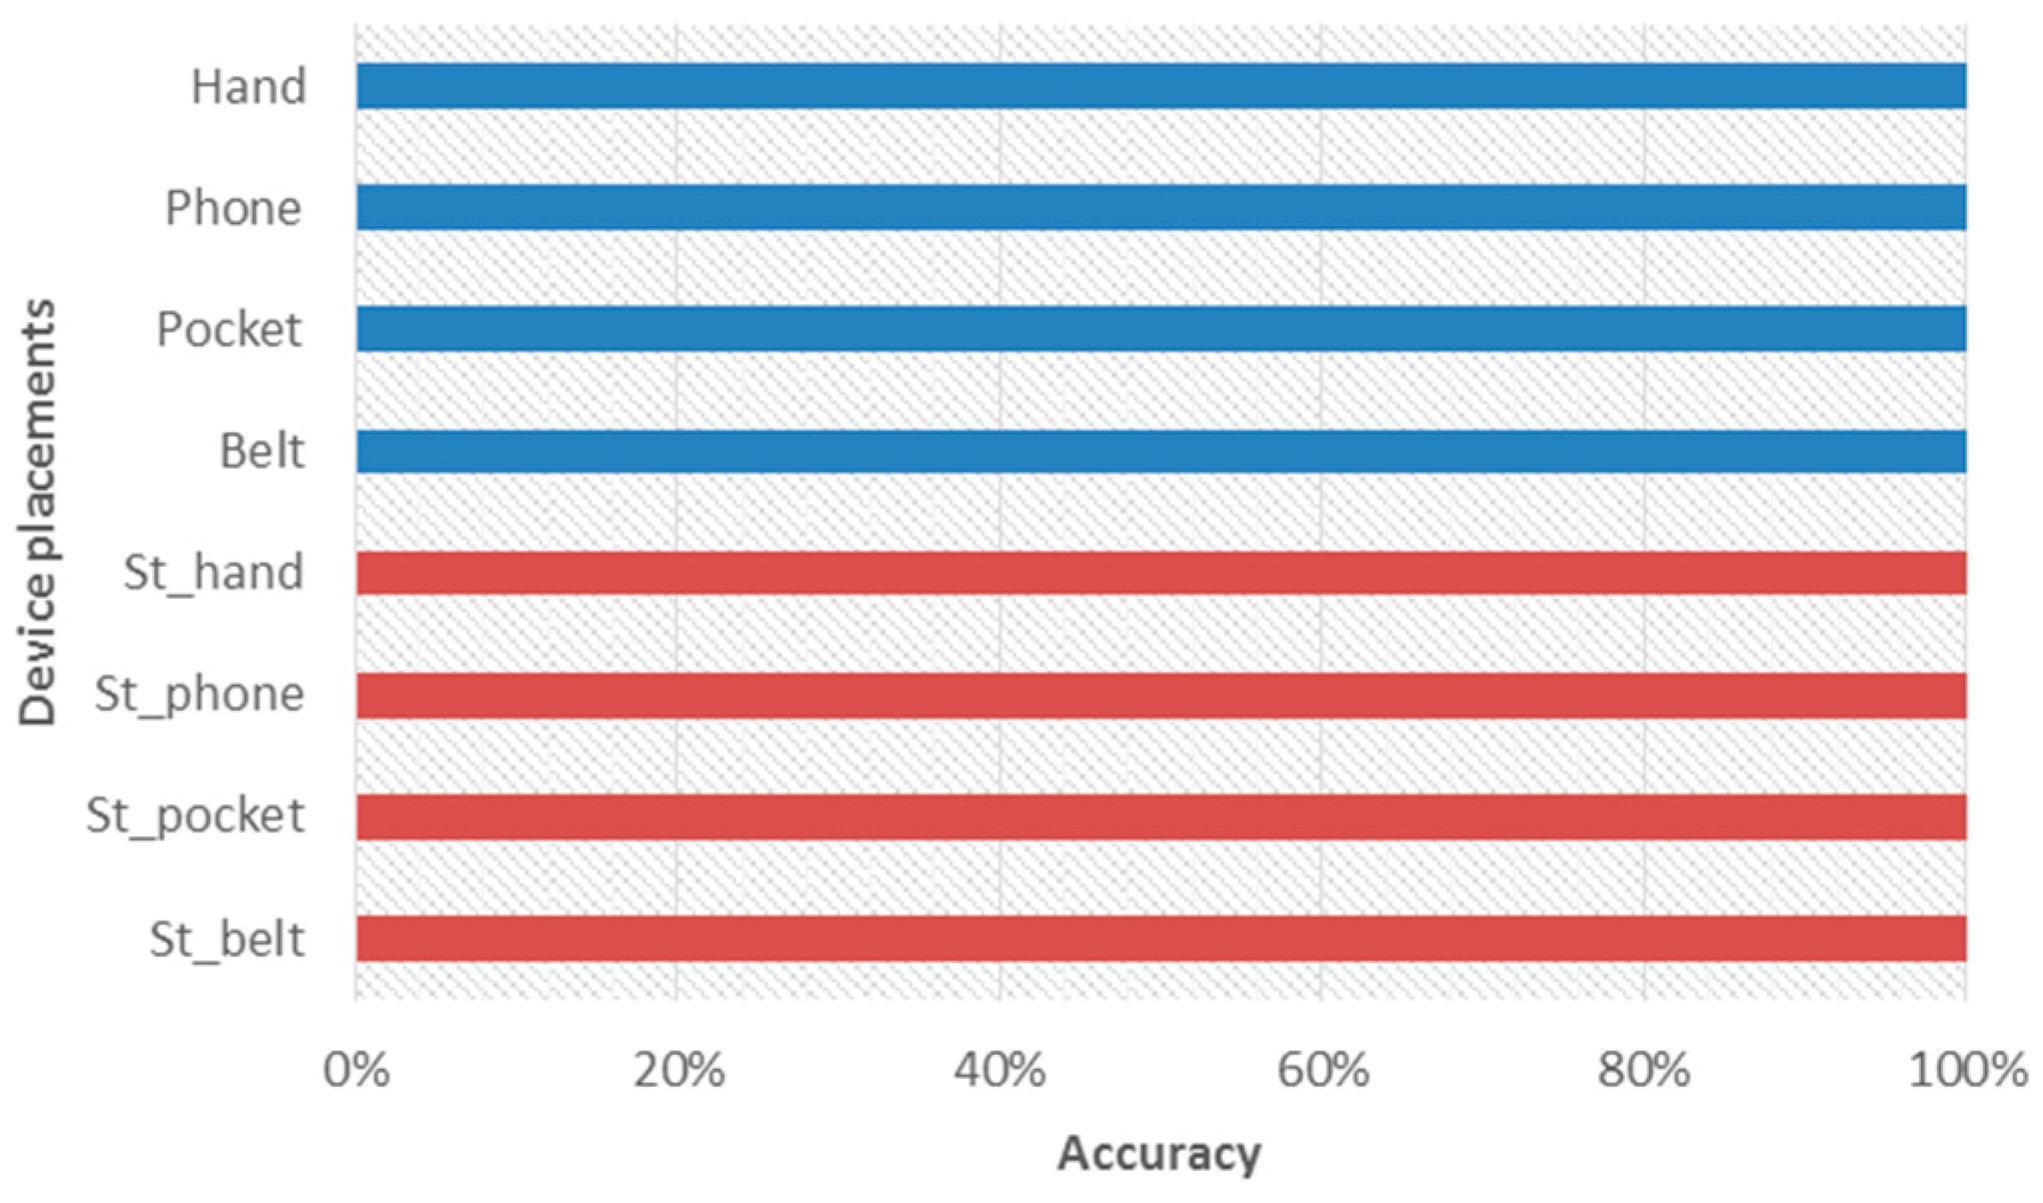
Activity recognition is used to choose the appropriate heading estimation algorithm based on the different relationships between each frame. Because phones may be hand-held, held close to the ear, attached to a belt, or kept in the pocket, tests were performed for each of these four physical situations. The basic processing flow of the activity recognition follows an approach proposed by Avci [
19], which includes signal preprocessing, segmentation, feature extraction, and classification, as shown in
Figure 2.
Training and testing data were collected from the accelerometer, proximity sensor, and the light sensor embedded in the smartphone at a sampling rate of 20 Hz. These MEMS-based sensors commonly generate some noise, so the development of a well-established low-pass filter and calibration are necessary. The proximity sensor and light sensor can both improve the accuracy of activity recognition because they can help the system to recognize the characteristics that generated by typical events in daily life. For example, if the smartphone is close to the ear, the algorithm will detect the decreasing distance between the smartphone and user based upon the declining luminance. Therefore, the recognition accuracy of close-to-ear will be enhanced. The segmentation of the signal is a major step before feature extraction. There must be enough data for signal segmentation to be executed completely. The sliding window size impacts the results of activity recognition. In order to develop pattern recognition using smartphones for real-time applications, processing time, sampling frequency, and data overlap are constrained. In this research, a sliding window containing five records is used to segment data with 80% overlap between successive windows to avoid losing information.
By analyzing these signals, features can be extracted from the data segmentation. Features can be defined as the main characteristics of data segments. In general, features can be defined as the abstraction of raw data, and the purpose of feature extraction is to find the main characteristics of data segments that accurately represent the original data [
20]. In particular, the following features have been evaluated for each phone position: mean, standard deviation, and root mean square. Features are used to classify the different positions using a Decision Tree (DT). The DT is a low-complexity logic system for decision making, and has a hierarchical structure and rules. The classification continues until a decision is reached. The necessary conditions, or rules, can be obtained through a training process using a sample dataset. Finally, this study uses rule-based algorithms, as a decision tree, to detect context information based on knowledge from previous training. DT is widely used in activity recognition problems. In practice, when the system detects a difference in device placement, the algorithm identifies the phone’s physical position (in the hands, close to the ear, on the belt, or in the pocket), and then provides the appropriate heading information. The core algorithm is based on frame transformation. Frame transformation allows the system to calculate the heading of the user for the different device locations.
2.3. Bluetooth Positioning
Bluetooth positioning technology is used for both to initialize and update the user’s location by Bluetooth beacon (THLight Co. Ltd., New Taipei City, Taiwan) in this research. The methods of initialization include proximity and bounding box. In the bounding box method, the distance between the object and a minimum of three reference points are used for initialization. The distances are determined by the measurements of the Received Signal Strength Indicator (RSSI).
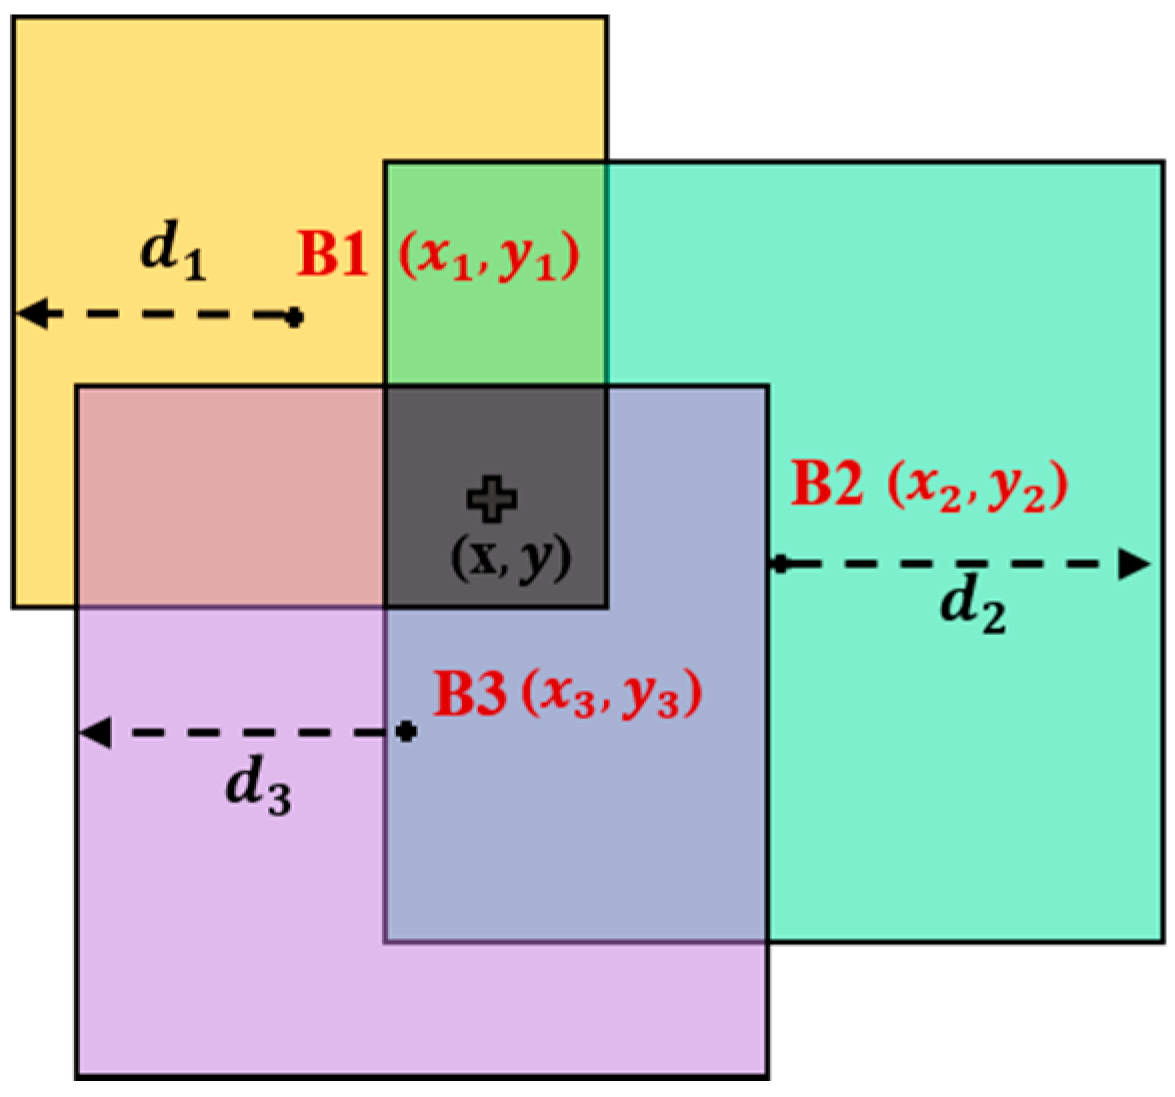
The bounding box method, proposed by Boukerche et al (2007), uses squares to establish the boundaries of the possible position of a node [
21]. As shown in
Figure 3, B1, B2 and B3 are three beacons; (
), (
) and (
) are the known coordinates of each beacon, respectively;
,
and
are the estimated distances of corresponding beacon. For each beacon, a bounding box is defined as a square (the squares with different colors shown in
Figure 3) with its center at the known position (
,
), and sides of size
(where
is the estimated distance), and with a lower left coordinate (
,
) and an upper right coordinate (
,
). The intersection of all bounding boxes can be easily computed by taking the maximum of the low coordinates and the minimum of the high coordinates of all bounding boxes in Equation (3).
In the proximity method, when the system scans and detects the beacons, an algorithm identifies each one by its ID setting. If the signal received is from a proximity-type beacon with an RSSI larger than the threshold, the system obtains the initial location based upon the position of the proximity-type beacon that is recorded in the database. Only proximity method is used to update the location of the user in the following experiments.
2.4. Pedestrian Dead Reckoning
The PDR that has been developed includes step detection, stride length estimation, and heading estimation. Based on the physiological characteristics of the pedestrian, the waveform for the three-axis accelerometer output values can be obtained for the formation of cyclical changes [
22]. The cyclical changes and characteristic values can be used for step detection. According to Mladenov et al., the periodic up and down motion of the human body during each step is the strongest indicator [
23]. However, the axes of the smartphone may be not perfectly aligned and fixed for the moving subject. Therefore, calculating the magnitude of acceleration vector is generally the best method for detecting individual steps. In addition, the accelerometer records the raw data, which includes gravity and motion acceleration. Before step detection, gravity must be separated, as in Equation (4).
Here,
is the magnitude of acceleration vector at time
;
,
and
are the output data of tri-axial accelerometer in the
,
, and
directions at time
;
is gravity (9.81
).
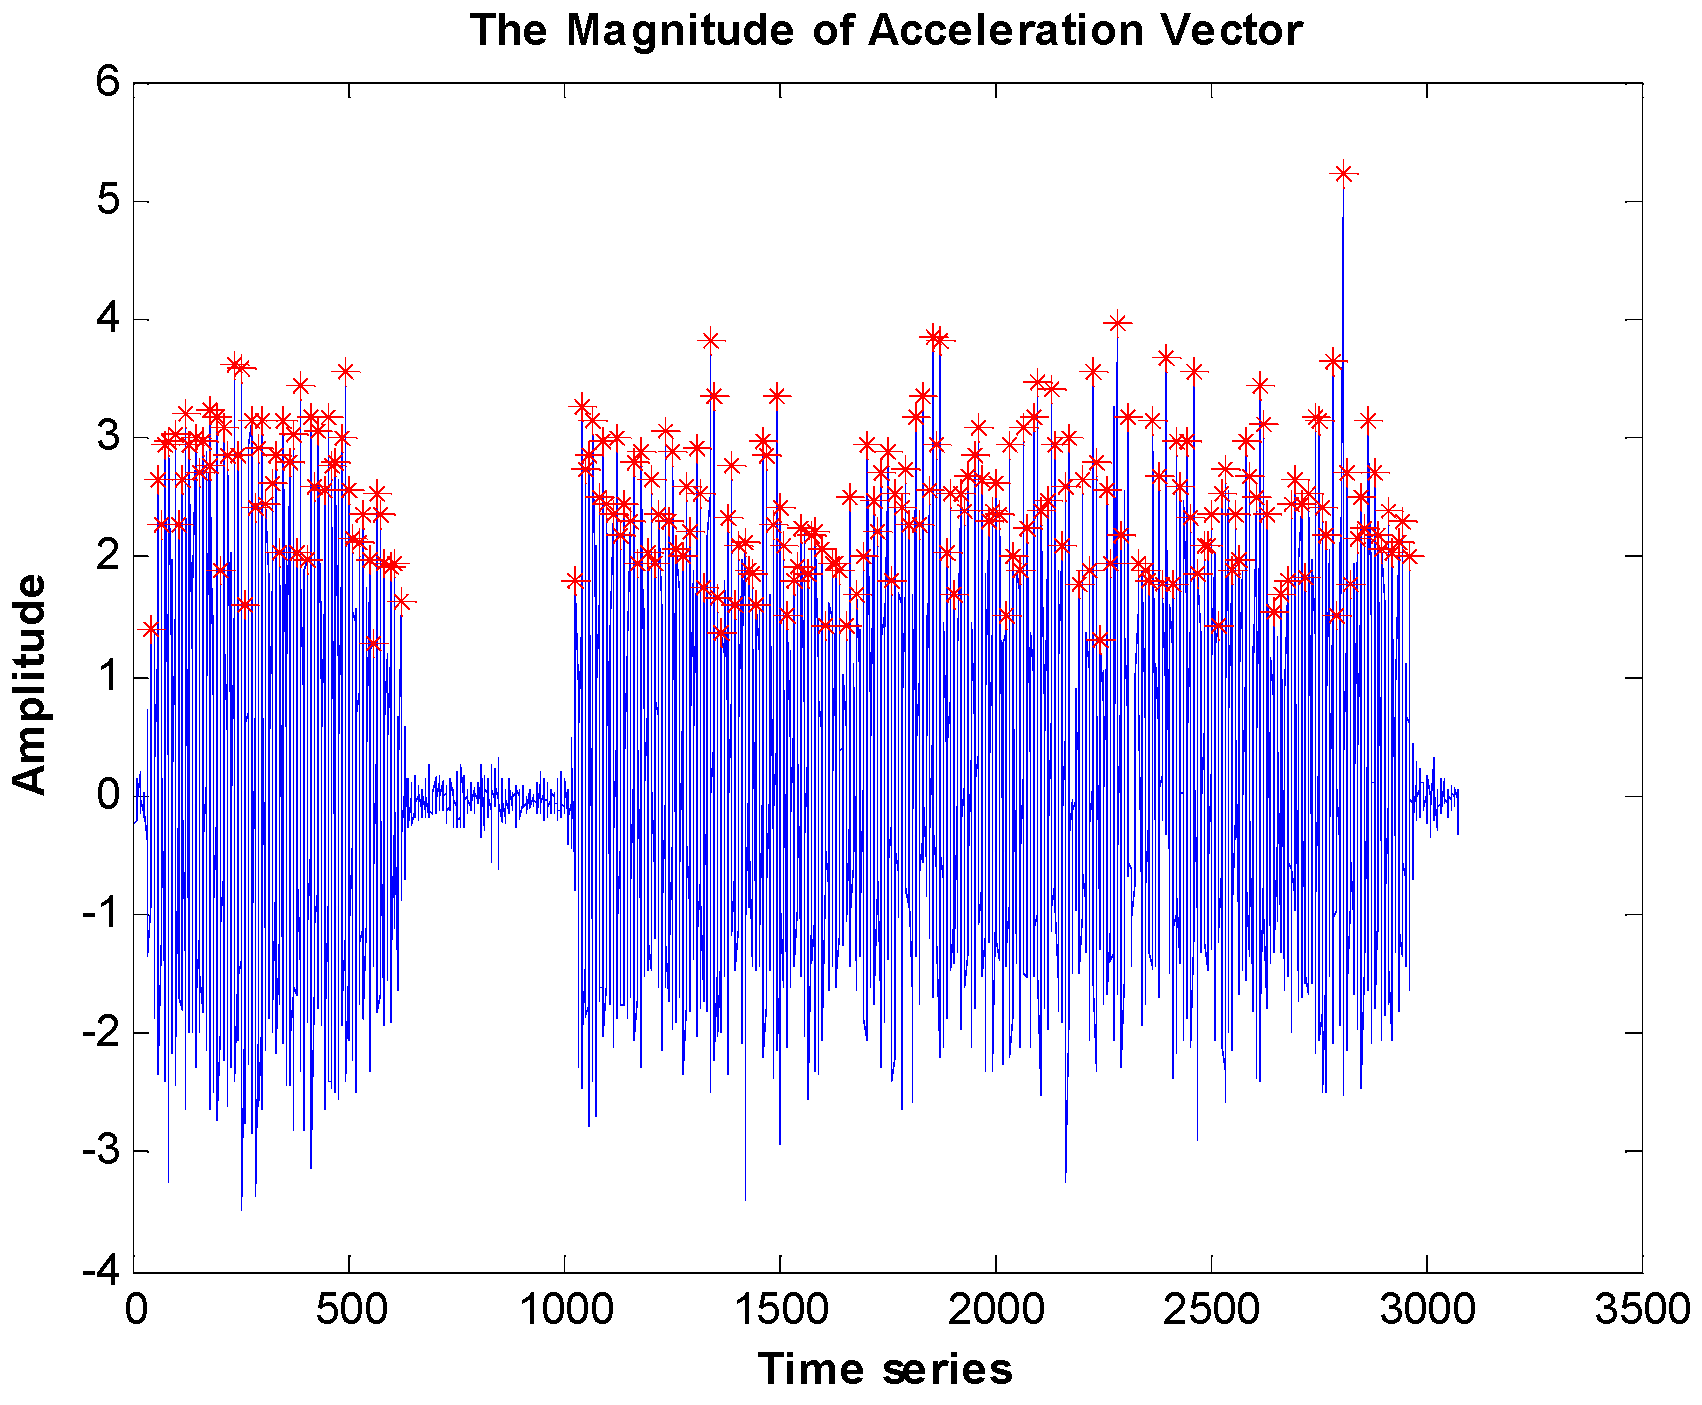
In this study, step detection is based on peak detection with setting thresholds of maximum peak value and time intervals. These are a useful way to reduce the detection of redundant peaks. The threshold of a maximum peak means the peak should be larger than the threshold; this ensures the value is a peak. The threshold of a time interval is able to reduce the peaks, assuming that the step interval between each step is larger than the threshold. In this research, the values of the two thresholds are fixed during the whole experiment. An example of step detection depicting the results of step detection is shown in
Figure 4, where the red points are the maximum peak and the blue lines are the magnitude of the acceleration vector.
Next, stride length is estimated using an empirical model [
24].
Where,
is the estimated stride length;
is the step frequency; and
is the height of the user. The known coefficients
and
are 0.371 and 0.227, respectively, and
is the personal factor.
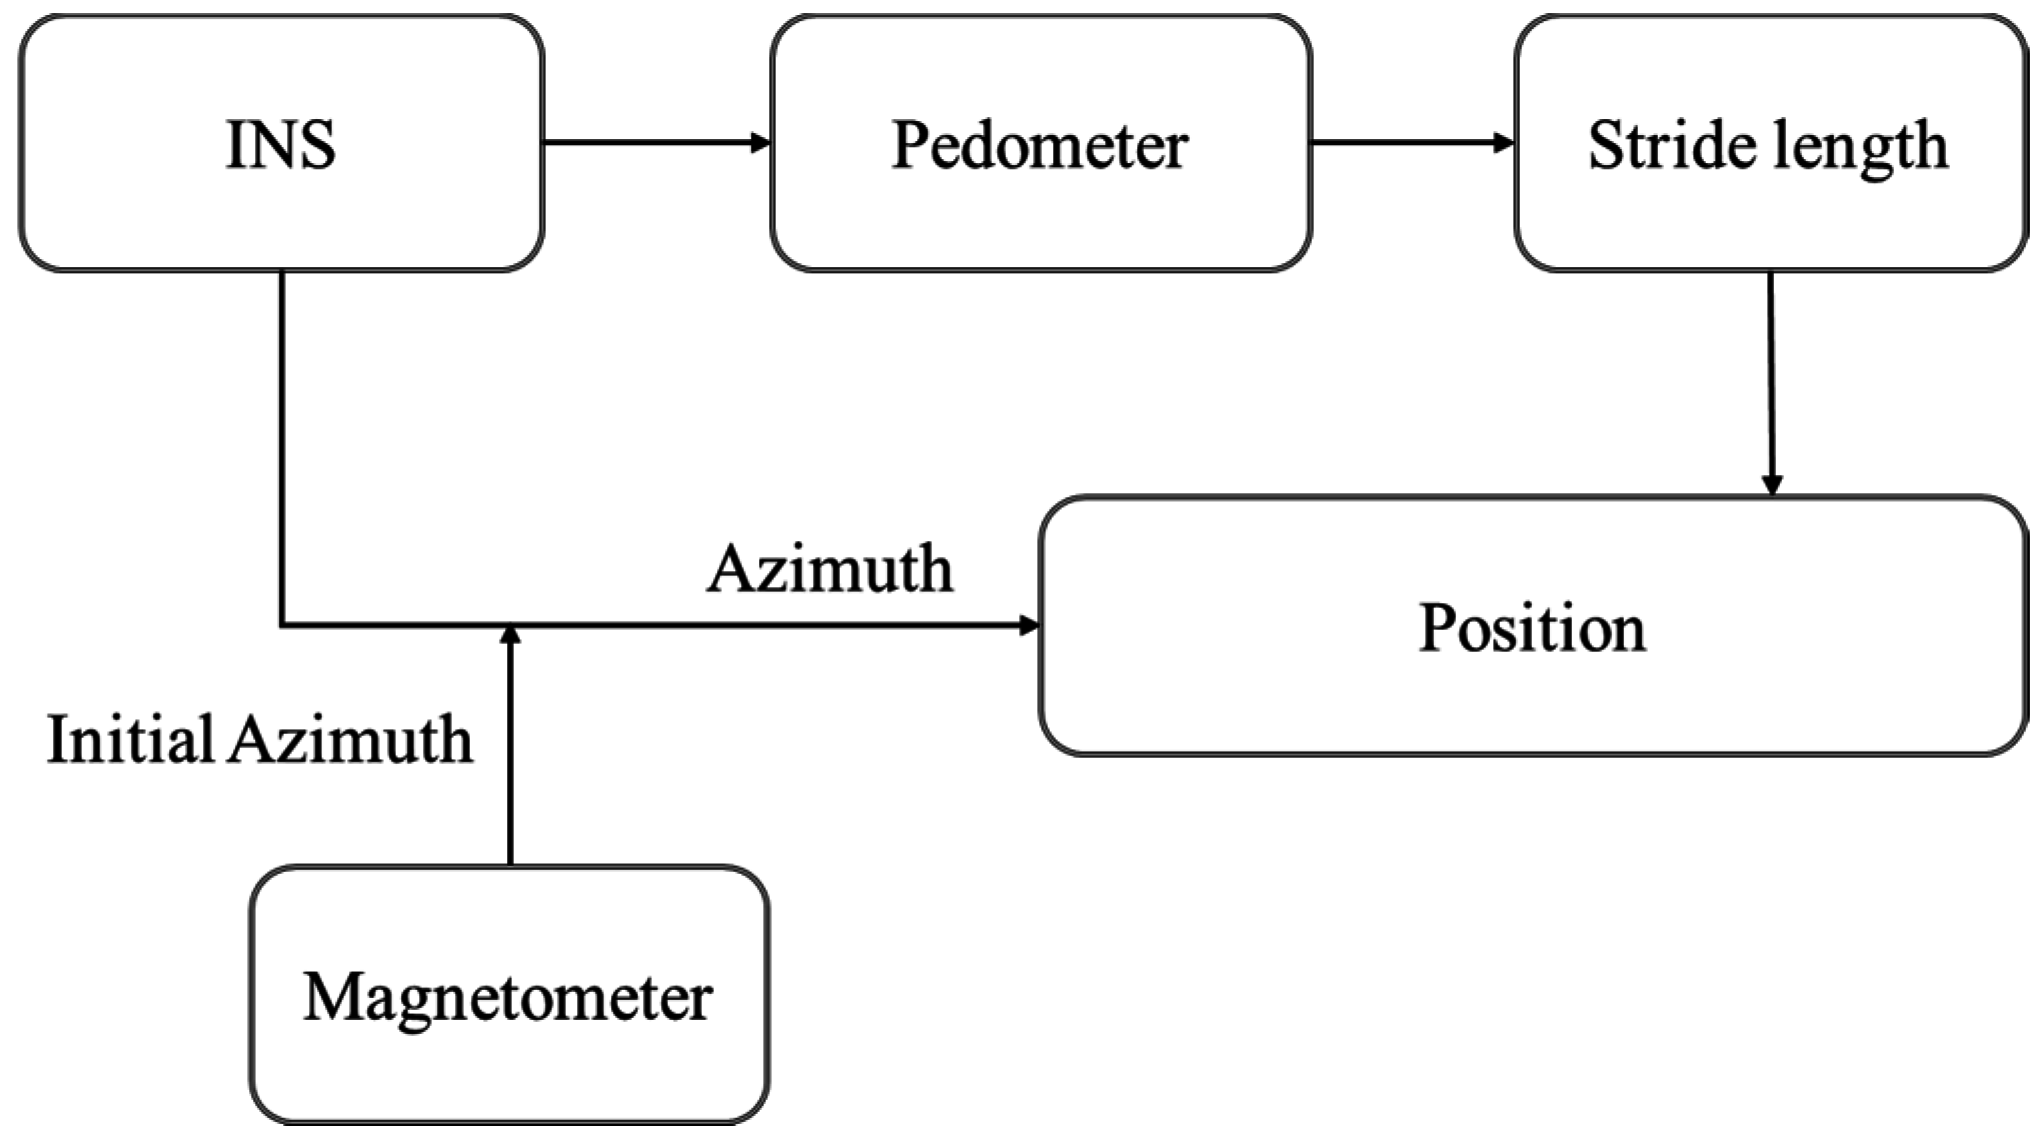
Finally, the heading measurements (angular rates and magnetic field in the
x,
y and
z directions) are derived from the gyroscope and magnetometer. The magnetometer provides the magnetic heading and the gyroscope provides the angular difference, which is obtained by integrating the angular rates at each step interval. Basing this on the gyros characteristics requires an initial heading from the magnetometer.
Figure 5 shows the PDR scheme used in this study.
2.5. Proposed Pedestrian Navigation System (PNS)
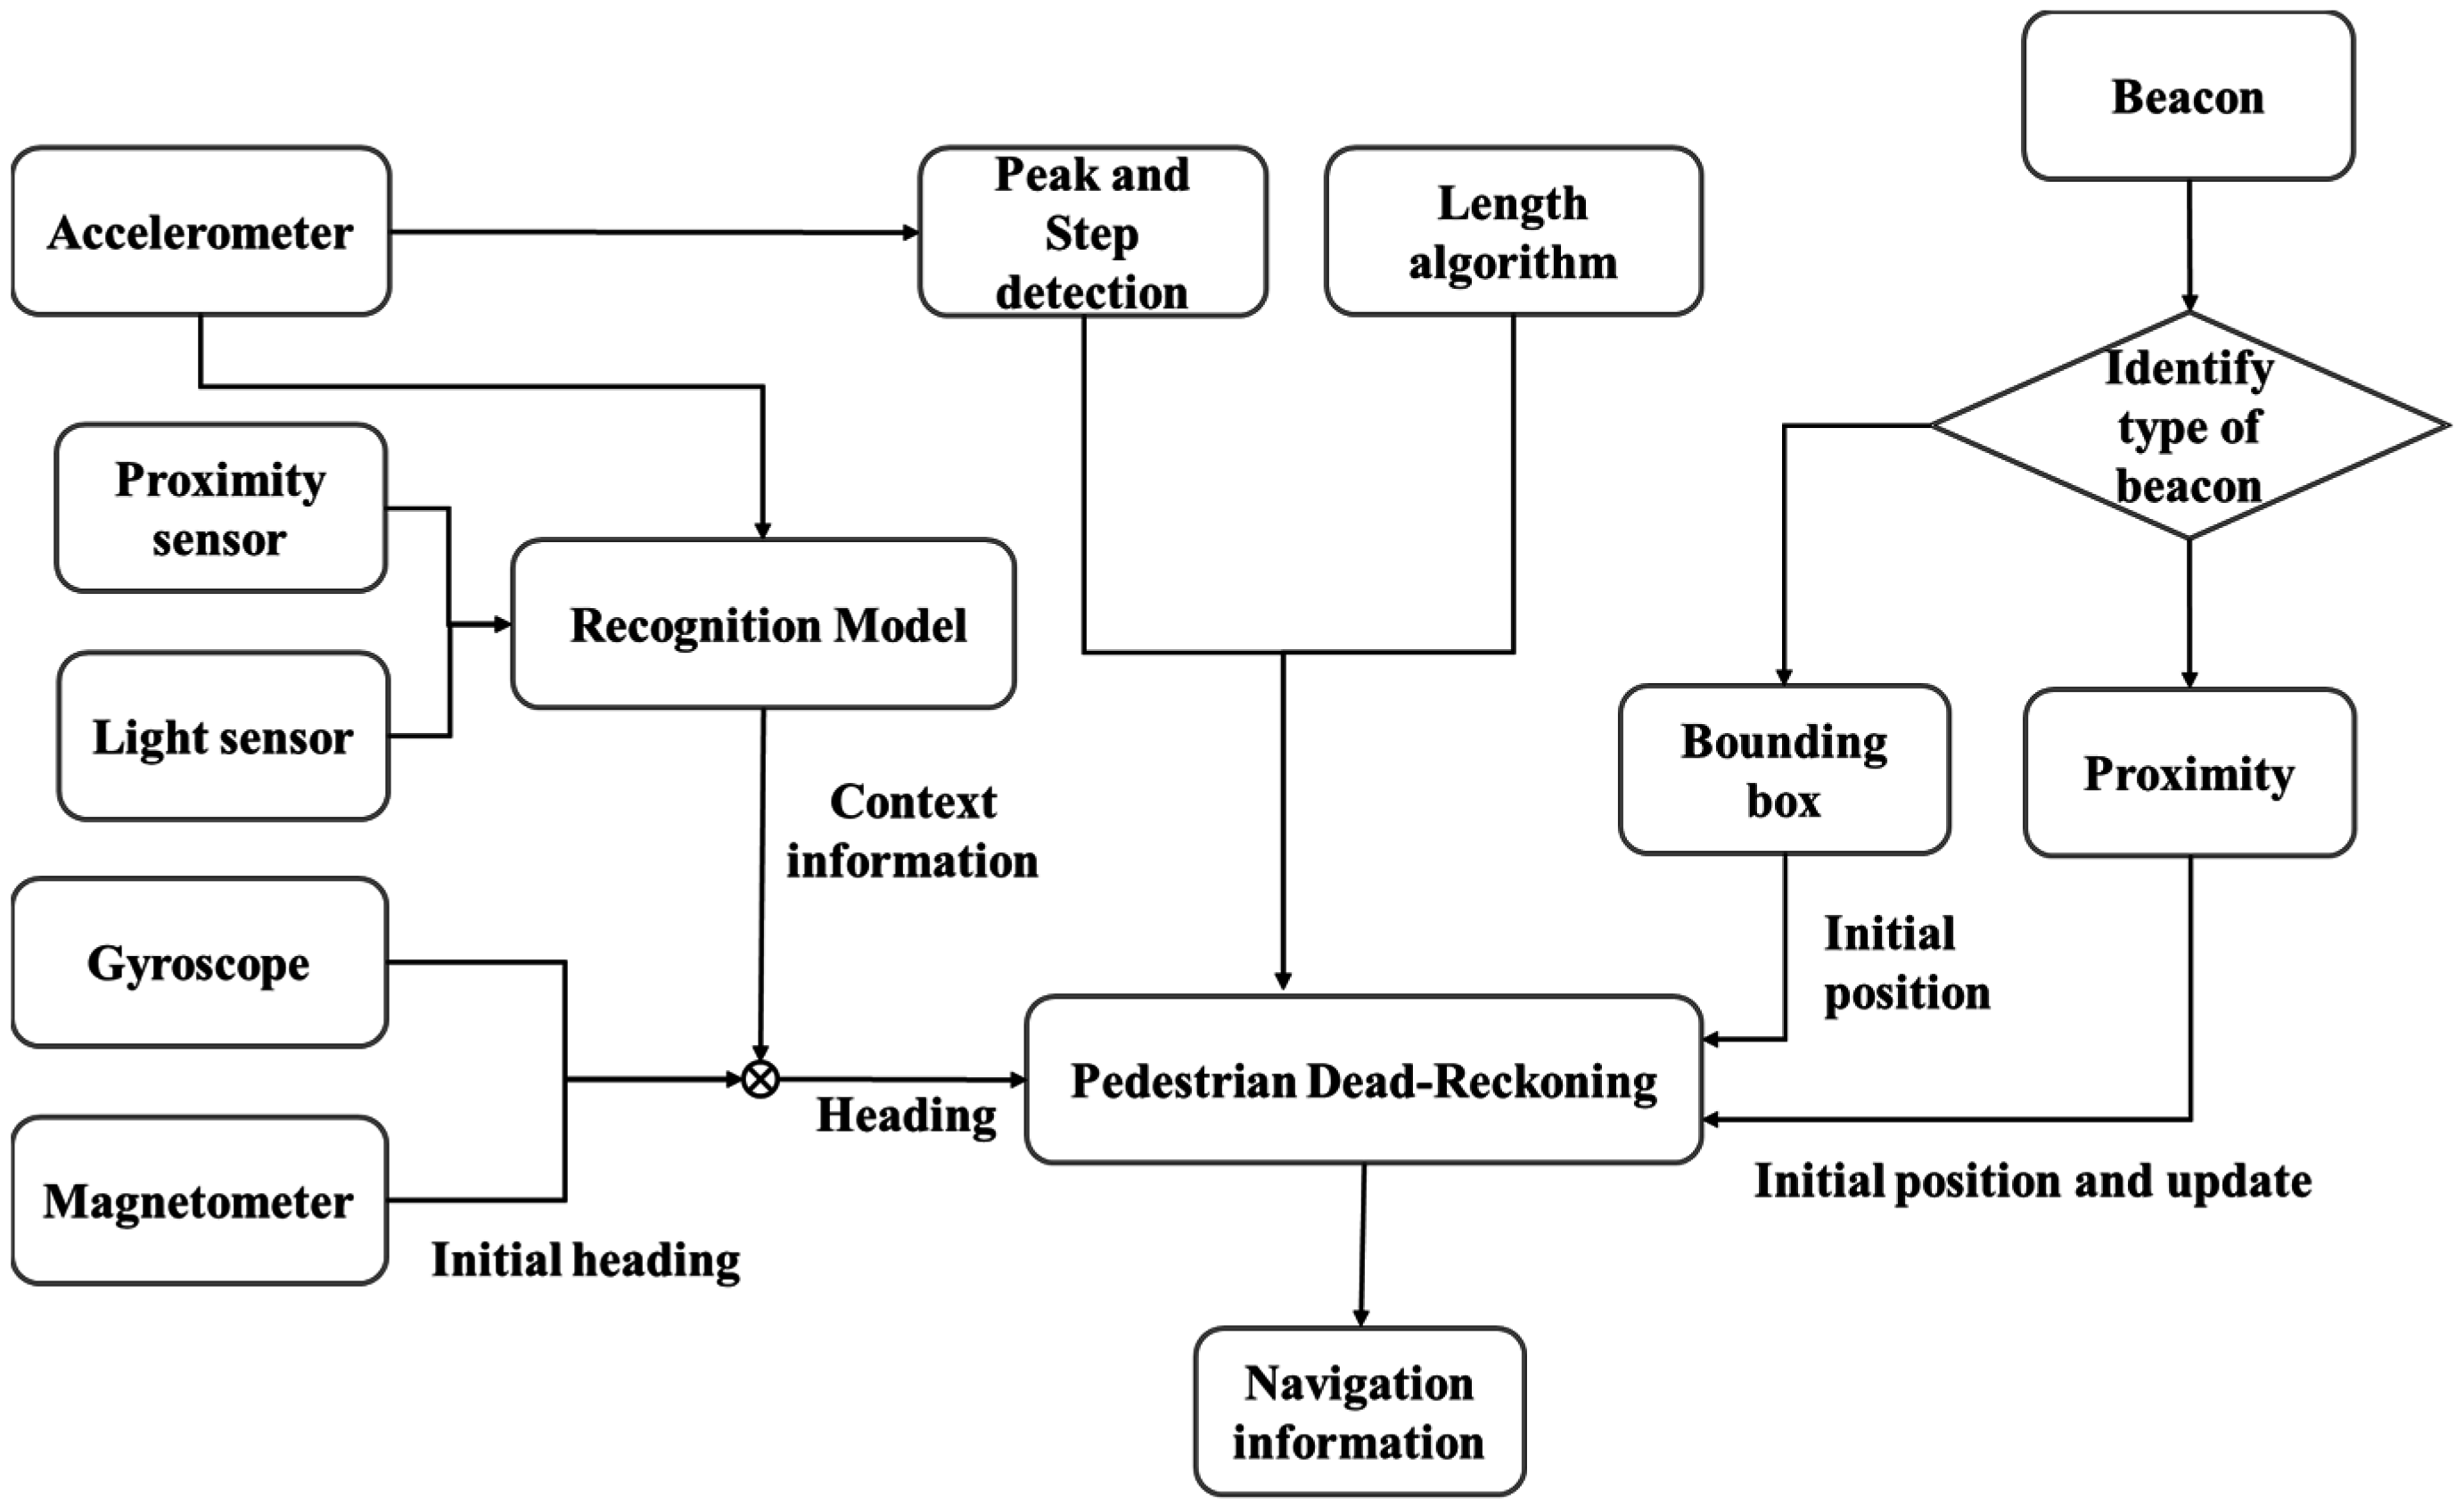
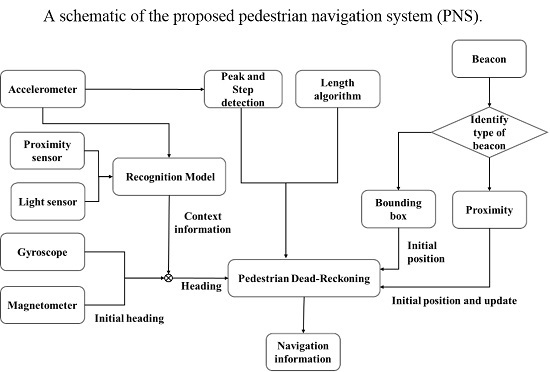
The scheme of the proposed PNS combined with PDR algorithm, RF-based Bluetooth technology, and activity recognition technology, is shown in
Figure 6. The design of the pedometer is described in
Section 2.4. Both the proximity and bounding box approaches are implemented based on the different setting IDs. The application first loads the map data and establishes a database that is composed of coordinates, the parameters of transformation and some specific local settings. The stride length can be seen in the reference proposed in [
25], which is complete and detailed. In this research, in order to achieve real-time application, only one of the step length models is considered.
The system first detects the beacon signals and decides whether to use the proximity method or bounding box method based on the setting IDs. If the signal received is from a proximity-type beacon with an RSSI larger than the threshold, the system obtains the initial location. If the signals received are from three beacons with an RSSI larger than the threshold using bounding box method, the system obtains the initial location using that approach. When the system finishes the initialization, it moves to the next stage. The output of the accelerometer is used for step detection and activity recognition. In step detection, the magnitude of acceleration is calculated to detect peaks. At the same time, features (mean, standard deviation and root mean square) are extracted from the accelerometer, proximity sensor, and light sensor to determine device placement. The algorithm estimates the most optimal heading information using the information received regarding the phone’s most likely position (hand held, close to ear, on belt, or in pocket), after which the system calculates the two dimensional position of the user based on step count, stride length, and heading information. However, if the system finishes the initialization and detects the signal from proximity-based beacons and the signal received has an RSSI larger than the threshold, the system updates the position of the user using reference coordinates saved in the database.
