

Mu2e Crystal Calorimeter Readout Electronics: Design and Characterisation

 , ,
, ,  , , , , , , , ,
  , , ,
, , , 
Abstract
1. Introduction
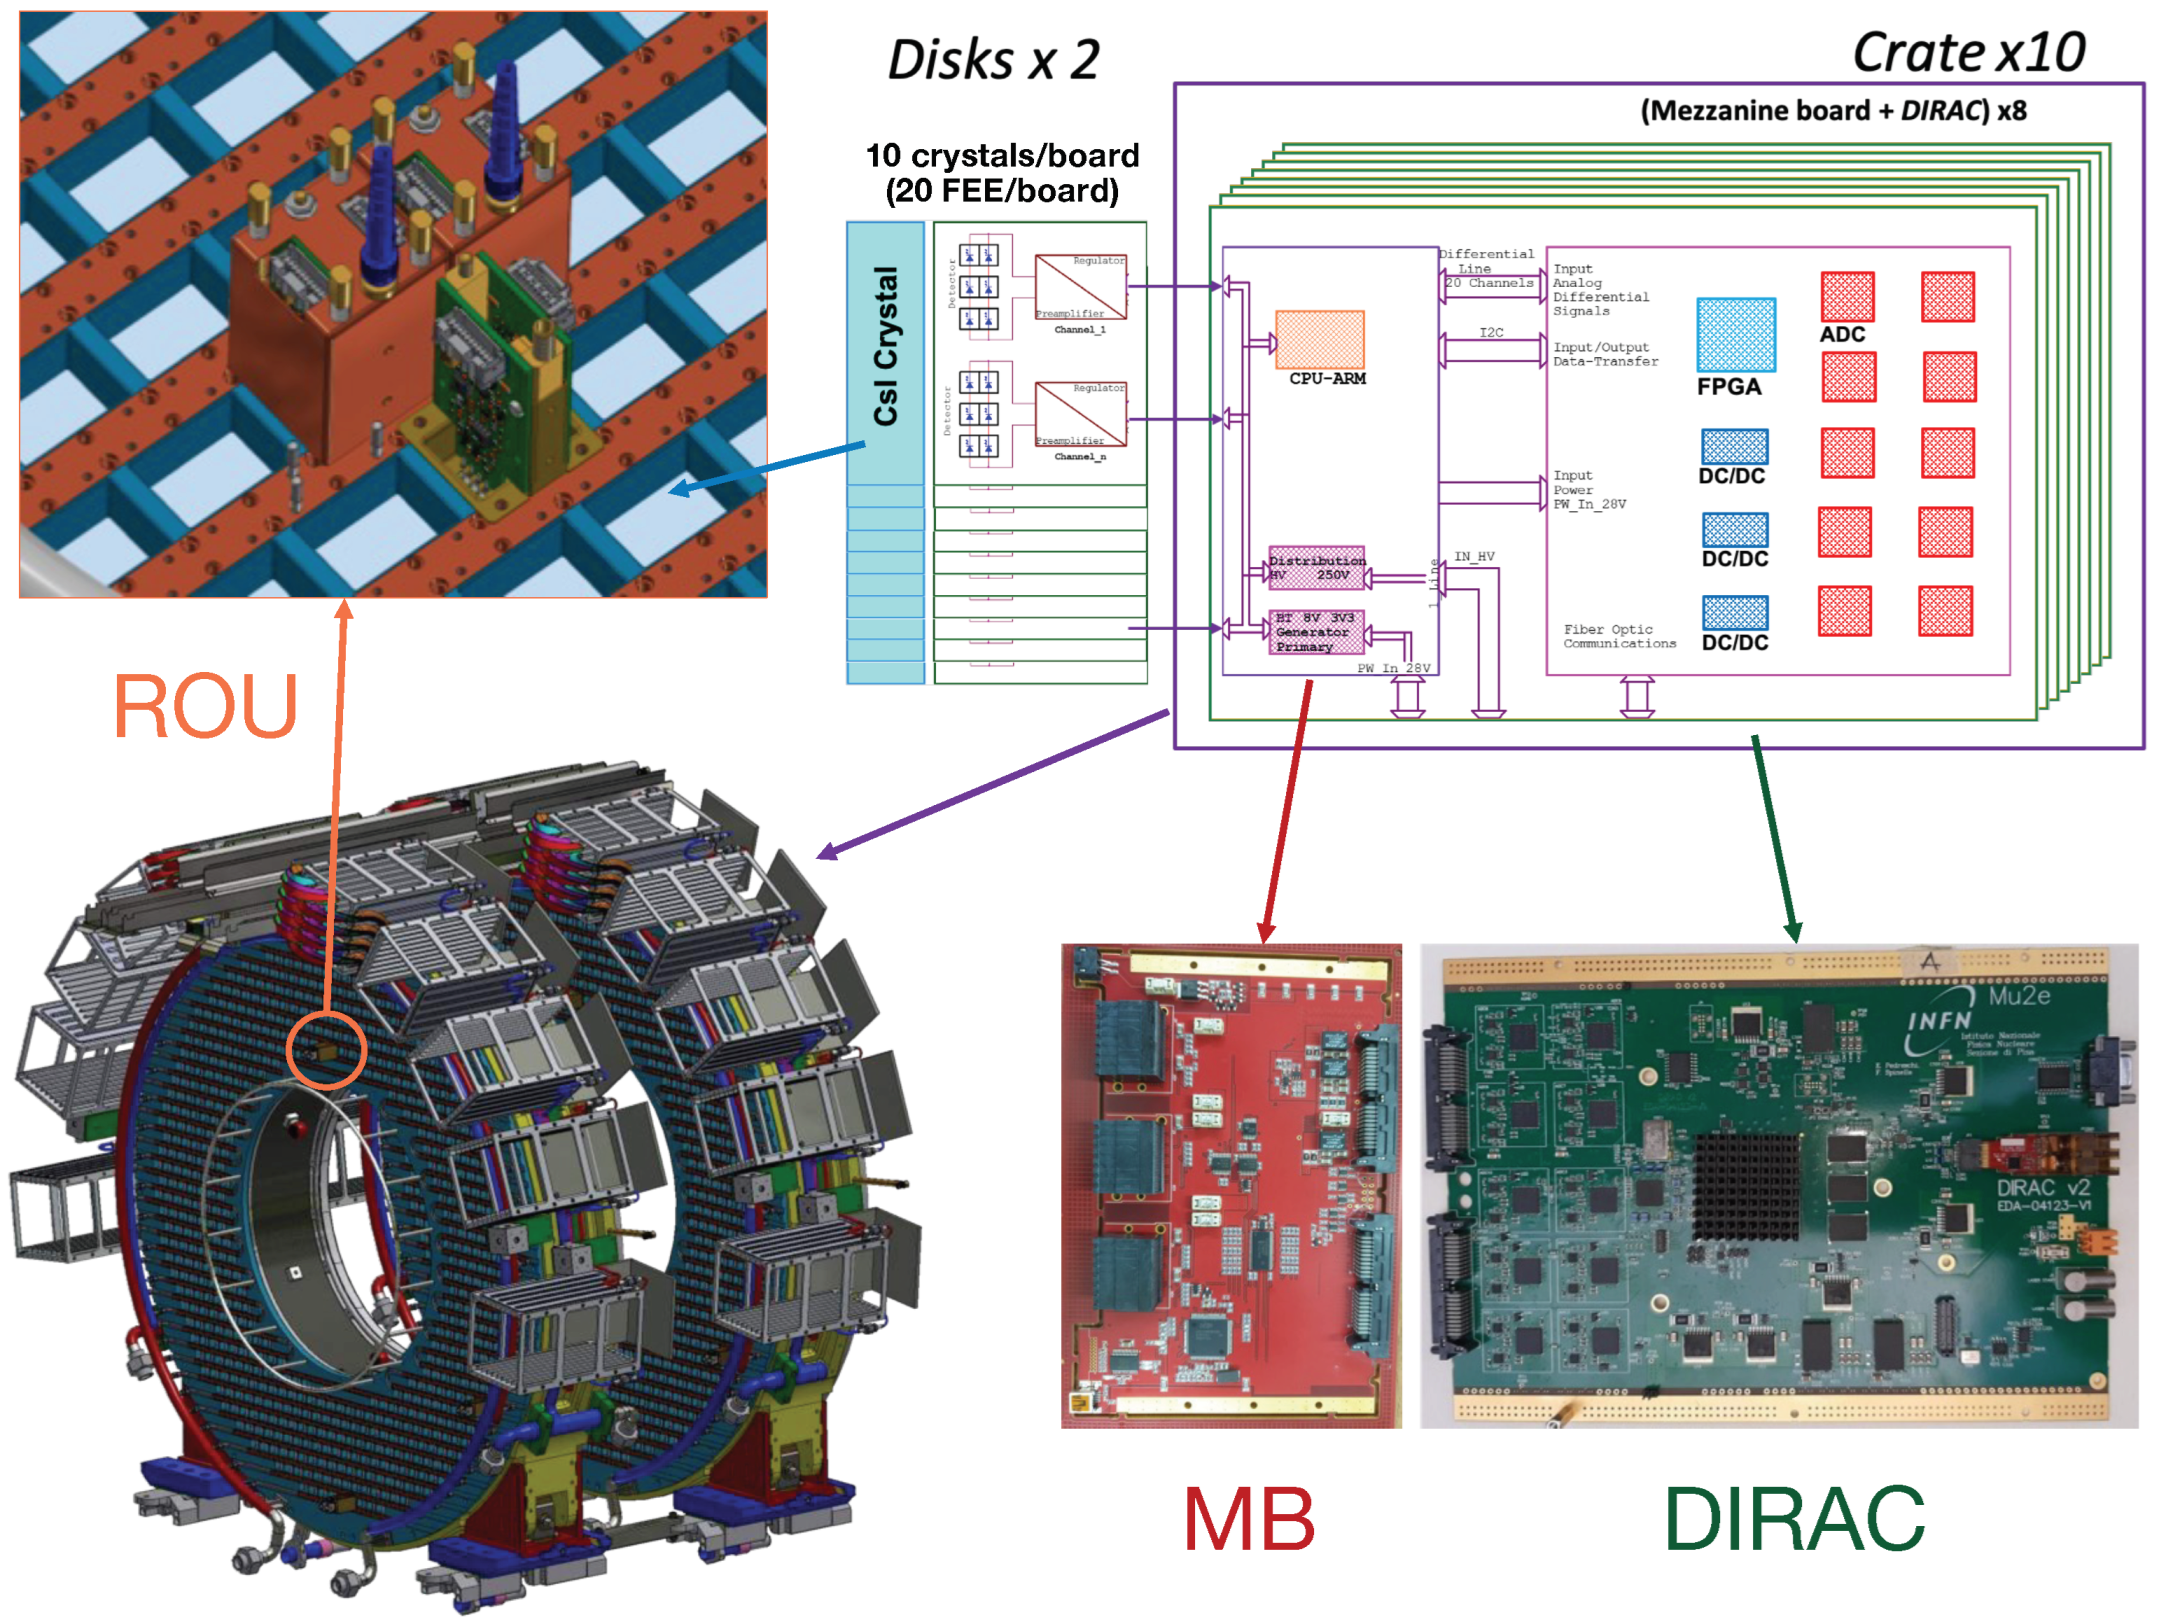
2. Readout and Signal Chain Architecture
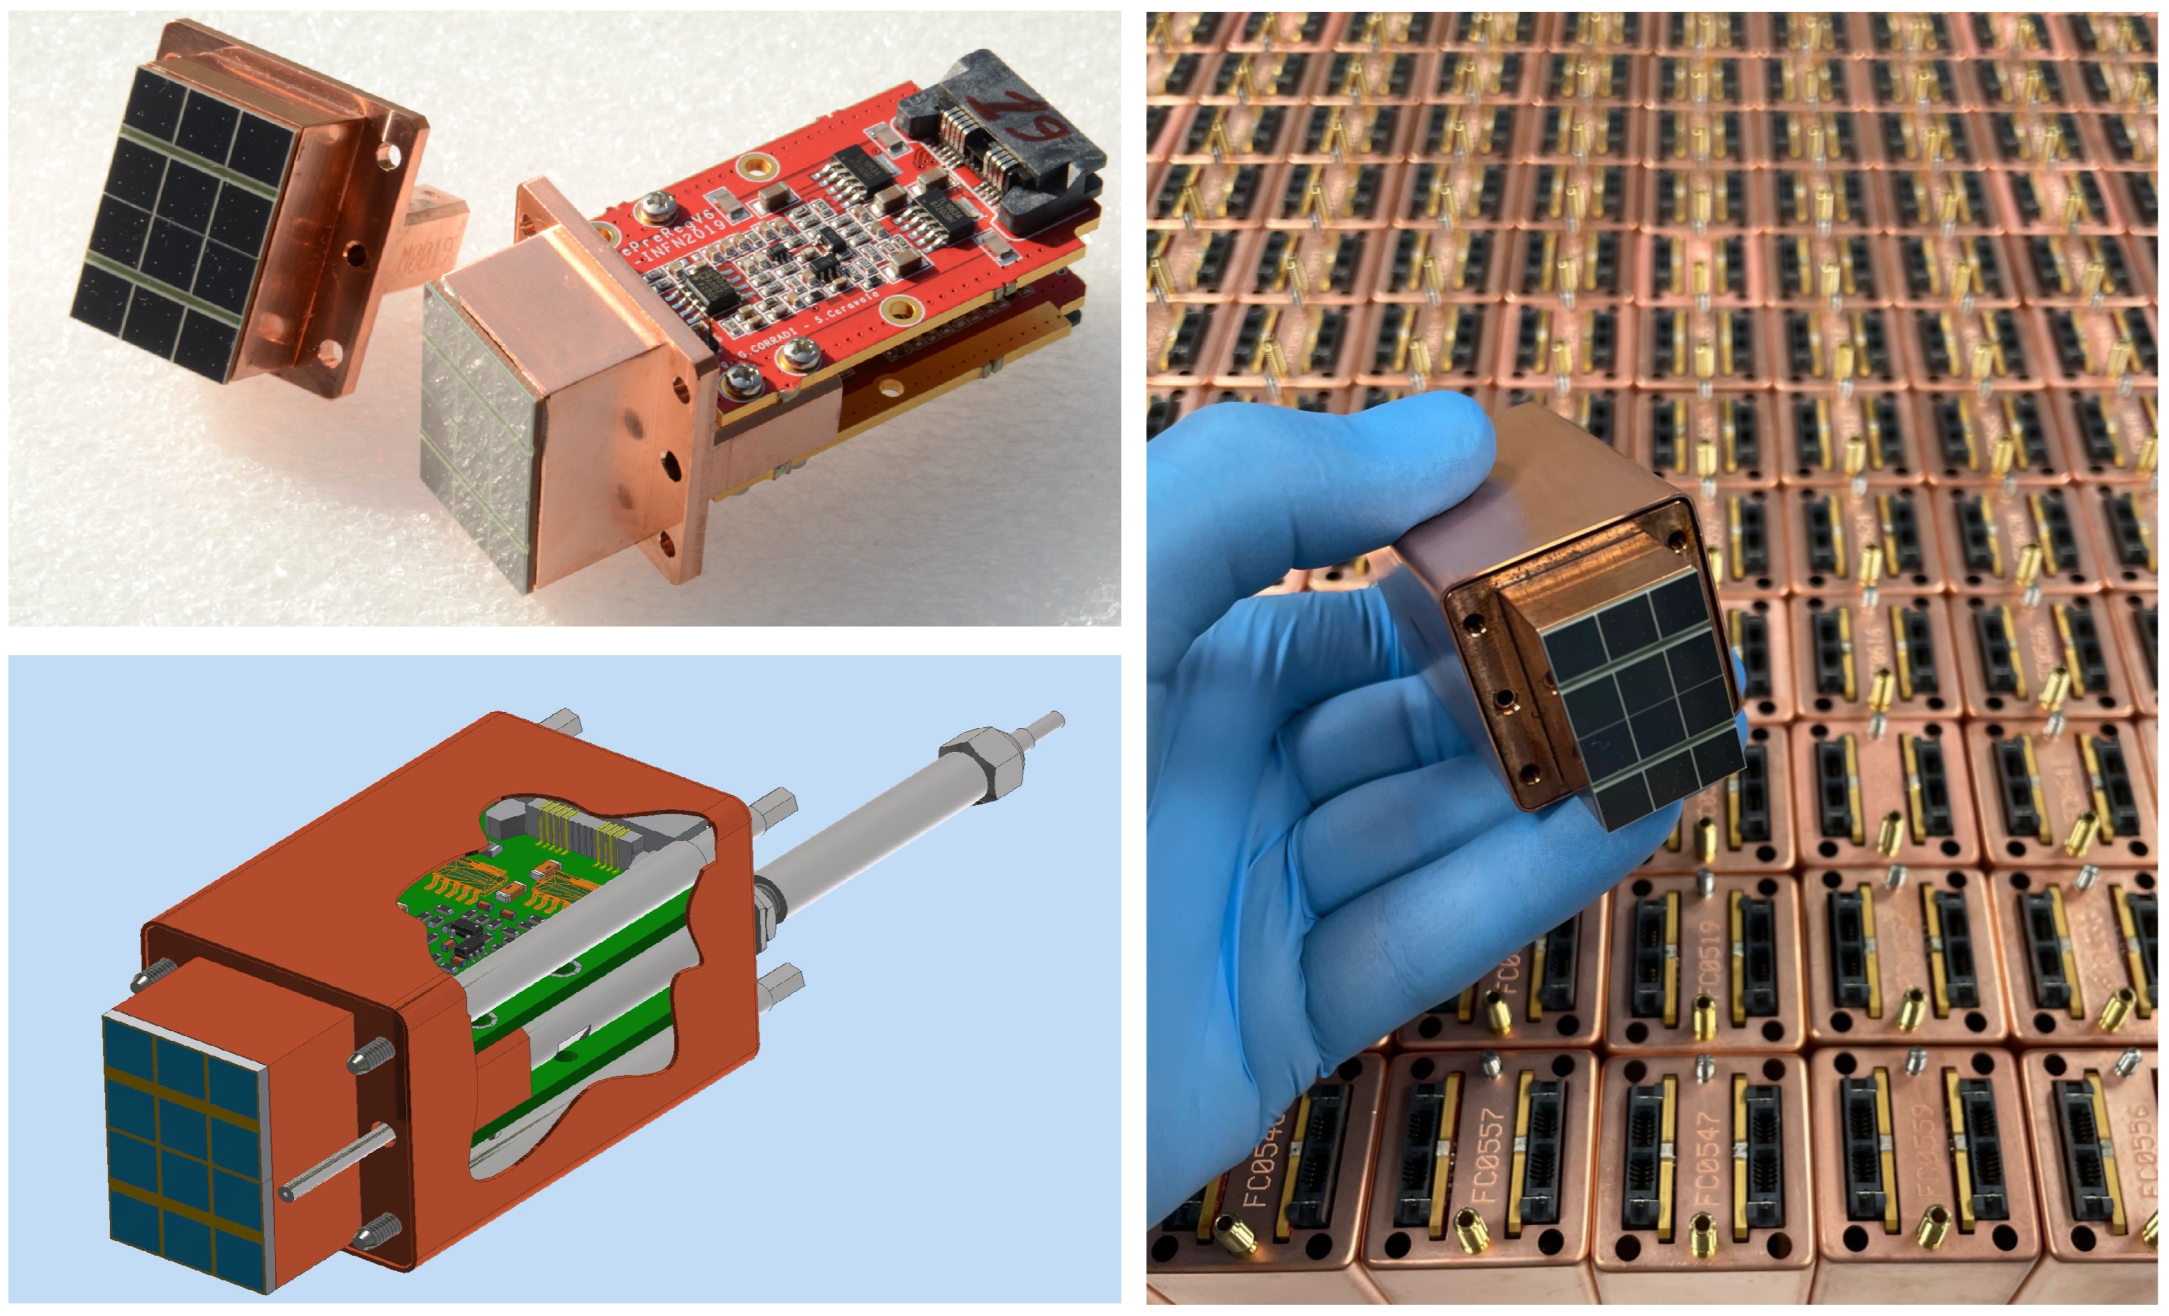
2.1. Readout Units
2.2. SiPMs
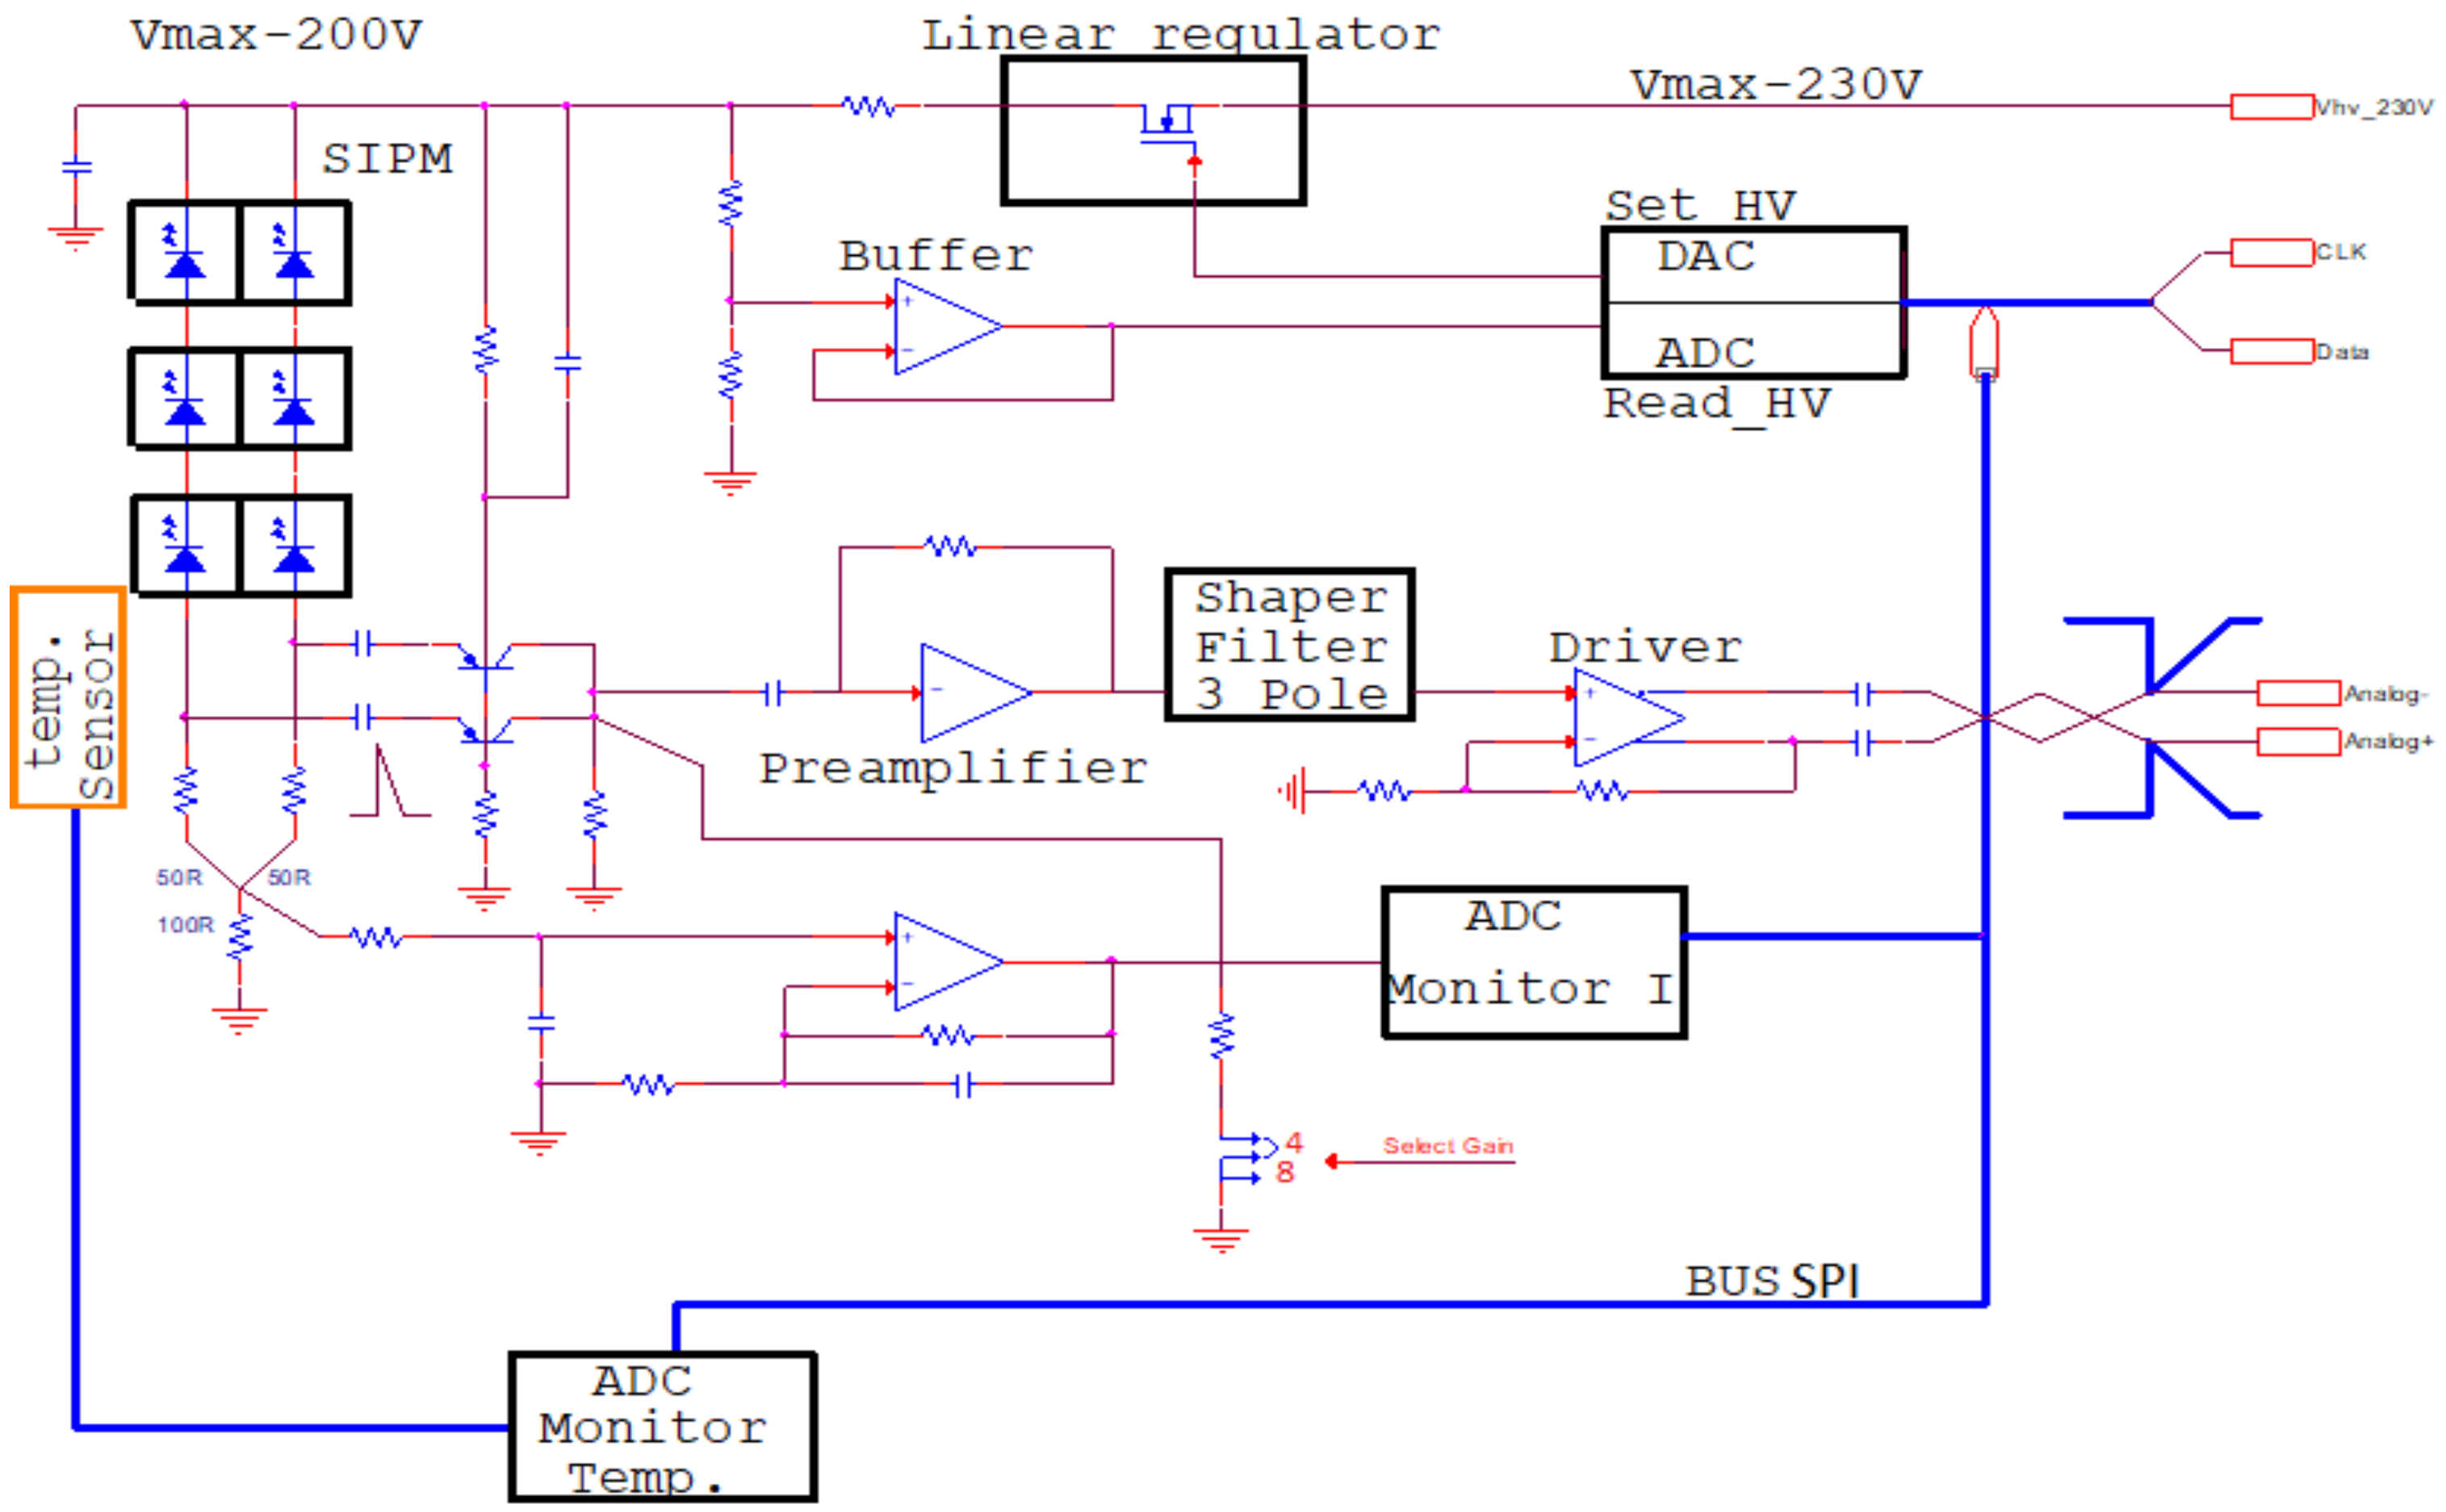
2.3. FEE Boards
2.4. Mezzanine Boards
2.5. DiRAC
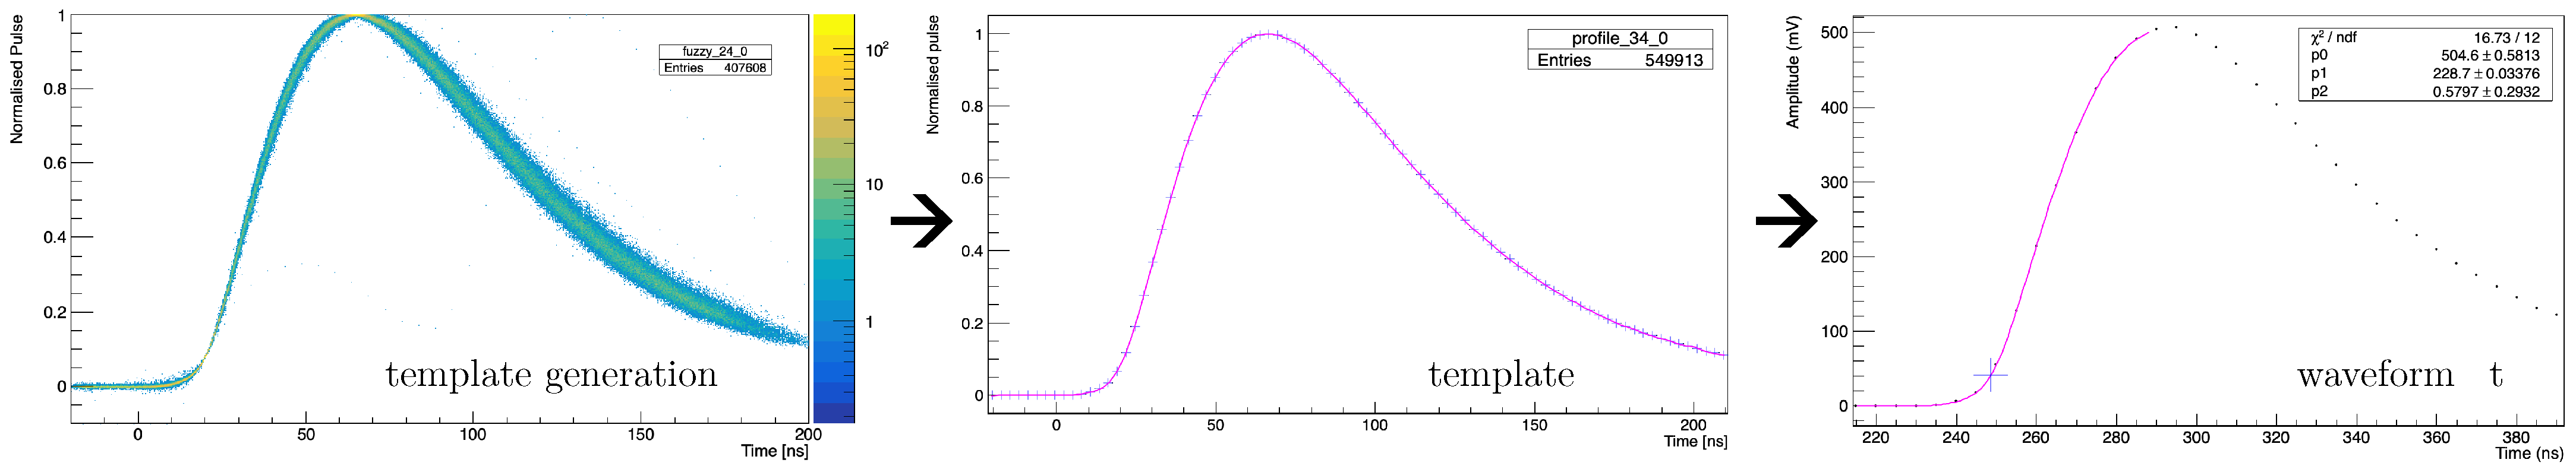
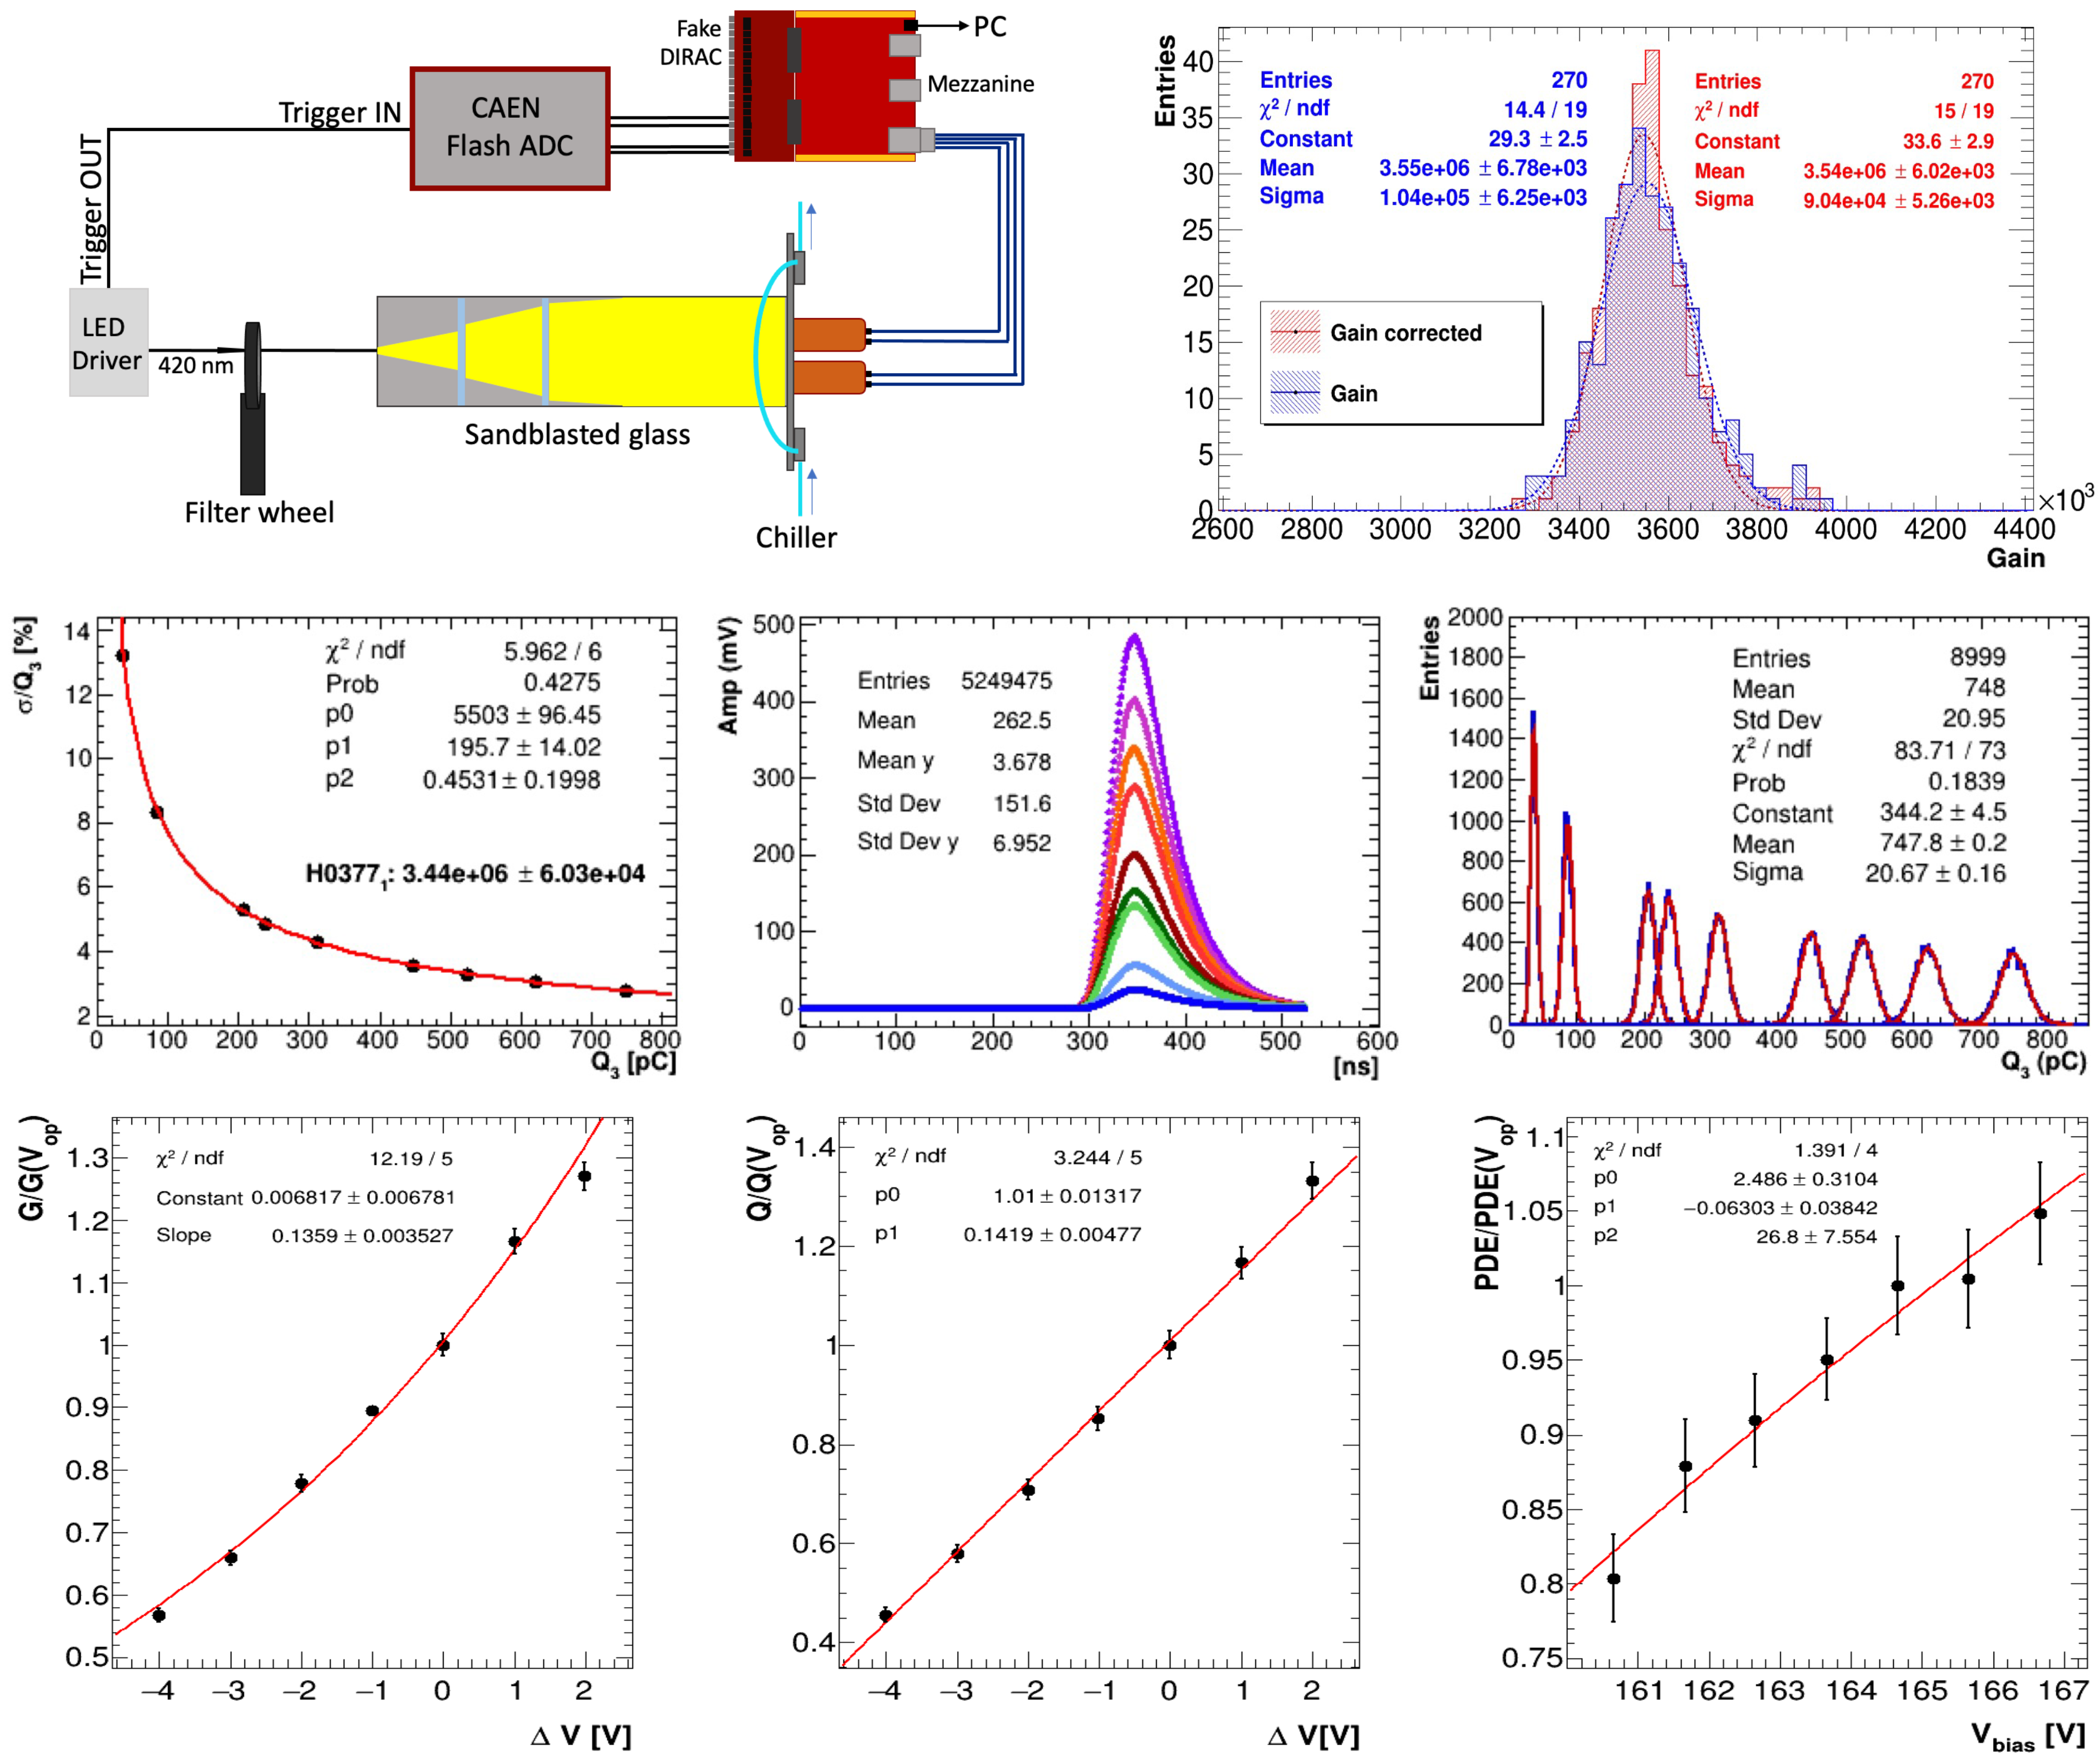
2.6. Signal Reconstruction
3. Qualification and QC
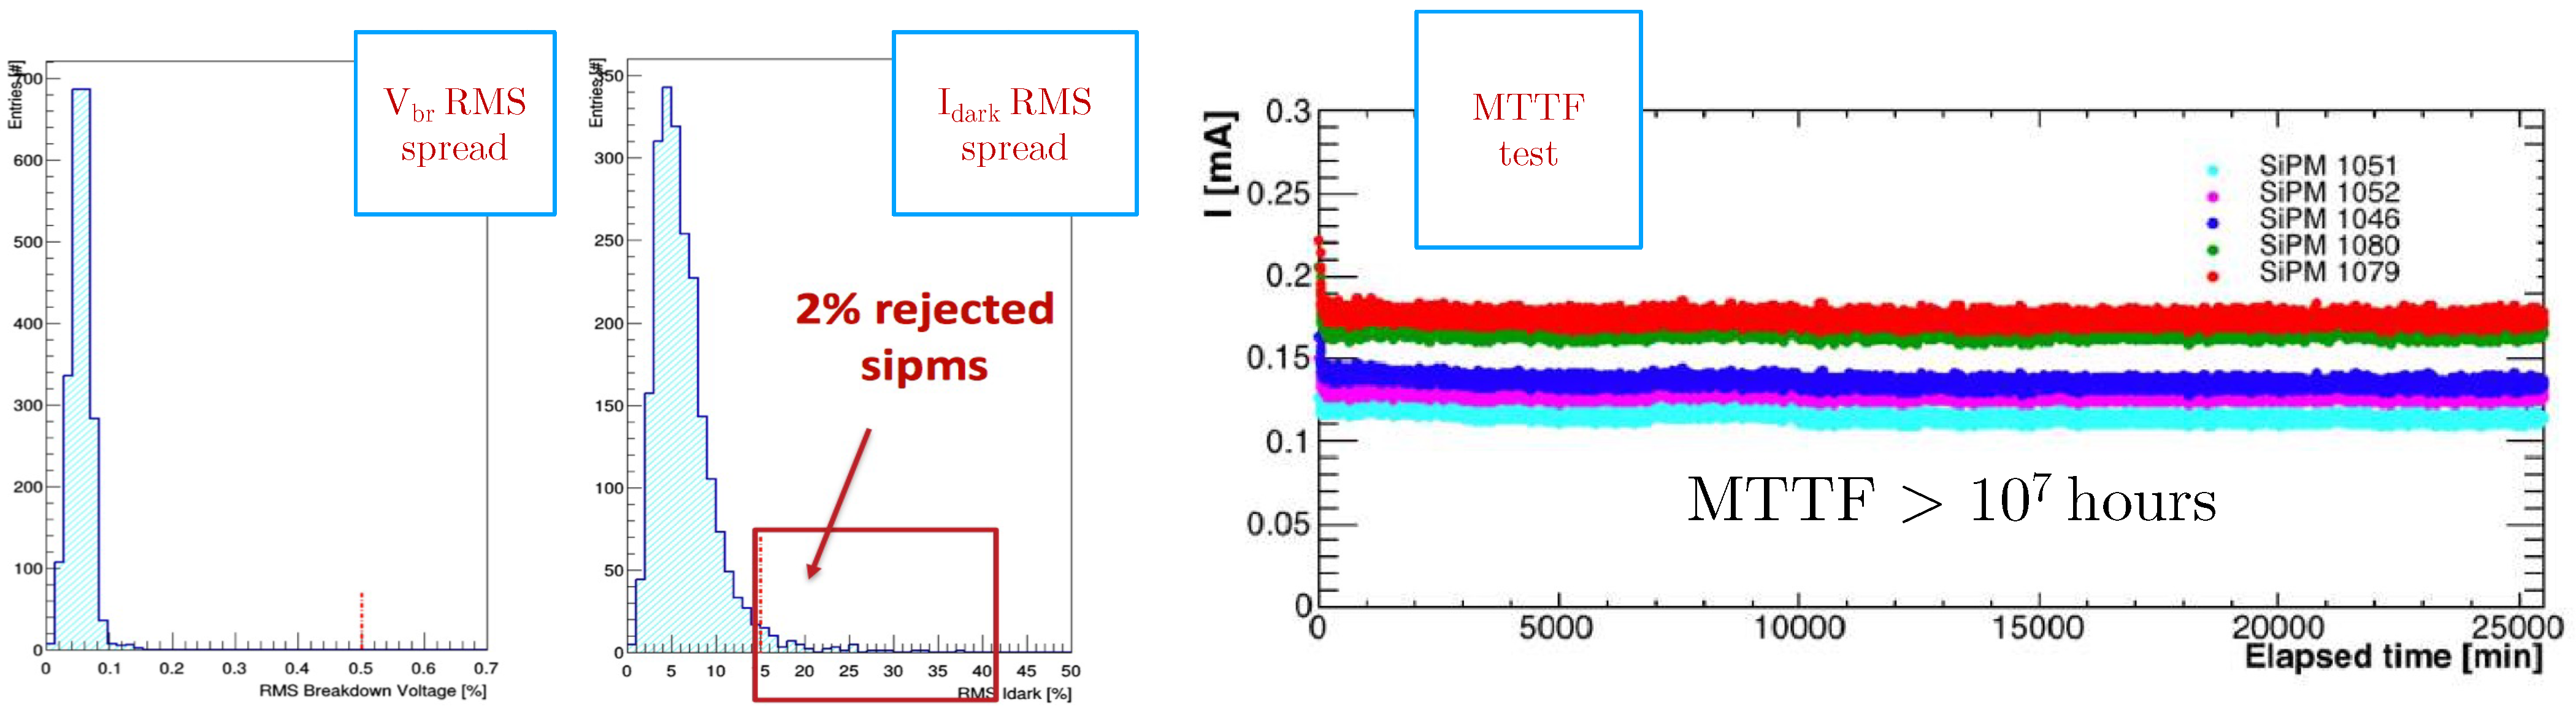
3.1. SiPM
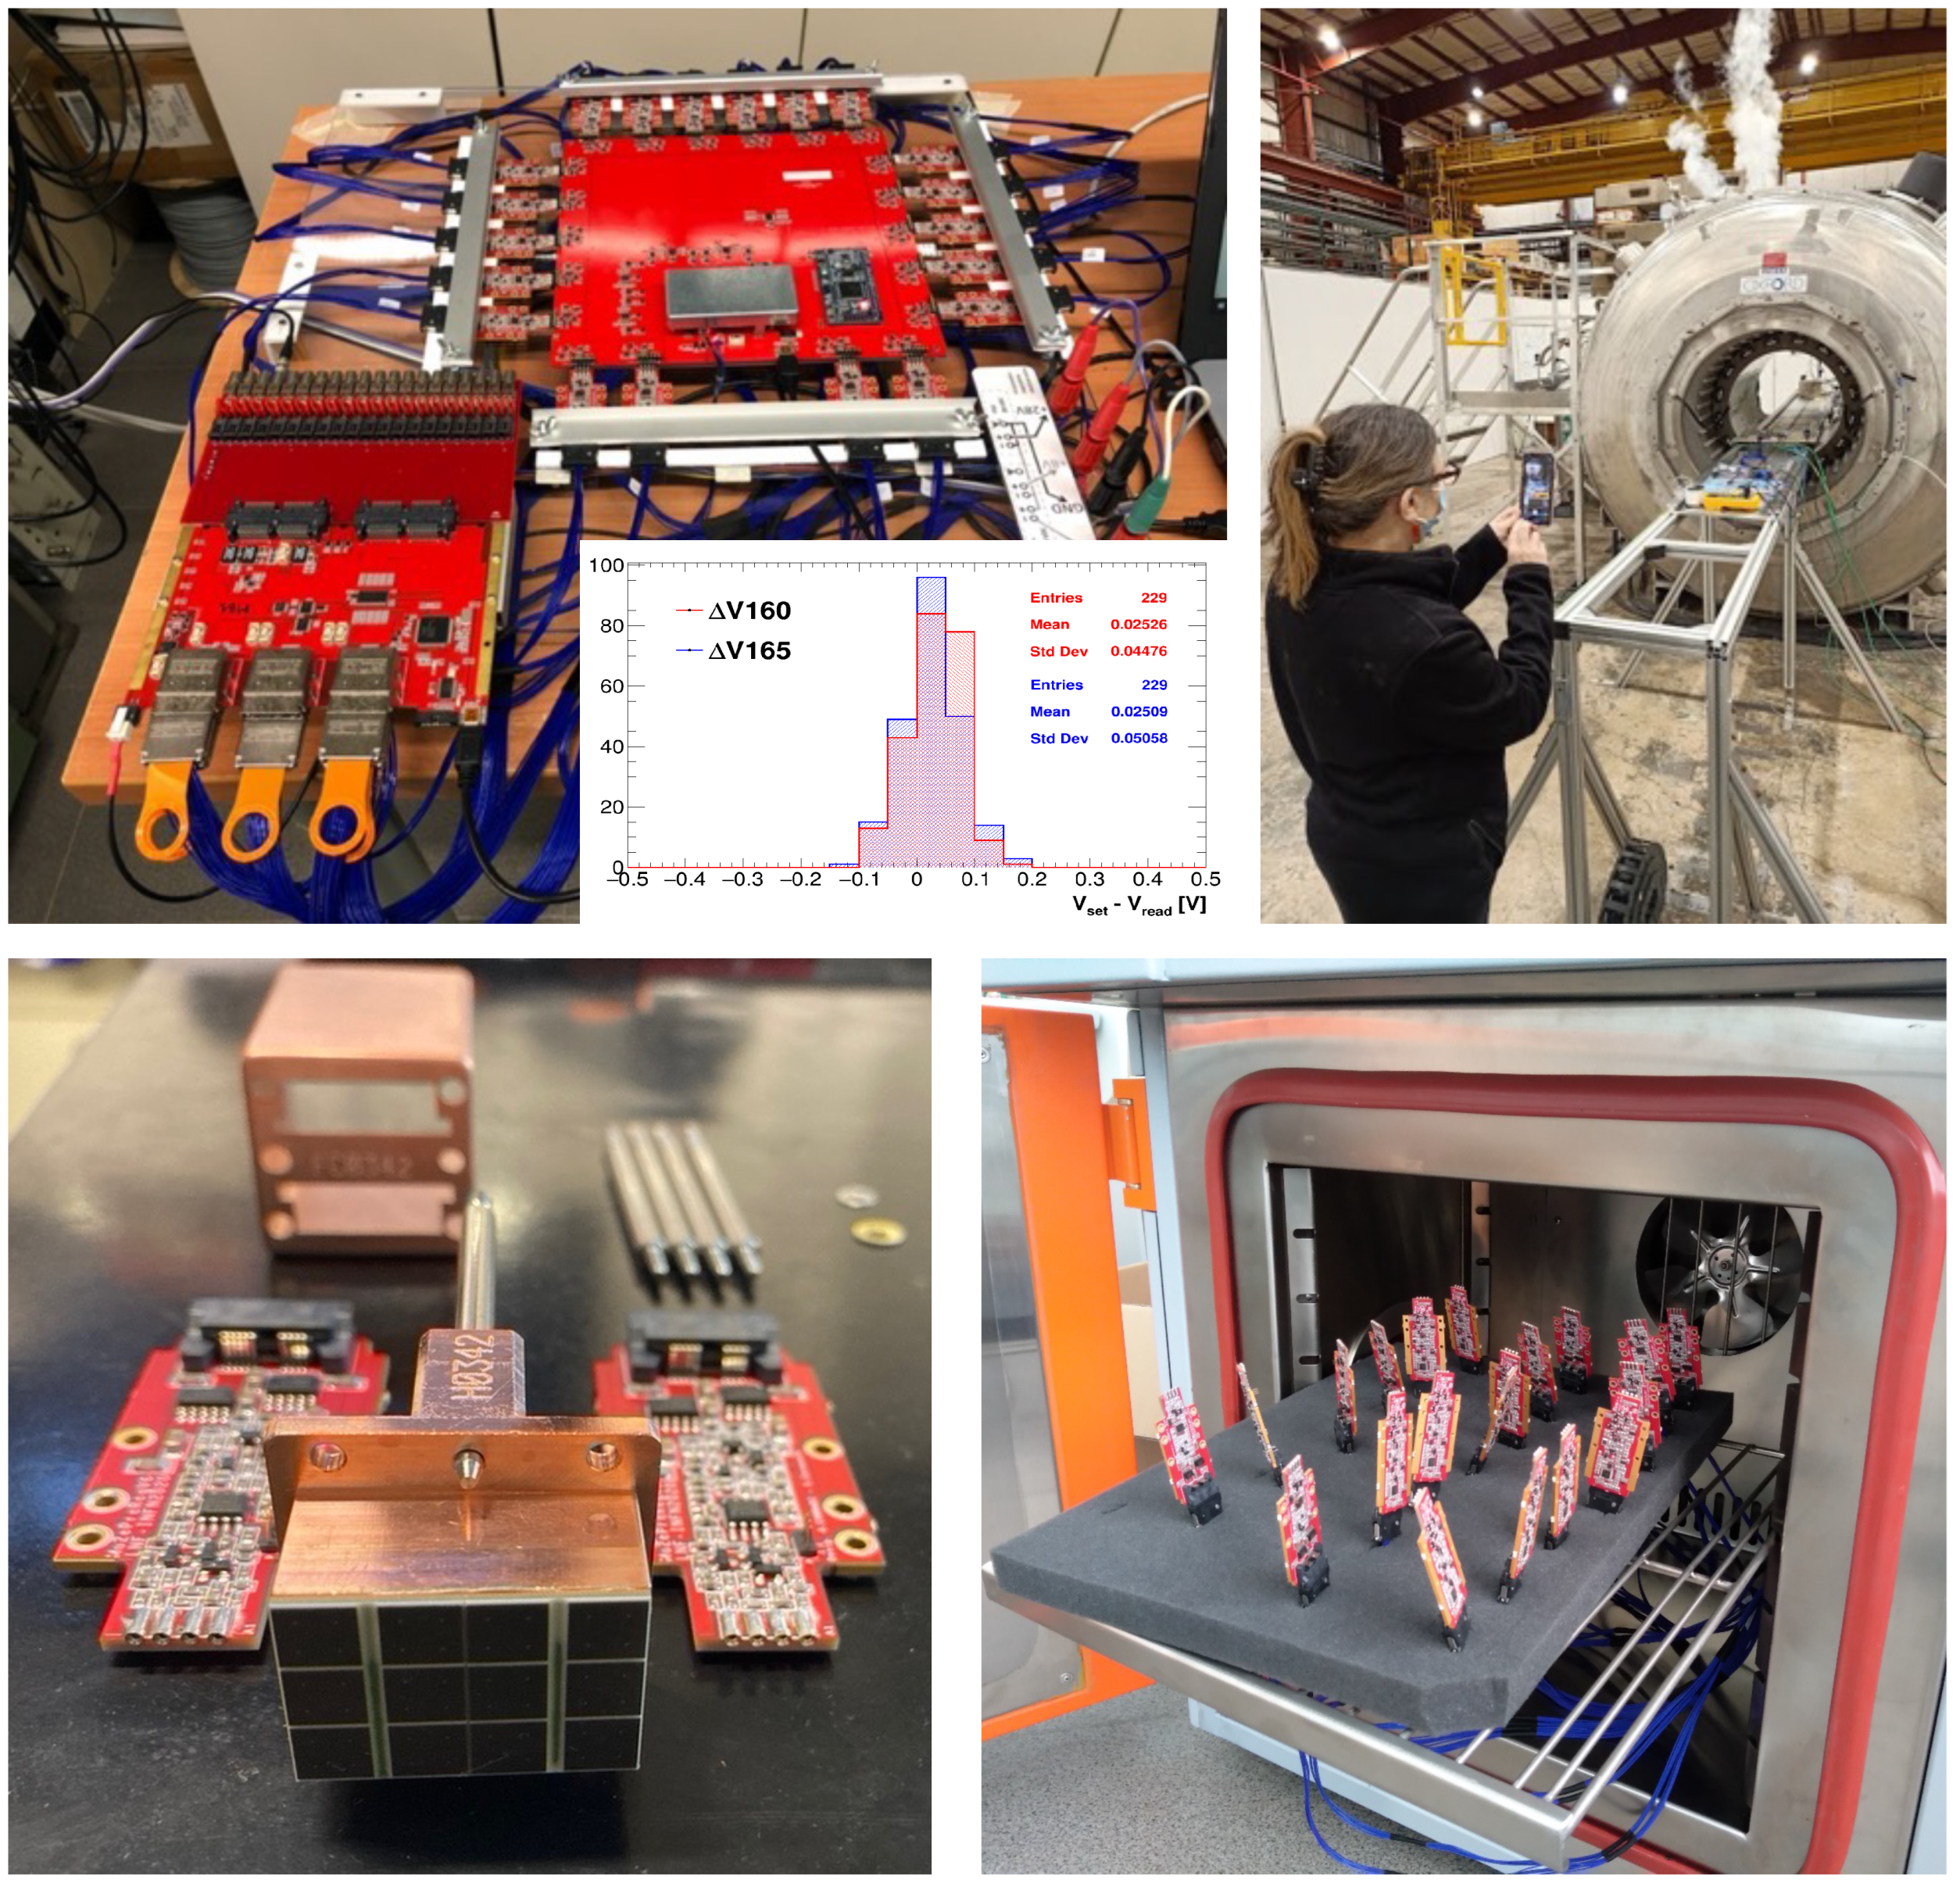
3.2. Electronics Qualification Steps
3.3. Readout Units QC
4. Irradiation Tests of the Readout Electronics
4.1. Radiation Environment and Requirements
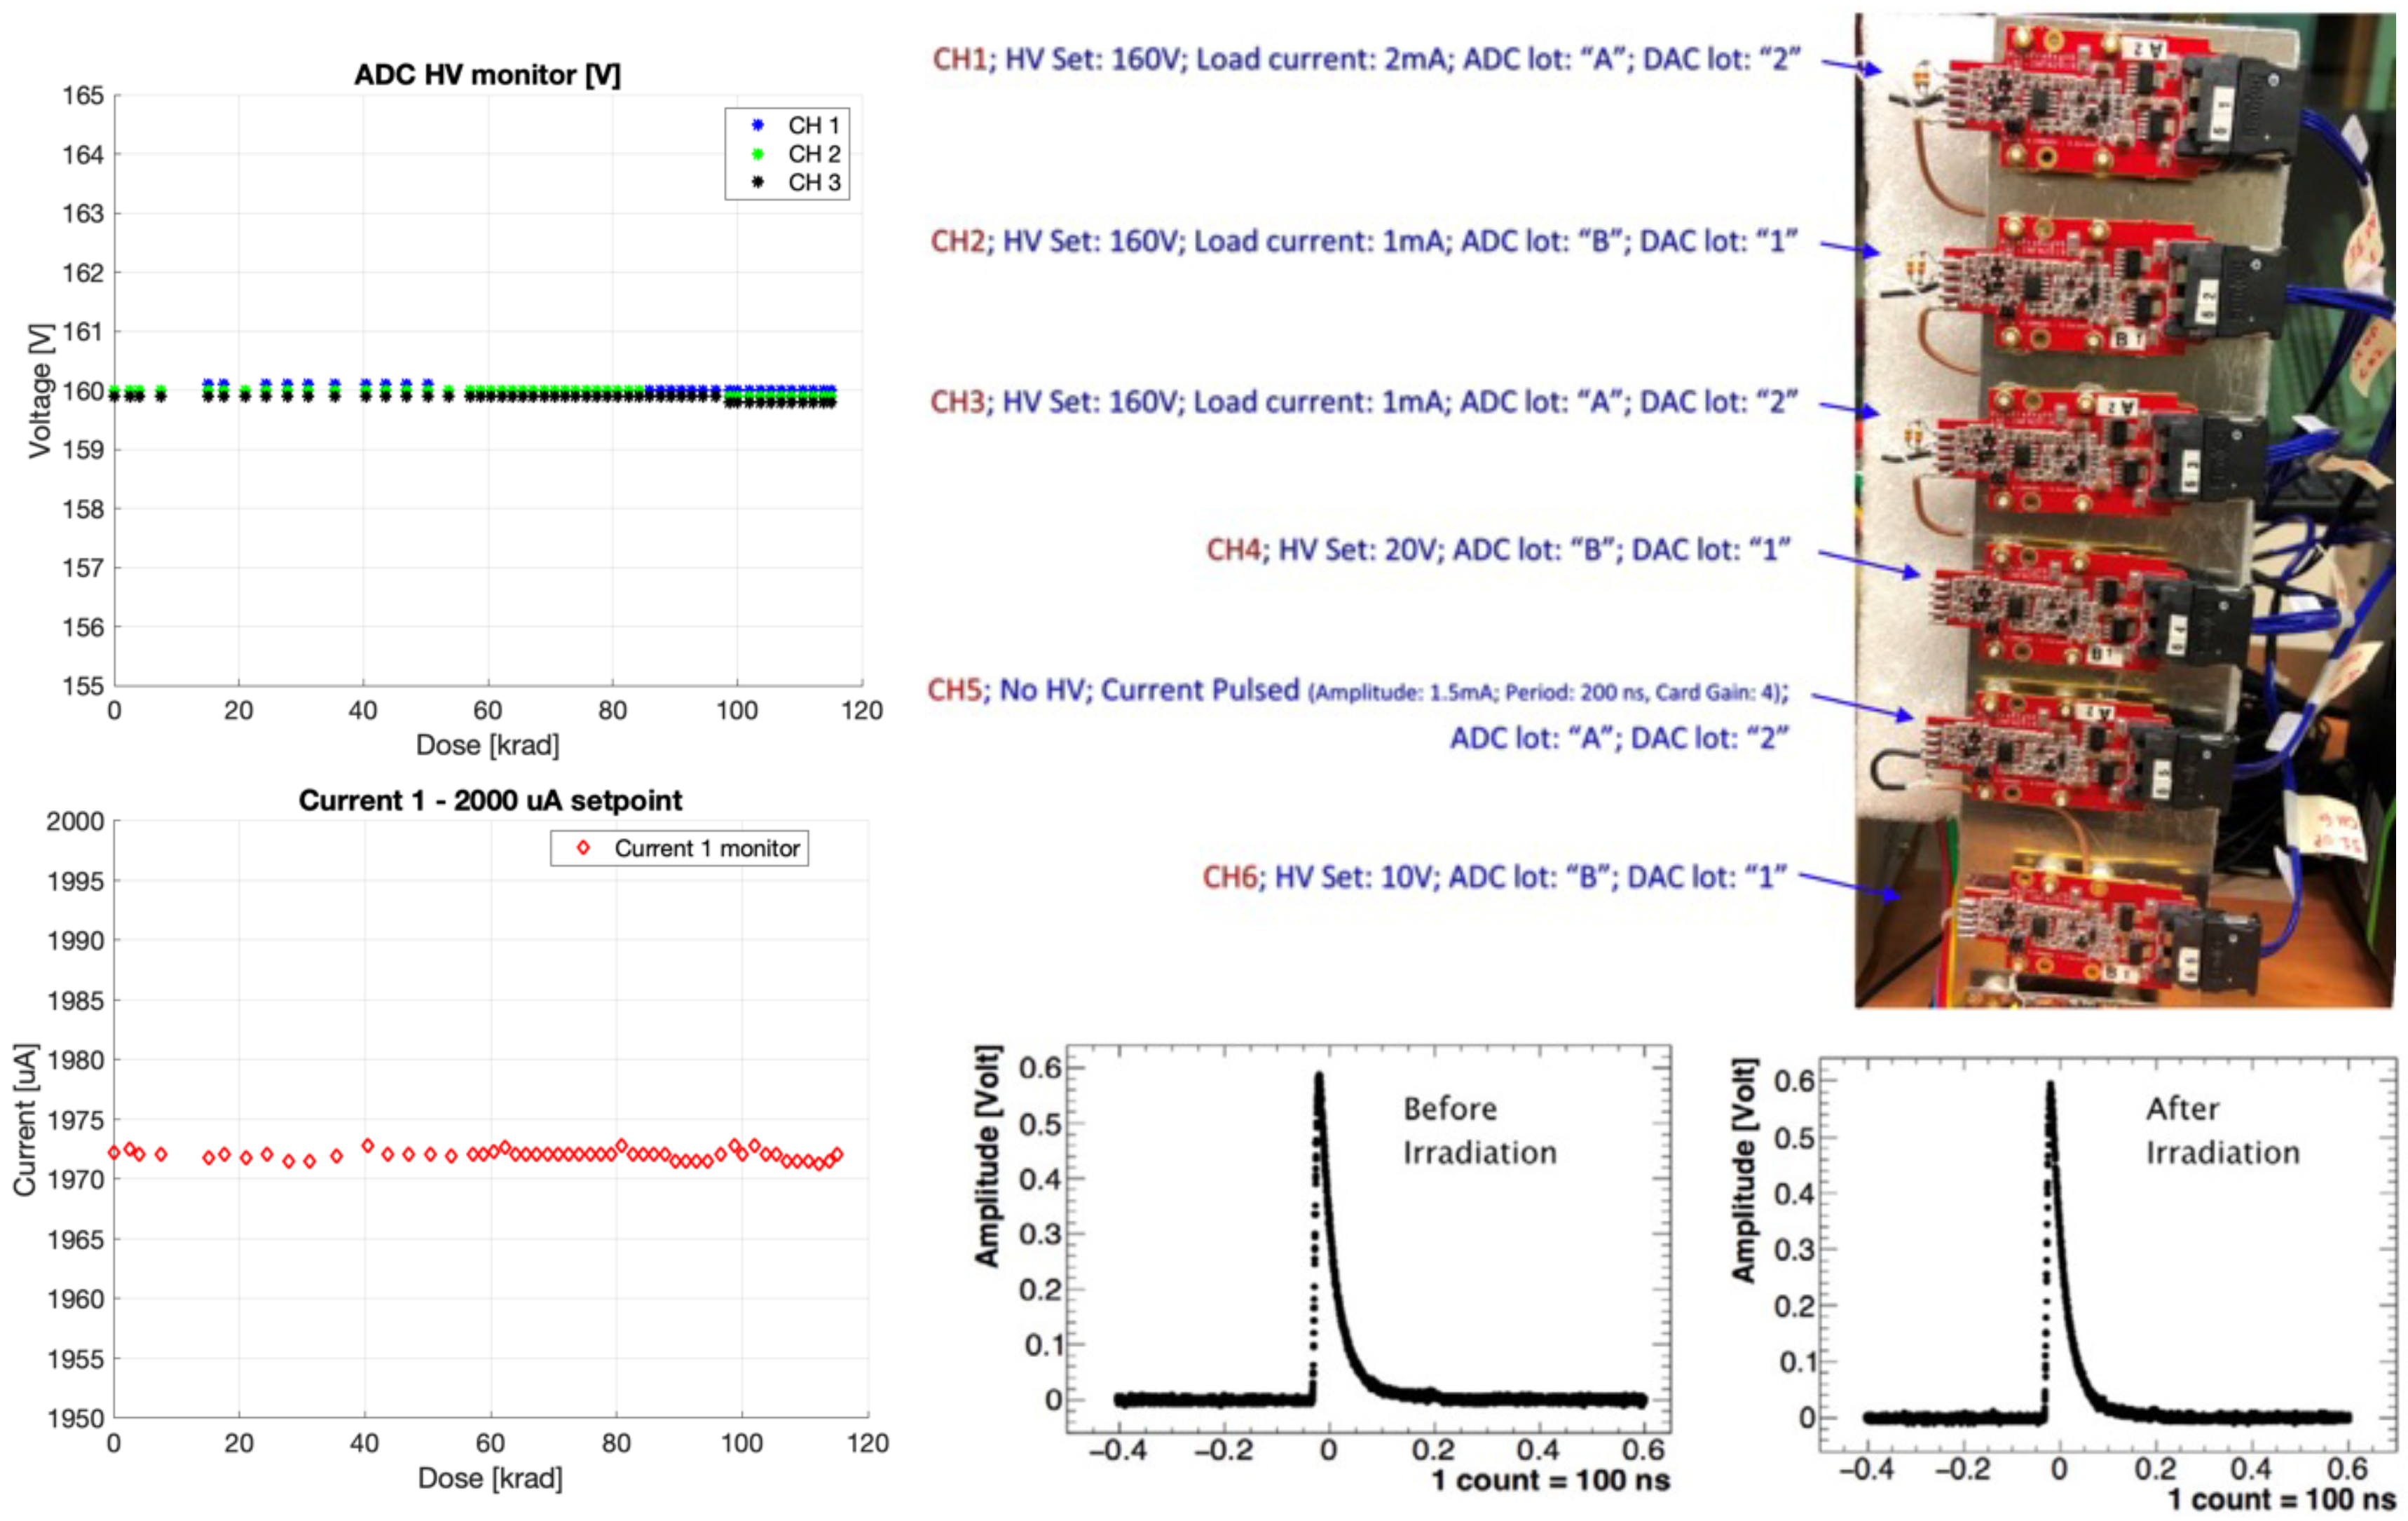
4.2. Ionising Dose Campaign
4.3. Nonionising Dose Campaign
4.4. Single-Event Effects
5. Readout Chain Vertical Slice Test
6. Summary
Author Contributions
Funding
Data Availability Statement
Acknowledgments
Conflicts of Interest
References
- Bartoszek, L.; Barnes, E.; Miller, J.P.; Mott, J.; Palladino, A.; Quirk, J.; Roberts, B.L.; Crnkovic, J.; Polychronakos, V.; Tishchenko, V.; et al. The Mu2e Collaboration, Mu2e technical design report. arXiv 2015, arXiv:1501.05241. [Google Scholar]
- Atanov, N.; Baranov, V.; Budagov, J.; Caiulo, D.; Cervelli, F.; Colao, F.; Zhu, R.Y. Design and test of the Mu2e un-doped CsI + SiPM crystal calorimeter. Nucl. Instrum. Meth. A 2019, 936, 94–97. [Google Scholar] [CrossRef]
- Atanov, N.; Baranov, V.; Borrel, L.; Bloise, C.; Budagov, J.; Ceravolo, S.; Cervelli, F.; Colao, F.; Cordelli, M.; Corradi, G.; et al. The Mu2e crystal calorimeteer: An overview. Instruments 2022, 6, 60. [Google Scholar] [CrossRef]
- Available online: https://www.hamamatsu.com/jp/en.html (accessed on 18 October 2022).
- Gioiosa, A.; Bonventre, R.; Donati, S.; Flumerfelt, E.; Horton-Smith, G.; Morescalchi, L.; Rivera, R.A. Online DAQ and Slow Control Interface for the Mu2e Experiment; Fermi National Accelerator Lab. (FNAL): Batavia, IL, USA, 2022. [Google Scholar]
- Pedreschi, E.; Cervelli, F.; Di Falco, S.; Donati, S.; Morescalchi, L.; Raffaelli, F.; Sarra, I. The DIgitizer ReAdout Controller (DiRAC) of the Mu2e electromagnetic calorimeter at Fermilab. PoS 2020, 119. [Google Scholar] [CrossRef]
- Morescalchi, L.; Cervelli, F.; DiFalco, S.; Donati, S.; Gioiosa, A.; Pasciuto, D.; Sarra, I. The Readout Electronics of the Mu2e Electromagnetic Calorimeter at Fermilab; Fermi National Accelerator Lab. (FNAL): Batavia, IL, USA, 2022. [Google Scholar]
- Cordelli, M.; Cervelli, F.; Diociaiuti, E.; Donati, S.; Donghia, R.; Di Falco, S.; Spinella, F. Pre-production and quality assurance of the Mu2e calorimeter Silicon Photomultipliers. Nucl. Instrum. Meth. A 2018, 912, 347–349. [Google Scholar] [CrossRef]
- Available online: https://www.anl.gov (accessed on 16 October 2022).
- Bloise, C.; Ceravolo, S.; Cervelli, F.; Colao, F.; Cordelli, M.; Corradi, G.; Di Falco, S.; Diociaiuti, E.; Donati, S.; Ferrari, C.; et al. An automated QC station for the calibration of the Mu2e calorimter Readout Units. Nucl. Instrum. Method A, 2022; submitted. [Google Scholar]
- Available online: http://www.fusione.enea.it/LABORATORIES/Tec/FNG.html.it (accessed on 16 October 2022).


Publisher’s Note: MDPI stays neutral with regard to jurisdictional claims in published maps and institutional affiliations. |
© 2022 by the authors. Licensee MDPI, Basel, Switzerland. This article is an open access article distributed under the terms and conditions of the Creative Commons Attribution (CC BY) license (https://creativecommons.org/licenses/by/4.0/).
Share and Cite
Atanov, N.; Baranov, V.; Borrel, L.; Bloise, C.; Budagov, J.; Ceravolo, S.; Cervelli, F.; Colao, F.; Cordelli, M.; Corradi, G.; et al. Mu2e Crystal Calorimeter Readout Electronics: Design and Characterisation. Instruments 2022, 6, 68. https://doi.org/10.3390/instruments6040068
Atanov N, Baranov V, Borrel L, Bloise C, Budagov J, Ceravolo S, Cervelli F, Colao F, Cordelli M, Corradi G, et al. Mu2e Crystal Calorimeter Readout Electronics: Design and Characterisation. Instruments. 2022; 6(4):68. https://doi.org/10.3390/instruments6040068
Chicago/Turabian StyleAtanov, Nikolay, Vladimir Baranov, Leo Borrel, Caterina Bloise, Julian Budagov, Sergio Ceravolo, Franco Cervelli, Francesco Colao, Marco Cordelli, Giovanni Corradi, and et al. 2022. "Mu2e Crystal Calorimeter Readout Electronics: Design and Characterisation" Instruments 6, no. 4: 68. https://doi.org/10.3390/instruments6040068
APA StyleAtanov, N., Baranov, V., Borrel, L., Bloise, C., Budagov, J., Ceravolo, S., Cervelli, F., Colao, F., Cordelli, M., Corradi, G., Davydov, Y., Di Falco, S., Diociaiuti, E., Donati, S., Echenard, B., Ferrari, C., Gioiosa, A., Giovannella, S., Giusti, V., ... Zhu, R.-Y. (2022). Mu2e Crystal Calorimeter Readout Electronics: Design and Characterisation. Instruments, 6(4), 68. https://doi.org/10.3390/instruments6040068