Article

Energy Resolution Studies in Simulation for the IDEA Dual-Readout Calorimeter Prototype

by Andreas Loeschcke Centeno on behalf of the IDEA Dual-Readout Collaboration
Department of Physics and Astronomy, University of Sussex, Brighton BN1 9RH, UK
Instruments 2022, 6(4), 44; https://doi.org/10.3390/instruments6040044
Submission received: 18 August 2022 / Revised: 2 September 2022 / Accepted: 5 September 2022 / Published: 20 September 2022

Abstract

:
Precision measurements of Z, W, and H decays at the next generation of circular lepton colliders will require excellent energy resolution for both electromagnetic and hadronic showers. The resolution is limited by event-to-event fluctuations in the shower development, especially in the hadronic system. Compensating for this effect can greatly improve the achievable energy resolution. Furthermore, the resolution can benefit greatly from the use of particle-flow algorithms, which requires the calorimeters to have a high granularity. The approach of dual-readout calorimetry has emerged as a candidate to fulfil both of these requirements by allowing to reconstruct the fluctuations in the shower development event-by-event and offering a high transverse granularity. An important benchmark of such a calorimeter is the electromagnetic energy resolution; a prototype of the IDEA calorimeter has been built for use in testbeams. In parallel, a simulation of this prototype has been developed in Geant4 for a testbeam environment. Here, we outline how this simulation was used to study the electromagnetic energy resolution and conclude that a resolution of 14 % / E is achievable.

1. Introduction

The main purpose of a dual-readout calorimeter is to significantly improve the resolution of the energy measurement for hadronic showers. This is obtained thanks to an event-by-event determination of the electromagnetic fraction of the shower.
The energy resolution of hadronic calorimeters is, in fact, in part, limited by fluctuations in the electromagnetic (EM) component from neutral pion decays in the induced particle shower [1]. Generally, the EM response (e) and non-EM response (h) of the calorimeter—where response is defined as the conversion efficiency from energy deposit to generated signal—are different ( e / h 1 ) mainly due to invisible energy (mostly energy that is lost to binding energy in nuclear reactions). In this case, the hadronic energy resolution is dominated by the fluctuation in the fraction of energy deposited in the EM component f EM [2]. There are calorimeters, called compensating calorimeters, which counteract this effect by achieving e / h = 1 , for instance the ZEUS barrel calorimeter [3]. However, in the past 25 years, a new approach has been developed to mitigate the effect of fluctuations in f EM . In dual-readout calorimetry, two independent readout channels are used, namely a scintillation and a Cherenkov channel, which deliver complementary information about the EM and non-EM shower development. This allows us to measure f EM event-by-event and correct for it when reconstructing the total shower energy, which can be calculated from the Cherenkov and scintillation signals with the dual-readout formula outlined in [2] for which the calorimeter specific value e / h needs to be known. The combination of the two channels yields a superior result in the energy resolution than an equivalent single-readout calorimeter.
For more information on dual-readout calorimetry, please see [1,2].

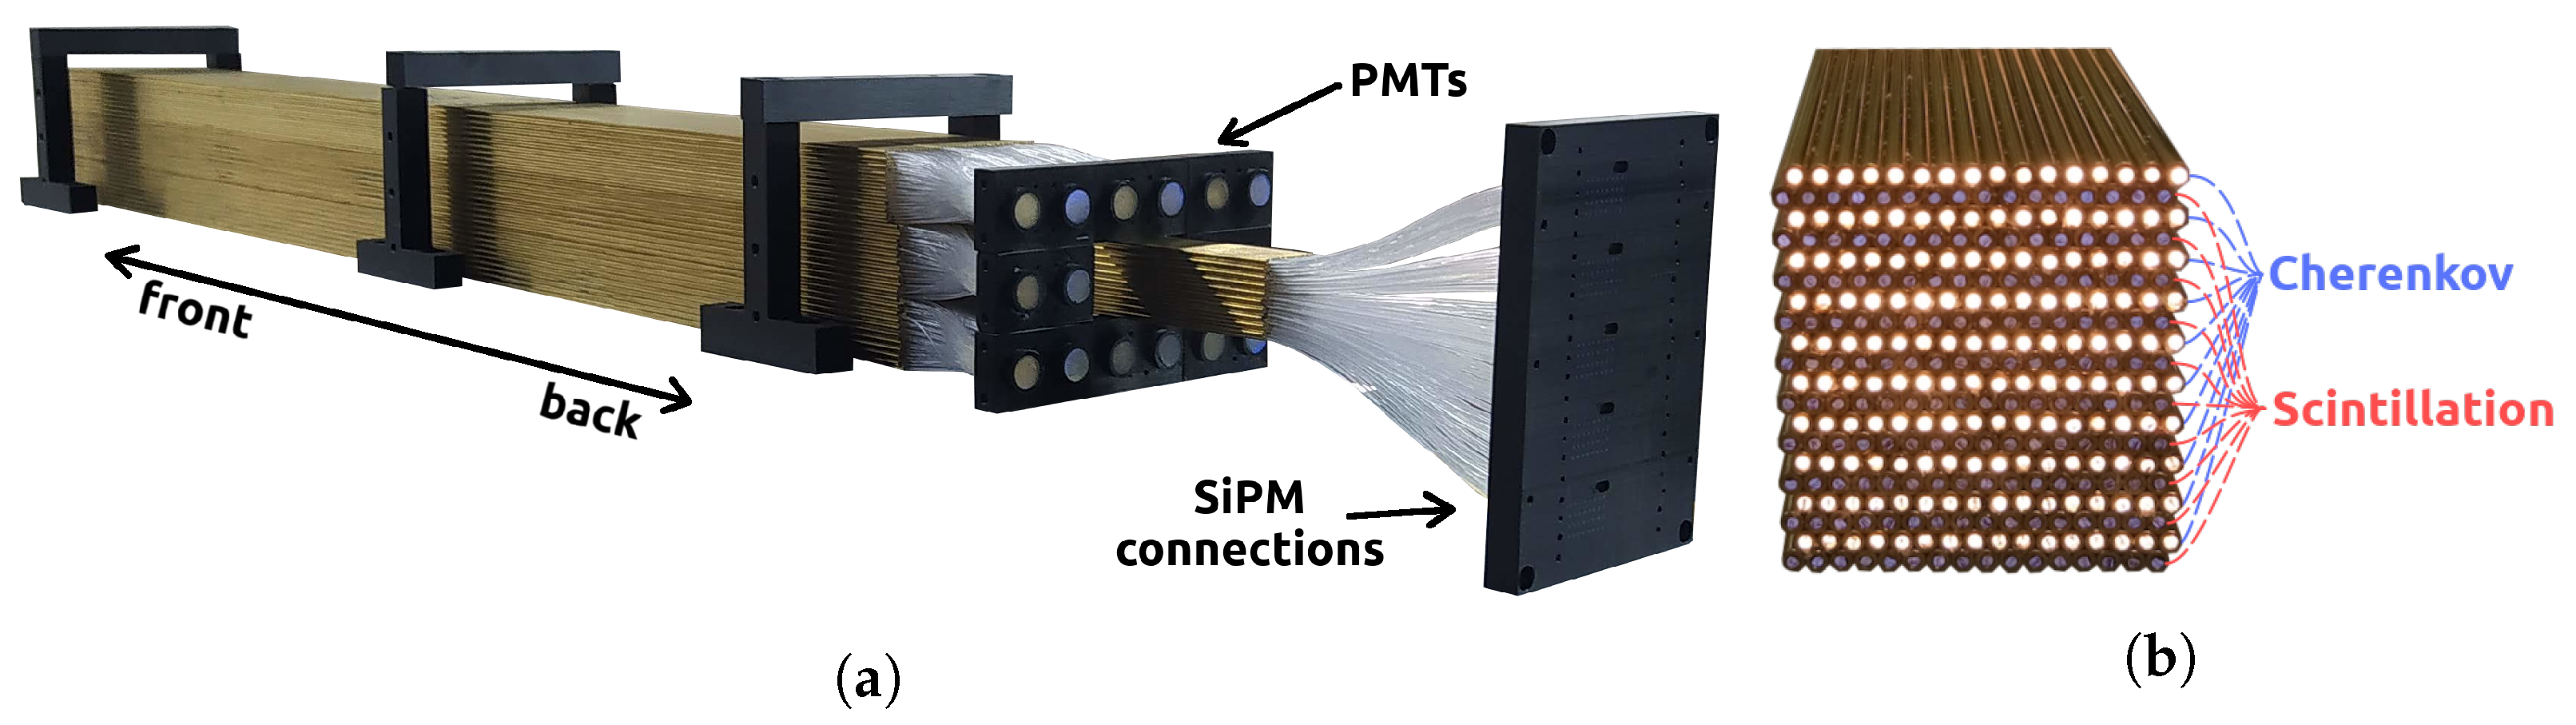
2. Prototype for Testbeams

A prototype of the IDEA dual-readout calorimeter [4], shown in Figure 1a, has been built for use in testbeams to study the EM energy resolution performance of this calorimeter. The dimensions of this prototype are 10 × 10 × 100 cm3, sufficient to contain an EM shower with incoming energies up to 100 GeV better than 94%. This prototype also serves as a testing ground for the “Bucatini” layout structure, where the passive material is shaped in the form of capillary brass tubes housing the fibres, which are read out in the back. In this structure, the fibres are assembled in alternating rows, as shown in Figure 1b. The prototype is subdivided into 3 × 3 towers, each containing 320 fibres, half of which are Saint Gobain BC-10 scintillation fibres and the other half Mitsubishi SK-40 Cherenkov fibres. In the central tower, the fibres are connected to one Hamamatsu S14160-1315 PS Silicon Photomultiplier (SiPM) each. Those are then read out by five CAEN A5202 readout boards. For the surrounding eight towers, all fibres of a respective channel are bundled and connected to one Hamamatsu R-5900 Photomultiplier (PMT), resulting in a total of 16 PMTs. These connections can be seen on the backside of the prototype in Figure 1a.
A simulation of this prototype in a ‘testbeam configuration’ in Geant4 has been developed [6]. This configuration includes a rotation angle of 1° around the vertical axis, which was also present at the testbeam activities.
The simulation was validated using data from two testbeam campaigns using an e + beam, one at DESY in June 2021 with energies of 1–6 GeV and one at SPS in August 2021 with energies of 10–120 GeV. The validation was conducted by comparing shower profiles as a function of distance from the shower central axis [7].

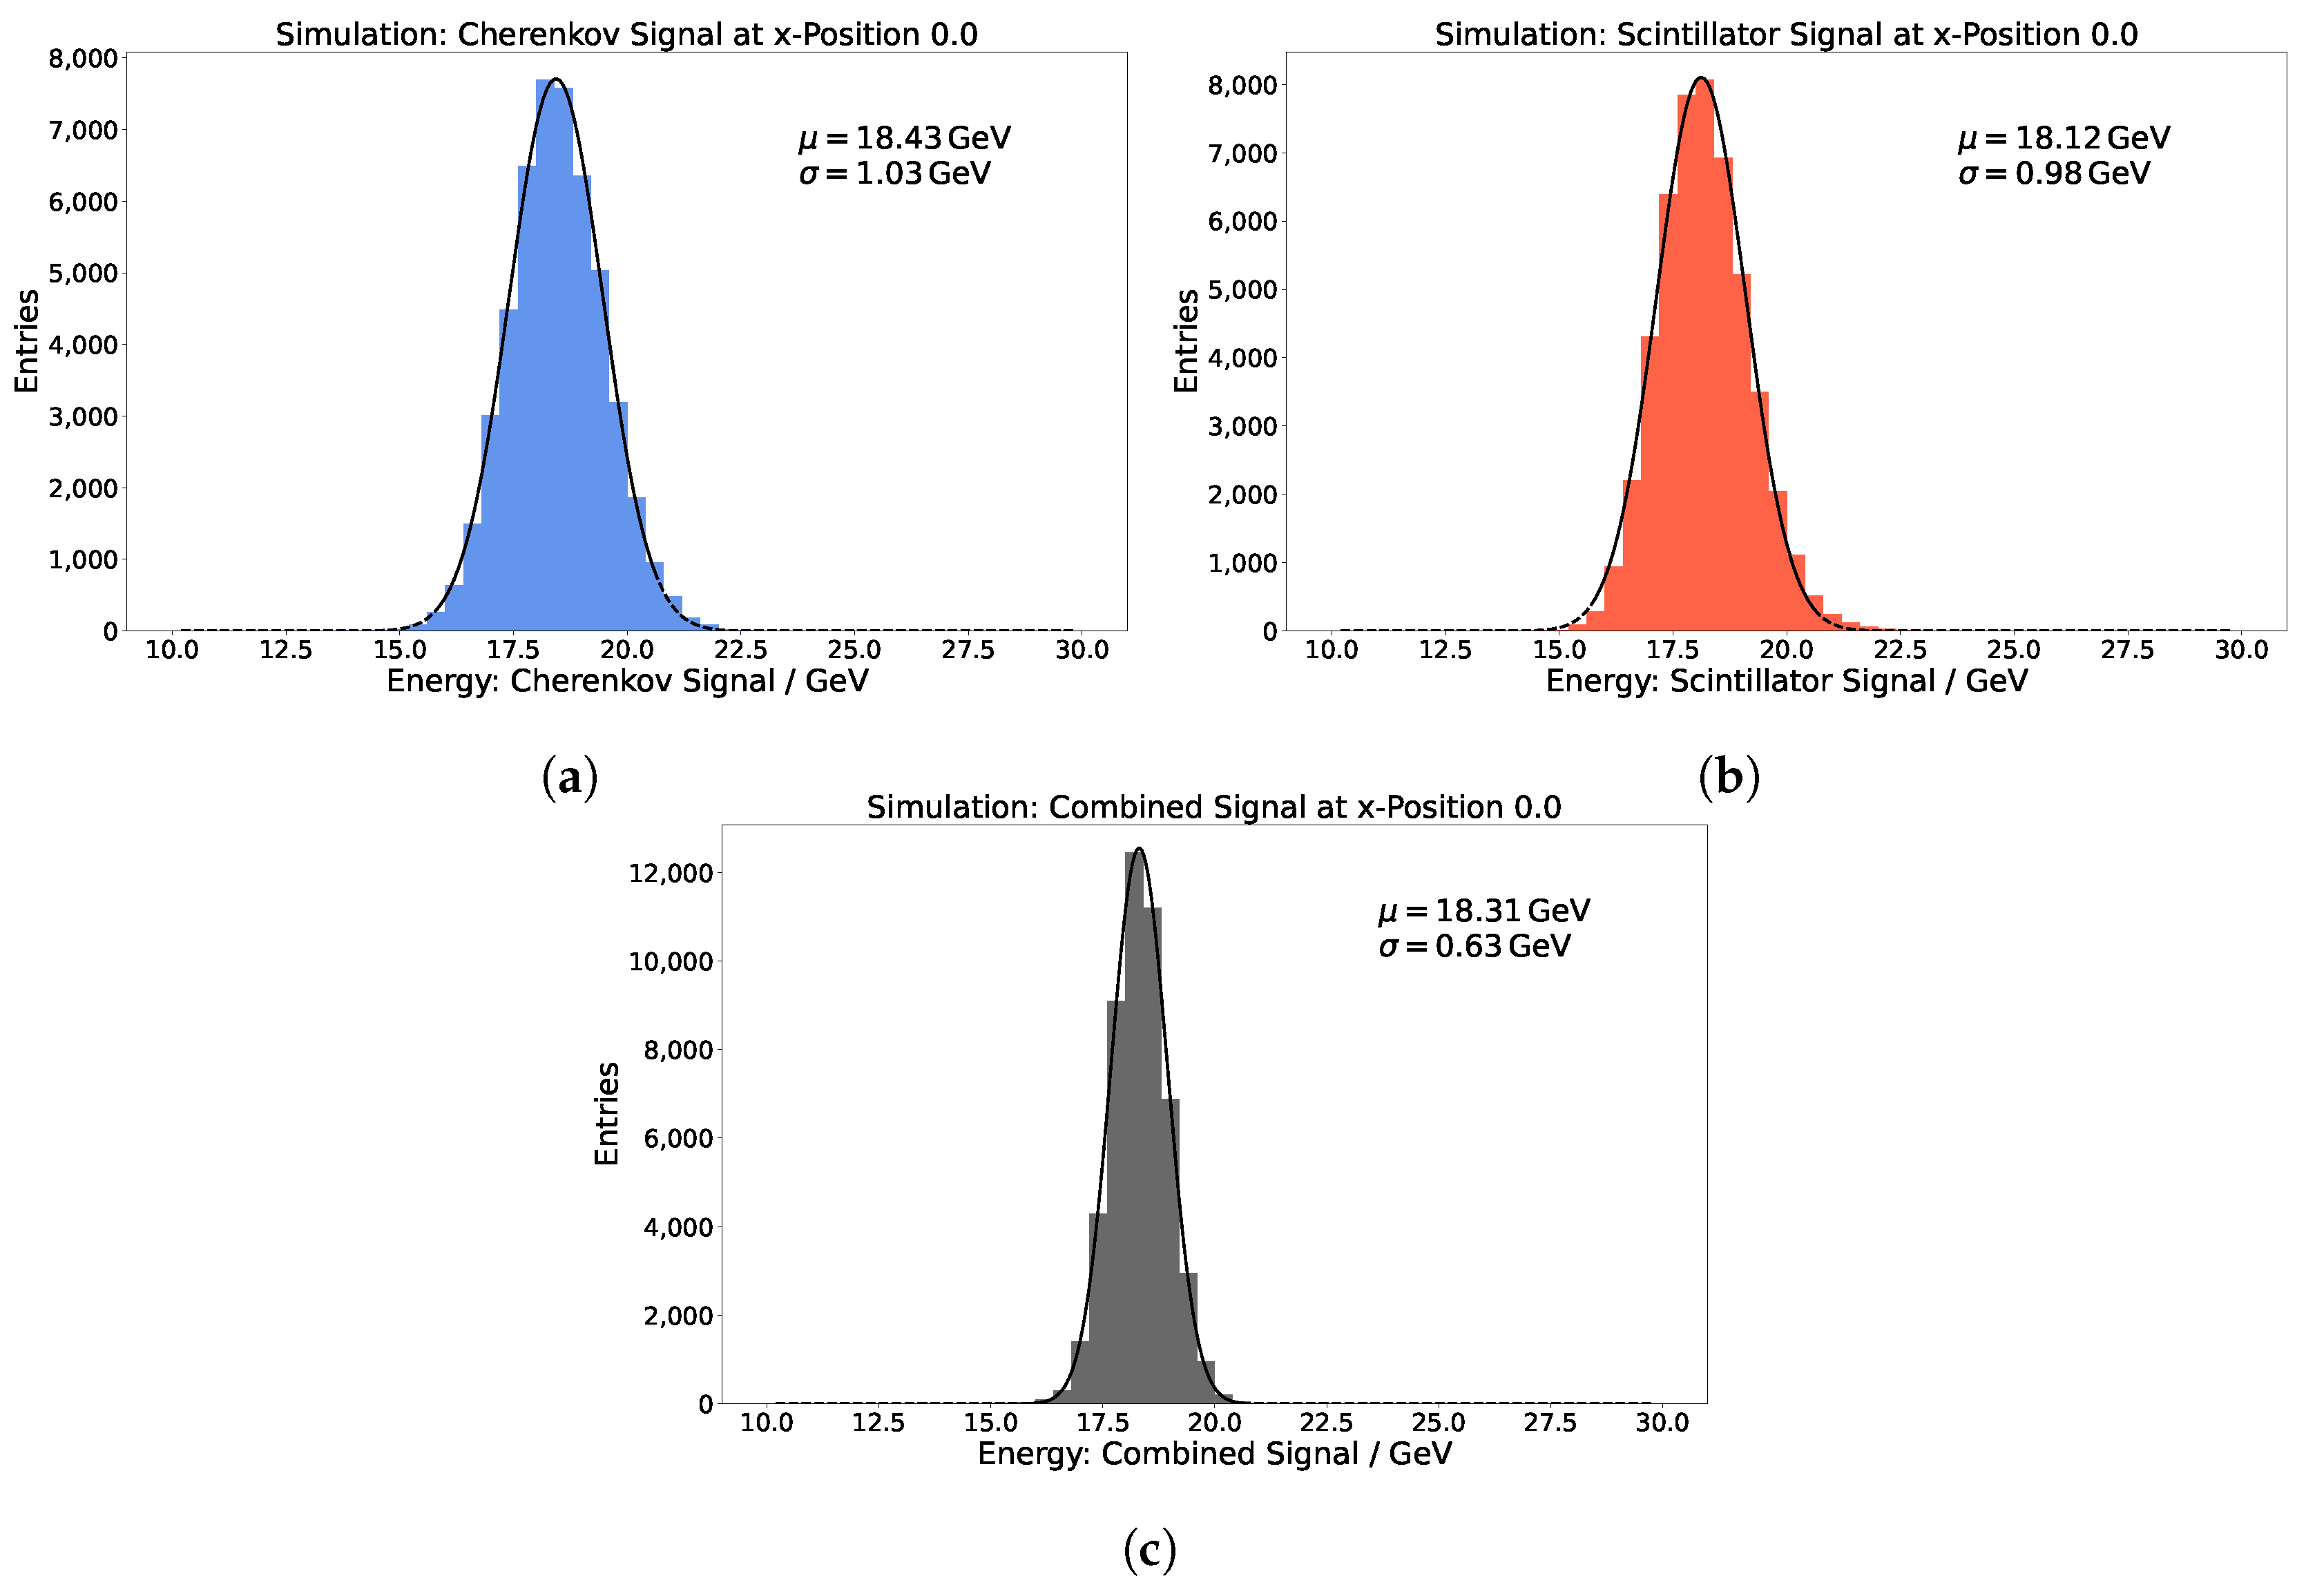
3. Electromagnetic Energy Resolution

The first step in the simulation to study the EM energy resolution was to investigate the dependence on the beam impact point position; indeed, testbeam data showed varying calorimeter responses correlated with the alternating row layout of the prototype. In an actual experiment, knowing the behaviour in the calorimeter response as a function of the particle impact point allows us to correct for any observed effects once the impact point has been determined, e.g., by the use of particle flow algorithms [8].

3.1. Simulation Setup

We simulated a pencil-like beam with no radial extension at 19 different positions, as shown in Figure 2. The positions were chosen such that the beam centrally hits either one of the brass tubes, the gap in between the tubes, a scintillation fibre, or a Cherenkov fibre. Having this many different beam positions allows us to check for the periodicity of the response with three half-periods, which should exhibit the same behaviour.

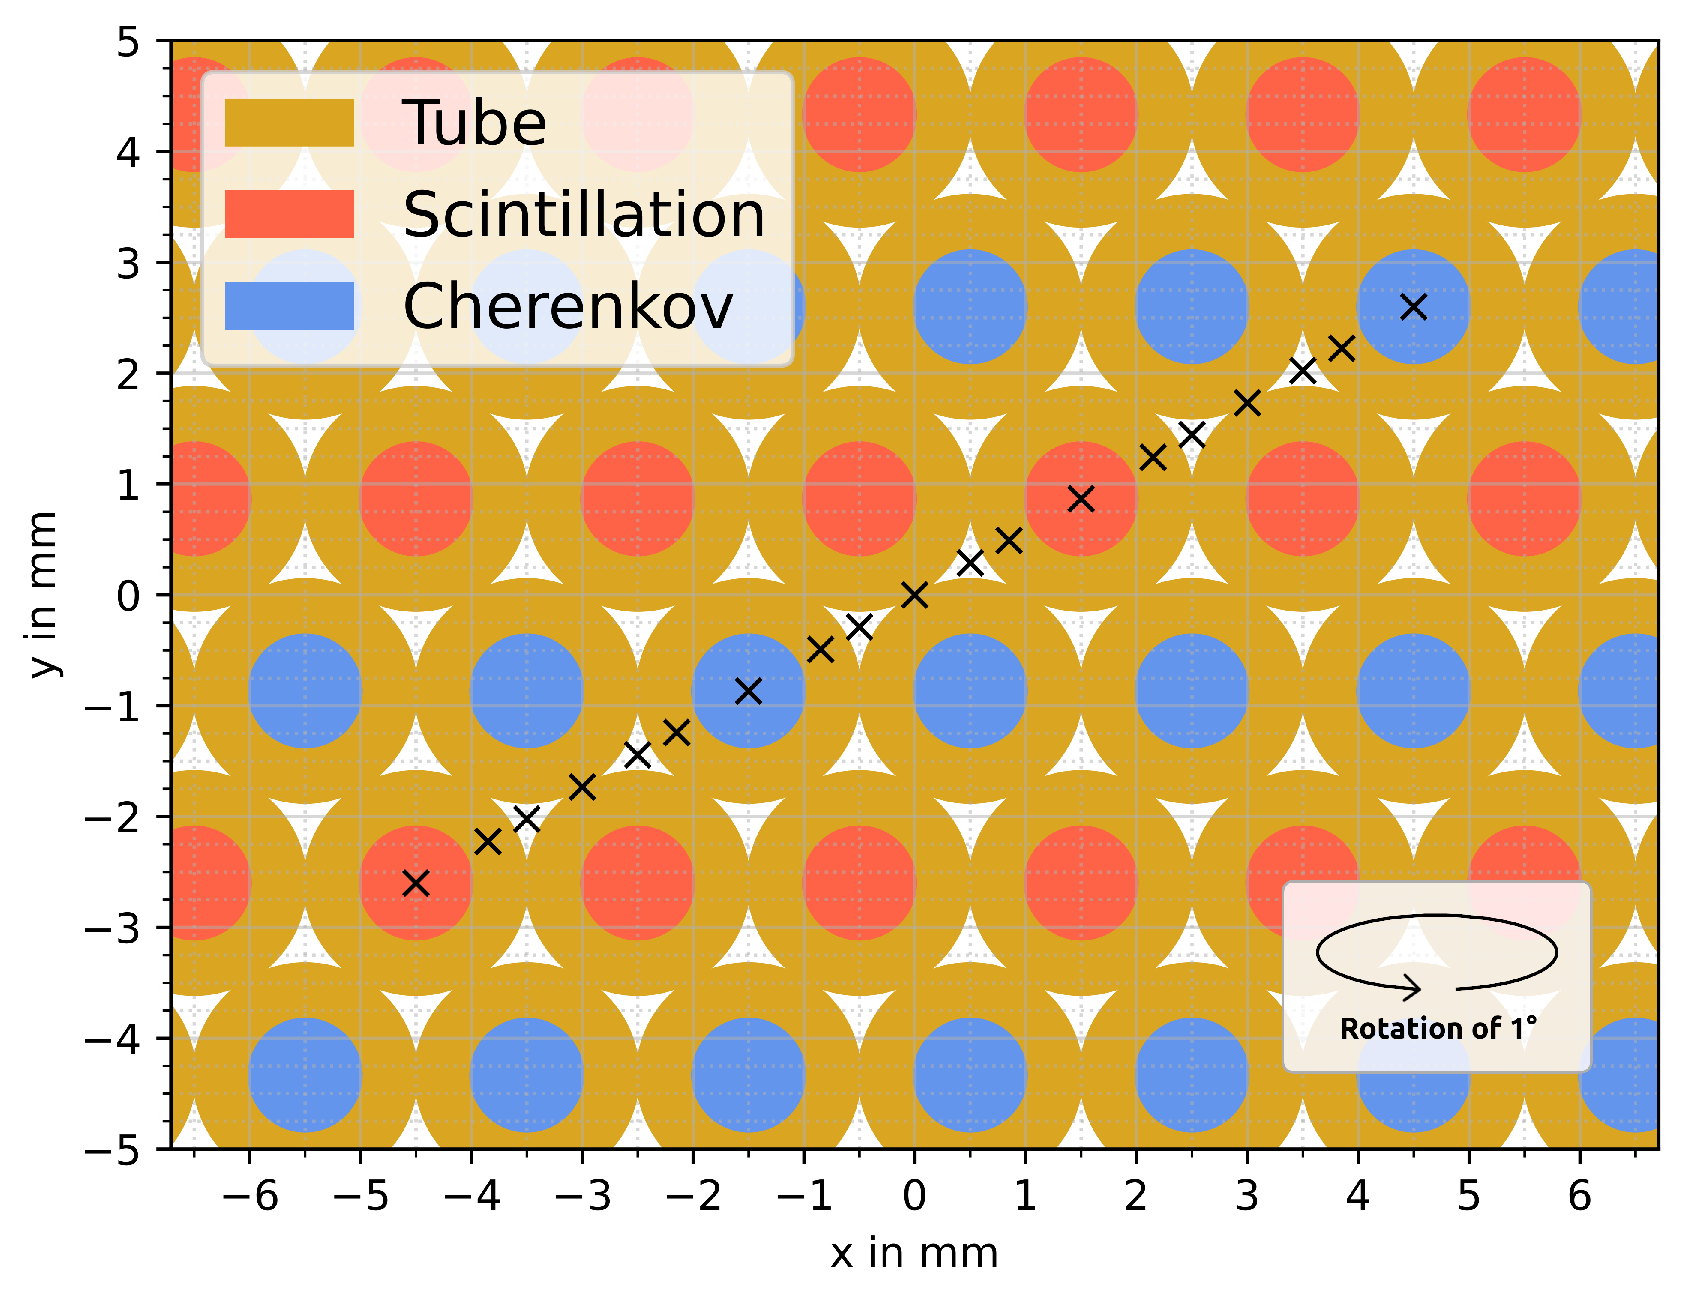
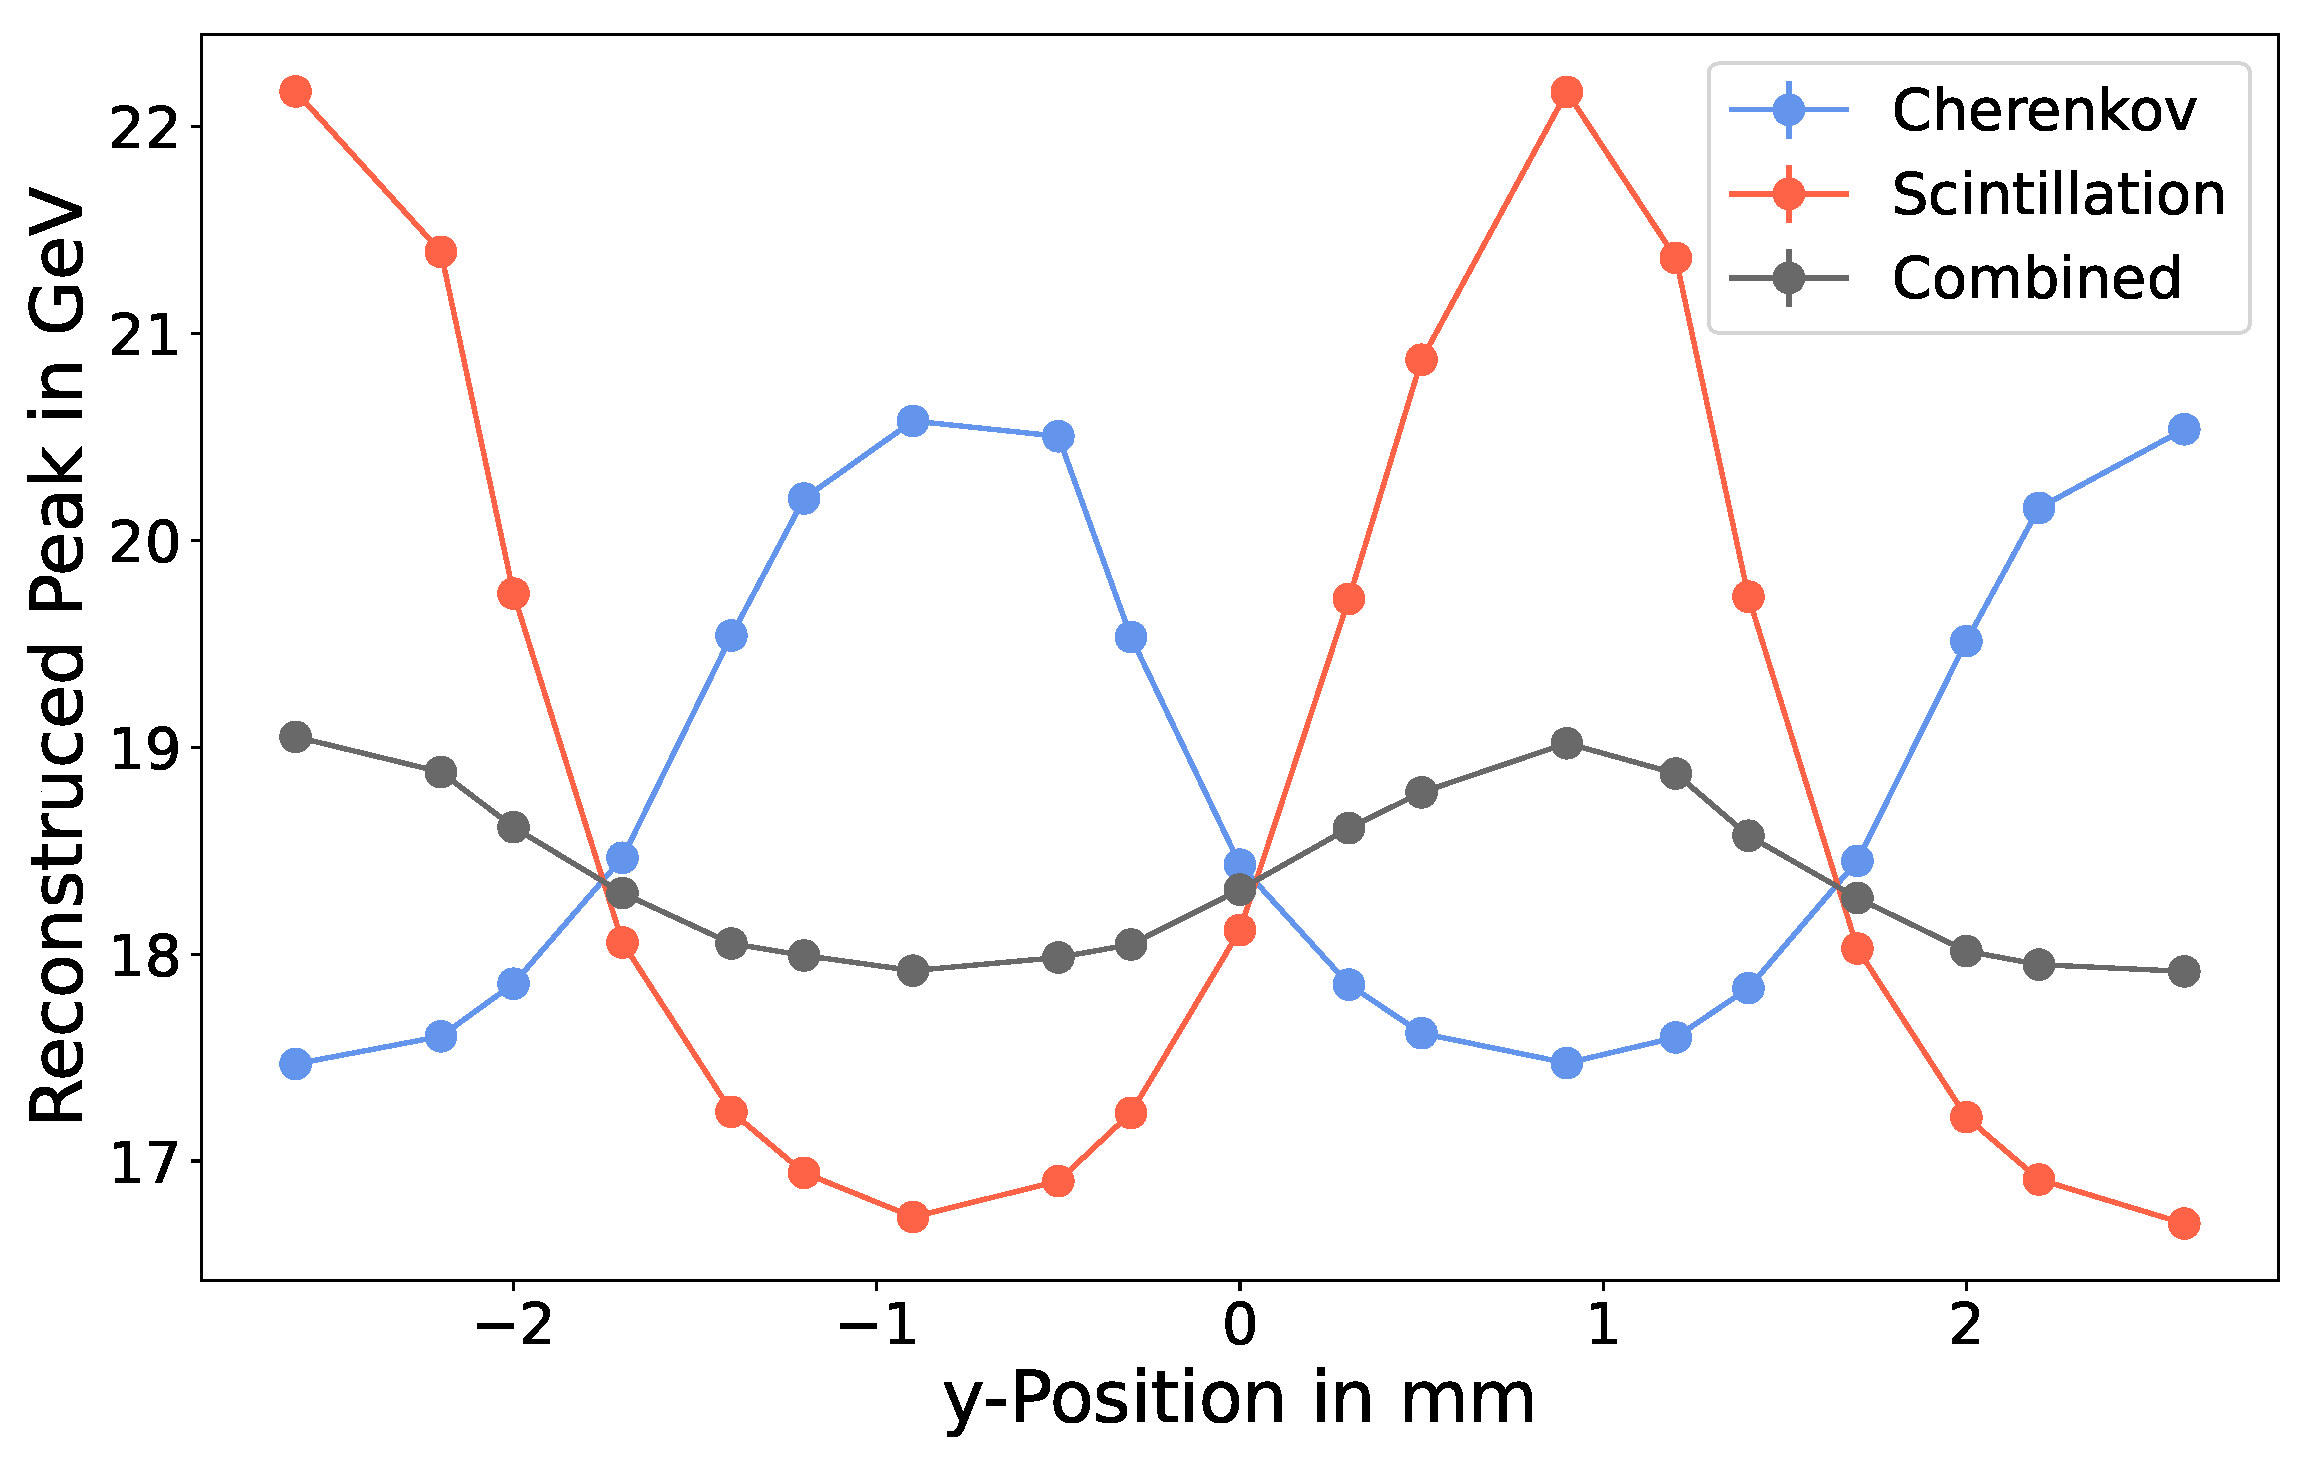
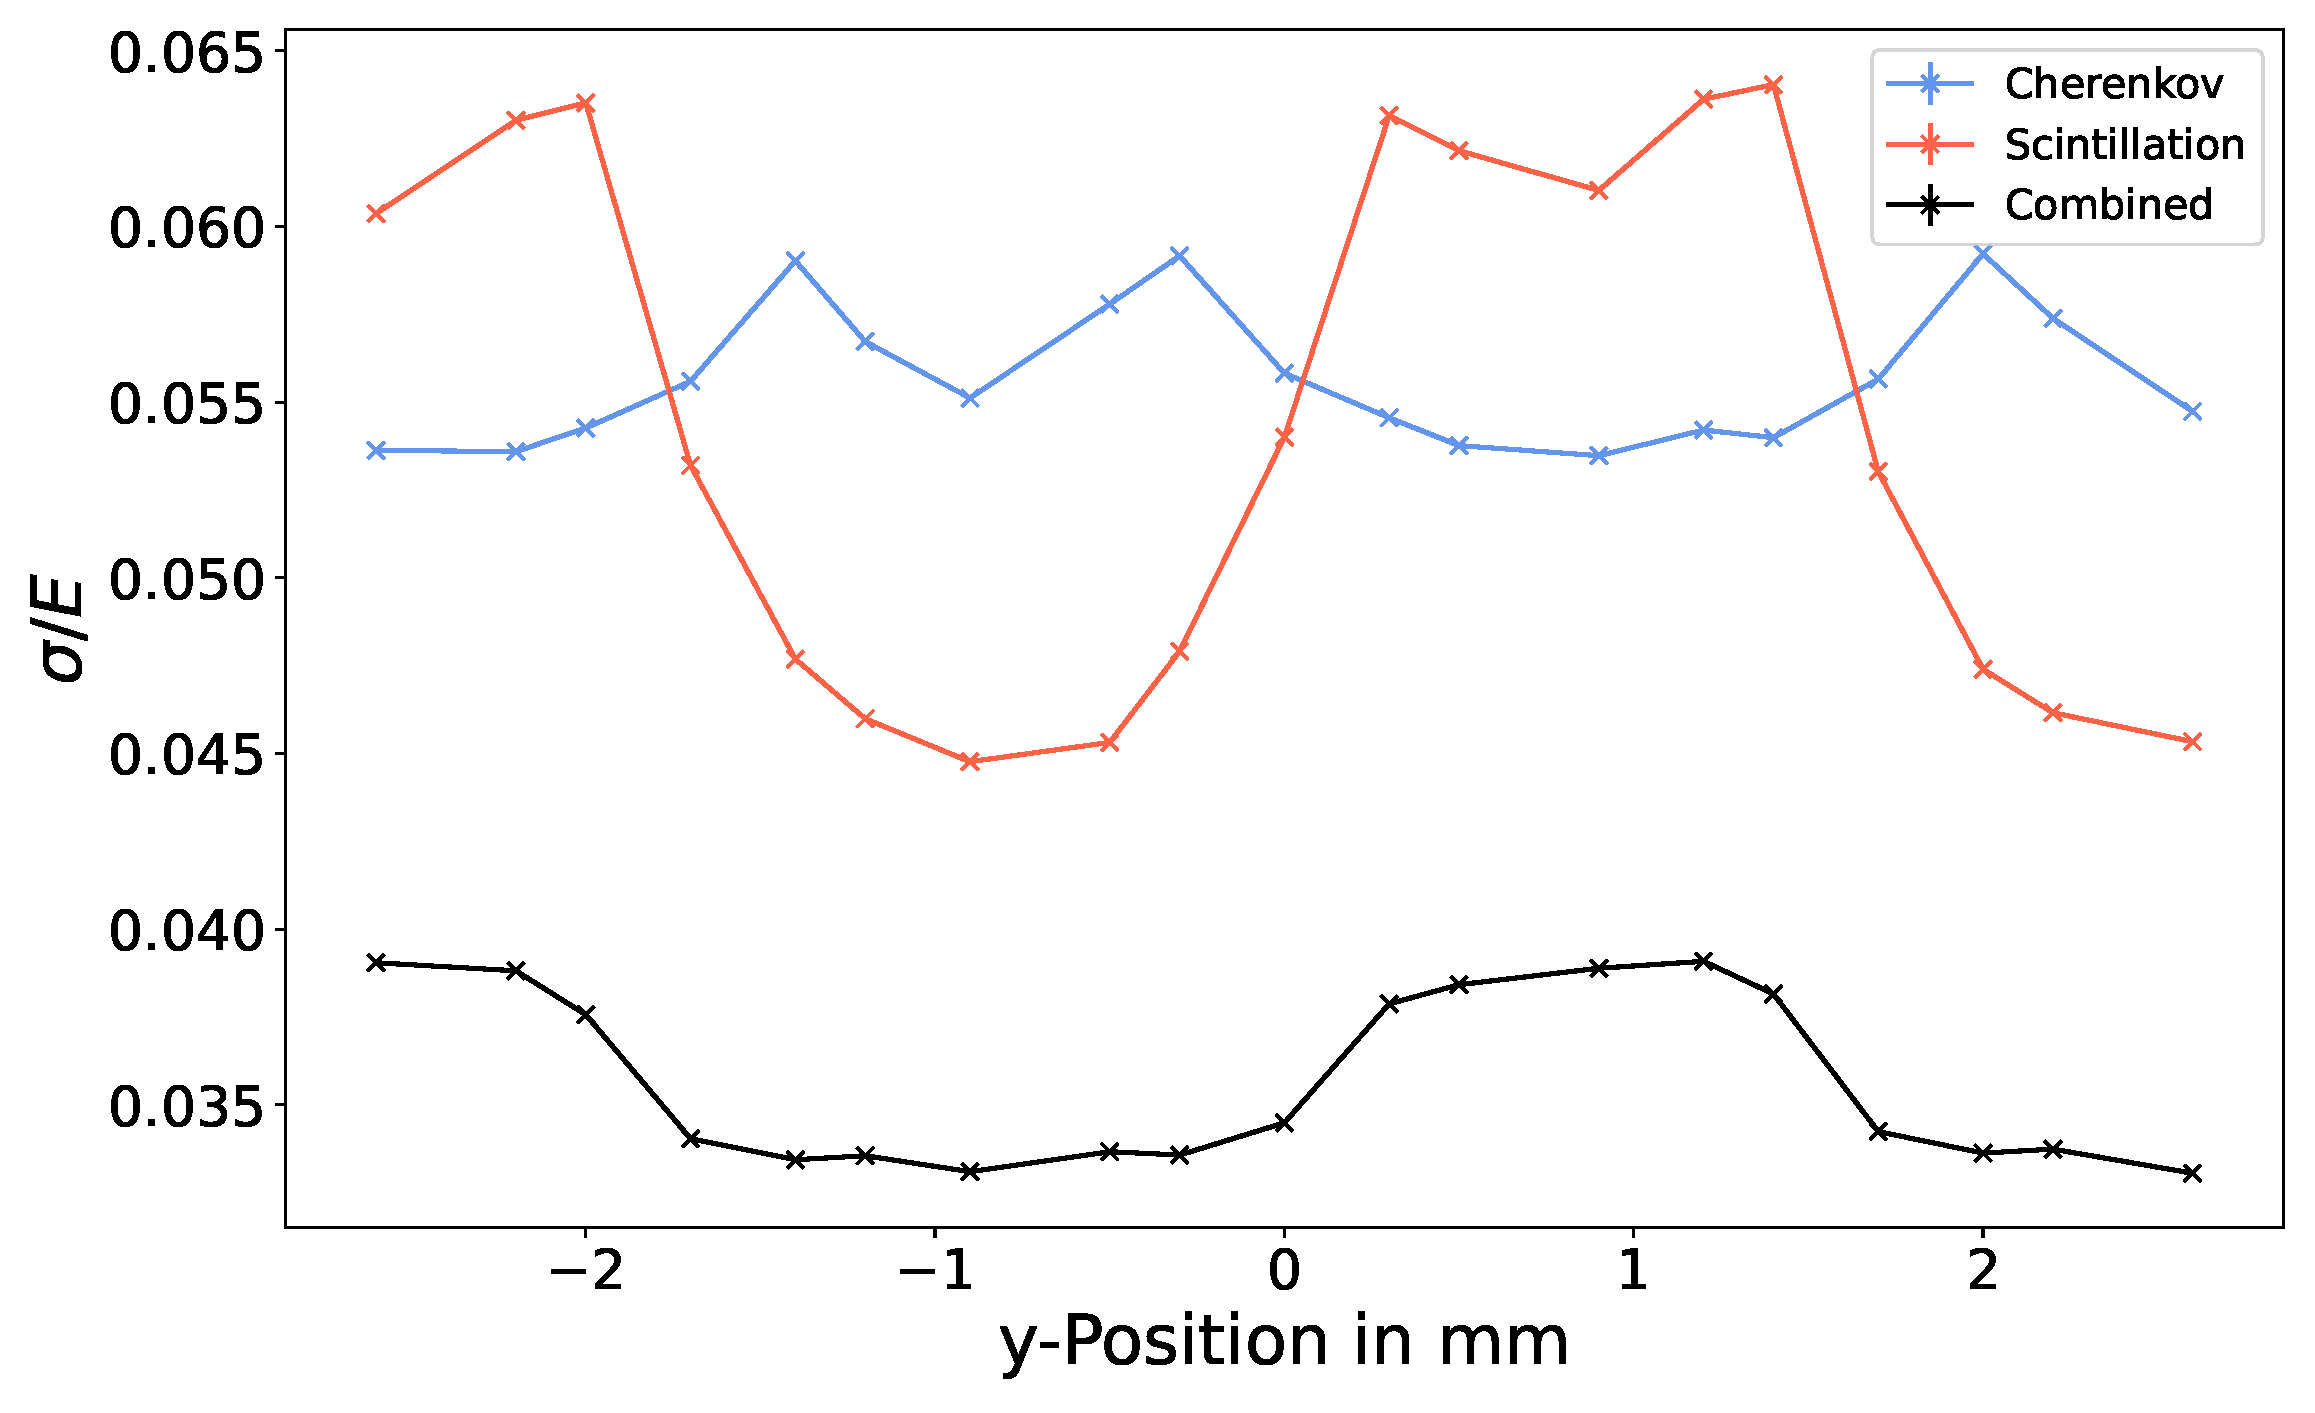
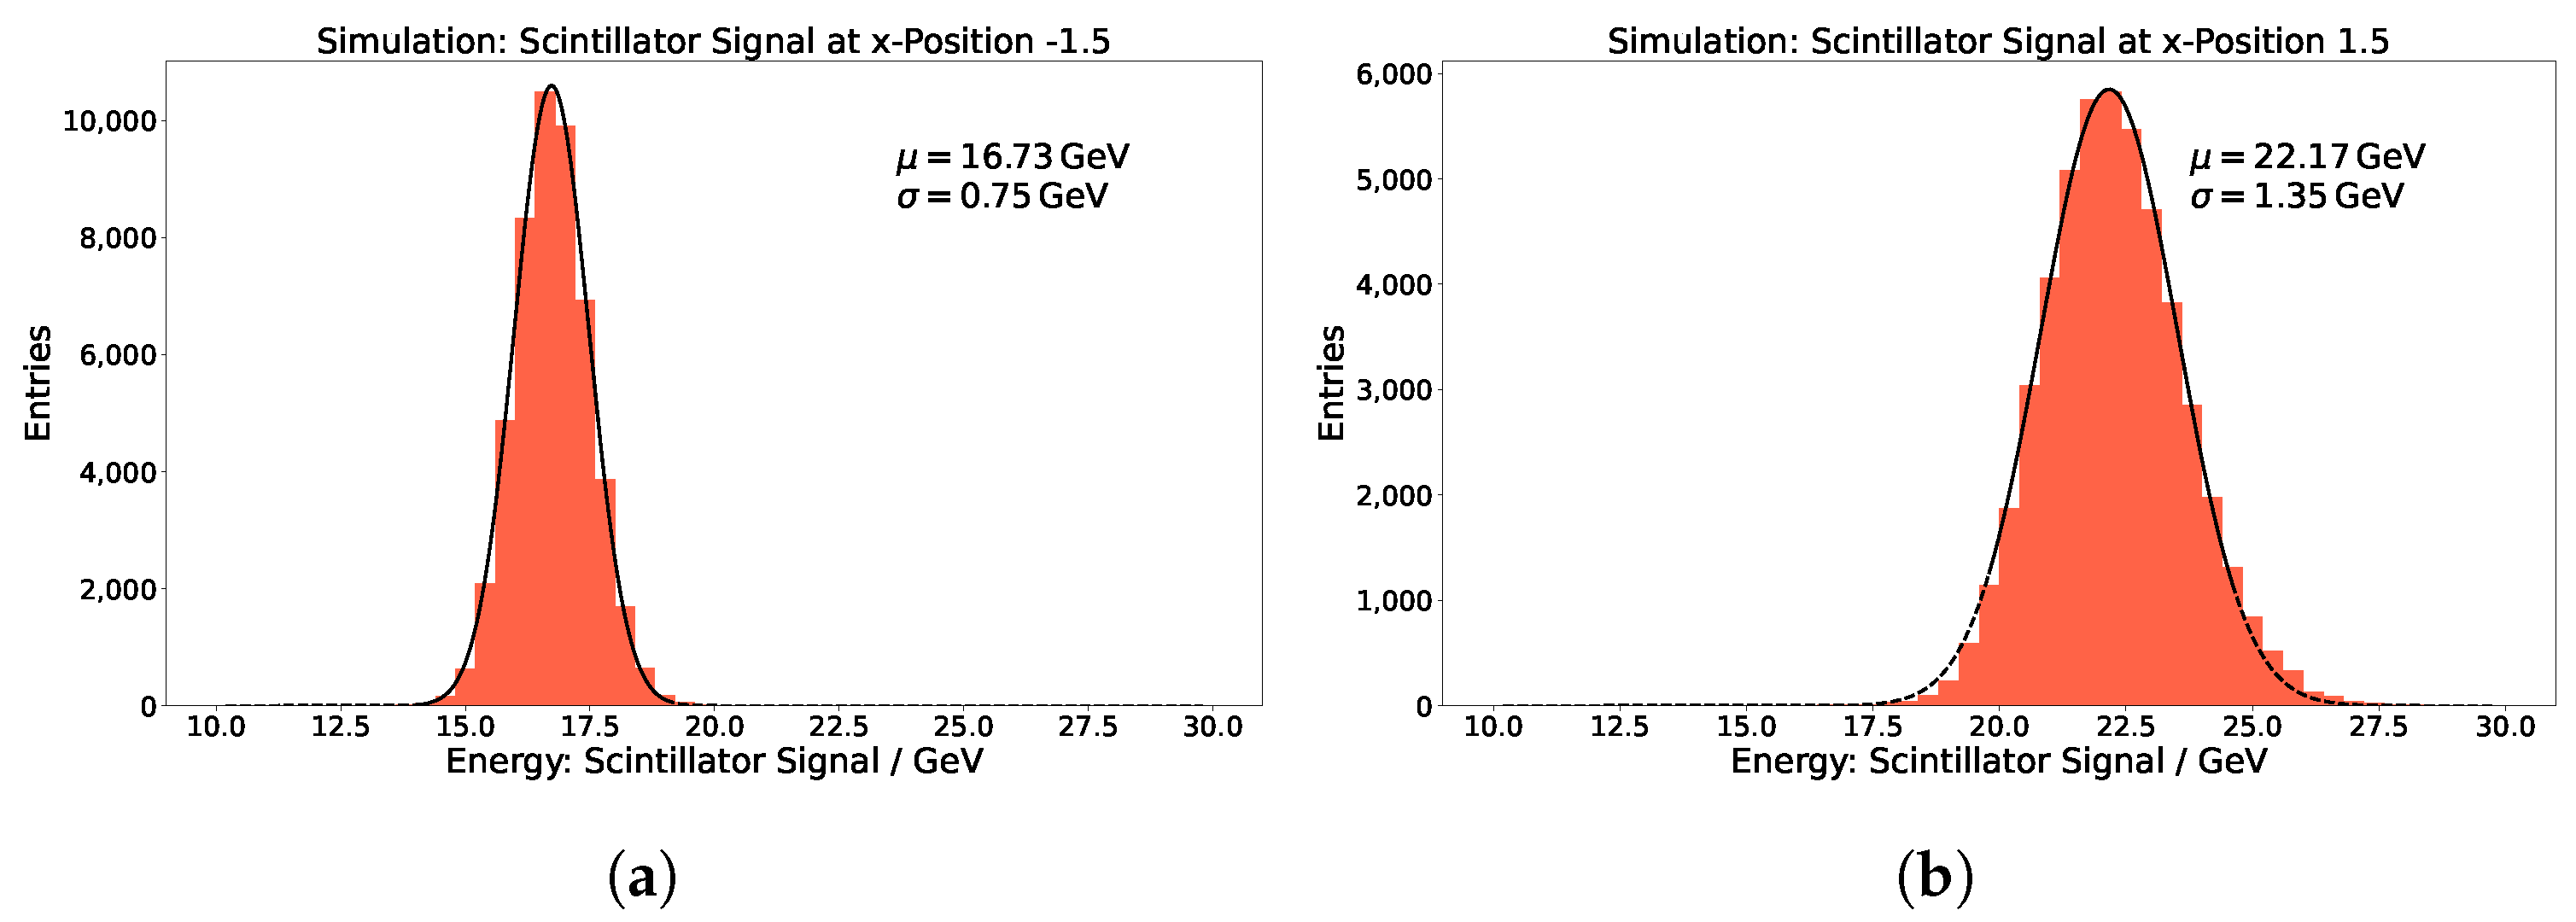
3.2. Impact Point Dependence

For each position, 50,000 e + were simulated at 20 GeV. As the output of the simulation is internally converted into the number of photoelectrons detected by the SiPMs and PMTs of all towers, the expected light yield per deposited GeV has to be calibrated back to energy in order to calculate the combined channel response. The calibration factors are calculated using the Monte Carlo truth information in such a way that both energy deposit distributions peak at 20 GeV averaged over all 19 simulated positions. Any leakage losses are neglected.
A Gaussian fit is performed to the energy deposit distribution at each position to determine the peak position μ and the width of the distribution σ at this particular position. An example of these fits for a single beam spot position can be seen in Figure 3 for both scintillation and Cherenkov channels.
The width at each position can be used to calculate the combined signal channel. The combined channel energy E comb is estimated event-by-event by using a weighted average of the scintillation and Cherenkov channel deposits where the width of the deposit distribution serves as weight, according to Equation (1):
E comb = E C σ C 2 + E S σ S 2 1 σ C 2 + 1 σ S 2 .
For each beam position, this yields a new distribution for which the peak and width can be determined via a Gaussian fit. An example is given in Figure 3c.
Figure 4 shows the fit result for the peak as a function of the beam positions for all three channels (scintillation, Cherenkov, and combined). The position is indicated with the y-coordinate due to the alternating row structure in the y-direction. A clear oscillating behaviour can be seen for all channels. It is not surprising to see this behaviour in the scintillation and Cherenkov channels, as the region of maximal energy deposit will develop closely around the respective signal fibres. From simulation studies, roughly 90% of the shower energy is deposited within a distance of 14 mm of the shower axis and even 50% within 5 mm. The oscillation for the scintillation channel is larger because the shower development for the scintillating component of the shower is narrower than the Cherenkov light-emitting component [9].
The oscillating behaviour carries through to the combined channel. This indicates that a position-dependent equalisation might be needed to accurately determine the energy in the combined channel.
We define the energy resolution as the width of the energy deposit σ over the reconstructed energy μ , where, due to consistent terminology, the resolution is labelled as σ / E .
Figure 5 shows σ / E for scintillation, Cherenkov, and the combined channels. The combined channel achieves a superior resolution to each single channel, as is expected [1]. However, a clear dependence on the impact position can be seen in all channels. The dependence is largest for the scintillation channel, where the resolution σ / E follows a similar trend to the reconstructed peak μ . One would naively expect the scintillation channel to show the best performance when hitting a scintillating fibre directly, i.e., the positions of the maxima in the energy deposit in Figure 4. However, this is not the case.
Comparing the calorimeter signal distributions for positions ( 1.5 , 0.87 ) (hitting a Cherenkov fibre) and ( + 1.5 , + 0.87 ) (hitting a scintillating fibre) for the scintillation channel (Figure 6) shows that even though the reconstructed energy E increases when hitting the scintillating fibre, so does the width of the distribution σ , resulting in an overall worsened resolution σ / E . We conclude that the fluctuation in the energy deposit far from the shower central axis is much lower than close to it. This leads to a broad energy deposit distribution close to the shower axis and a narrow distribution further away. Very close to the shower central axis, where the fibre extends to a radial distance of 0.5 mm, the resolution also shows a dip, meaning that at this distance, the fluctuation is not as large as at medium distances between 0.5 mm and 1.4 mm.
The same is true for the Cherenkov component of the shower, though here, the effect is not as pronounced as in the scintillation channel. The combined channel is dominated (by definition) by the channel with a lower width at a given position, but through the combination is able to achieve two plateaus for the resolution around the position of the fibres. All this, again, indicates that knowing the exact position of the shower centre will be instrumental in extracting the best energy resolution.

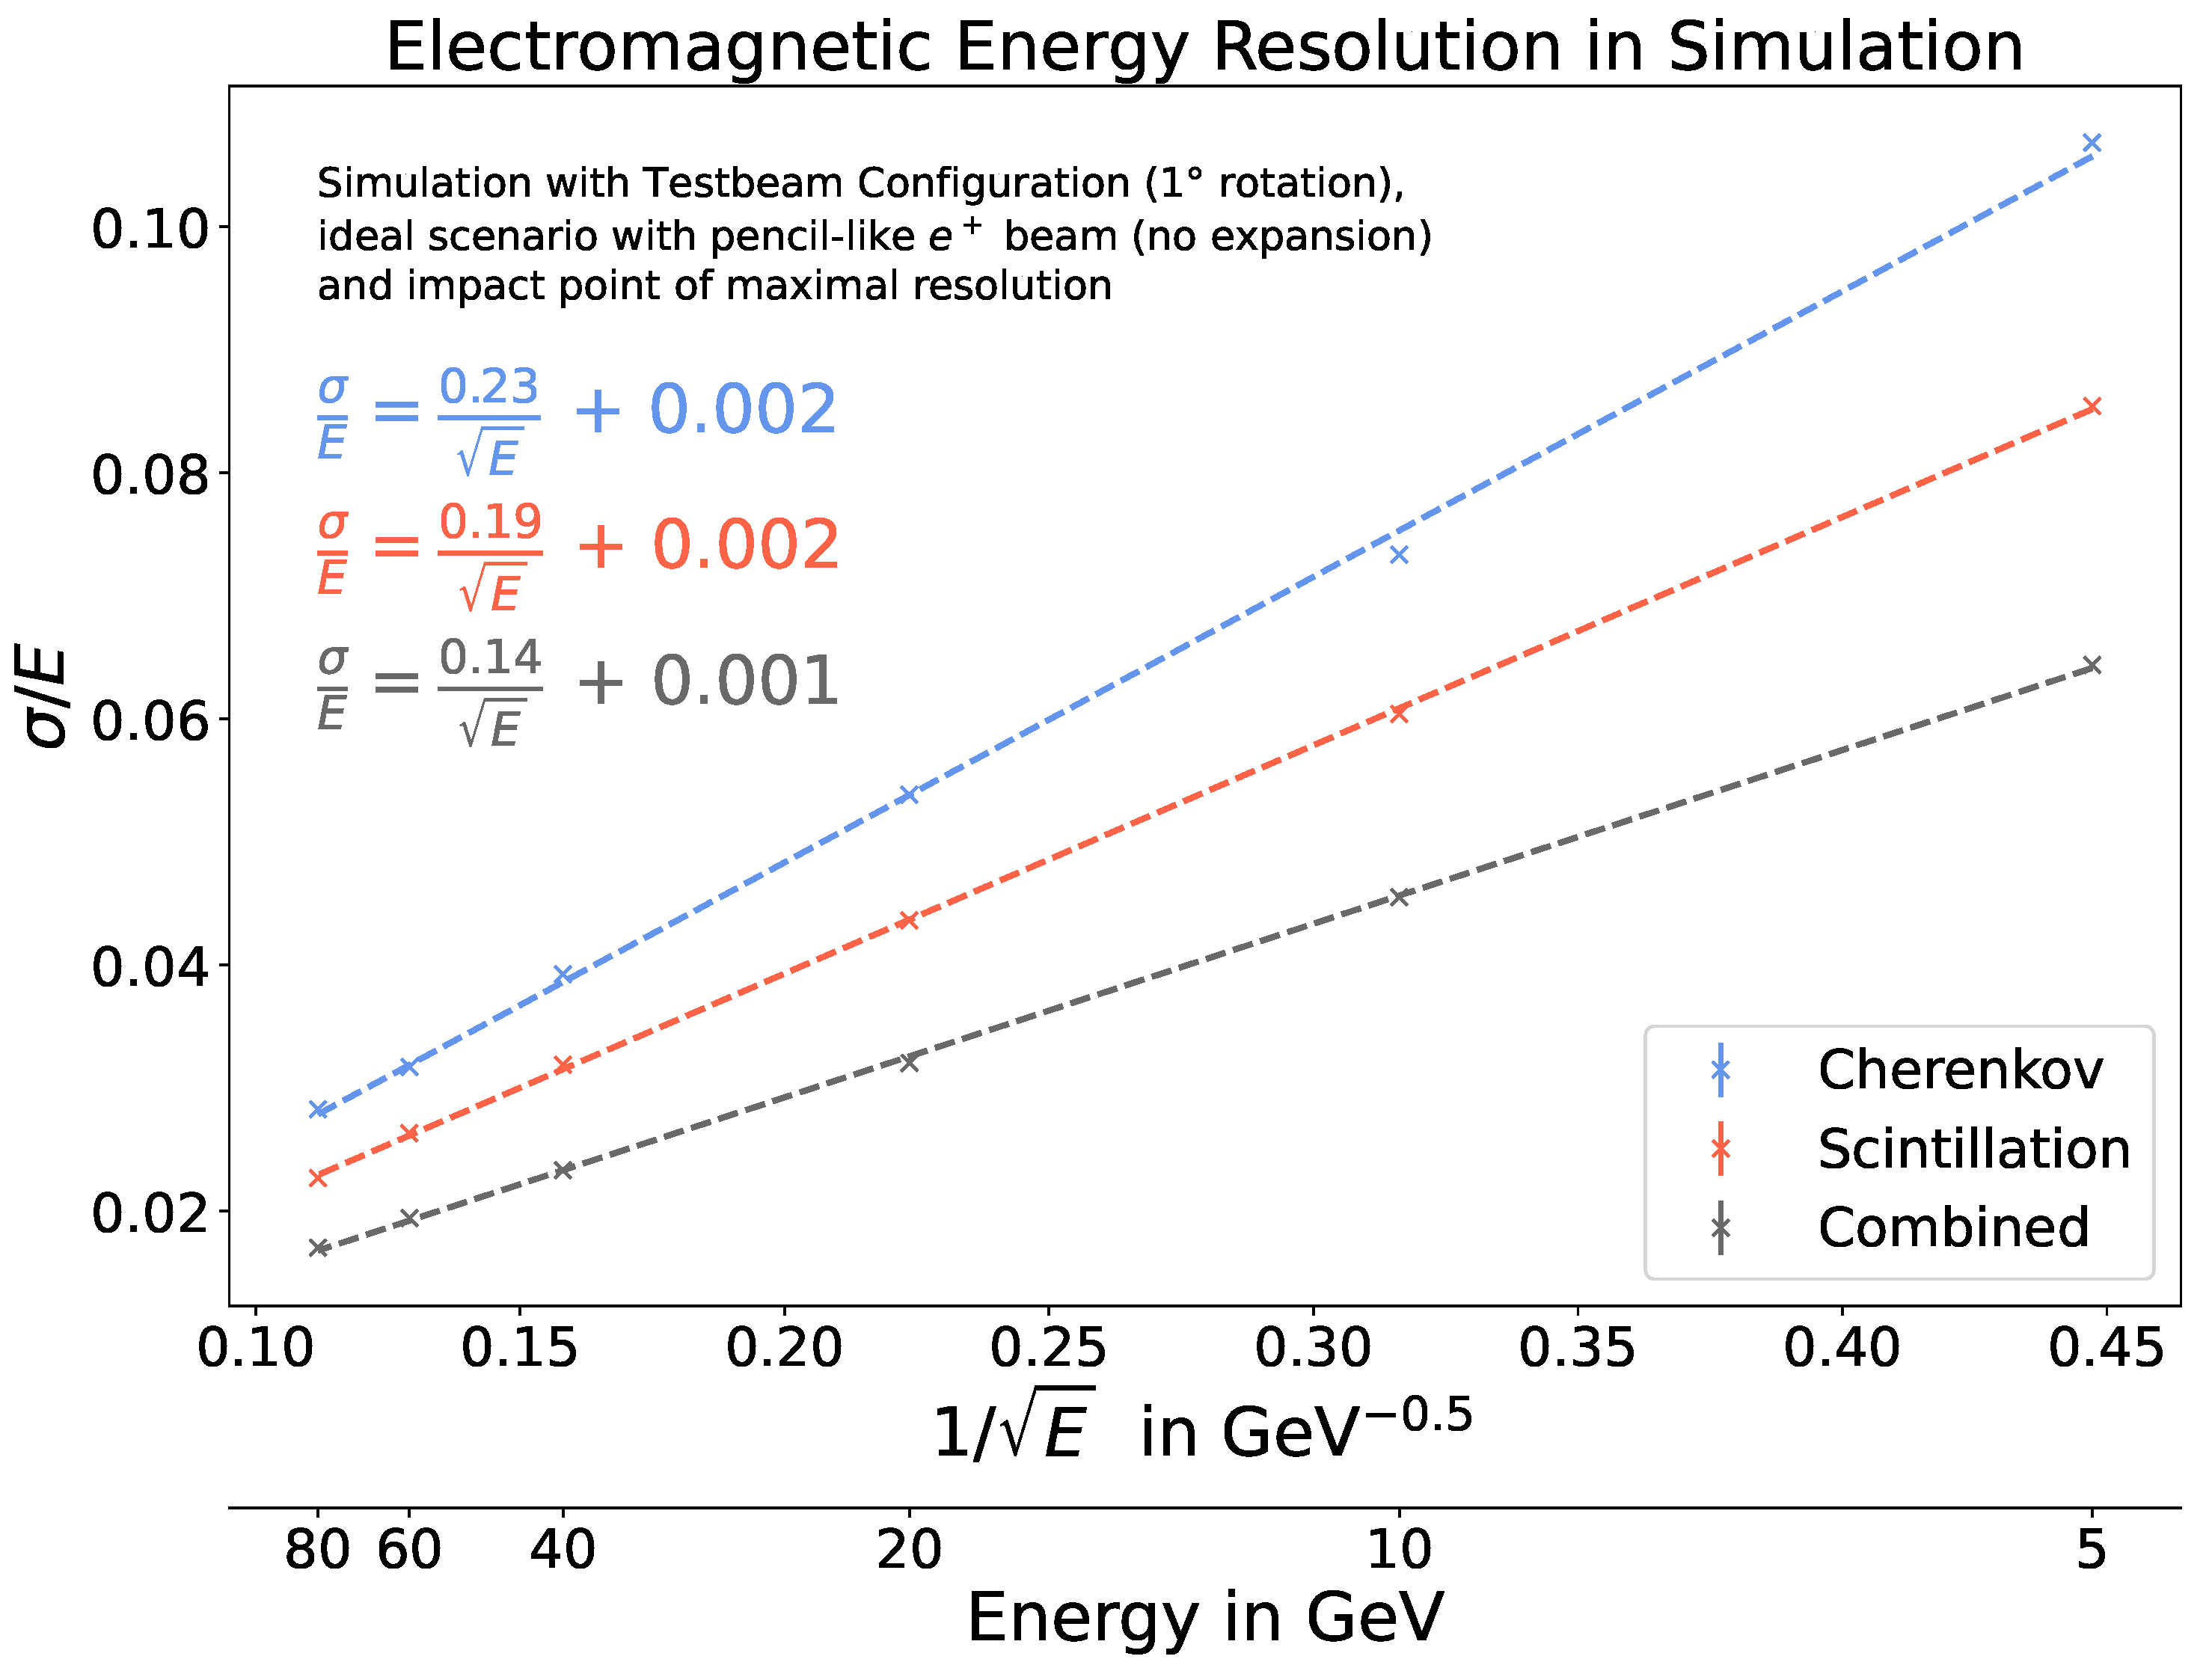
3.3. Energy Dependence

We expect the energy resolution to evolve with the energy according to:
σ E = a E + b ,
where a, named the stochastic term, represents the resolution due to fluctuations in the shower development and thus the main value of interest for this study. The constant term is in part influenced by shower leakage escaping the detector [10]. It is, therefore, a property of the prototype and not interesting for studying the performance of this particular layout for the dual-readout calorimeter. Additional contributions to the constant term, such as the position dependence of the signal response, are furthermore suppressed by keeping a slight rotation angle of the prototype with respect to the beam axis, as well as limiting this part of the study to a single beam impact point position [1].
To extract the value of a, we simulated 10,000 e + for energies of 5 GeV, 10 GeV, 20 GeV, 40 GeV, 60 GeV, and 80 GeV. The beam position ( 1.5 , 0.87 ) , which had the best overall performance in the energy resolution from Section 3.2, was chosen. Therefore, the value for the stochastic term to the energy resolution is determined under the assumption that a position-dependent calibration can take place.
The energy resolution as a function of 1 / E can be seen in Figure 7 for all three channels. Through a fit, we can extract the value for the slope, i.e., the stochastic term a, and the constant term.
For the Cherenkov and scintillation channel we extracted energy resolutions of 23 % / E and 19 % / E , respectively, neglecting the constant term. This is in line with the expectation that the scintillation channel performs better than the Cherenkov one [1]. We can also see that in the combined channel, we achieve the best resolution of 14 % / E , assuming that the impact position of the impinging particle is known.

4. Conclusions

Using simulations, we have characterised the EM performance of a dual-readout calorimeter prototype and outlined a strong position dependence in the calorimeter response and energy resolution. A position-dependent calibration for the equalisation of this effect will be needed to extract the maximal performance of the calorimeter. Due to the O (mm) pitch of the readout fibres, it is likely possible to determine the shower axis to a sub-mm precision by analysing the shower profile.
Assuming a successful calibration, an EM energy resolution of 14 % / E is achieved in a preliminary way to calculate the combined channel signal.

Funding

Instruments 06 00044 i001 This project has received funding from the European Union’s Horizon 2020 Research and Innovation programme under grant agreement No 101004761.

Data Availability Statement

Not applicable.

Conflicts of Interest

The authors declare no conflict of interest.

Abbreviations

The following abbreviations are used in this manuscript:
EMElectromagnetic
SiPMSilicon Photomultiplier
PMTPhotomultiplier

References

  1. Akchurin, N.; Bedeschi, F.; Cardini, A.; Cascella, M.; Cei, F.; De Pedis, D.; Ferrari, R.; Fracchia, S.; Franchino, S.; Fraternali, M.; et al. The electromagnetic performance of the RD52 fiber calorimeter. Nucl. Instrum. Methods Phys. Res. Sect. A Accel. Spectrom. Detect. Assoc. Equip. 2014, 735, 130–144. [Google Scholar] [CrossRef]
  2. Lee, S.; Livan, M.; Wigmans, R. Dual-readout calorimetry. Rev. Mod. Phys. 2018, 90, 025002. [Google Scholar] [CrossRef]
  3. Derrick, M.; Gacek, D.; Hill, N.; Musgrave, B.; Noland, R.; Petereit, E.; Repond, J.; Stanek, R.; Sugano, K. Design and construction of the ZEUS barrel calorimeter. Nucl. Instrum. Methods Phys. Res. Sect. A Accel. Spectrom. Detect. Assoc. Equip. 1991, 309, 77–100. [Google Scholar] [CrossRef]
  4. Antonello, M. IDEA: A detector concept for future leptonic colliders. Nuovo Cim. C 2020, 43, 27. [Google Scholar] [CrossRef]
  5. First Beam Tests for Highly Granular Dual-Readout Calorimeter Prototype. Available online: https://aidainnova.web.cern.ch/first-beam-tests-highly-granular-dual-readout-calorimeter-prototype (accessed on 31 July 2022).
  6. DREMTubes—GitHub Repository. Available online: https://github.com/lopezzot/DREMTubes (accessed on 31 July 2022).
  7. Pezzotti, L. Including Calorimeter Test-Beams into Geant-Val. CALOR 2022. Available online: https://indi.to/rT6st (accessed on 31 July 2022).
  8. Brient, J.C.; Videau, H. The Calorimetry at the Future e+ e Linear Collider. arXiv 2002, arXiv:hep-ex/0202004. [Google Scholar] [CrossRef]
  9. Antonello, M.; Caccia, M.; Cascella, M.; Dunser, M.; Ferrari, R.; Franchino, S.; Gaudio, G.; Hall, K.; Hauptman, J.; Jo, H.; et al. Tests of a dual-readout fiber calorimeter with SiPM light sensors. Nucl. Instrum. Methods Phys. Res. Sect. A Accel. Spectrom. Detect. Assoc. Equip. 2018, 899, 52–64. [Google Scholar] [CrossRef] [Green Version]
  10. Kolanoski, H.; Wermes, N. Particle Detectors: Fundamentals and Applications; Oxford University Press: Oxford, UK, 2020; pp. 603–604. [Google Scholar]
Figure 1. Dual-readout calorimeter prototype built for testbeams [5]. (a) The full prototype with the readout in the back, where the central tower has one SiPM per fibre, and the others have two PMTs each. (b) The layout of the fibres in one tower. The illuminated fibres are the Cherenkov channels.
Instruments 06 00044 g001
Figure 2. Simulated beam impact positions with a pencil-like beam of no radial extension. The beam travels in the (negative) z direction.
Instruments 06 00044 g002
Figure 3. Energy deposit distributions for the (a) Cherenkov, (b) scintillation, and (c) combined channels. A Gaussian fit determines the peak position and width of the distribution, which later on is used to calculate the energy resolution.
Instruments 06 00044 g003
Figure 4. Reconstructed energy deposit as a function of the beam impact position for the Cherenkov, scintillation, and combined channels.
Instruments 06 00044 g004
Figure 5. Energy resolution as a function of the beam impact position for the Cherenkov, scintillation, and combined channel.
Instruments 06 00044 g005
Figure 6. Energy deposit distributions for the scintillation channel when hitting (a) a Cherenkov and (b) a scintillating fibre (note the identical x scale). The narrower distribution for hitting a Cherenkov fibre is driving the energy resolution improvement in Figure 5.
Instruments 06 00044 g006
Figure 7. Electromagnetic energy resolution as a function of 1 / E for Cherenkov, scintillation, and combined channels. The simulation was conducted under an ideal scenario with exact knowledge of beam impact point, no material in front of the calorimeter prototype, and a slight rotation angle of 1°.
Instruments 06 00044 g007
Publisher’s Note: MDPI stays neutral with regard to jurisdictional claims in published maps and institutional affiliations.

