Article

ATLAS LAr Calorimeter Commissioning for the LHC Run 3

by
Alessandra Betti
1,2 on behalf of the ATLAS Liquid Argon Calorimeter Group
1
Istituto Nazionale di Fisica Nucleare Sezione di Roma (IT), Sapienza Università di Roma (IT), 00185 Roma, Italy
2
Department of Physics, Southern Methodist University, Dallas, TX 75205, USA
Instruments 2022, 6(3), 37; https://doi.org/10.3390/instruments6030037
Submission received: 25 July 2022 / Revised: 2 September 2022 / Accepted: 5 September 2022 / Published: 8 September 2022

Abstract

:
The Liquid Argon Calorimeters are employed by ATLAS for all electromagnetic calorimetry in the pseudo-rapidity region | η | < 3.2 , and for hadronic and forward calorimetry in the region from | η | = 1.5 to | η | = 4.9 . They also provide inputs to the first level of the ATLAS trigger. After a successful period of data taking during the LHC Run 2 between 2015 and 2018, the ATLAS detector entered into a long period of shutdown. In 2022, the LHC will restart and the Run 3 period should see an increase of luminosity and pile-up of up to 80 interactions per bunch crossing. To cope with these harsher conditions, a new trigger readout path has been installed during the long shutdown. This new path should significantly improve the triggering performance on electromagnetic objects. This will be achieved by increasing the granularity of the objects available at trigger level by up to a factor of ten. The installation of this new trigger readout chain also required the update of the legacy system. More than 1500 boards of the precision readout have been extracted from the ATLAS pit, refurbished and re-installed. The legacy analog trigger readout, which will remain during the LHC Run 3 as a backup of the new digital trigger system, has also been updated. For the new system, 124 new on-detector boards have been added. Those boards that are operating in a radiative environment are digitizing the calorimeter trigger signals at 40 MHz. The digital signal is sent to the off-detector system and processed online to provide the measured energy value for each unit of readout. In total up to 31 Tbps are analyzed by the processing system and more than 62Tbps are generated for downstream reconstruction. To minimize the triggering latency the processing system had to be installed underground. The limited available space imposed a very compact hardware structure. To achieve a compact system, large FPGAs with high throughput have been mounted on ATCA mezzanines cards. In total, no more than three ATCA shelves are used to process the signal from approximately 34,000 channels. Given that modern technologies have been used compared to the previous system, all the monitoring and control infrastructure is being adapted and commissioned as well. This contribution presents the challenges of the installation, the commissioning and the milestones still to be completed towards the full operation of both the legacy and the new readout paths for the LHC Run 3.

1. The ATLAS Liquid Argon (LAr) Calorimeter

The ATLAS Liquid Argon (LAr) Calorimeter [1,2] is a system of sampling calorimeters with full azimuthal coverage. Lead, copper and tungsten are used as absorbers in different parts of the detector and Liquid Argon (LAr) is used as active material. The calorimeter is divided in different sub-detectors as represented in Figure 1: a high granularity Electromagnetic Barrel (EMB) with accordion geometry that covers the pseudo-rapidity region | η | < 1.475 , two Electromagnetic EndCaps (EMEC) that cover the region 1.375 < | η | < 3.2 , two Hadronic EndCaps (HEC) that cover the region 1.5 < | η | < 3.2 and Forward Calorimeters (FCal) that can detect particles up to | η | = 4.9 . These components are divided into two sides, side-A and side-C, oriented respectively along the positive and negative z-axis of the experiment. Each sub-detector is longitudinally segmented in three layers, which are referred as “front”, “middle” and “back” layers. The subdetectors covering the regions with | η | < 1.8 also have an additional thin layer called “presampler”, which is used to recover upstream energy loss. Three different cryostats enclose the Barrel and the two EndCap parts in order to maintain the Liquid Argon at a temperature of 88 K.
Incoming particles produced in the LHC proton–proton collisions shower in the absorbers and ionize the Liquid Argon. In order to collect the ionization signal produced in the LAr, a high electric field is applied across the gap and the current produced by the drift of the electrons is read out by electrodes. A triangular-shaped pulse is produced and it is then amplified and shaped into a bipolar pulse and digitized at the LHC bunch-crossing frequency of 40 MHz. The geometry of the LAr gap, the readout electrodes with the high voltage lines and the pulse shape are shown in Figure 2.

Lar Calorimeter Main Readout and Legacy Analog Trigger Electronics

The signals from the detector are read out by more than 180,000 channels and are routed towards the Front End Crates (FECs). The Front End Boards (FEBs) [3] receive up to 128 analogue channel signals from each layer of the calorimeter. The signals are amplified with three different gains and then shaped with a bipolar analogue filter, producing the signal shape shown in Figure 2. The shaped signal is then sampled at the LHC bunch-crossing frequency of 40 MHz and stored in an analog memory buffer, while awaiting the Level-1 (L1) trigger accept. Upon a L1 trigger accept, the signal is digitized and transmitted to the back-end Readout Drivers (RODs) for the main readout energy computation. In addition to this, the FEBs also contain the Layer Summing Boards (LSBs) that send the analog sums of signals within one layer through the baseplane to the Tower Builder Board (TBB). The TBB sums the signals in the Trigger Towers (TTs), corresponding to detector cells of Δ η × Δ Φ = 0.1 × 0.1 summed over the different layers and then sends the sums to the back-end receivers for the L1 trigger system that computes the L1 accepts, and sends them back to the ATLAS sub-detectors including the LAr system.

2. Atlas LAr Calorimeter Phase-1 Upgrade

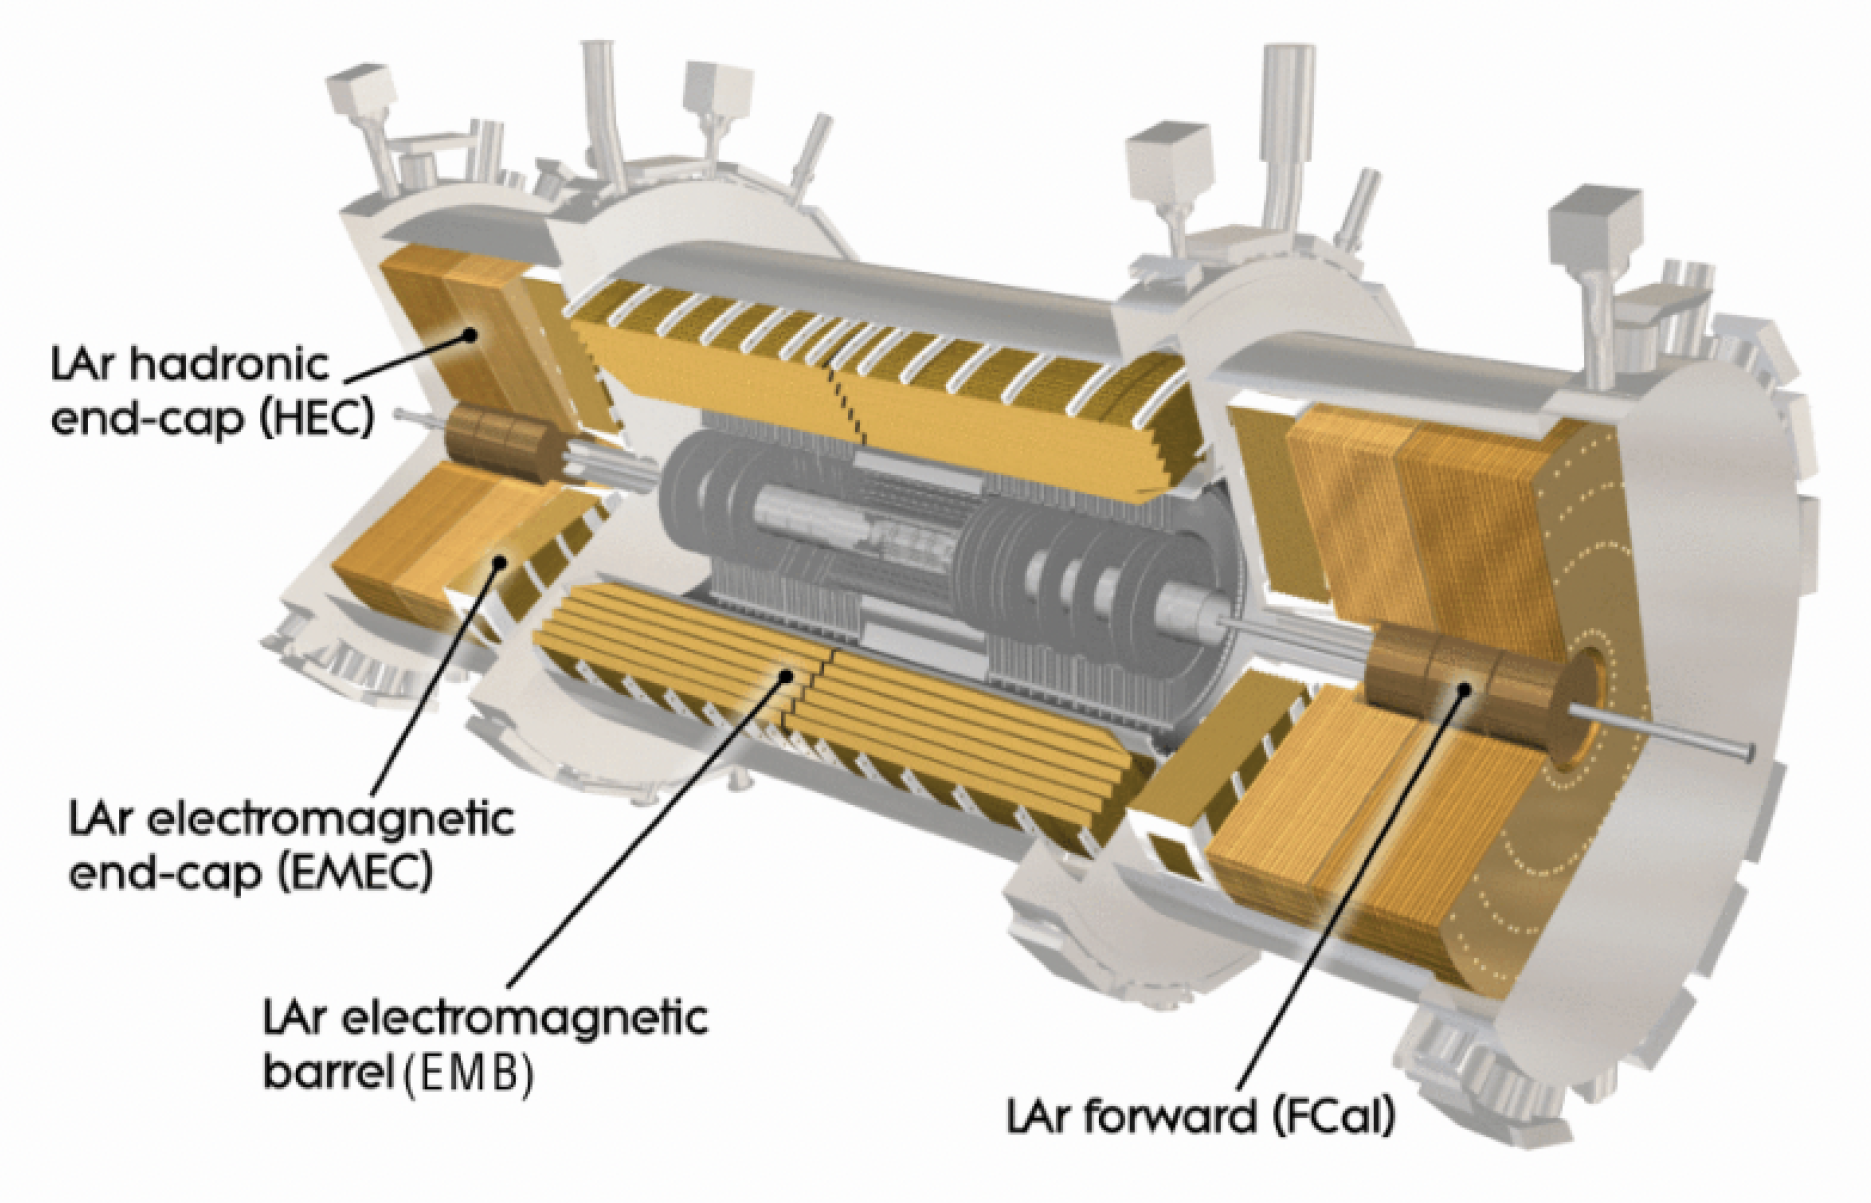
After a successful period of data-taking during the LHC Run 2 between 2015 and 2018, the ATLAS detector entered into a long period of shutdown. In 2022, the LHC Run 3 is starting with running conditions characterised by higher instantaneous luminosity and higher average pile-up compared to the LHC Run 2, which results in an overall increased occupancy of the ATLAS detector compared to the Run 2 conditions. Specifically, the instantaneous luminosity and average pile-up in Run 3 will reach 3 × 10 34 cm 2 s 1 and 80 respectively, compared to 2 × 10 34 cm 2 s 1 and 40 of Run 2. During the Run 3 data-taking, the sustainable ATLAS level-1 (L1) trigger and High Level Trigger (HLT) rates remain at the same Run 2 levels of 100 kHz and 1 kHz, respectively. Given the increased rate of particles and the unchanged limitations on the rates, an upgrade of the L1 trigger is required in order to improve the discrimination power between different physics objects at trigger level and keep the same rates of accepted events without degrading the physics performance. Particularly, in the so-called Phase-1 upgrade, the LAr calorimeter trigger readout electronics are upgraded in order to improve the discrimination between electrons, photons, jets and τ -leptons at trigger level [4,5]. The new LAr calorimeter digital trigger readout system installed for the Run 3 data-taking increases the readout granularity by up to a factor of ten: instead of summing the energies from the calorimeter cells in regions of Δ η × Δ Φ = 0.1 × 0.1 
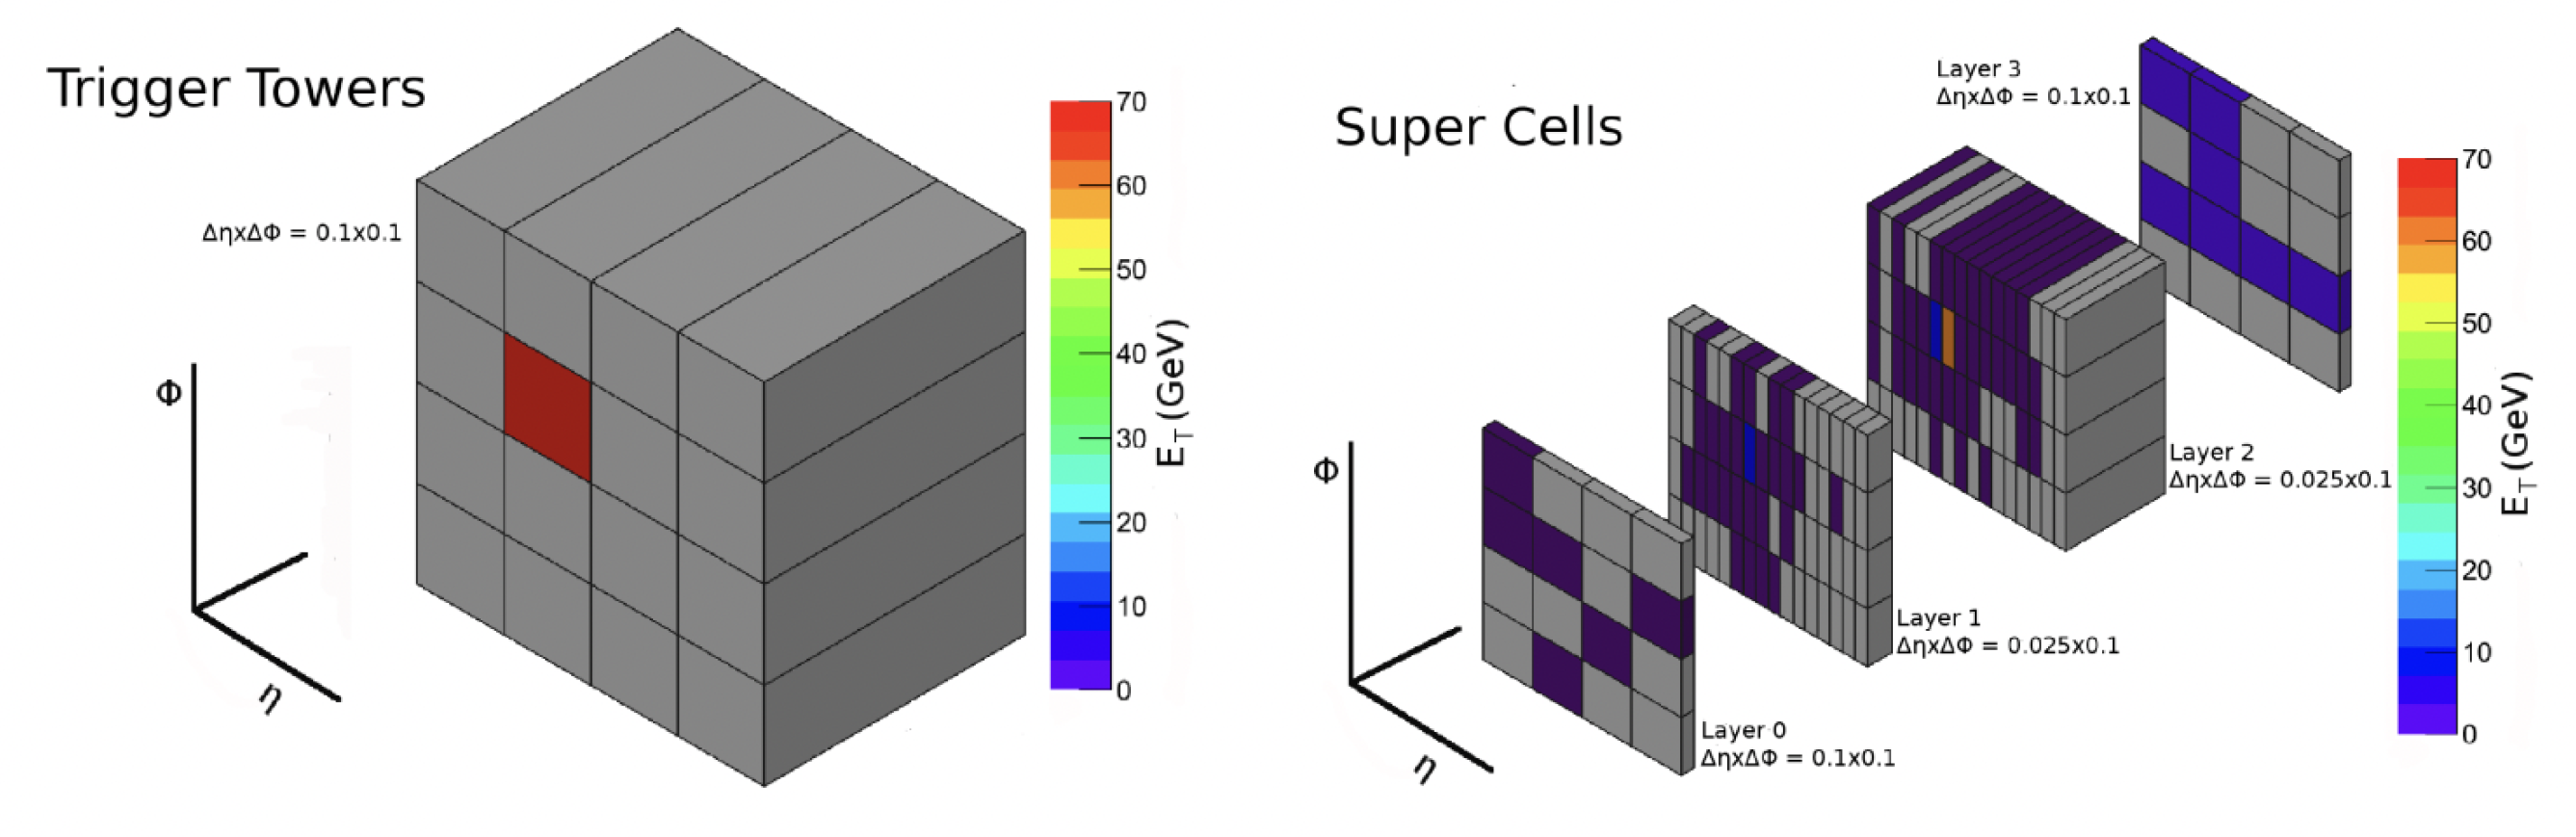
and over the different layers of the calorimeter to form the Trigger Towers, the energies are summed into smaller clusters called Super Cells (SCs) in each layer. The SCs provide higher cells granularity and the longitudinal information coming from the four layers of the calorimeter. Figure 3 shows an image of the expected energy deposit for a 70 GeV electron as seen by the old analog trigger system compared to the same deposit measured by the new digital system. Specifically, the SCs provide the same Δ η × Δ Φ information of the TTs for the presampler and back layers but a Δ η × Δ Φ = 0.025 × 0.1 information for the front and middle layers. With the higher granularity information provided by the SCs, the new L1 trigger algorithm has improved discrimination between different physics objects thanks to more detailed information about the shower shape development. This allows us to keep, during Run 3, the same trigger rate as in Run 2 with the same energy thresholds even in the more challenging Run 3 environment, as shown in 
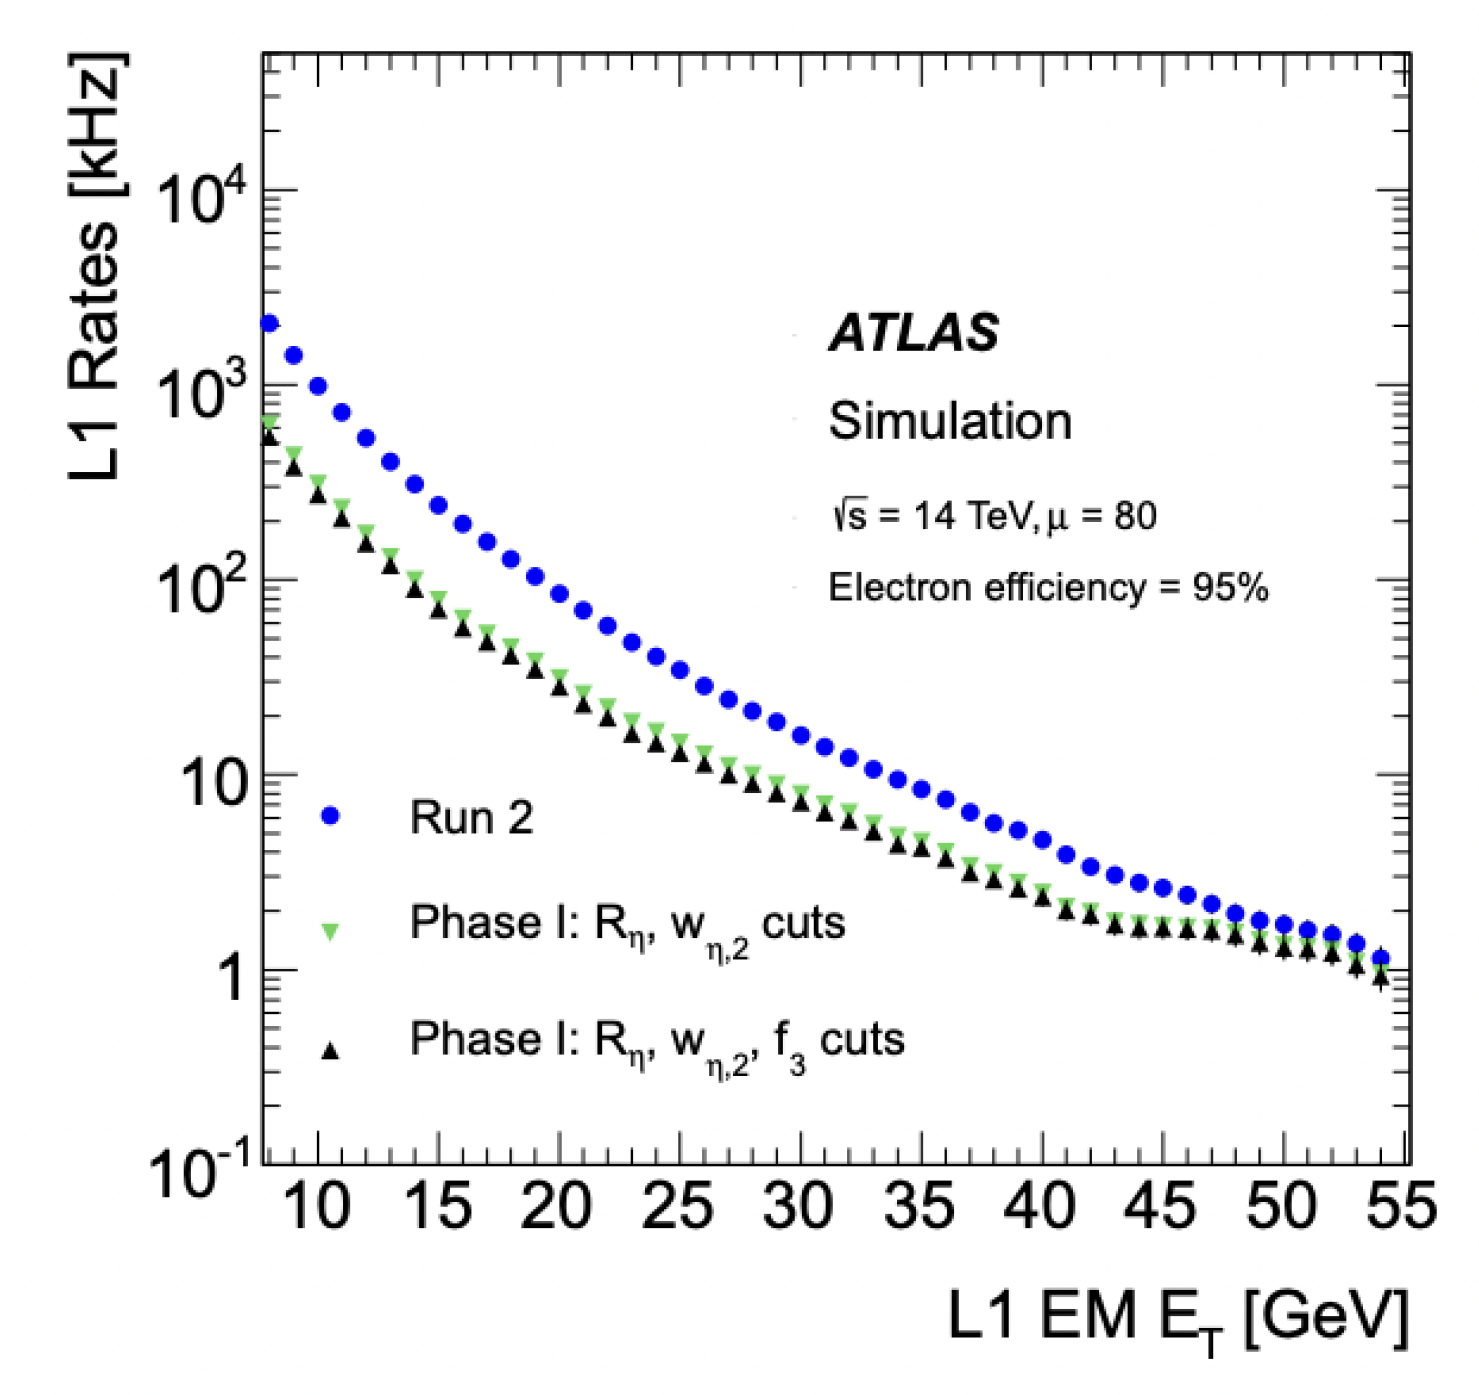
Figure 4. As an example, the maximum trigger rate allowed for electrons is 20 kHz. This rate was corresponding in Run 2 to a transverse energy ( E T ) threshold of 20 GeV for 95% electron efficiency and in Run 3 the rate can be maintained at the same level, with the same efficiency and E T threshold, by using the additional shower information from the new digital trigger readout electronics.

2.1. New LAr Calorimeter Digital Trigger Readout Electronics

The LAr readout electronics Phase-1 upgrade, installed before the start of the LHC Run 3, extends the existing readout system with new front-end and back-end components [4,5]. The new front-end boards send the Super Cells digital data to the new back-end components that compute the energies and transmit them to the new digital trigger system. An overview of the new LAr calorimeter readout electronics architecture for Run 3 is shown in Figure 5. The legacy analog trigger readout system will be maintained and it will be used for triggering at the beginning of Run 3 until the new Phase-1 digital trigger readout system is fully commissioned. The new LAr digital trigger readout system is composed of new Layer Sum Boards providing the analog sums of the signals from the calorimeter cells within one layer for the higher trigger readout granularity of the SCs, new baseplanes to route the increased number of analog signals and host the new LAr Trigger Digitizer Boards (LTDBs) that digitize the SC analog signals and provide the sums for the TBBs of the legacy analog trigger, and new Back-End boards, i.e., the LAr Digital Processing Blades (LDPBs), which read the SC signals from the LTDBs, compute the energies and send them to the new L1 trigger system. The LDPBs are built in Advanced Telecommunications Computing Architecture (ATCA) format and are composed of one ATCA carrier named LAr Carrier (LArC) equipped with four LAr Trigger prOcessing MEzzanines (LATOMEs) each and are controlled and monitored via an Intelligent Platform Management Controller (IPMC) plugged into the LArCs. The LATOMEs receive the SC ADC samples from the LTDBs via optical links for each brunch crossing and then transmit the elaborated data to the L1Calo trigger. To minimize the triggering latency, the LDPB boards are equipped with high-performance FPGAs. The total latency for the new LAr trigger path starting from the proton–proton collision time up to the computation of the energy amounts to 43.8 proton bunch-crossings (BCs), where one BC corresponds to a 25 ns time interval. In addition, the processors require 14 BCs to extract the trigger primitives and transmits them to the ATLAS Topological Trigger processors. The overall 57.8 BCs latency of the calorimeter trigger system conforms with the maximum (65 BCs) value allowed by ATLAS at the input of the Topological Trigger processors where data from both the calorimeter and the muon trigger modules are combined, and it is reduced compared to the latency of the legacy analog trigger system.

2.2. Installation

The Phase-1 upgrade of the LAr trigger readout electronics was installed between 2019 and 2021 during the period of LHC shutdown for machine and detector upgrades before the start of the LHC Run 3. The installation of the front-end and back-end electronics was fully completed in October 2021. On the detector, 1524 FEBs have been extracted, refurbished with new LSBs and installed back in the FECs, 114 new baseplanes have been installed to host the refurbished FEBs and the 124 LTDBs, and the cooling plates and hoses were replaced. Simultaneously, 30 LDPBs, corresponding to 30 LArCs and 116 LATOMEs, have been installed in the ATLAS service cavern, with data fibers connected to the LTDBs. Monitoring and control systems for both new front-end and back-end boards have been put in place as well.

2.3. Validation and Commissioning

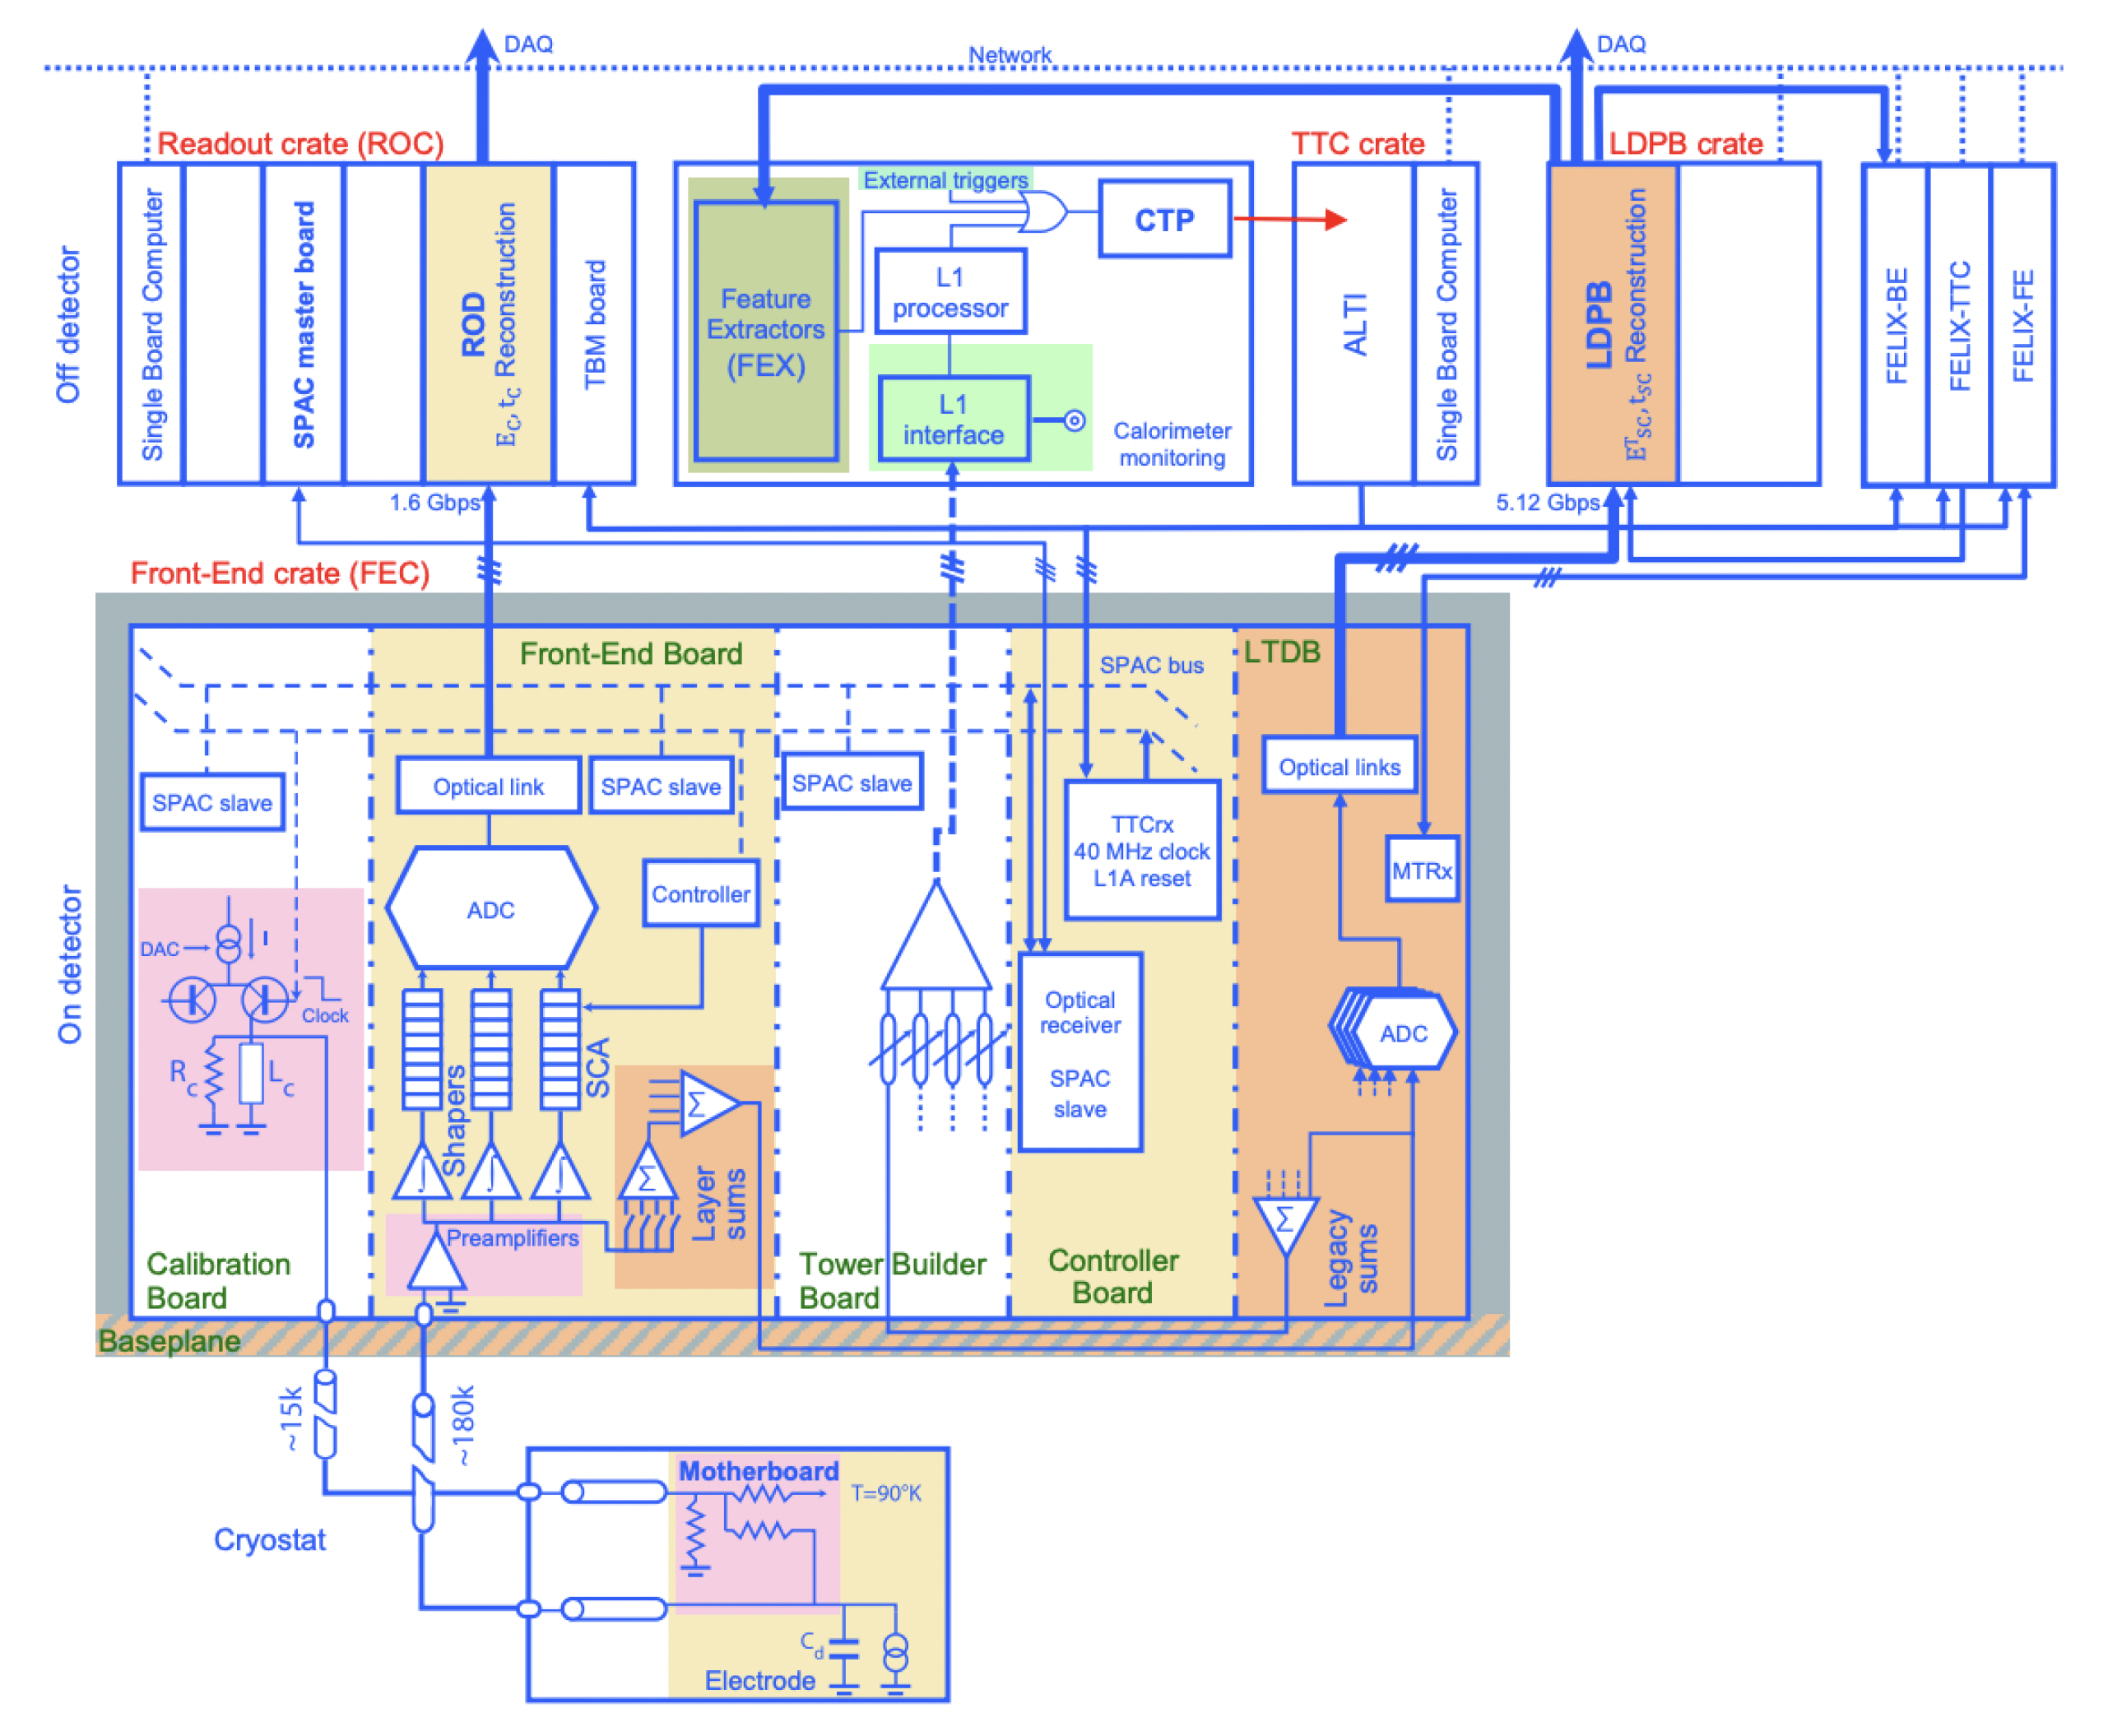
The newly installed readout electronics needed to be integrated in the ATLAS readout system; its performance had to be validated and the full new readout system needed to be commissioned for operations before the start of the Run 3 data-taking. The integration, validation and commissioning efforts started already during the installation period on subsets of the LAr detector after each half-FEC was refurbished and the corresponding digital trigger readout path was connected. The validation of the readout system is performed both by using injected pulses from the calibration boards into the front-end electronics and real data from the LAr detector signals [4,5].
For the main readout path, it had to be checked that, after the installation of the Phase-1 upgrade, the FEBs have a similar level of noise and calibration coefficients as before because, although the Phase-1 upgrade did not involve an upgrade of this readout path, the FEBs were extracted and re-inserted with refurbished electronics and additional routing. Calibration runs are taken and compared to the reference runs from the end of the LHC Run 2. These scans provide detailed information on the noise levels and on the calibration coefficients which result unchanged after the refurbishment, as can be seen in Figure 6. The figure shows an example of the comparison of the results from the new calibration runs to the Run 2 reference for the mean pedestal values in ADC counts, mean value of the RMS in ADC counts and mean value of the gain over the LAr Calorimeter cells in a given pseudorapidity ( η ) range.
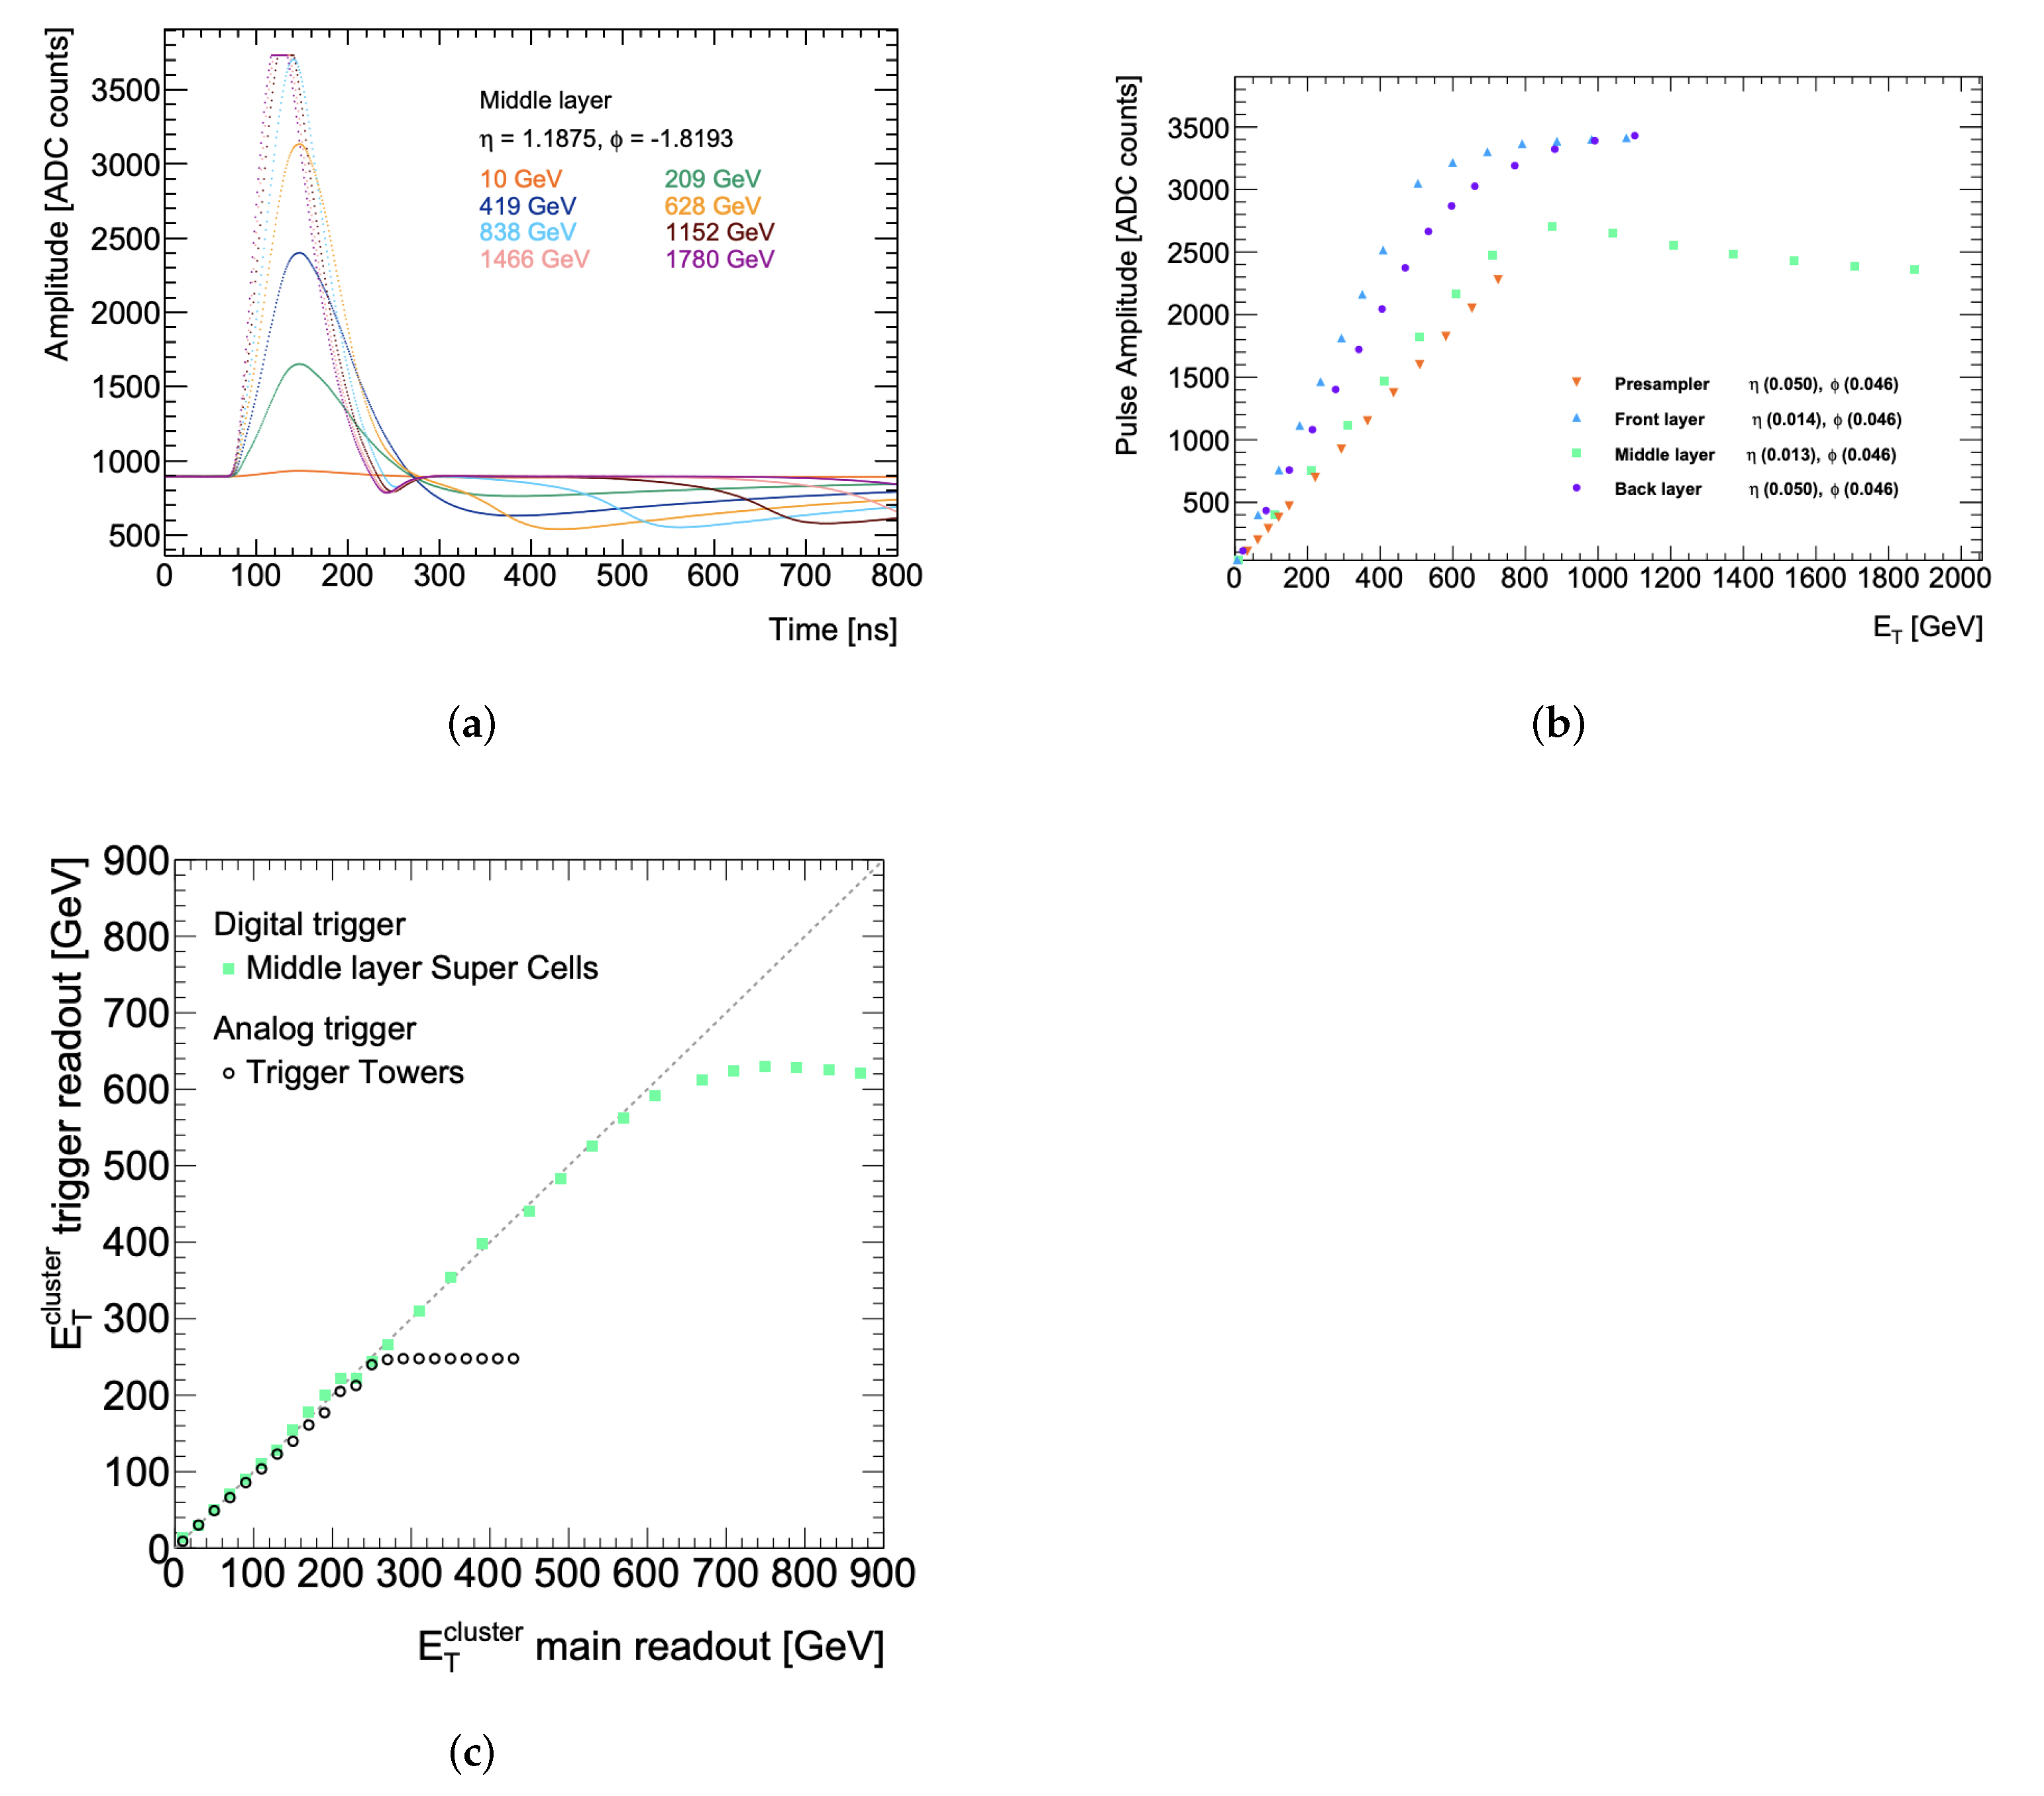
The new digital trigger readout is a completely new system installed for the Phase-1 upgrade that had to be validated. For this purpose, the full chain of the LAr digital trigger data acquisition, including the front-end and the back-end electronics, is tested after the installation. A set of input signal scans is defined and performed in order to validate the new system: mapping scans to check the connectivity of all channels, timing scans to align the various components in time, and calibration scans to validate the pedestal values, the pulse shape and the the gain value and linearity. The pulse shape collected by the LATOME can be verified by performing the so-called “delay runs”, consisting of a series of injected calibration pulses with a single input signal current with an increasing delay, used for reconstructing the pulse shape with high granularity of readout points (each every 1.04 ns) as shown in Figure 7 for different energy regimes. Distortion in the pulse shape can be seen at high energy due to saturation effects. The linearity of the response of the new digital trigger readout electronics can be measured using the so-called “ramp runs”, consisting of a series of injected calibration pulses with different amplitudes and measuring the peak ADC value with respect to the pedestal as a function of the E T corresponding to the injected pulse, as shown in Figure 7. The ADC values are linearly increasing with the deposited E T up to about 800 GeV, where saturation of the SC pulse occurs. There is no reference from Run 2 available for the new digital trigger readout, but the performance of this new readout path can be compared to the legacy analog trigger readout and to the main readout. Particularly, the E T deposited in the SCs can be compared to the E T deposited in the TTs and to the sum of the E T in the corresponding cells of the LAr calorimeter for injected signals. The SC data are collected by the new LATOME boards while the energy deposited in the cells and in the TTs is collected by the legacy main and trigger readout systems. As shown in Figure 7, the deposited energy measured by the LATOME of the new digital trigger system corresponds well to the one measured by the TTs of the legacy trigger system and by the main readout system up to the level where the signal on the legacy TTs or on the SCs is saturated.
For the initial commissioning and validation of the upgraded detector with real data from the LAr detector system, data events from the first LHC proton beams are triggered using the legacy trigger system and the response of the new trigger system is read-out as well to check its performance.
In October 2021, the LHC Run 3 pilot run took place, with the first proton beams circulating again in the LHC after 3 years of shutdown. During this run, the full ATLAS detector was operational and the LAr calorimeter system was already including both the legacy trigger readout system and the new digital trigger readout system. The LHC pilot run gave the opportunity to further test the LAr readout system after the Phase-1 upgrade with real data, checking both legacy and new trigger readouts, as well as the main readout, with the first observations of particle collisions after the upgrade, in preparation for the start of the LHC Run 3 data-taking.
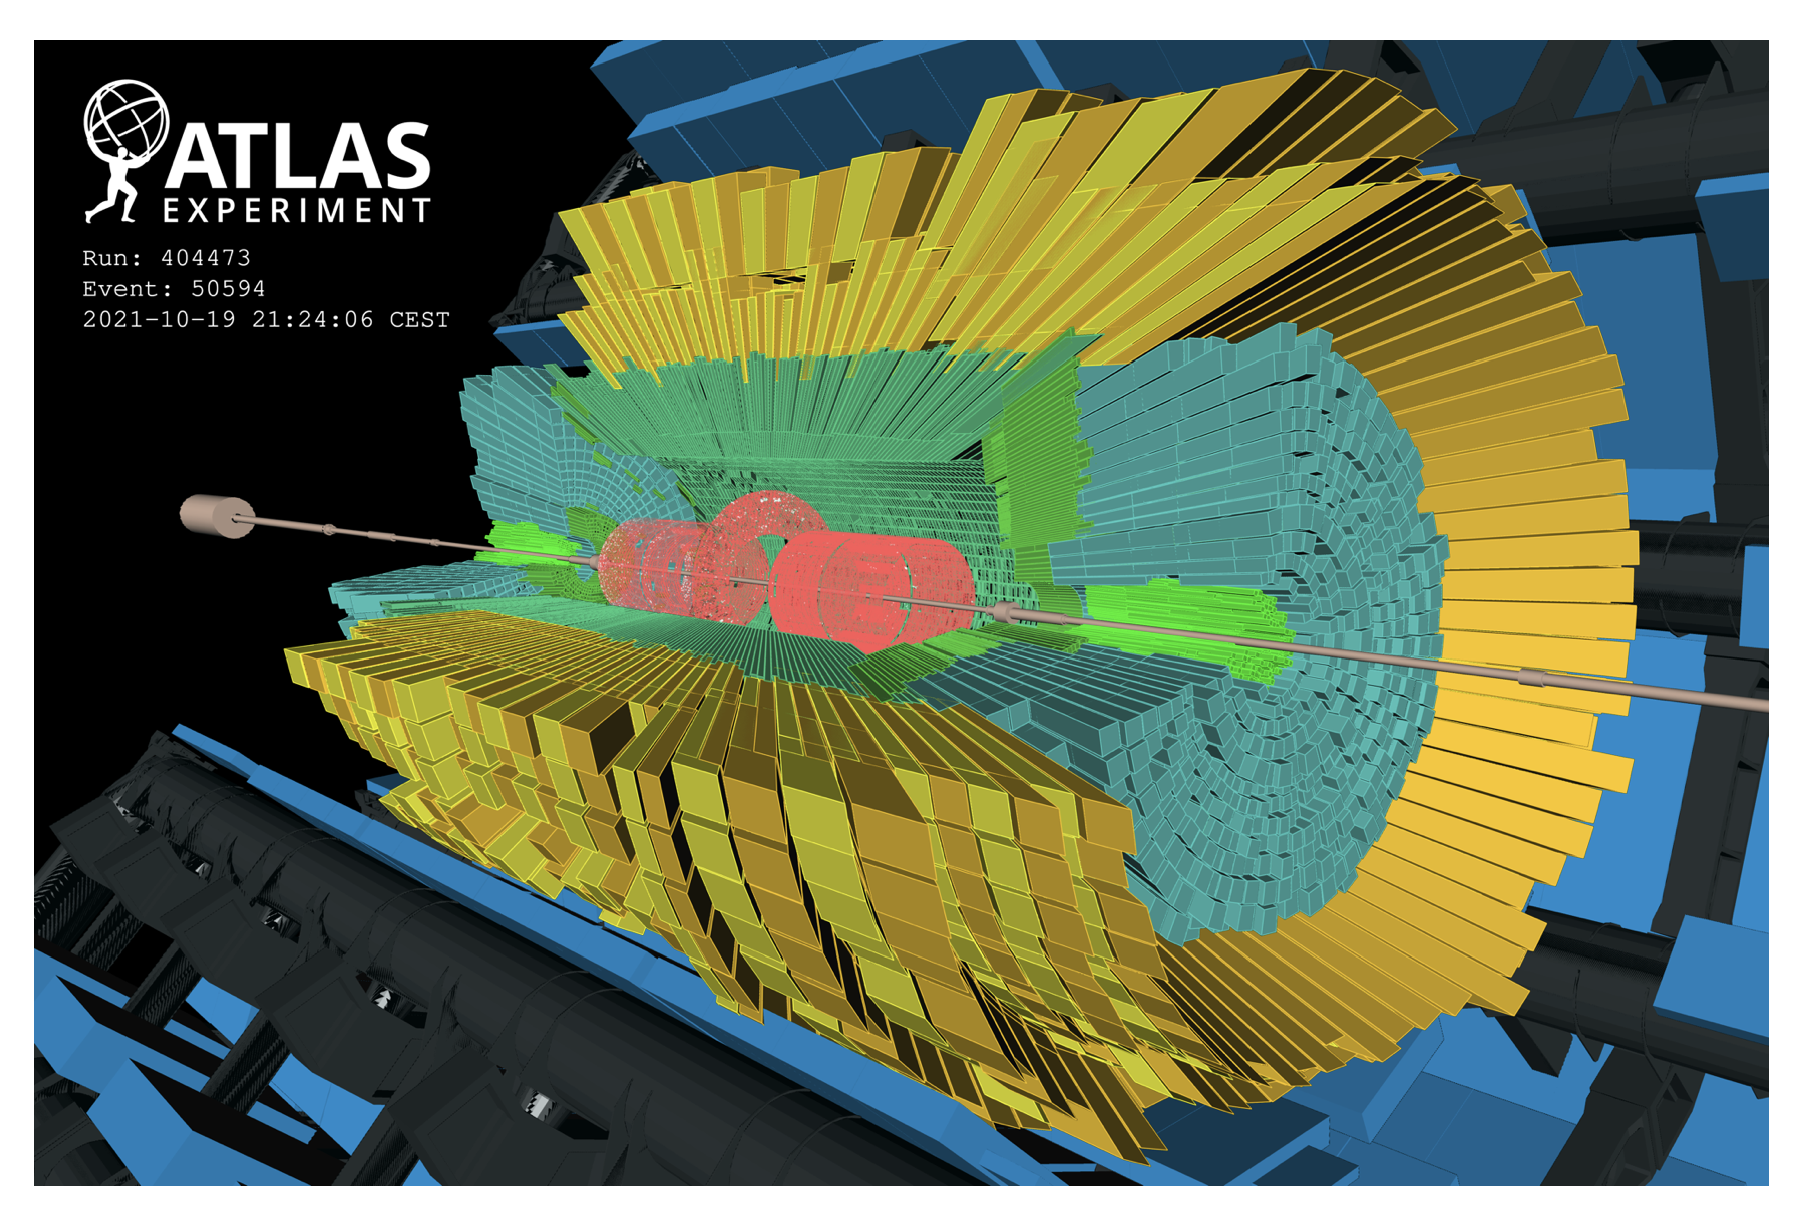
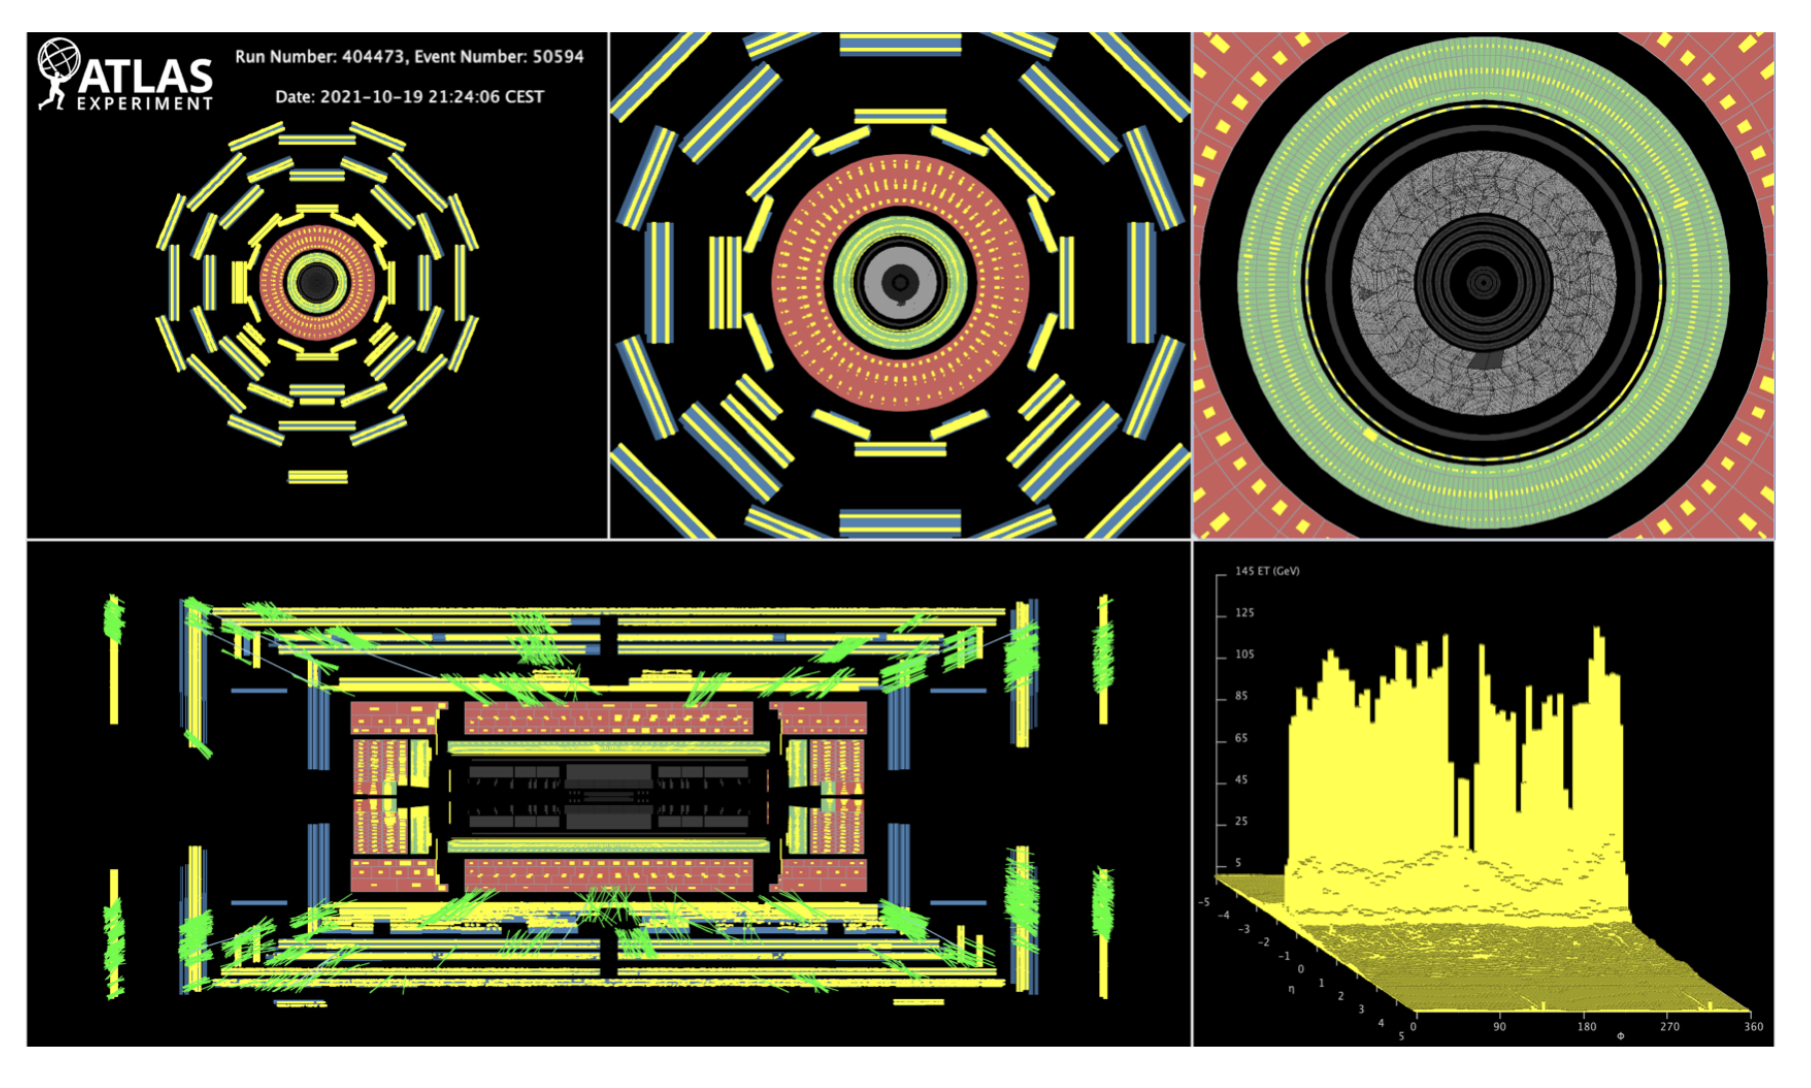
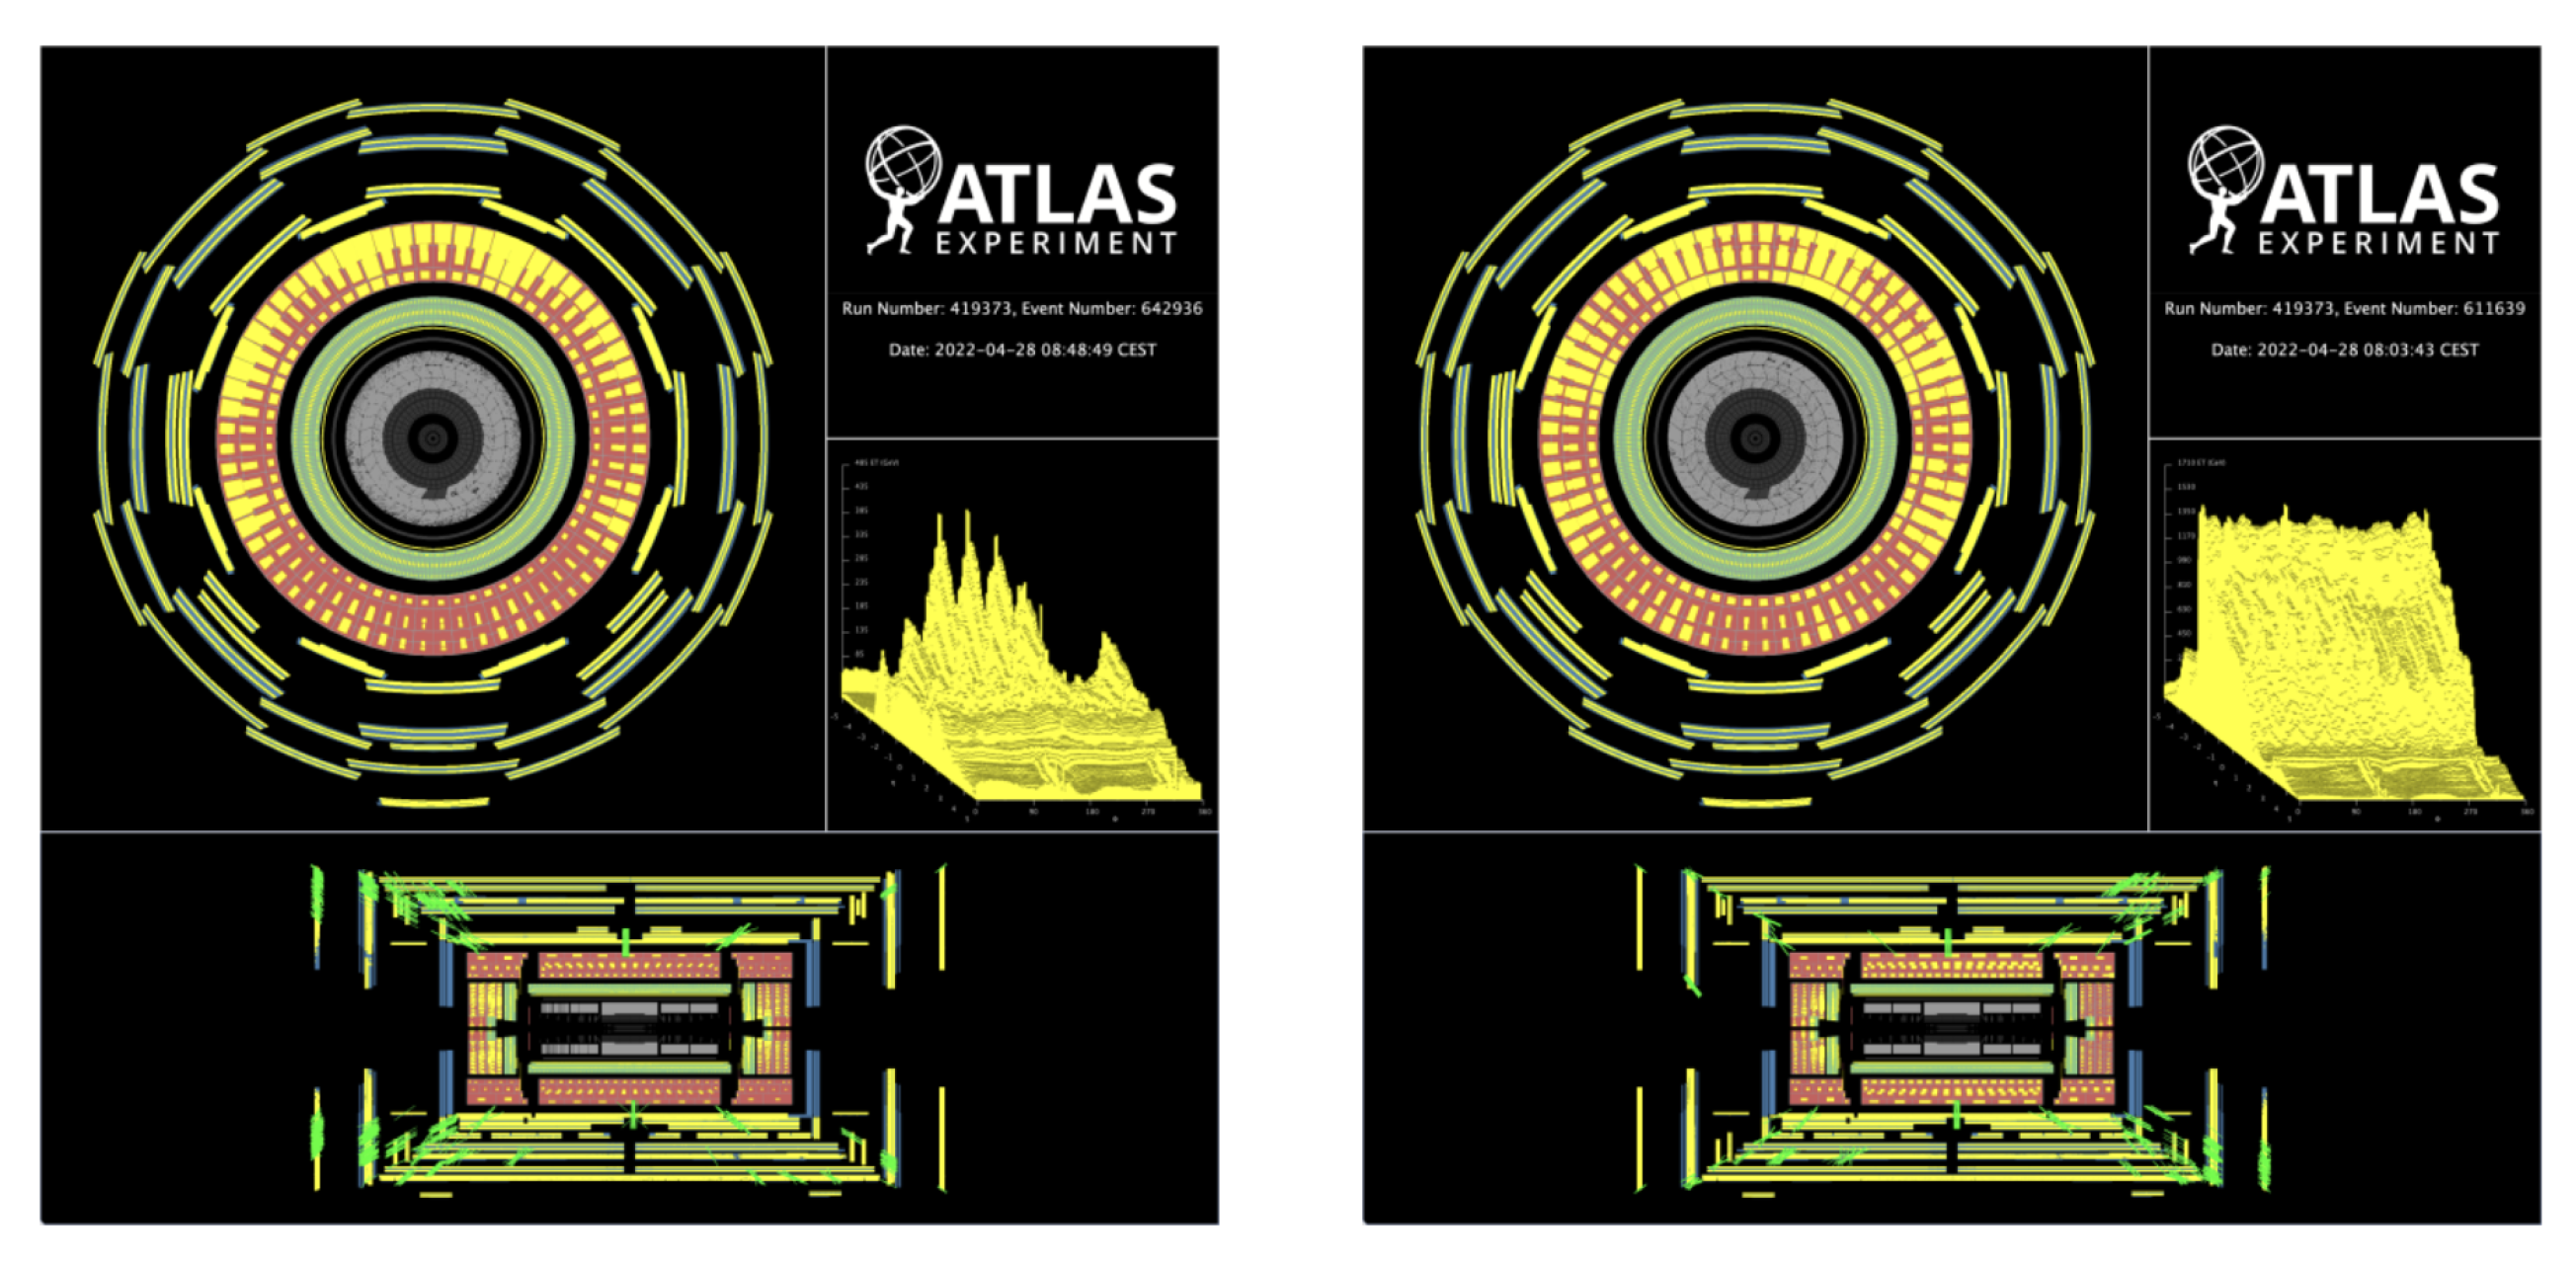
 Figure 8 and Figure 9 illustrate two events recorded by the ATLAS detector from the LHC beam splashes during the pilot run: the proton beam was accelerated to 450 GeV and focused to hit collimators placed in the beamline before the detector, such that the particles created in the interaction moved on, along the beamline and outwards, passing through the detector. The data visualised in the pictures have been recorded using the legacy trigger based on energy deposits in the LAr electromagnetic calorimeter on the C-Side of the detector. By looking at images like those, it was possible to check that all the sub-detectors were working and confirm the validity of the data-taking. This was a very important step in testing the whole data workflow, in anticipation of the LHC Run 3 physics program.
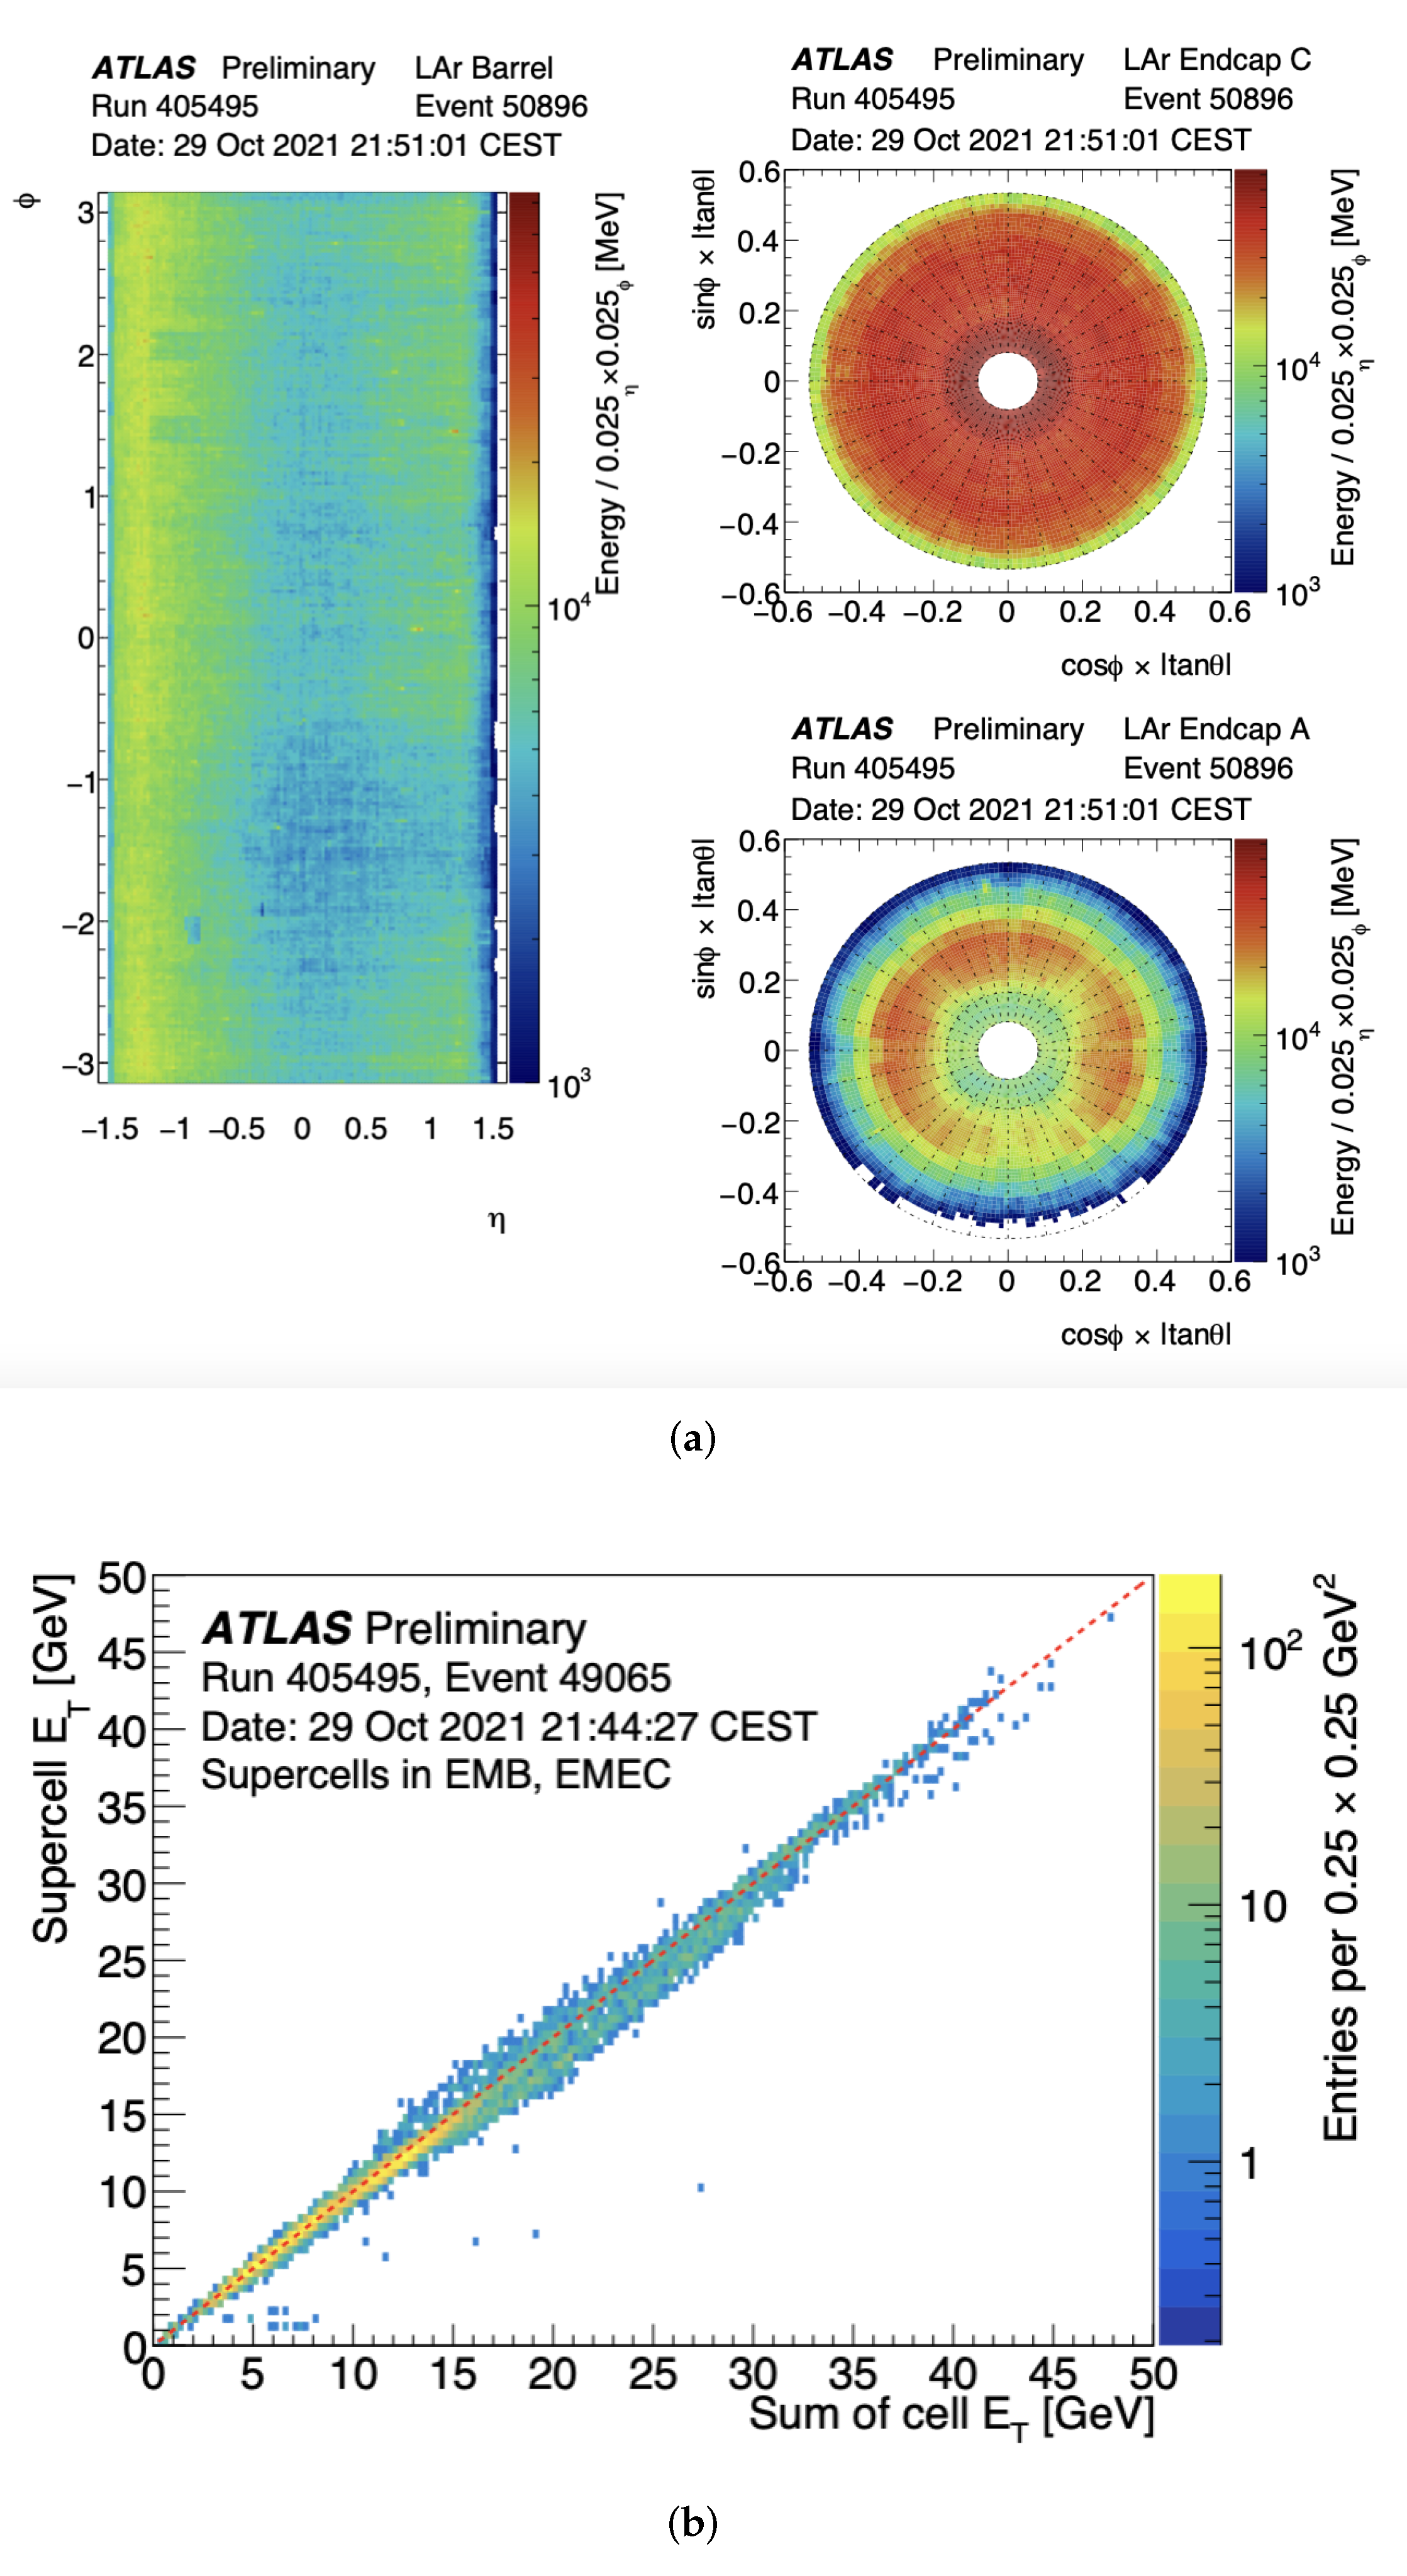
The data recorded by ATLAS from the beam splashes during the LHC pilot beam tests in October 2021 were also used to specifically check the performance of the LAr calorimeters after the Phase-1 upgrade. Figure 10a shows the LAr cell energy sums, distributed in a hypothetical tower grid with Δ η × Δ Φ = 0.025 × 0.025 , in the endcap C, in the barrel and in the endcap A. Figure 10b shows the measured SC E T from all layers of the LAr electromagnetic barrel (EMB) and electromagnetic endcaps (EMEC) compared to the summed transverse energies from their constituent calorimeter cells obtained through the main readout path. All these results are obtained using data from a single event of a beam splash run in October 2021. These first data from the LHC gave a confirmation of the good coverage of the detector readout after the upgrade and a confirmation of the good agreement between the energies measured by the new digital trigger readout and by the main readout even with preliminary calibration constants.
After the October 2021 LHC pilot run, the next milestone of the commissioning of the upgraded detector happened in April 2022, when the proton beams started circulating again in the LHC for the start of the LHC Run 3. Figure 11 illustrates two events recorded by the ATLAS detector from the LHC beam splashes on the first day of LHC Run 3 operations in April 2022. The data visualised in the picture have been recorded using the legacy trigger based on energy deposits in the LAr electromagnetic calorimeter on the C-Side of the detector. The analysis of these first LHC Run 3 beam splashes confirmed that the LAr calorimeter is ready for the start of the LHC Run 3 stable beams and physics data-taking runs in Summer 2022.
The strategy of triggering the events with the legacy analog trigger and reading out in parallel the response of the new digital trigger system is going to be kept for the first initial part of the Run 3 data-taking until the performance of the new digital trigger system will be fully checked and validated. After the full validation and confirmation that the performance of the new trigger system are satisfactory, the new digital trigger system will be used for triggering for the later main part of the Run 3 physics data-taking.

3. Conclusions

The installation of the ATLAS LAr calorimeter Phase-1 upgrade front-end and back-end readout electronics for the LHC Run 3 was completed successfully in October 2021. The newly installed components were integrated in the ATLAS detector readout system and their performance were validated already during the installation period using injected pulses into the front-end electronics. In October 2021, the full ATLAS detector was already operational during the LHC pilot beam splashes and was operational again during the first LHC Run 3 beam splashes tests in April 2022. The LHC beam splashes data confirmed good performance of the LAr calorimeters after the Phase-1 upgrade, with the main readout, legacy analog trigger and new digital trigger readout systems. The ATLAS LAr calorimeters are ready for the start of the LHC Run 3 physics data-taking in Summer 2022.

Author Contributions

LAr phase-1 upgrade validation and commissioning and calibration software development, A.B. All authors have read and agreed to the published version of the manuscript.

Funding

This research was supported in part by the US Department of Energy Award N. DE-SC0010129.

Institutional Review Board Statement

Not applicable.

Informed Consent Statement

Not applicable.

Data Availability Statement

Not applicable.

Conflicts of Interest

The authors declare no conflict of interest.

References

  1. ATLAS Collaboration. The ATLAS Experiment at the CERN Large Hadron Collider. J. Instrum. 2008, 3, S08003. [Google Scholar]
  2. ATLAS Collaboration. ATLAS Liquid-Argon Calorimeter: Technical Design Report; CERN-LHCC-96-041; CERN: Geneva, Switzerland, 1996. [Google Scholar]
  3. Buchanan, N.J.; Chen, L.; Gingrich, D.M.; Liu, S.; Chen, H.; Damazio, D.; Densing, F.; Duffin, S.; Farrell, J.; Kasamy, S.; et al. ATLAS liquid argon calorimeter front end electronics. J. Instrum. 2008, 3, P09003. [Google Scholar] [CrossRef]
  4. Aleksa, M.; Hervas, L.; Fincke-Keeler, M.; Wingerter-Seez, I.; Marino, C.; Enari, Y.; Majewski, S.; Lanni, F.; Clel, W. ATLAS Liquid Argon Calorimeter Phase-I Upgrade: Technical Design Report; CERN-LHCC-2013-017; CERN: Geneva, Switzerland, 2013. [Google Scholar]
  5. Aad, G.; Akimov, A.V.; Al Khoury, K.; Aleksa, M.; Andeen, T.; Anelli, C.; Aranzabal, N.; Armijo, C.; Bagulia, A.; Ban, J.; et al. The Phase-I trigger readout electronics upgrade of the ATLAS Liquid Argon calorimeters. J. Instrum. 2022, 17, P05024. [Google Scholar] [CrossRef]
Figure 1. Schematic view of the different sub-detectors composing the ATLAS Liquid Argon (LAr) Calorimeter system [1,2].
Instruments 06 00037 g001
Figure 2. Accordion-shaped LAr gap of the barrel with readout electrodes and high voltage lines (a) and triangular pulse produced in the LAr gap compared to the shaped and sampled signal (b) [2].
Instruments 06 00037 g002
Figure 3. Simulation of the energy deposits of a 70 GeV electron reconstructed with the Run 2 Trigger Towers (left) and with the new Super Cells that will be used during Run 3 (right) [4].
Instruments 06 00037 g003
Figure 4. Expected L1 trigger rates in Run 3 as a function of the EM transverse energy threshold ( E T ) for the case of the Run 2 trigger electronics (blue) and the new upgraded digital trigger electronics with different selections of shower shape variables (black and green) [4].
Instruments 06 00037 g004
Figure 5. The ATLAS LAr calorimeter readout electronics architecture for the LHC Run 3. The new LAr boards are highlighted in orange. This diagram depicts specifically the electronics of the EM calorimeters [5].
Instruments 06 00037 g005
Figure 6. Mean pedestal values in ADC counts (a), mean value of the RMS in ADC counts (b) and mean value of the gain over the LAr Calorimeter cells (c), in a given pseudorapidity ( η ) range. Only the cells of the second layer of the electromagnetic barrel on side A (EMBA) are included. The black line shows the values measured at the end of Run 2. The purple dots show the values measured after the refurbishment of the front-end crates and front-end boards.
Instruments 06 00037 g006
Figure 7. Pulse shape collected by the LATOME board for one SC in the barrel middle layer for several injected current pulses corresponding to different E T values (a), peak ADC value with respect to the pedestal as function of the E T corresponding to the injected pulse as seen on a LATOME board by four channels of the different calorimeter layers (b), comparison between the E T deposited in the middle layer SCs or TTs and the sum of the E T in the corresponding cells of the LAr barrel calorimeter (c) [5].
Instruments 06 00037 g007
Figure 8. Illustration of a data event recorded by the ATLAS detector from the LHC beam splashes during the LHC pilot run in October 2021. The image shows a cutout view of the ATLAS detector for an event where the proton test beam from the LHC is coming into the ATLAS detector from the left of the picture (which shows the A-Side of the detector) and travelling to the right (showing the C-Side). The red stripes are used to visualise the particle-matter interactions in the inner layers, the green boxes show the energy deposits in the LAr calorimeters, the yellow boxes visualise energy deposits in the TileCal hadronic calorimeter and the blue boxes surrounding the central part of the image are part of the ATLAS muon spectrometer, shown here for context.
Instruments 06 00037 g008
Figure 9. Illustrations of a data event recorded by the ATLAS detector from the LHC beam splashes during the LHC pilot run in October 2021. The proton test beam from the LHC is coming into the ATLAS detector from the right of the picture (showing the A-Side of the detector) travelling to the left (the C-Side). In the image, the yellow boxes show energy deposits in all layers of the ATLAS detector. From the centre moving outwards, the image shows particle interactions in the inner tracking detectors, in the electromagnetic and hadronic calorimeters, and in the muon detectors.
Instruments 06 00037 g009
Figure 10. LAr cell energy sums distributed in a hypothetical tower grid with Δ η × Δ Φ = 0.025 × 0.025 in the endcap C, in the barrel and in the endcap A (a), and measured SC E T from all layers of the LAr Electromagnetic Barrel (EMB) and Electromagnetic Endcaps (EMEC), compared to the summed transverse energies from their constituent calorimeter cells, obtained through the main readout path (b) with data from a single event of a beam splash run in October 2021.
Instruments 06 00037 g010
Figure 11. Illustrations of data events recorded by the ATLAS detector from the LHC Run 3 beam splashes tests in April 2022. In the event shown on the left, the spray of particles enters ATLAS from the right hand side of the picture (the A-Side of the detector) travelling to the left (the C-Side), while in the event shown on the right the particle enter ATLAS from the lefthand side of the picture (the C-Side of the detector) and travel to the right (the A-Side). In both images, the yellow boxes show energy deposits in all layers of the ATLAS detector. From the centre moving outwards, the image shows particle interactions in the inner tracking detectors, in the electromagnetic and hadronic calorimeters, and in the muon detectors.
Instruments 06 00037 g011
Publisher’s Note: MDPI stays neutral with regard to jurisdictional claims in published maps and institutional affiliations.

