Article

Functional Imaging of the Ocular Fundus Using an 8-Band Retinal Multispectral Imaging System

by
Emanuel R. de Carvalho
1,2,3,*,
Richelle J. M. Hoveling
2,
Cornelis J. F. van Noorden
1,4,
Reinier O. Schlingemann
1,5 and
Maurice C. G. Aalders
2,*
1
Ocular Angiogenesis Group, Departments of Ophthalmology and Medical Biology, Amsterdam UMC, University of Amsterdam, 1105 AZ Amsterdam, The Netherlands
2
Department of Biomedical Engineering and Physics, Amsterdam UMC, University of Amsterdam, 1105 AZ Amsterdam, The Netherlands
3
Moorfields Eye Hospital NHS Trust, London EC1V 2PD, UK
4
Department of Genetic Toxicology and Tumor Biology, National Institute of Biology, 1000 Ljubljana, Slovenia
5
Department Ophthalmology, University of Lausanne, Jules-Gonin Eye Hospital, Fondation Asile des Aveugles, 1004 Lausanne, Switzerland
*
Authors to whom correspondence should be addressed.
Instruments 2020, 4(2), 12; https://doi.org/10.3390/instruments4020012
Submission received: 29 February 2020 / Revised: 23 April 2020 / Accepted: 3 May 2020 / Published: 7 May 2020

Abstract

:
Application of functional imaging in ophthalmology requires efficient imaging techniques that can detect and quantify chromophores to visualise processes in vivo. The aim of the present study was to develop and evaluate a fast and affordable imaging system. We describe an eight-band retinal multispectral imaging (MSI) system and compare it with a hyperspectral imaging (HSI) device. Determination of blood oxygen saturation was studied as proof of principle. Reflectance of incident light is measured as 1/absorbance at different wavelengths between 440 nm and 580 nm. Both devices have incorporated optical bandpass filters in a mydriatic fundus camera. The MSI system scans the retina at eight pre-defined wavelengths specific for the spectrum of haemoglobin. The HSI system acquires a full scan from 480 to 720 nm in 5 nm steps. A simple assessment of the ratio between the absorbance peaks of oxygenated haemoglobin (HbO2) and reduced haemoglobin (HbR) was not suitable for generating validated oxygenation maps of the retina. However, a correction algorithm that compares the measured reflectance with reflectance spectra of fully oxygenated and fully deoxygenated blood allowed our MSI setup to estimate relative oxygen saturation at higher levels, but underestimated relative oxygen saturation at lower levels. The MSI device generated better quality images than the HSI device. It allows customisation with filter sets optimised for other chromophores of interest, and augmented with extrinsic contrast imaging agents, it has the potential for a wider range of ophthalmic molecular imaging applications.

1. Introduction

The ability to follow molecular and cellular processes in the retina in vivo would be a powerful diagnostic aid. For the recognition of chromophore molecules with characteristic light absorption properties, spectroscopy can be integrated into conventional ocular fundus cameras to provide retinal spectral imaging. Recent developments include hyperspectral imaging (HSI) and multispectral imaging (MSI). In HSI, sequential image acquisition is performed in small steps in a pre-defined wavelength range using tuneable filters [1], Fourier transform spectrometers [2], spectro-temporal scanners [3], or volume holographic methods [4]. MSI uses only a limited number of wavelengths—those with distinct absorbance peaks corresponding with those of the chromophore of interest (the spectral signature). Because the images are captured at only a small number of wavelengths rather than uniformly across a range of the electromagnetic spectrum, the acquisition time for MSI is shorter than for HSI.
Both HSI and MSI generate three-dimensional (3D) datasets of reflectance of incident light, which is 1/absorbance, also known as spectral hypercubes, which contain two spatial dimensions (x, y) and one wavelength dimension (λ) [5]. A reflectance spectrum can be obtained from each individual pixel (xj, yk) for each wavelength (λi) [5].
Commercially-available fundus cameras that incorporate retinal spectral imaging give the technique the advantages of a large field of view, user friendliness, and high resolution [6,7,8,9,10,11]. However, the development of retinal spectral imaging devices still needs to address several challenges inherent to spectral imaging of living tissue: limited transmission of light, image misalignment, temporal differences in tissue perfusion and spectral and spatial calibration. Below 500 nm, most of the incoming light is absorbed by the filters, reducing the signal-to-noise ratio with consequent degradation of the quality of the image. In addition, the high degree of variability of background signals induced by wavelength-dependent scattering may complicate data interpretation [12]. Furthermore, image acquisition in the retina is very sensitive to cardiac-dependent differences in retinal perfusion patterns and eye movement artefacts [13,14]. Lastly, the raw spectral imaging data from an ocular fundus are affected by the intensity of illumination, the sensitivity of the detector and the transmission of the optics [15]. The effect of these factors is mostly wavelength dependent, but is also sensitive to spatiotemporal variations. Image registration and alignment software allow images to be spatially aligned, but illumination levels may differ in the selected regions of interest due to changes in angle of illumination because of movement and the anatomical curvature of the ocular fundus [16].
The aim of the present study was to develop and evaluate a fast and affordable retinal MSI system in order to facilitate implementation of ophthalmic molecular imaging techniques in the retina. A commercially-available fundus camera was fitted with a filter wheel in the optical path. This new system measures at eight wavelength bands with improved light-sensitivity resulting in a considerable reduction of the acquisition time. The new system was compared with a purpose-built HSI system comprising a liquid-crystal tuneable filter (LCTF) incorporated in a similar fundus camera. Determination of blood oxygen saturation in the retina was studied as proof of principle. Oximetry, the spectroscopic determination of blood oxygen saturation levels is based on the ratio of oxygenated haemoglobin (HbO2) and reduced haemoglobin (HbR). Both HbO2 and HbR have specific absorbance characteristics which can be measured and used to estimate blood oxygen saturation levels. Various methods have been described for estimation of blood oxygen saturation levels, relying on measurements of light absorbance at two [17], three [18], four [19,20] or five [21] different wavelengths. The first retinal oximetry studies using spectral recordings were reported by Hammer and co-workers [22,23].
In retinal oximetry, estimation of blood oxygenation is usually ascertained from the major inner retinal vasculature [24]. Oxygenation measurements in retinal tissue are difficult to validate due to the dual vasculature of the neurosensory retina and wavelength-dependent penetration depth of the laser light. In this study, we provide an estimation of the relative retinal oxygen saturation in retinal tissue and inner retinal vasculature.

2. Materials and Methods

2.1. The Hyperspectral Fundus Camera

The HSI device consisted of a commercial mydriatic fundus camera (TRC-50LX; Topcon, Tokyo, Japan) and an LCTF (VariSpec; CRI, Woburn, MA, USA) incorporated in the optical path. The LCTF is a narrow bandpass filter based on a Lyot filter. Reflected and filtered light is captured by a high resolution camera with a spatial resolution of 1280 × 1024 pixels (DCC1545M, high resolution CMOS camera; Applied Laser Technology, Best, The Netherlands). The optical bandwidth of the LCTF was limited to wavelengths between 480 and 720 nm. To reduce noise generated by light reflected by the cornea and crystalline lens, the annular stop of the fundus camera was optically conjugated with the pupil of the eye. A linear polarizer was used in the optical path of the light source, in an orientation perpendicular to the polarizer in the LCTF, to reduce specular reflection from the objective and from within the eye. The bandwidth varied between 5 nm at short wavelengths to 20 nm at longer wavelengths. The response time varied from 50 to 150 ms. The field of view corresponded to approximately 35 degrees. The average time to acquire a full data set was dependent on the selected range of wavelengths; for a full spectrum, with 5 nm steps, the acquisition time was approximately 15 s. All acquired images were combined into a hypercube data set for further analysis. The HSI imaging system was controlled with a customized software program, written in LabView (National Instruments, Austin, TX, USA). A saturation histogram, live feed of the charge-coupled device (CCD) recording, and retinal spectral image stacks were displayed on the software user interface.

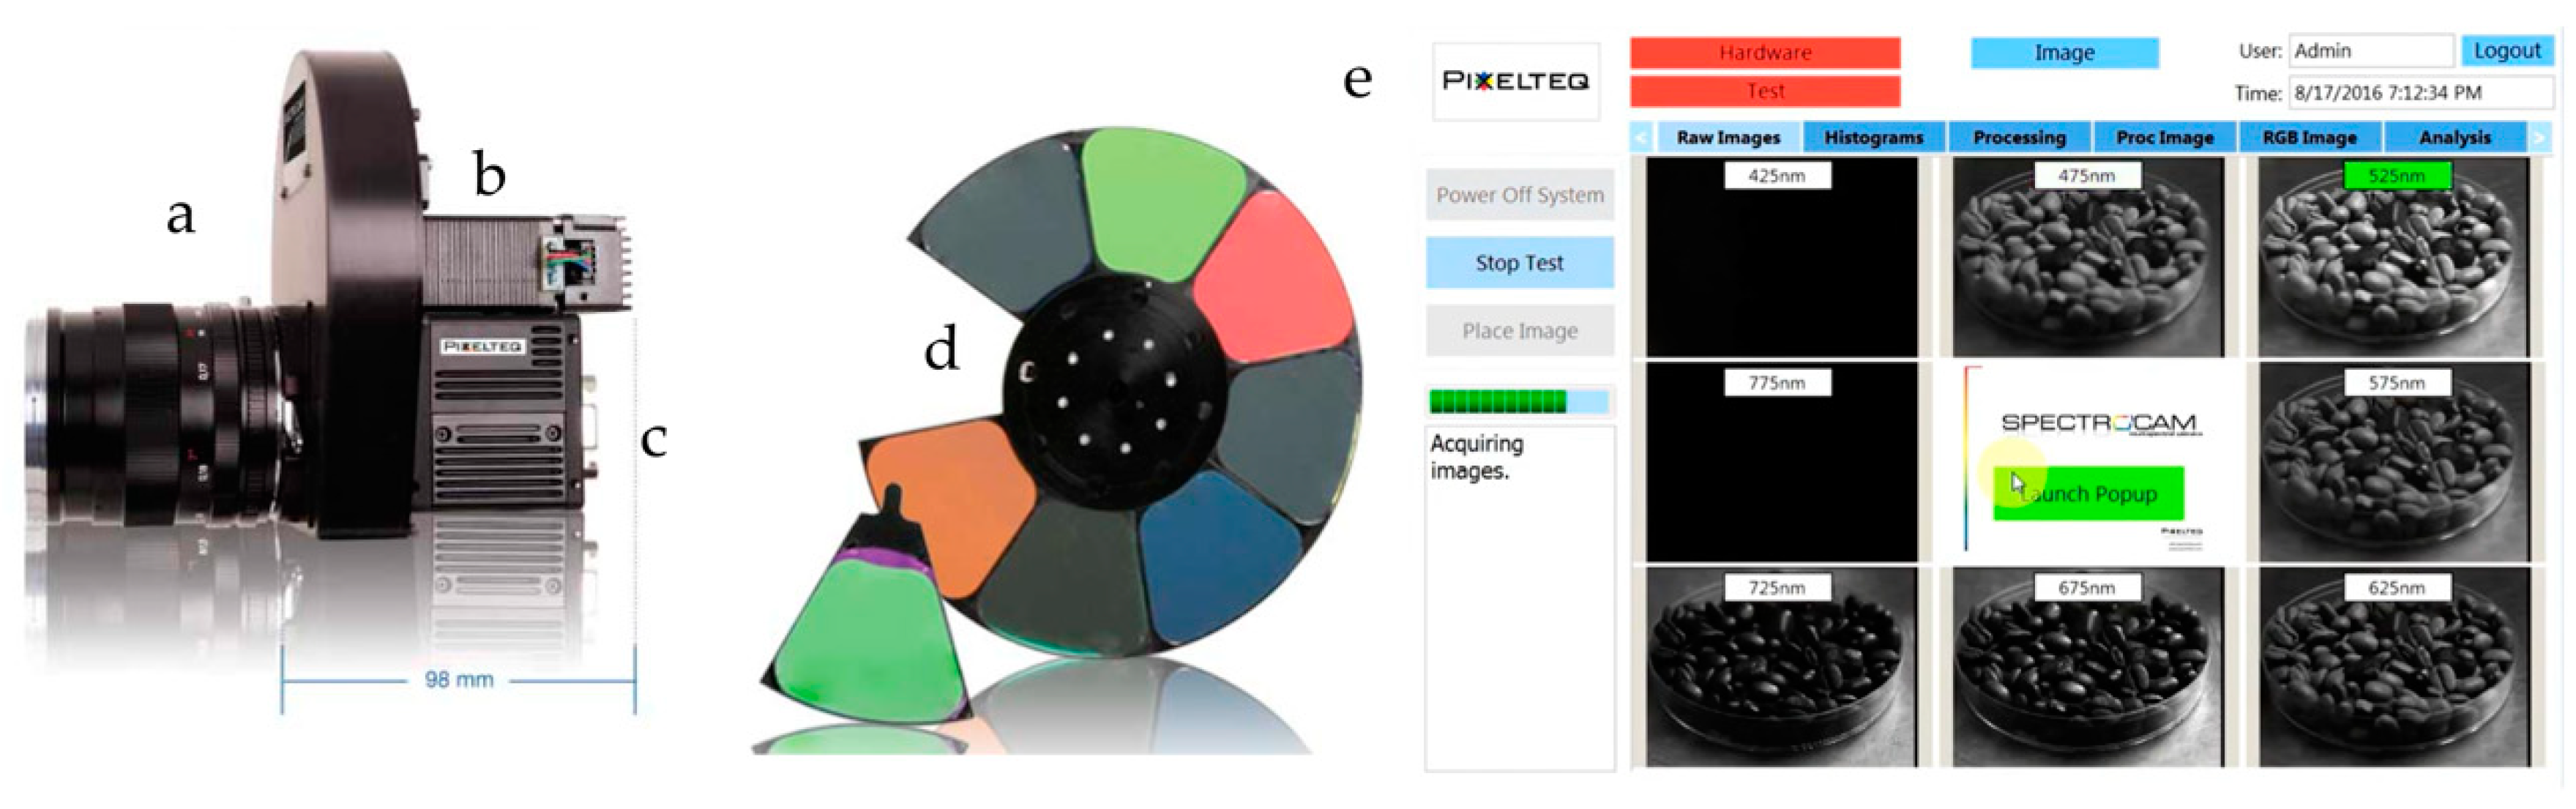
2.2. The Multispectral Fundus Camera

Our MSI system was similar to the one described above with exception of the tuneable filter and camera. The incorporated system was a SpectroCam Multispectral Imaging System (Ocean Insight, Duiven, The Netherlands) which featured a high-speed rotating filter wheel containing eight interchangeable optical filters (Figure 1). The following filters were selected: 450 nm (15 nm bandwidth), 480 nm (25 nm bandwidth), 509 nm (10 nm bandwidth), 542 nm (10 nm bandwidth), 558 nm (5 nm bandwidth), 578 nm (10 nm bandwidth), 620 nm (20 nm bandwidth) and 850 nm (45 nm bandwidth). This filter set was optimized to the spectral signatures of the main chromophores in the visible spectrum for HbO2 and HbR. A wideband VIS/NIR CCD camera, with a resolution of 1392 × 1040 pixels (1.4 MP, 6.45 μm pixel pitch 8 of spectral bands, up to 20 frames/s, Gig-E interface, 12 bit depth), sensitive to a range from ultraviolet to near infrared, was used to capture the retinal images. A linear polarizer was attached to the front of the CCD to reduce a fixed-pattern artefact caused by the specular reflection from the two surfaces of the objective lens within the fundus camera and from within the eye. The field of view corresponded to approximately 20 degrees. The average time to acquire a full data set of spectral images was approximately 3 s, and 1 s when 2 wavelengths were applied (e.g., for ratio calculations). The MSI imaging system was controlled with a software program provided by the manufacturer (Pixelteq, Ocean Insight). A saturation histogram, live feed of the CCD recording, and retinal spectral image stacks were displayed on the software user interface.

2.3. Participants and Image Acquisition

This study adhered to the tenets of the Declaration of Helsinki. Informed consent was obtained from each subject before imaging. Thirty voluntary healthy participants with ages between 18 and 79 were scanned. Ten eyes were imaged using the HSI device and 20 eyes were imaged using the MSI device. All volunteers underwent a preliminary full ophthalmic examination to rule out any underlying ophthalmic pathology. Subjects unable to abstain from blinking or movement during image acquisition were excluded. Poor quality images with significant artefacts were discarded. The original light source of the commercial mydriatic fundus camera (Topcon) was maintained in the setup of both HSI and MSI cameras thus complying with the established safety criteria for photobiological safety of lamps and ophthalmic instruments [25].
Prior to eye scanning, the pupil was dilated using tropicamide 1% (1 drop). Eye fixation was maintained by instructing the subject to focus on a red-fixation light with the contralateral eye. Acquisition time was 15 s for the HSI device and 2.5 s for the MSI device. Scanning was repeated whenever large eye movements or blinking was observed. A minimum of three scans were acquired for every subject, to a maximum of 10 scans per sitting. The best quality scans with the least amount of motion artefacts were selected for analysis.

2.4. Data Pre-Processing and Analysis

Calibration and spectral pre-processing were performed to eliminate or minimize unwanted artefacts such as noise, dead and spiked pixels, specular reflections, scattering effects and other instrumental variations. First, the dark response [Idark,ij(λ)] of the camera was subtracted. In order to correct for wavelength-dependent intensity differences in the light source, the background response of a white reference plane (blank paper) at all wavelengths [Iwhite(λ)] that were previously corrected for the dark response, was obtained:
R i j ( λ ) = I i j ( λ ) I d a r k , i j ( λ ) I w h i t e ( λ ) I d a r k , i j ( λ ) ,
where R is reflectance, I is light intensity and i and j are horizontal and vertical pixel indices. Reflectance spectra obtained from the HSI measurements were corrected using the standard normal variate algorithm [26]. All data analysis was performed using custom-made scripts written in MATLAB (The Mathworks, Natick, MA, USA).
For image registration and preprocessing, a cross-correlation technique was used in which similar images were used for alignment. Spectral images were aligned according to the coordinates of a reference image. Cross-correlation techniques required similar features between images irrespective of the wavelength. However, the appearance of spectral images changed with wavelength. Therefore, sequential spectral retinal images were acquired in such a way that the main features in retinal images (optic disc and large retinal vessels) were located in similar positions in the image field. Automatic motion correction was performed using ImageJ and the tool “linear stack alignment via scale invariant feature transform” [27] to transform image data into scale-invariant coordinates relative to local features.
Alternatively, for selection of images, a single wavelength image was taken that showed the highest contrast between different components based on reflectance differences. Compositional contrast between pixels in an image was displayed by grayscale with intensity scaling. Image quality was highly variable and was dependent on clarity of the media (presence of cataract), movement of the subject, fixation of the eye and intolerance to standard illumination levels. Poor quality images (defocused or with high movement between frames) were discarded after evaluation by two observers. Data analysis was performed using custom-made scripts written in MATLAB (The Mathworks).
For image processing, two different methods were applied using haemoglobin as an intrinsic chromophore.
The first (indicative) method was based on the spectral signature of HbO2 and HbR. Figure 2 shows that the spectrum of HbO2 has absorbance peaks at 542 and 578 nm and an absorbance trough at 558 nm, whereas the spectrum of HbR has an absorbance peak at 558 nm. At 558 nm, the measured reflectance depends on contributions of both HbO2 and HbR and from other chromophores. In a low oxygenation state the contribution of HbR is increased, resulting in a low ratio between reflectance values at 558 and 578 nm. In cases of a high oxygenation state, the contribution of HbO2 is increased, resulting in a high 558/578 reflectance ratio. These ratios are affected by scattering and light absorbance by chromophores other than haemoglobin. The reflectance measurements have not been directly validated (e.g., against ex vivo measurements in phantom or Monte-Carlo simulations), therefore the acquired data can only be used to obtain an estimation of HbO2/HbR ratios which were expressed as the logarithm of the ratio of the reflectance values at 558 and 578 nm.
The second method was based on an algorithm that corrects for the effects of non-haemoglobin light absorption as well as tissue scattering. The measured reflectance spectra were corrected by linear transformation in order to match these with reference spectra of HbO2 and HbR at three isosbestic points, as first described by Hammer et al. [19]. Isosbestic wavelengths are the wavelengths at which the molar extinction coefficients of HbO2 and HbR are the same (Figure 2a and Table 1). The O2 saturation can then be determined by assuming a linear relationship with the corrected intensity at a wavelength showing a high contrast between HbO2 and HbR (e.g., 558 nm). The original algorithm uses data at three isosbestic wavelengths (522, 569, and 586 nm) as well as 560 nm. The quality of the HSI data at these wavelengths precluded application of this correction method to images obtained with the HSI technique. We selected four wavelengths for images obtained with the MSI device, 509, 542, 578 and 558 nm (Table 1), resulting in reflectance measurements X509, X542, X578 and X558. The theoretical reflectances R509, R542, R578, R0%558 and R100%558 were derived from the reference data. The reference data stemmed from the data shown in Figure 2, which depicts the absorption spectra for the pure components HbR and HbO2. In practice, a mixture of two absorbers was measured, resulting in an absorption value between these two extremes. The superscripts 0% and 100% denote deoxygenated and oxygenated blood, respectively. X is again expressed as the logarithm of the reflectance value in the pixel and R as the logarithm of the reflectance values of HbR and HbO2.
We performed a simulation to assess the performance of the algorithm with our selected wavelengths. Results of the simulations are expressed as “estimated” oxygenation values versus ”absolute” oxygenation status. By combining the reflectance spectra of both HbO2 and Hb, we simulated oxygenation levels between 0% to 100% oxygenation. For example, an oxygenation level of 80% consists of a combination of HbO2 and Hb in a 4:1 ratio. Results of the estimation are plotted against the input oxygenation value. We compared the selected combination of wavelengths with wavelengths presented in two other studies [19,28] and the isosbestic wavelengths for the spectra of HbO2 and Hb (Table 1). Wavelength D is not an isosbestic point, but this wavelength is required to calculate the difference between HbO2 and Hb as this is one of the points in the spectrum with the largest difference between the absorbance of spectra.
The algorithm comprises the following five steps. Each letter in the algorithm corresponds to a specific set of wavelengths used in this and other studies.
1.
A linear function g(λ) with g(A) = RA and g(C) = RC is determined.
2.
A linear function f(λ) with f(A) = XA and f(C) = XC is determined.
3.
The measured data are added by the difference between g(λ) and f(λ):
X ( λ ) = X ( λ ) + g ( λ ) f ( λ ) .  
The correction compensates for any absorption or scattering due to chromophores other than Hb and forces the values of the measurements to be identical with that of the reflectance data of the isosbestic wavelengths A and C.
4.
A second correction step is applied to the data X′(λ) in order to correct for different conditions of illumination and measurement between the sample spectrum and the reference spectra. In this correction step the data X′(λ) is stretched and compressed around the line g(λ) to match the reference data at isosbestic wavelength B:
X = g ( λ ) ( X ( λ ) g ( λ ) ) ( R D g ( D ) ) X ( B ) g ( B )
5.
The oxygen saturation (OS) is indicated by X″(D) on a linear scale between RHb(D) and RHbO(D):
O S = X ( D ) R 0 % ( D ) R 100 % ( D ) R 0 % ( D ) × 100 %   .

3. Results

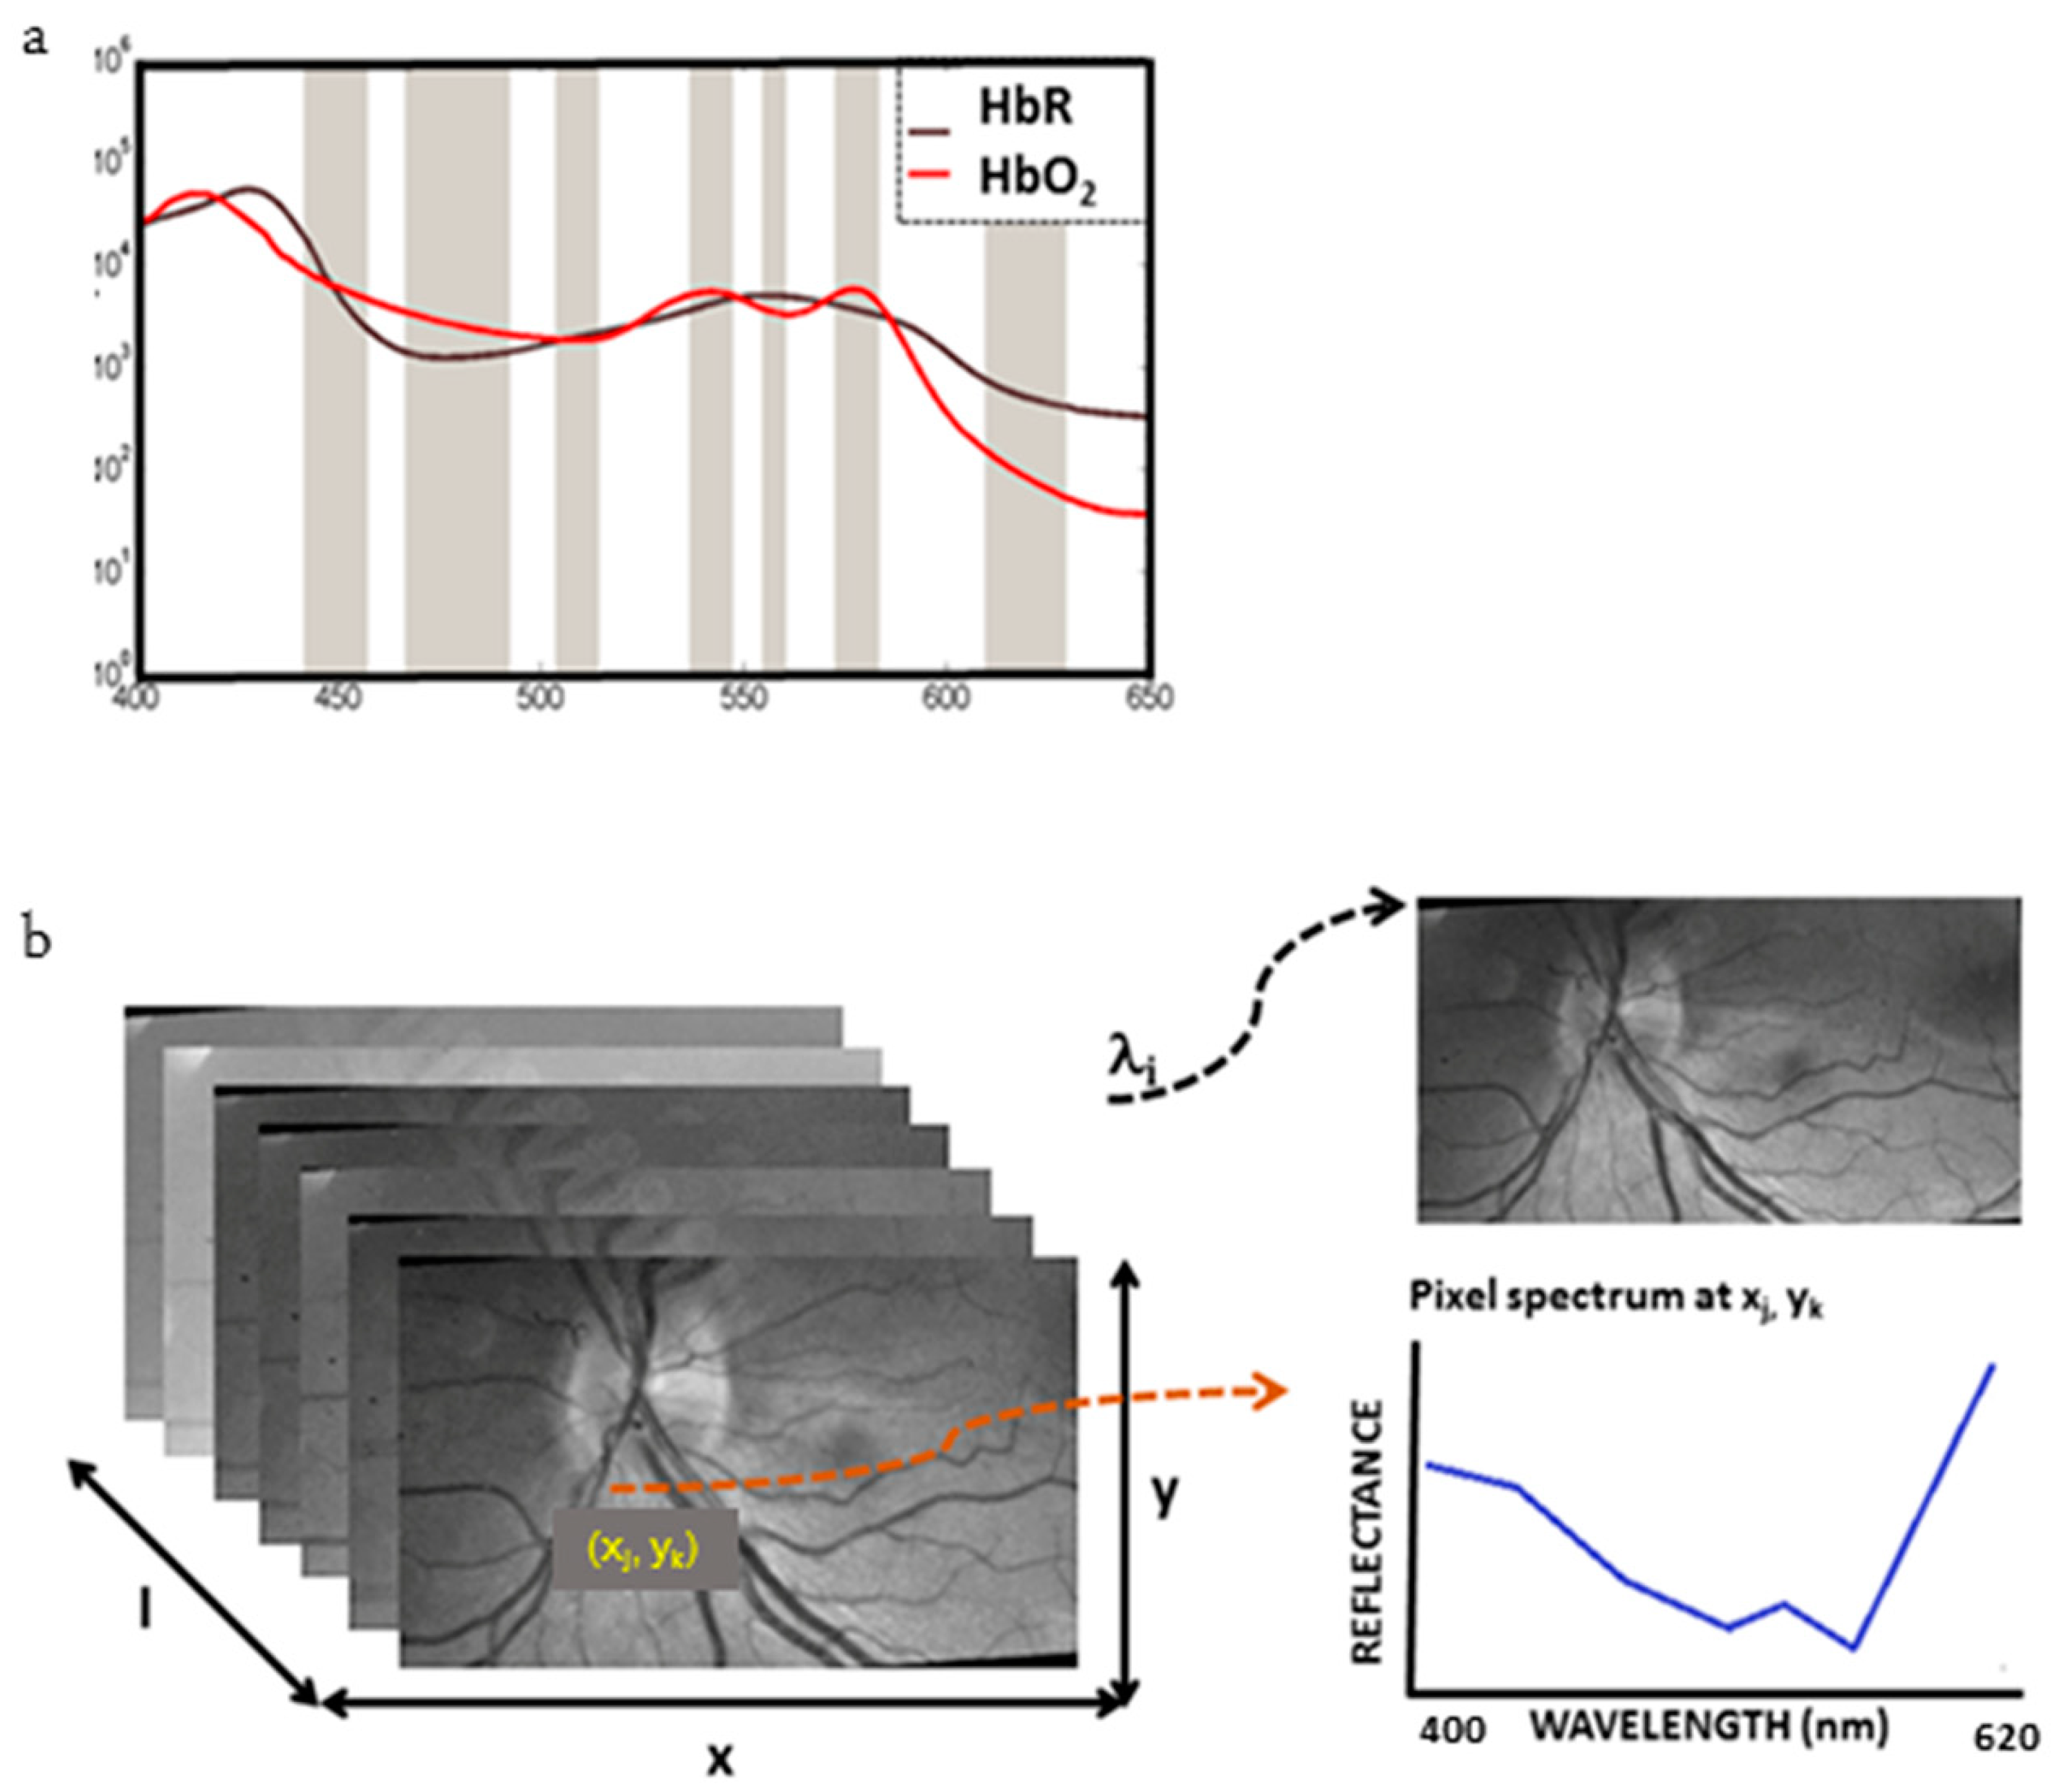
3.1. The Ocular Fundus Hypercube

Figure 2b shows a hypercube of images for each wavelength (λi) and a reflectance spectrum for each individual pixel (xj, yk). Figure 3 shows a typical retinal spectral data set at specific wavelengths obtained with the MSI and HSI devices. Image analysis demonstrates that light penetration is wavelength-dependent, which results in an inhomogeneous representation of retinal structures at different wavelengths. At wavelengths above 590 nm, the choroidal vasculature becomes visible with both techniques.

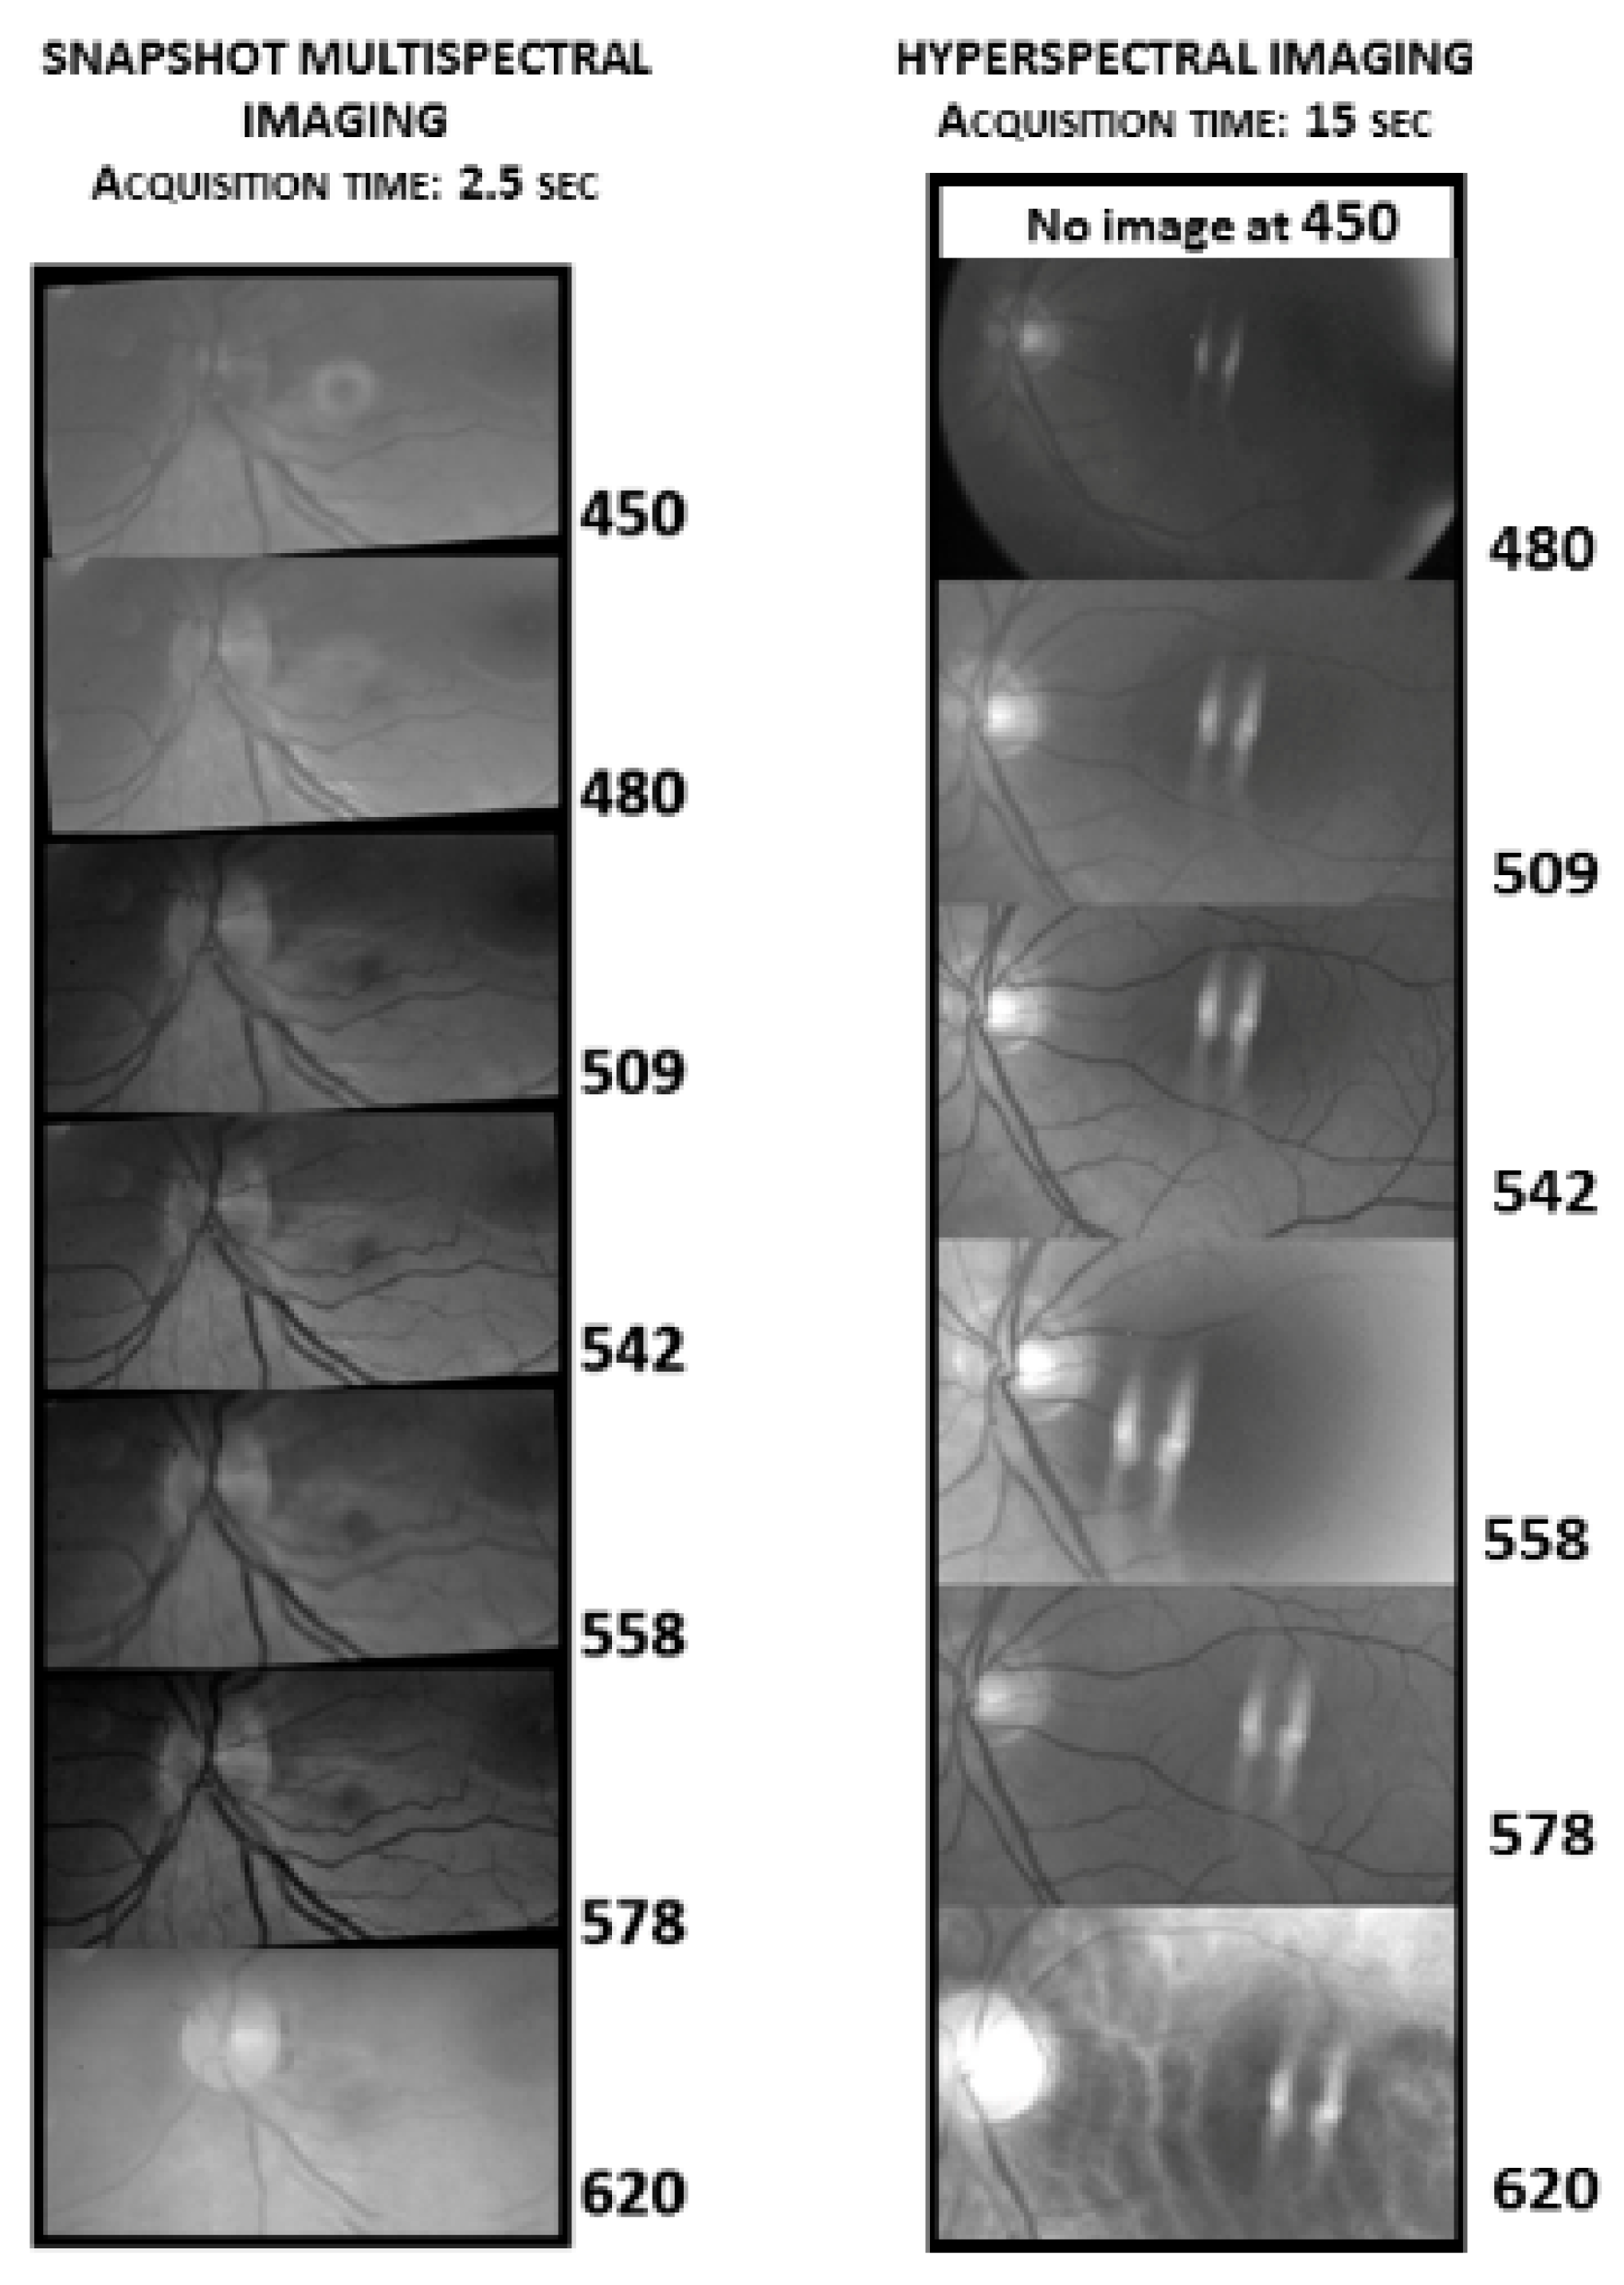
3.2. Comparison of MSI with HSI

The images obtained with MSI were of better quality (higher signal/noise ratio) than the images obtained with HSI, although the latter enables a more accurate spectral decomposition (Figure 3). The gain was optimised at each selected MSI wavelength resulting in good quality measurements at lower wavelengths. In the eye, HSI failed to capture acceptable quality images at wavelengths <558 nm and was more prone to artefacts. Acquisition time was longer for the HSI device (15 s versus ~3 s), which in turn resulted in increased image misalignment. For this reason, we did not use HSI data for further analysis.

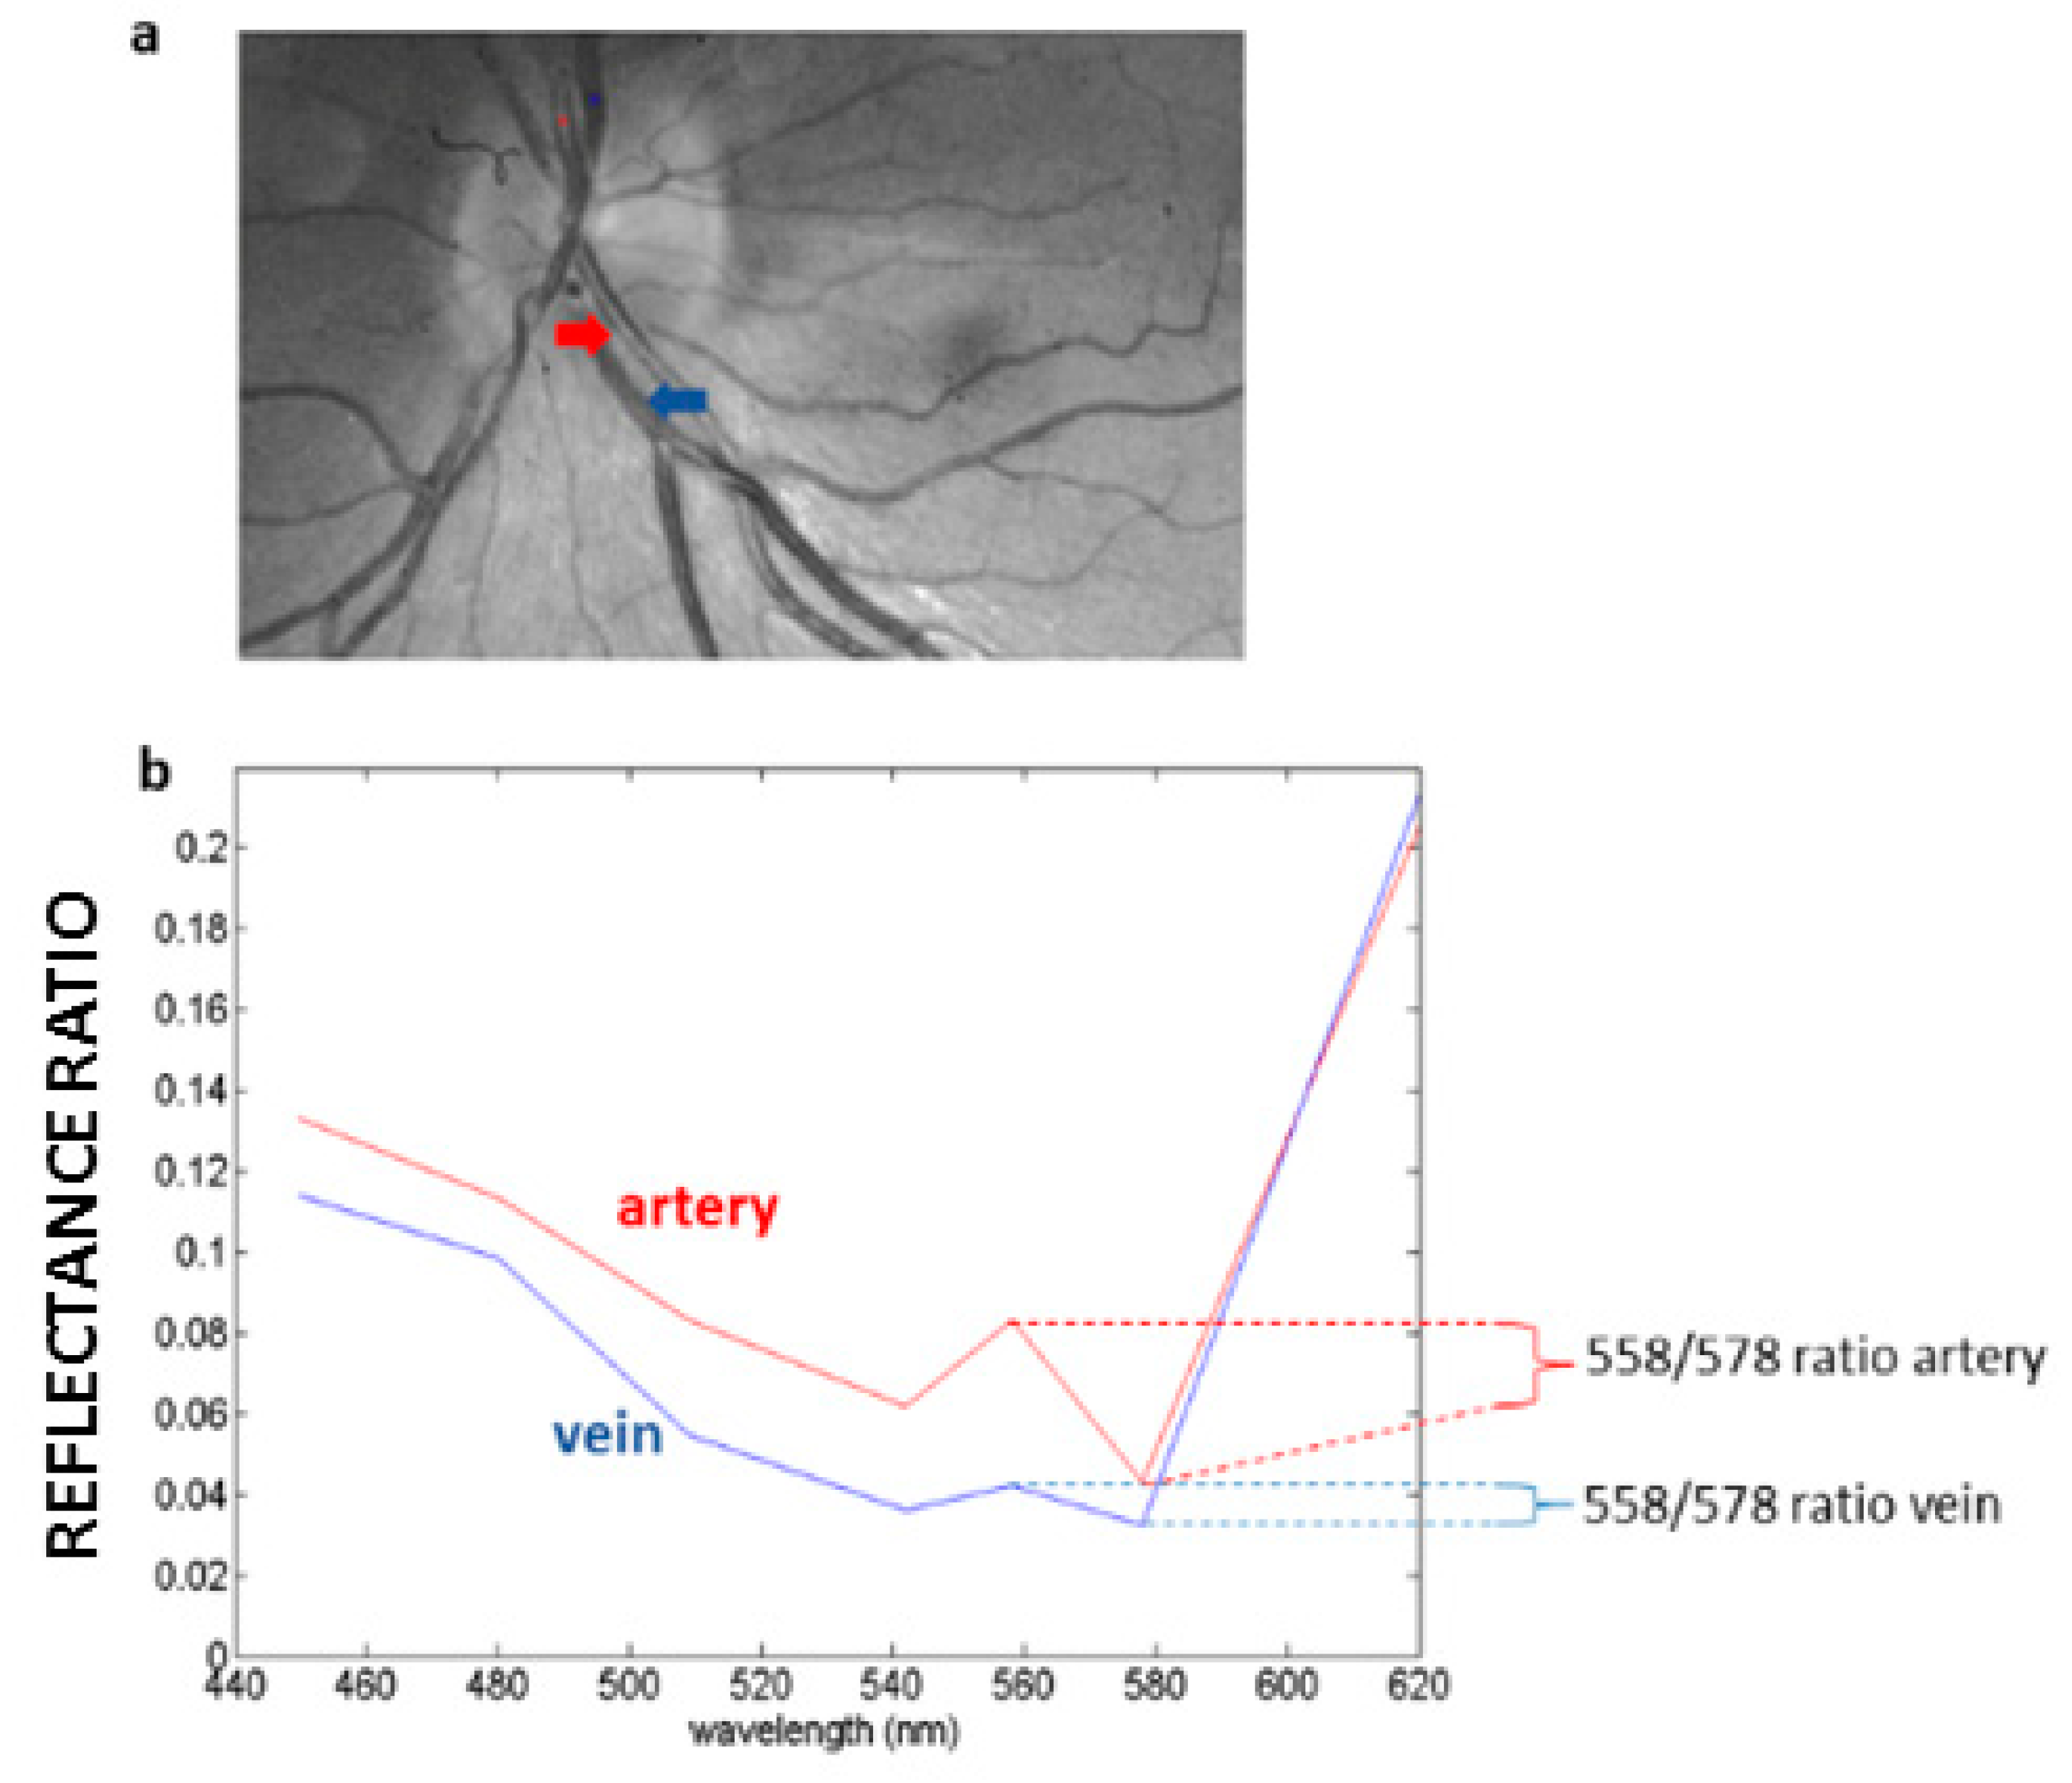
3.3. Haemoglobin Reflectance Measurements in the Retina

The reflectance spectra of different regions of the retina are presented in Figure 4. Distinct reflectance minima are present at 540 and 585 nm, which correspond to the absorbance peaks of HbO2. A distinct reflectance peak is present at ~560 nm and corresponds to the absorbance peak of HbR.
The MSI device was used to collect scans of 20 human eyes. Despite the fact that acquisition of the scans lasted ~3 s, the quality of the images was highly variable and could not be validly used for haemoglobin reflectance measurements. Therefore, we decided to change our strategy, to acquire as much information as possible on the basis of a single good quality scan.

3.4. Estimation of Relative Oxygen Saturation from Reflectance Spectra

We obtained 2D distributions of HbO2 and HbR in the retina by calculating the ratio of the reflectance values at 558 and 578 nm (Figure 5). A smoothing filter was applied to the data to reduce noise. A higher ratio indicates a larger contribution of HbO2 with respect to HbR, which can provide an estimate of the relative oxygen saturation level. In Figure 6, reflectance spectra from a retinal arteriole and venule are shown for one pixel. In the wavelength range 440–580 nm, the reflectance from arteries are higher than from veins, and the ratio of the values at 559 and 578 nm is also higher, which reflects the physiological level of oxygen saturation. We consider this internal comparison as a validation of MSI ocular fundus imaging.

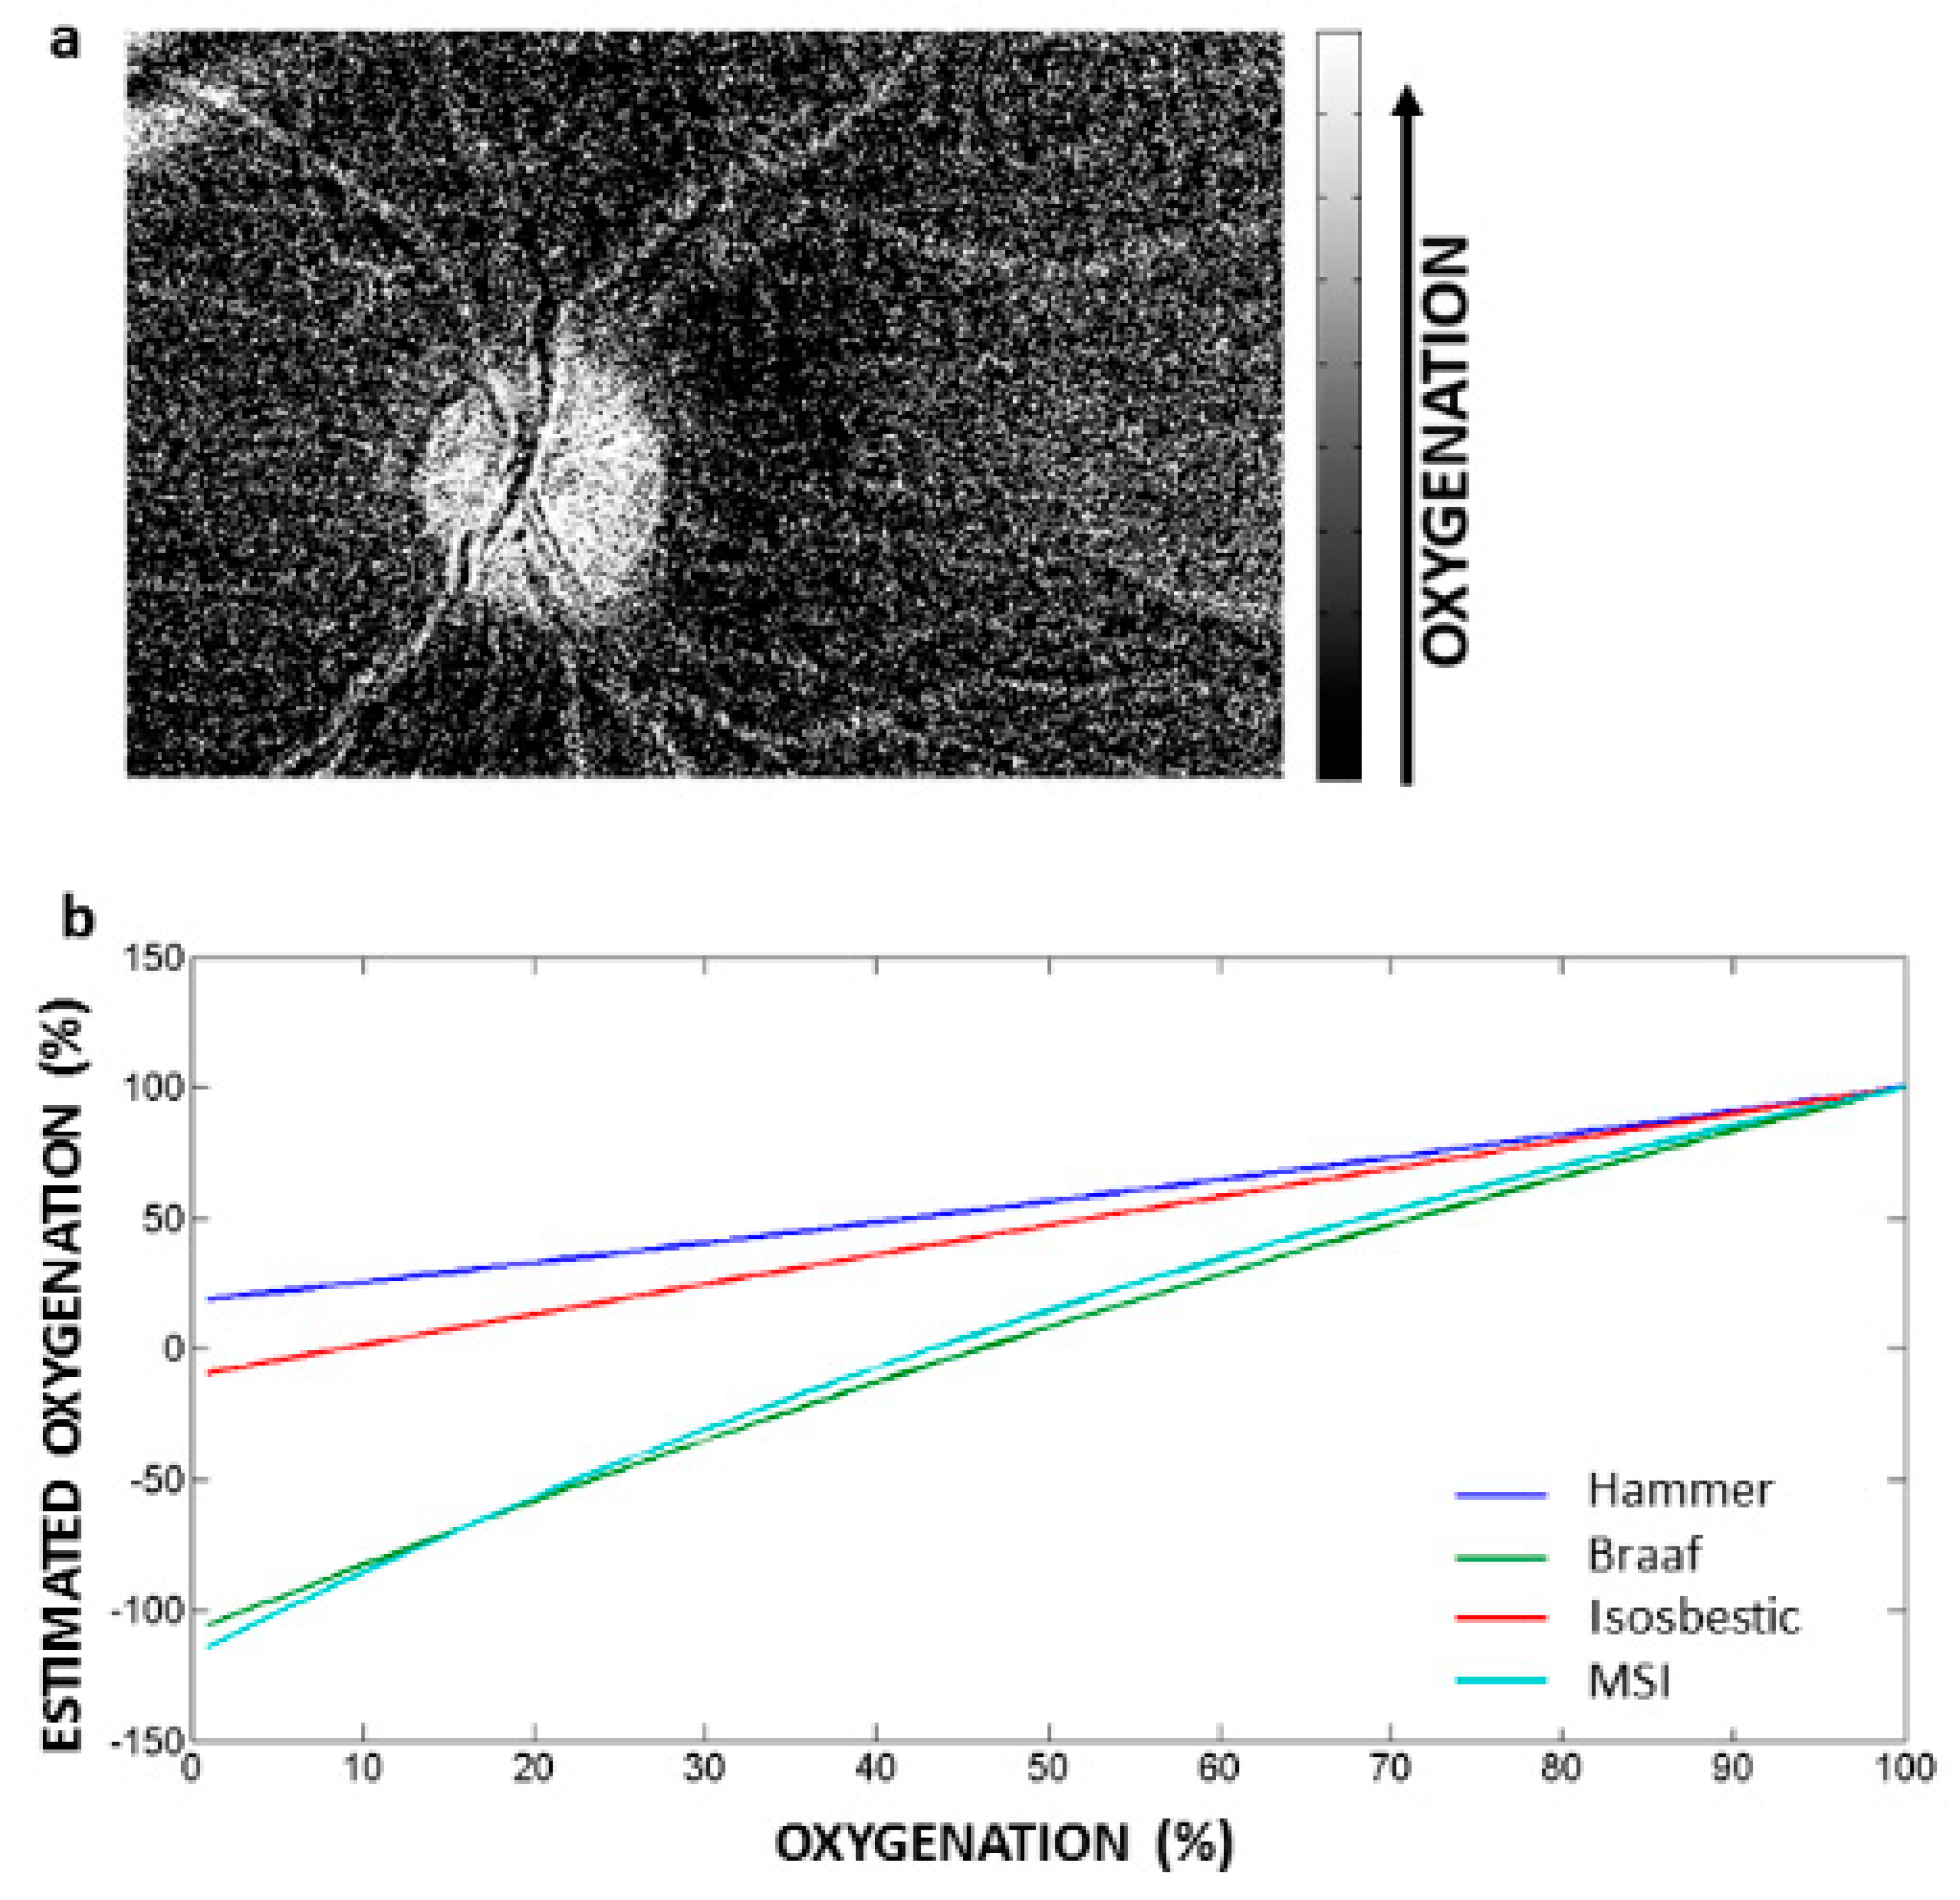
3.5. Application of the Hammer Correction Algorithm to estimate Relative Retinal Oxygen Saturation

Figure 7 shows 2D distributions of relative retinal oxygen saturation as calculated using a modified Hammer correction algorithm. This correction was applied to the reflectance spectra obtained for each pixel of the retinal vessels and tissue. The filter set used in our MSI setup differed from the setup described by Hammer et al. [19]. Other studies reported adaptations to the original method by using different wavelengths for the estimation of oxygenation. We have plotted the estimated oxygenation values obtained with our selected wavelengths and other studies with absolute (or ideal) oxygenation levels (Figure 7b). The data shows that although measurements with our MSI setup underestimate oxygen saturation at low oxygen saturation levels, estimates at higher oxygen saturation levels correctly estimate oxygenation measurements.

3.6. Uneven Distribution of HbO2 in Retinal Tissue

We found an uneven distribution of HbO2 in retinal tissue. Other oximetry studies of retinal tissue have also shown a speckled pattern [29], which is caused by a combination of factors. Studies have demonstrated that at wavelengths above 590 nm, retinal spectroscopy probes the choroid, which affects oxygenation measurements due to its high blood flow [29] as is shown in Figure 3.

4. Discussion

We have demonstrated that MSI provides a practical method for estimating relative oxygen saturation in retinal blood, and that MSI offers several significant advantages over HSI, despite the fact that our setup suffered from the inherent difficulties common to retinal spectral imaging devices. Both HSI and MSI were prone to image acquisition artefacts in the raw reflectance images. These artefacts, which arise from corneal reflections, blinking, and inability to hold the eyes open throughout the scan, cannot always be corrected by image pre-processing techniques. Several methods to limit image artefacts are available, which involve the exclusion of pixels where the model fit does not conform to the expected variance [30]. These artefacts did not allow us to determine relative oxygenation in the retina. The 15 s scan time of HSI provided low-quality images in all eyes whereas the low acquisition time of MSI (~3 s) was not brief enough to fully eliminate artefacts.
Inaccurate measurements may also result from variations in illumination due to different light paths through the eye and the concave shape of the ocular fundus. In the case of retinal tissue oximetry, scattered light from blood vessels may interfere with measurements in surrounding tissue [22,31,32]. For example, light scattering by erythrocytes affects the measured spectrum of whole blood [33]. Spectra measured in retinal blood vessels therefore reflect both the absorbance by haemoglobin and scattering from erythrocytes and surrounding tissues [34]. Spectra are also affected by absorbance by other chromophores such as melanin in the retinal pigment epithelium and the choroid [33]. At lower wavelengths, Monte Carlo simulations by Styles et al. indicate that reflectance measurements can be affected by both choroidal melanin and macular pigment [35].
Scattering creates the effect of a low-pass filter, where the spectrum of each pixel represents an averaged spectrum of bordering pixels. Compensation for scattering losses can be determined in many cases by approximating tissue scattering as an exponential function of the wavelength [36].
The raw reflectance data are also affected by the non-homogeneous distribution of blood in the retina. Therefore, the concentration of a specific chromophore cannot be obtained without accurately determining the diameters of the vessels, which is complex when measuring in vivo.
In summary, a simple assessment of the ratio between the absorbance peaks of haemoglobin is not suitable for generating validated oxygenation maps of the retina (although the reflectance spectra of arteries and veins shown in Figure 6 are in agreement with what was expected) and a correction algorithm needs to be applied. The algorithm proposed by Hammer et al. is applicable for the calculation of blood oxygenation from reflectance measurements at four wavelengths [19] and corrects for melanin absorption, as it compensates for deflection of the spectra due to the exponential dependence on the wavelength between 509 and 578 nm.
We have shown that with our setup, incorporating the adjusted Hammer correction and assuming a linear relationship of percentage of blood oxygen saturation and absorbance of haemoglobin in solution and blood [17,37], we underestimate oxygen saturation at low oxygen saturation levels, but at higher saturation levels we approach ideal oxygenation measurements. The oxygenation maps shown in Figure 7 can only be used as an indication of differences in oxygenation levels in the retina, since, as we have noted already, oxygenation measurement in retinal tissue is difficult to validate. Measurements of oxygen saturation in the clinical setting rely on standard calibrated models (such as the two-wavelength model) that are dependent on the arterial and venous oxygen saturation values used to calculate calibration constants [28], and are therefore relative and not absolute. Validation of retinal tissue spectral imaging data requires comprehensive modelling of light transport (for instance by Monte Carlo simulations) as well as analysis of the spectral properties of each tissue layer.
With regard to the uneven distribution of HbO2 that we found in retinal tissue, due in part to the effect of the high blood flow in the choroid (outer retinal vasculature), Monte Carlo simulations have demonstrated that in the 500–600 nm range, haemoglobin reflectance originates from the neurosensory retina in a larger proportion than choroidal haemoglobin does, which means that measurements up to 600 nm depict the contribution of the inner retinal vasculature [35]. In addition, pigmentation differences between ocular fundi may result in different contributions of the choroid to outer retinal oxygenation measurements [29]. The patchy oxygenation pattern may also be explained by image acquisition noise, which was not smoothed at the expense of a lower spatial resolution. The speckled pattern may also reflect a “true” unequal oxygen distribution in the retina, similar to findings in brain tissue. Oxygenation studies of brain tissue have shown, for example, large differences in the partial pressure of oxygen in areas outside arterioles and venules [38]. Finally, our method can be easily modified to be used in combination with extrinsic molecular imaging agents. Such agents can be used to give indications about their microenvironment (for example, variations in pH) as the environment affects their emission spectrum. These spectral changes can be determined with the MSI technique in a similar way as that described for haemoglobin.

5. Conclusions

By demonstrating the determination of oxygen saturation in retinal blood, we have shown that a newly-developed multispectral imaging system (MSI) has significant advantages over a hyperspectral imaging device (HSI). The MSI technique enabled the acquisition of high-resolution retinal spectral images, irrespective of the wavelength (between 440 and 580 nm), with a shorter acquisition time than HSI, which reduces the problem of image alignment that can interfere with image pre-processing and spectral analysis. Importantly, exposure time can be adjusted per wavelength, which increases both the efficiency and the comfort for the patient relative to the HSI system. However, artefacts inherent to imaging live human eyes remain an important obstacle to the introduction of MSI for retinal spectral measurements.
The new system is based on a filter wheel in the optical path. The filters can be selected to measure different chromophores, enabling the use of MSI for a wider range of molecules of interest. In the long term, depending on the successful development of molecular imaging contrast agents and subsequent approval for human use, ophthalmic molecular imaging applications of MSI can be extended by applying extrinsic imaging contrast agents.

Author Contributions

Conceptualization, E.R.d.C., R.J.M.H., M.C.G.A.; methodology, E.R.d.C., R.J.M.H., M.C.G.A.; software, E.R.d.C., R.J.M.H., M.C.G.A.; validation, E.R.d.C., R.J.M.H., M.C.G.A.; formal analysis, E.R.d.C., R.J.M.H., M.C.G.A.; investigation, E.R.d.C., R.J.M.H., M.C.G.A.; resources, E.R.d.C., R.J.M.H., M.C.G.A., R.O.S., C.J.F.v.N.; data curation, E.R.d.C., R.J.M.H., M.C.G.A.; writing – original draft presentation, E.R.d.C.; writing – review and editing, E.R.d.C., R.J.M.H., M.C.G.A., R.O.S., C.J.F.v.N.; funding acquisition, E.R.d.C., M.C.G.A., R.O.S., C.J.F.v.N.; supervision, M.C.G.A. All authors have read and agreed to the published version of the manuscript.

Funding

This study was published with the help of the Edmond and Marianne Blaauw Fonds voor Oogheelkunde.

Acknowledgments

Tessa Willems.

Conflicts of Interest

The authors declare no conflict of interest.

References

  1. Morris, H.R.; Hoyt, C.C.; Treado, P.J. Imaging Spectrometers for Fluorescence and Raman Microscopy - Acoustooptic and Liquid-Crystal Tunable Filters. Appl. Spectrosc. 1994, 48, 857–866. [Google Scholar] [CrossRef]
  2. Choi, H.; Wadduwage, D.; Matsudaira, P.T.; So, P.T.C. Depth resolved hyperspectral imaging spectrometer based on structured light illumination and Fourier transform interferometry. Biomed. Opt. Express 2014, 5, 3494–3507. [Google Scholar] [CrossRef] [PubMed] [Green Version]
  3. Gramatikov, B.I. Modern technologies for retinal scanning and imaging: An introduction for the biomedical engineer. Biomed. Eng. Online 2014, 13, 52. [Google Scholar] [CrossRef] [PubMed] [Green Version]
  4. Liu, W.; Barbastathis, G.; Psaltis, D. Volume holographic hyperspectral imaging. Appl. Opt. 2004, 43, 3581–3599. [Google Scholar] [CrossRef] [Green Version]
  5. Hagen, N.; Kudenov, M.W. Review of snapshot spectral imaging technologies. Opt. Eng. 2013, 52, 090901. [Google Scholar] [CrossRef] [Green Version]
  6. Gorman, A.; Fletcher-Holmes, D.W.; Harvey, A.R. Generalization of the Lyot filter and its application to snapshot spectral imaging. Opt. Express 2010, 18, 5602–5608. [Google Scholar] [CrossRef]
  7. Mordant, D.J.; Al-Abboud, I.; Muyo, G.; Gorman, A.; Sallam, A.; Ritchie, P.; Harvey, A.R.; McNaught, A.I. Spectral imaging of the retina. Eye 2011, 25, 309–320. [Google Scholar] [CrossRef] [Green Version]
  8. Hirohara, Y.; Okawa, Y.; Mihashi, T.; Yamaguchi, T.; Nakazawa, N.; Tsuruga, Y.; Aoki, H.; Maeda, N.; Uchida, I.; Fujikado, T. Validity of retinal oxygen saturation analysis: Hyperspectral imaging in visible wavelength with fundus camera and liquid crystal wavelength tunable filter. Opt. Rev. 2007, 14, 151–158. [Google Scholar] [CrossRef]
  9. Johnson, W.R.; Wilson, D.W.; Fink, W.; Humayun, M.; Bearman, G. Snapshot hyperspectral imaging in ophthalmology. J. Biomed. Opt. 2007, 12. [Google Scholar] [CrossRef] [Green Version]
  10. Muqit, M.M.K.; Denniss, J.; Nourrit, V.; Marcellino, G.R.; Henson, D.B.; Schiessl, I.; Stanga, P.E. Spatial and Spectral Imaging of Retinal Laser Photocoagulation Burns. Invest. Ophthalmol. Vis. Sci. 2011, 52, 994–1002. [Google Scholar] [CrossRef] [Green Version]
  11. Nourrit, V.; Denniss, J.; Muqit, M.M.K.; Schiessl, I.; Fenerty, C.; Stanga, P.E.; Henson, D.B. High-resolution hyperspectral imaging of the retina with a modified fundus camera. J. Fr. Ophtalmol. 2010, 33, 686–692. [Google Scholar] [CrossRef] [PubMed]
  12. Tiedeman, J.S.; Kirk, S.E.; Srinivas, S.; Beach, J.M. Retinal oxygen consumption during hyperglycemia in patients with diabetes without retinopathy. Ophthalmology 1998, 105, 31–36. [Google Scholar] [CrossRef]
  13. Masquelier, T.; Portelli, G.; Kornprobst, P. Microsaccades enable efficient synchrony-based coding in the retina: A simulation study. Sci. Rep. 2016, 6, 24086. [Google Scholar] [CrossRef] [PubMed] [Green Version]
  14. De Carvalho, J.E.R.; Verbraak, F.D.; Aalders, M.C.; van Noorden, C.J.; Schlingemann, R.O. Recent advances in ophthalmic molecular imaging. Surv. Ophthalmol. 2014, 59, 393–413. [Google Scholar] [CrossRef] [PubMed]
  15. Geladi, P.; Burger, J.; Lestander, T. Hyperspectral imaging: Calibration problems and solutions. Chemometr. Intell. Lab. 2004, 72, 209–217. [Google Scholar] [CrossRef]
  16. Everdell, N.L.; Styles, I.B.; Calcagni, A.; Gibson, J.; Hebden, J.; Claridge, E. Multispectral imaging of the ocular fundus using light emitting diode illumination. Rev. Sci. Instrum. 2010, 81, 093706. [Google Scholar] [CrossRef] [Green Version]
  17. Beach, J.M.; Schwenzer, K.J.; Srinivas, S.; Kim, D.; Tiedeman, J.S. Oximetry of retinal vessels by dual-wavelength imaging: Calibration and influence of pigmentation. J. Appl. Physiol. 1999, 86, 748–758. [Google Scholar] [CrossRef] [Green Version]
  18. Pittman, R.N.; Duling, B.R. Measurement of Percent Oxyhemoglobin in Microvasculature. J. Appl. Physiol. 1975, 38, 321–327. [Google Scholar] [CrossRef]
  19. Hammer, M.; Thamm, E.; Schweitzer, D. A simple algorithm for in vivo ocular fundus oximetry compensating for non-haemoglobin absorption and scattering. Phys. Med. Biol. 2002, 47, N233–N238. [Google Scholar] [CrossRef] [Green Version]
  20. Fenton, B.M.; Gayeski, T.E.J. Determination of Microvascular Oxyhemoglobin Saturations Using Cryospectrophotometry. Am. J. Physiol. 1990, 259, H1912–H1920. [Google Scholar] [CrossRef]
  21. Pittman, R.N.; Duling, B.R. New Method for Measurement of Percent Oxyhemoglobin. J. Appl. Physiol. 1975, 38, 315–320. [Google Scholar] [CrossRef] [PubMed]
  22. Schweitzer, D.; Hammer, M.; Kraft, J.; Thamm, E.; Konigsdorffer, E.; Strobel, J. In vivo measurement of the oxygen saturation of retinal vessels in healthy volunteers. IEEE Trans. Biomed. Eng. 1999, 46, 1454–1465. [Google Scholar] [CrossRef] [PubMed]
  23. Schweitzer, D.; Thamm, E.; Hammer, M.; Kraft, J. A new method for the measurement of oxygen saturation at the human ocular fundus. Int. Ophthalmol. 2001, 23, 347–353. [Google Scholar] [CrossRef]
  24. Beach, J. Pathway to Retinal Oximetry. Transl. Vis. Sci. Technol. 2014, 3, 2. [Google Scholar] [CrossRef] [PubMed] [Green Version]
  25. Delori, F.C.; Webb, R.H.; Sliney, D.H. Maximum permissible exposures for ocular safety (ANSI 2000), with emphasis on ophthalmic devices. J. Opt. Soc. Am. A 2007, 24, 1250–1265. [Google Scholar] [CrossRef] [PubMed]
  26. Barnes, R.J.; Dhanoa, M.S.; Lister, S.J. Standard Normal Variate Transformation and De-Trending of near-Infrared Diffuse Reflectance Spectra. Appl. Spectrosc. 1989, 43, 772–777. [Google Scholar] [CrossRef]
  27. Lowe, D.G. Distinctive image features from scale-invariant keypoints. Int. J. Comput. Vis. 2004, 60, 91–110. [Google Scholar] [CrossRef]
  28. Braaf, B.; Nadort, A.; Faber, D.; ter Wee, R.; van Leeuwen, T.; Aalders, M. Blood oxygen saturation of frozen tissue determined by hyperspectral imaging. In Proceedings of the Imaging, Manipulation, and Analysis of Biomolecules, Cells, and Tissues VI, San Jose, CA, USA, 21–23 January 2008. [Google Scholar] [CrossRef]
  29. Desjardins, M.; Sylvestre, J.P.; Jafari, R.; Kulasekara, S.; Rose, K.; Trussart, R.; Arbour, J.D.; Hudson, C.; Lesage, F. Preliminary investigation of multispectral retinal tissue oximetry mapping using a hyperspectral retinal camera. Exp. Eye Res. 2016, 146, 330–340. [Google Scholar] [CrossRef]
  30. Shore, J.; Lubin, B. Spectral goodness of fit for network models. Soc. Netw. 2015, 43, 16–27. [Google Scholar] [CrossRef] [Green Version]
  31. Delori, F.C. Noninvasive technique for oximetry of blood in retinal vessels. Appl. Opt. 1988, 27, 1113–1125. [Google Scholar] [CrossRef]
  32. Smith, M.H. Optimum wavelength combinations for retinal vessel oximetry. Appl. Opt. 1999, 38, 258–267. [Google Scholar] [CrossRef] [PubMed]
  33. Bosschaart, N.; Edelman, G.J.; Aalders, M.C.G.; van Leeuwen, T.G.; Faber, D.J. A literature review and novel theoretical approach on the optical properties of whole blood. Laser Med. Sci. 2014, 29, 453–479. [Google Scholar] [CrossRef] [PubMed] [Green Version]
  34. Hammer, M.; Leistritz, S.; Leistritz, L.; Schweitzer, D. Light paths in retinal vessel oxymetry. IEEE Trans. Biomed. Eng. 2001, 48, 592–598. [Google Scholar] [CrossRef] [PubMed]
  35. Styles, I.B.; Calcagni, A.; Claridge, E.; Orihuela-Espina, F.; Gibson, J.M. Quantitative analysis of multi-spectral fundus images. Med. Image Anal. 2006, 10, 578–597. [Google Scholar] [CrossRef] [Green Version]
  36. Hammer, M.; Roggan, A.; Schweitzer, D.; Muller, G. Optical-Properties of Ocular Fundus Tissues-an in-Vitro Study Using the Double-Integrating-Sphere Technique and Inverse Monte-Carlo Simulation. Phys. Med. Biol. 1995, 40, 963–978. [Google Scholar] [CrossRef] [Green Version]
  37. Vankampen, E.J.; Zijlstra, W.G. Spectrophotometry of Hemoglobin and Hemoglobin Derivatives. Adv. Clin. Chem. 1983, 23, 199–257. [Google Scholar] [CrossRef]
  38. Devor, A.; Sakadzic, S.; Saisan, P.A.; Yaseen, M.A.; Roussakis, E.; Srinivasan, V.J.; Vinogradov, S.A.; Rosen, B.R.; Buxton, R.B.; Dale, A.M.; et al. “Overshoot” of O(2) is required to maintain baseline tissue oxygenation at locations distal to blood vessels. J. Neurosci. 2011, 31, 13676–13681. [Google Scholar] [CrossRef] [Green Version]
Figure 1. Pixelteq camera (Ocean Insight, Duiven, The Netherlands) consisting of: (a) an F-mount objective, (b) the filter wheel casing, (c) a CCD (charge-coupled device) camera, and (d) the filter wheel, which contains 8 replaceable filters. The camera was attached to the camera port of the fundus camera. (e) User interface software of the Pixelteq camera (Ocean Insight).
Instruments 04 00012 g001
Figure 2. Illustration of the steps involved in retinal spectral imaging: (a) the measured optical spectroscopy spectrum of oxygenated haemoglobin (HbO2)0 or reduced haemoglobin (HbR) presented versus wavelength, (b) retinal multispectral dataset (or hypercube). An image plane is shown for one wavelength (λi) and a reflectance spectrum is obtained of one pixel (xj, yk).
Instruments 04 00012 g002
Figure 3. Comparison of ocular fundus images captured with MSI and HSI. The two bright white lines in all of the HSI wavelength images in the macula are specular reflections.
Instruments 04 00012 g003
Figure 4. Reflectance spectra of different retinal regions: (a) MSI ocular fundus image at 542 nm, (b) corresponding reflectance spectra of different regions in the retina (coloured squares correspond to coloured lines). Reflectance shows troughs at 542 and 578 nm corresponding to the absorbance peaks of HbO2 as shown in Figure 2a and Figure 5.
Instruments 04 00012 g004
Figure 5. Visualisation of a two-wavelength ratio of reflectance spectra: (a) absorbance spectra of HbO2 and HbR showing three selected wavelengths, 558 nm with a peak of HbR (blue arrow) and a trough of HbO2 (red short arrow) and the dual peak of HbO2 at 542 and 578 nm (red arrow), (b) grayscale image of the ratios of reflectance at 558 and 578 nm. Regions in white correspond to areas of high relative oxygenation.
Instruments 04 00012 g005
Figure 6. Reflectance spectra of artery and vein: (a) multispectral image of the peripapillary region showing an artery (red) and a vein (blue), selected for reflectance measurements, (b) reflectance measurements in the artery and vein. The 558/578 ratio represents the reflectance measured at 558 nm corresponding to the trough absorbance of HbO2 and at 578 nm corresponding to the peak absorbance of HbO2; the artery shows a higher 558/578 ratio which means that the contribution of HbO2 is higher than the contribution of HbR, attesting to the validation of retinal MSI.
Instruments 04 00012 g006
Figure 7. Visualisation of relative retinal oxygen saturation. (a) Determination of the relative oxygen saturation by comparing the measured reflectance with reference spectra of fully oxygenated and deoxygenated blood (in grayscale). The algorithm was applied to measured reflectance data of the ocular fundus of unknown oxygen saturation, at the wavelengths selected for the MSI. (b) Simulation of oxygen saturation levels using reflectance at the selected wavelengths. Estimated oxygenation values at the wavelength settings used underestimated the relative oxygen saturation measurements when plotted against low absolute levels of oxygen saturation. At higher levels of estimated oxygen saturation, the values were similarly independent of wavelength.
Instruments 04 00012 g007
Table 1. Selected wavelengths for the oxygenation estimation study.
This StudyHammer et al.Braaf et al.Isosbestic
A509522530522
B542569542549
C578586582586
D558560562560

