Communication

Substrate Effect on the Thermal Expansion of 2D Materials: An Investigation by Machine Learning Interatomic Potentials

1
Advanced Simulation and Computing Laboratory, Mechanical Engineering Department, Imam Khomeini International University, Qazvin 34148-96818, Iran
2
Department of Mathematics and Physics, Leibniz Universität Hannover, Appelstraße 11, 30167 Hannover, Germany
*
Author to whom correspondence should be addressed.
Condens. Matter 2022, 7(4), 67; https://doi.org/10.3390/condmat7040067
Submission received: 28 October 2022 / Revised: 8 November 2022 / Accepted: 12 November 2022 / Published: 15 November 2022

Abstract

:
The thermal expansion coefficient (TEC) of suspended two-dimensional (2D) nanomaterials is usually negative due to their ability for large out-of-plane deflection as the temperature increases. The presence of a substrate can nonetheless restrict the flexibility of 2D materials and significantly change their dimensional change by temperature. In this short communication, the thermal expansion coefficients of suspended and supported four popular 2D structures of graphene, phagraphene, C3N and BC3 monolayers is systematically investigated. For this purpose, we conduct molecular dynamics simulation, in which the atomic interactions are defined by highly accurate machine learning interatomic potentials. The obtained results show that by increasing the strength of the van der Waals interactions between the monolayer and the substrate, from 2 meV to 8 meV, the TEC for graphene and phagraphene increases from a negative value to a positive one; while the negative value for the C3N and BC3 structures is still retained. Analysis of molecular dynamics trajectories reveals that the substrate can significantly reduce the formation of out-of-plane wrinkles and consequently affect the value of TEC. The obtained results provide useful vision on the role of substrate on the complex thermal expansion responses of 2D materials.

1. Introduction

Two-dimensional (2D) nanomaterials have unique properties compared to their bulk counterparts, but when supported over a substrate, their properties may change considerably [1]. Most of 2D materials are grown or synthesized over a substrate, which can be an insulator, semiconductor, or electrical conductor. Depending on the type of substrate, the properties of the 2D material can be subsequently affected. For instance, the substrate reduces the thermal conductivity of graphene from about 2000–4000 W/mK to about 200–800 W/mK [2]. Such a substantial reduction is due to the suppression of out-of-plane vibrations of graphene atoms, correlated to flexural phonon modes, which yield significant contribution to the thermal conductivity of graphene. Moreover, such a reduction effect can happen for any other 2D material supported by a substrate. In addition, the interfacial thermal resistance between the 2D materials and the substrate can be considered as a barrier to heat dissipation in nanoelectronics devices [3]. The thermal expansion coefficient is one of the critical thermal factors in the applications of 2D materials in transistors, batteries, and nanomechanics [4]. 2D materials usually have a negative TEC in the suspended state. When the temperature increases, atomic fluctuations and out-of-plane movements increase more than interatomic bond length elongation, leading to a negative TEC [5]. The presence of a substrate in other 2D materials significantly impacts the TEC [6,7,8]. Although the effect of the substrate has been investigated experimentally and theoretically for graphene [9,10], it has not been sufficiently studied for other 2D materials.
Different methods can be employed to study the thermal expansion coefficient in materials. Experimental and quantum mechanics-based numerical studies are usually costly in terms of facilities and computational time, respectively. On the other side, molecular dynamics simulations based on the empirical interatomic potentials, despite their computational efficiency, are not guaranteed to be accurate. Recently, machine learning (ML) approaches can compromise between highly accurate quantum mechanics methods with density functional theory (DFT) approximation and computationally efficient molecular dynamics simulations [11]. In the ML method, the potential function becomes highly accurate by training on different atomic configurations obtained from the quantum ab-initio calculations. In this study, by employing authentic machine learning interatomic potentials (MLIPs), we investigate the effect of a substrate on the TEC of various 2D materials of graphene, C3N, C3B, and phagraphene [12] monolayers.

2. Computational Methods

Figure 1a shows the atomic structures of the two-dimensional materials of graphene, phagraphene [12], BC3, and C3N monolayers studied in this communication. The optimized Tersoff [13] potential is traditionally used to describe the atomic interaction within the considered structures, which cannot accurately predict the phononic properties as compared with DFT calculations [14,15]. Interatomic potentials trained by machine learning algorithms on quantum ab-initio trajectories can be an excellent alternative to empirical potential functions. In our earlier works, we successfully employed moment tensor potentials (MTPs) [16], a class of machine learning interatomic potentials, to calculate the thermal conductivity and thermal expansion of various 2D structures [11]. The phonon dispersion curves for the considered nanosheets in this work based on MTPs have been previously compared with DFT results, which confirmed the remarkable accuracy of developed classical models [11]. Therefore, in the present study we employed the MTPs developed in our earlier study [11], to analyze the substrate effects on the thermal expansion.
In this paper, the initial sizes of the structures were considered to be around 10 × 10 nm2. The equation of motion was solved using the Nosé–Hoover thermostat and barostat (NPT) [17] method, employing the Large-scale Atomic/Molecular Massively Parallel Simulator (LAMMPS) [18] package. The time step is considered equal to 1 fs. To consider the effect of a substrate, a van der Waals wall was positioned under the considered monolayers, which is schematically shown in Figure 1b. The initial distance between the substrate and 2D material was about 5 Å, which approaches to the equilibrium distance during the structural relaxation. The Lennard-Jones (LJ) potential of 12–6 was used to describe the non-bonding interaction between the substrate and 2D materials. The LJ potential depth of the potential well (ε), is considered to be 2, 4, 6, and 8 meV. The corresponding distance parameter of LJ potential was selected to be 3.4 Å, close to the thickness of graphene. The boundary conditions were periodic in planar directions and non-periodic perpendicular to the plane. In order to simulate the thermal expansion process, the temperature of the monolayers was gradually increased from 50 to 1000 K, with a 25 K step. At each temperature, first the NPT calculations were carried out for 10 ps in order to equilibrate the lattice and remove the effects of applied perturbation. The NPT calculations were continued for another for 50 ps, in which the sizes of the simulation box were averaged. For elaborated computational details, refer to the data availability section of our recent study [11], which includes LAMMPS input scripts. By fitting a 3rd order polynomial function on the averaged area data points, the TEC was calculated as α = 1 A d A d T [11,19].

3. Results and Discussion

Figure S1 of the supporting information document shows the results for the evolution of per-atom area of the supported monolayers as a function of temperature for the interaction strength of ε = 2 meV. As it can be seen, for full-carbon structures of graphene and phagraphene, the projected area increases with the temperature rises. This means that in addition to the increase in wrinkles heights due to the rise in temperature, the bond length elongation also affects the total area variation. This is in contrast to the behavior of the suspended monolayers, as observed in our previous work [11]. To better illustrate the increase in the wrinkles formation in graphene due to temperature rise, in Figure 2 we illustrate the contour of atomic out-of-plane displacement for four temperatures of 300, 400, 500, and 600 K. In contrast to supported graphene and phagraphene, the projected area of supported C3N and BC3 with the interaction strength of ε = 2 meV, decreases when the temperature increases, as shown in Figure S1. This finding reveals that the increase in out-of-plane deflection of these structures by the temperature rise is more dominant as compared with the bond length elongation. Table 1 shows the coefficients of the fitted 3rd order polynomial function on the size variation of the monolayers with respect to the temperature and the corresponding area at 300 K.
Figure 3 illustrates the predicted TEC curves for graphene and phagraphene in the presence of a substrate with four different interaction strengths and suspended without a substrate. As it is shown, when the interaction strength increases, the TEC value shifts from a negative value for the suspended form to a positive value for the supported cases. This behavior is in accordance with what has been found in a recent study by Feng et al. for graphene [10], in which they investigated the effect of a CH4 substrate on graphene TEC by both experimental and molecular dynamics calculations. The TEC results for the supported BC3 and C3N 2D structures are also compared in Figure 3. Although these two supported monolayers yield less negative TEC values, as compared with their suspended forms, their TEC stays negative but approaches zero when ε goes from 0 to 8 meV. Figure S2 compares the atomic out-of-plane displacement contour for considered monolayers at T = 300 K, with and without the presence of a substrate (ε = 0 and 4 meV). It can be seen that the amount of wrinkles area can be significantly reduced with the substrate effect. However, in both supported C3N and BC3 nanosheets, the formed wrinkles are more considerable in comparison with graphene and phagraphene, which could explain the negative TEC values of the C3N and BC3 structures. As it is clear, despite of similar atomic structures, the considered monolayers show different thermal expansion behaviors. On this basis, the MLIP potential has to be specifically developed for a given material, in order to accurately explore the thermal expansion behavior. Another aspect that can be explored in the future studies, is to investigate the effects of number of layers on the thermal expansion response of 2D materials.

4. Summary

In summary, the thermal expansion coefficients of suspended and supported four carbon-based nanosheets were investigated by employing highly accurate and computationally robust machine learning interatomic potentials. For the supported monolayers, the Lennard-Jones potential was employed to describe interactions between the considered monolayers and the substrate. The main findings can be summarized as follows:
(1)
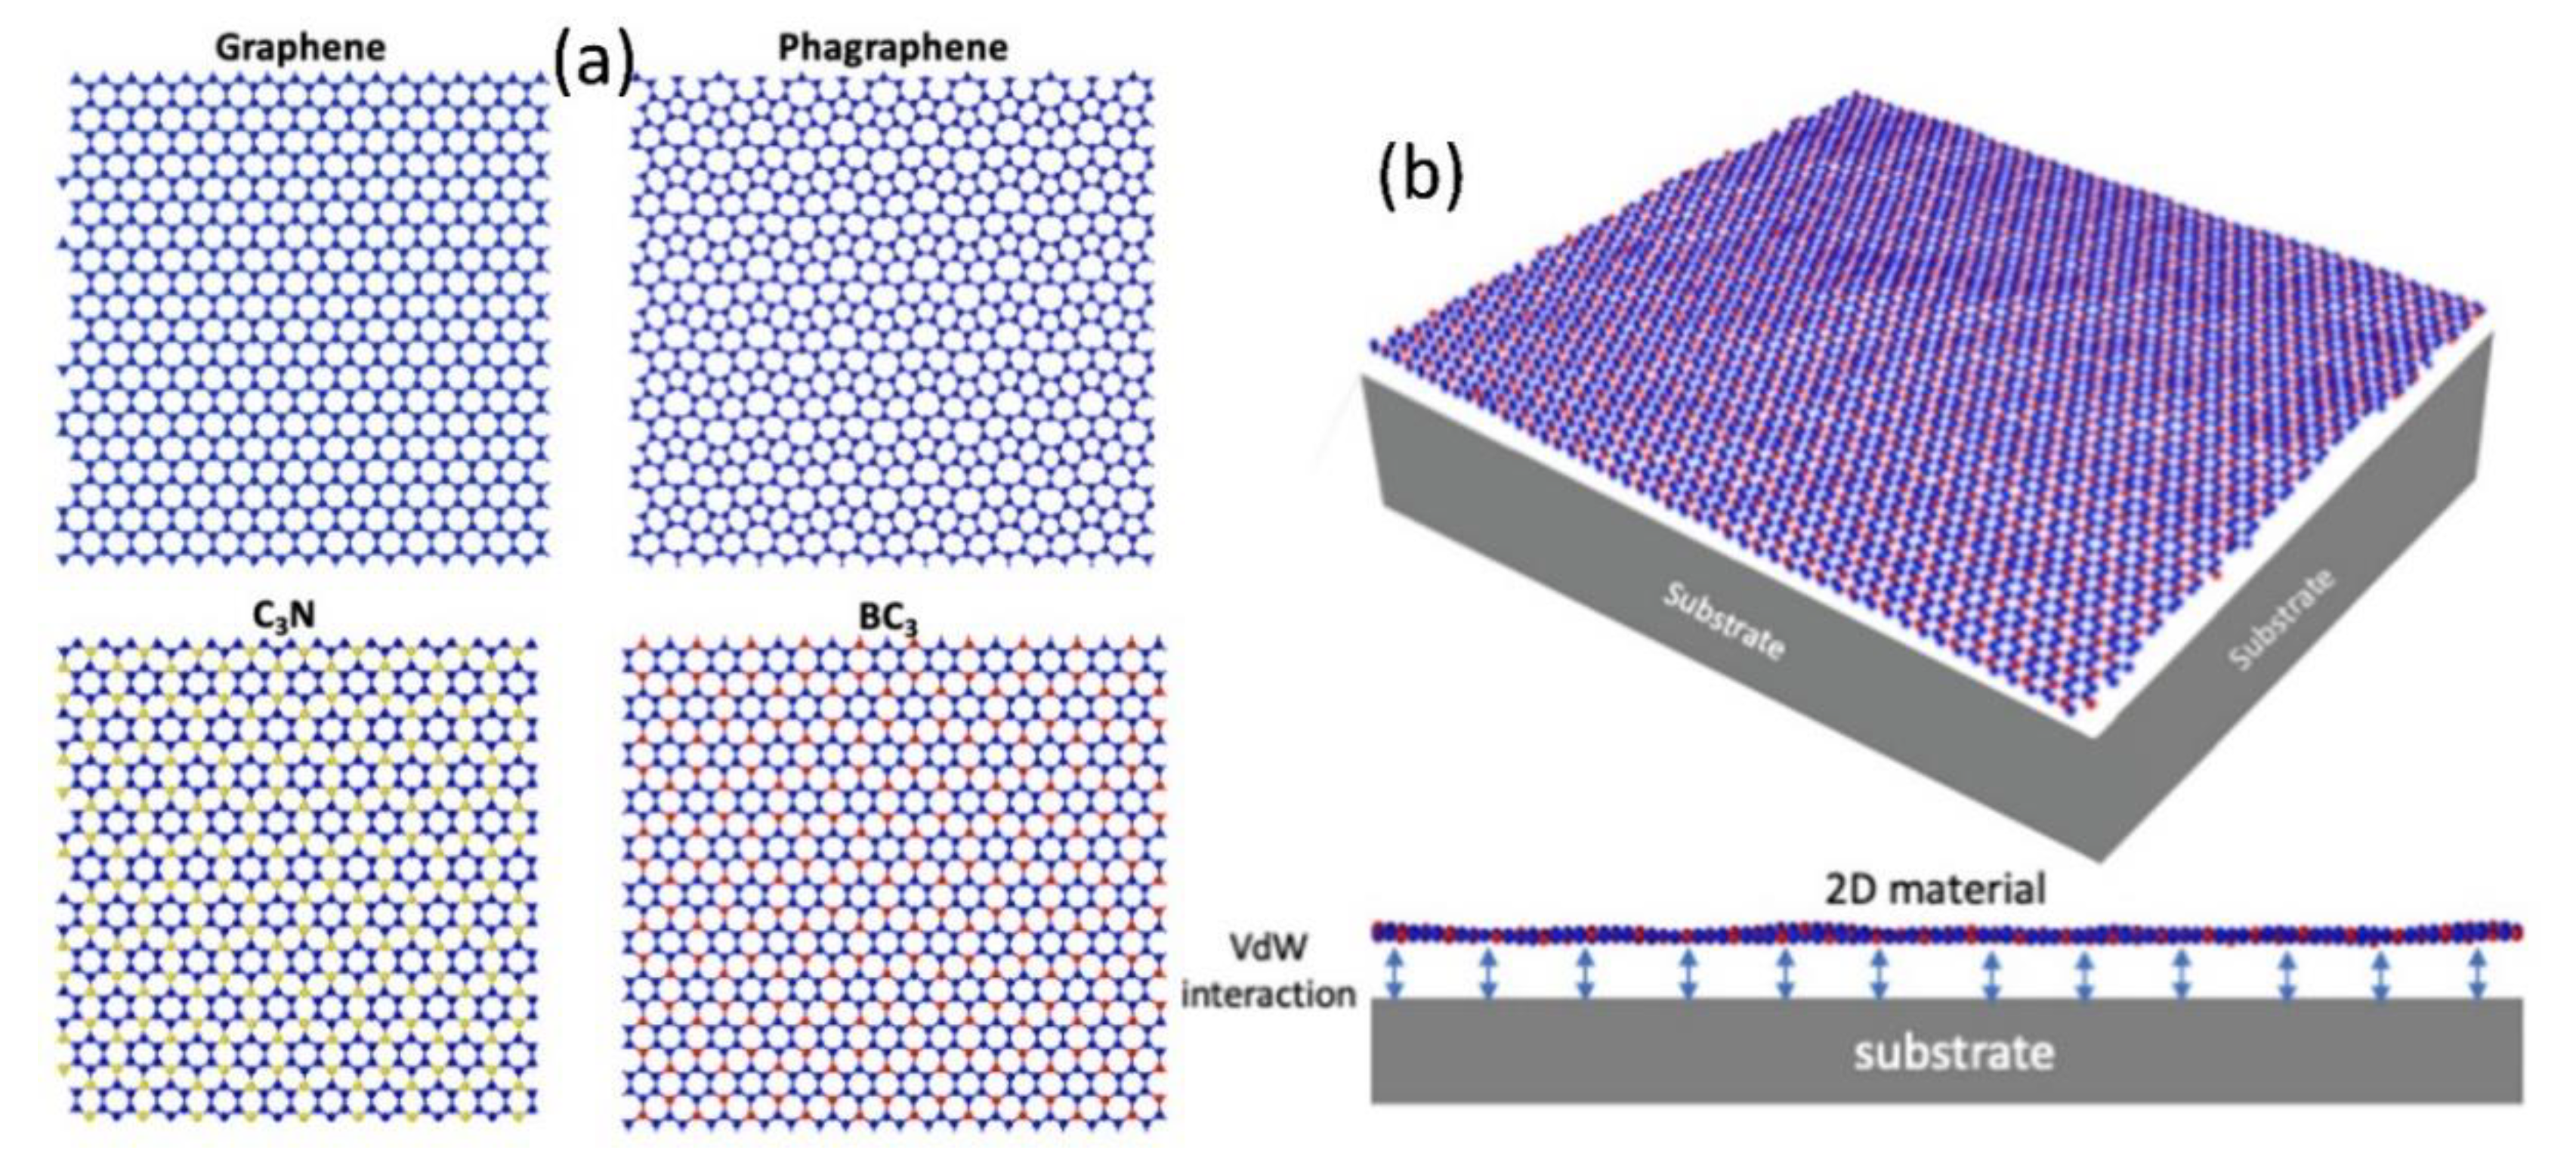
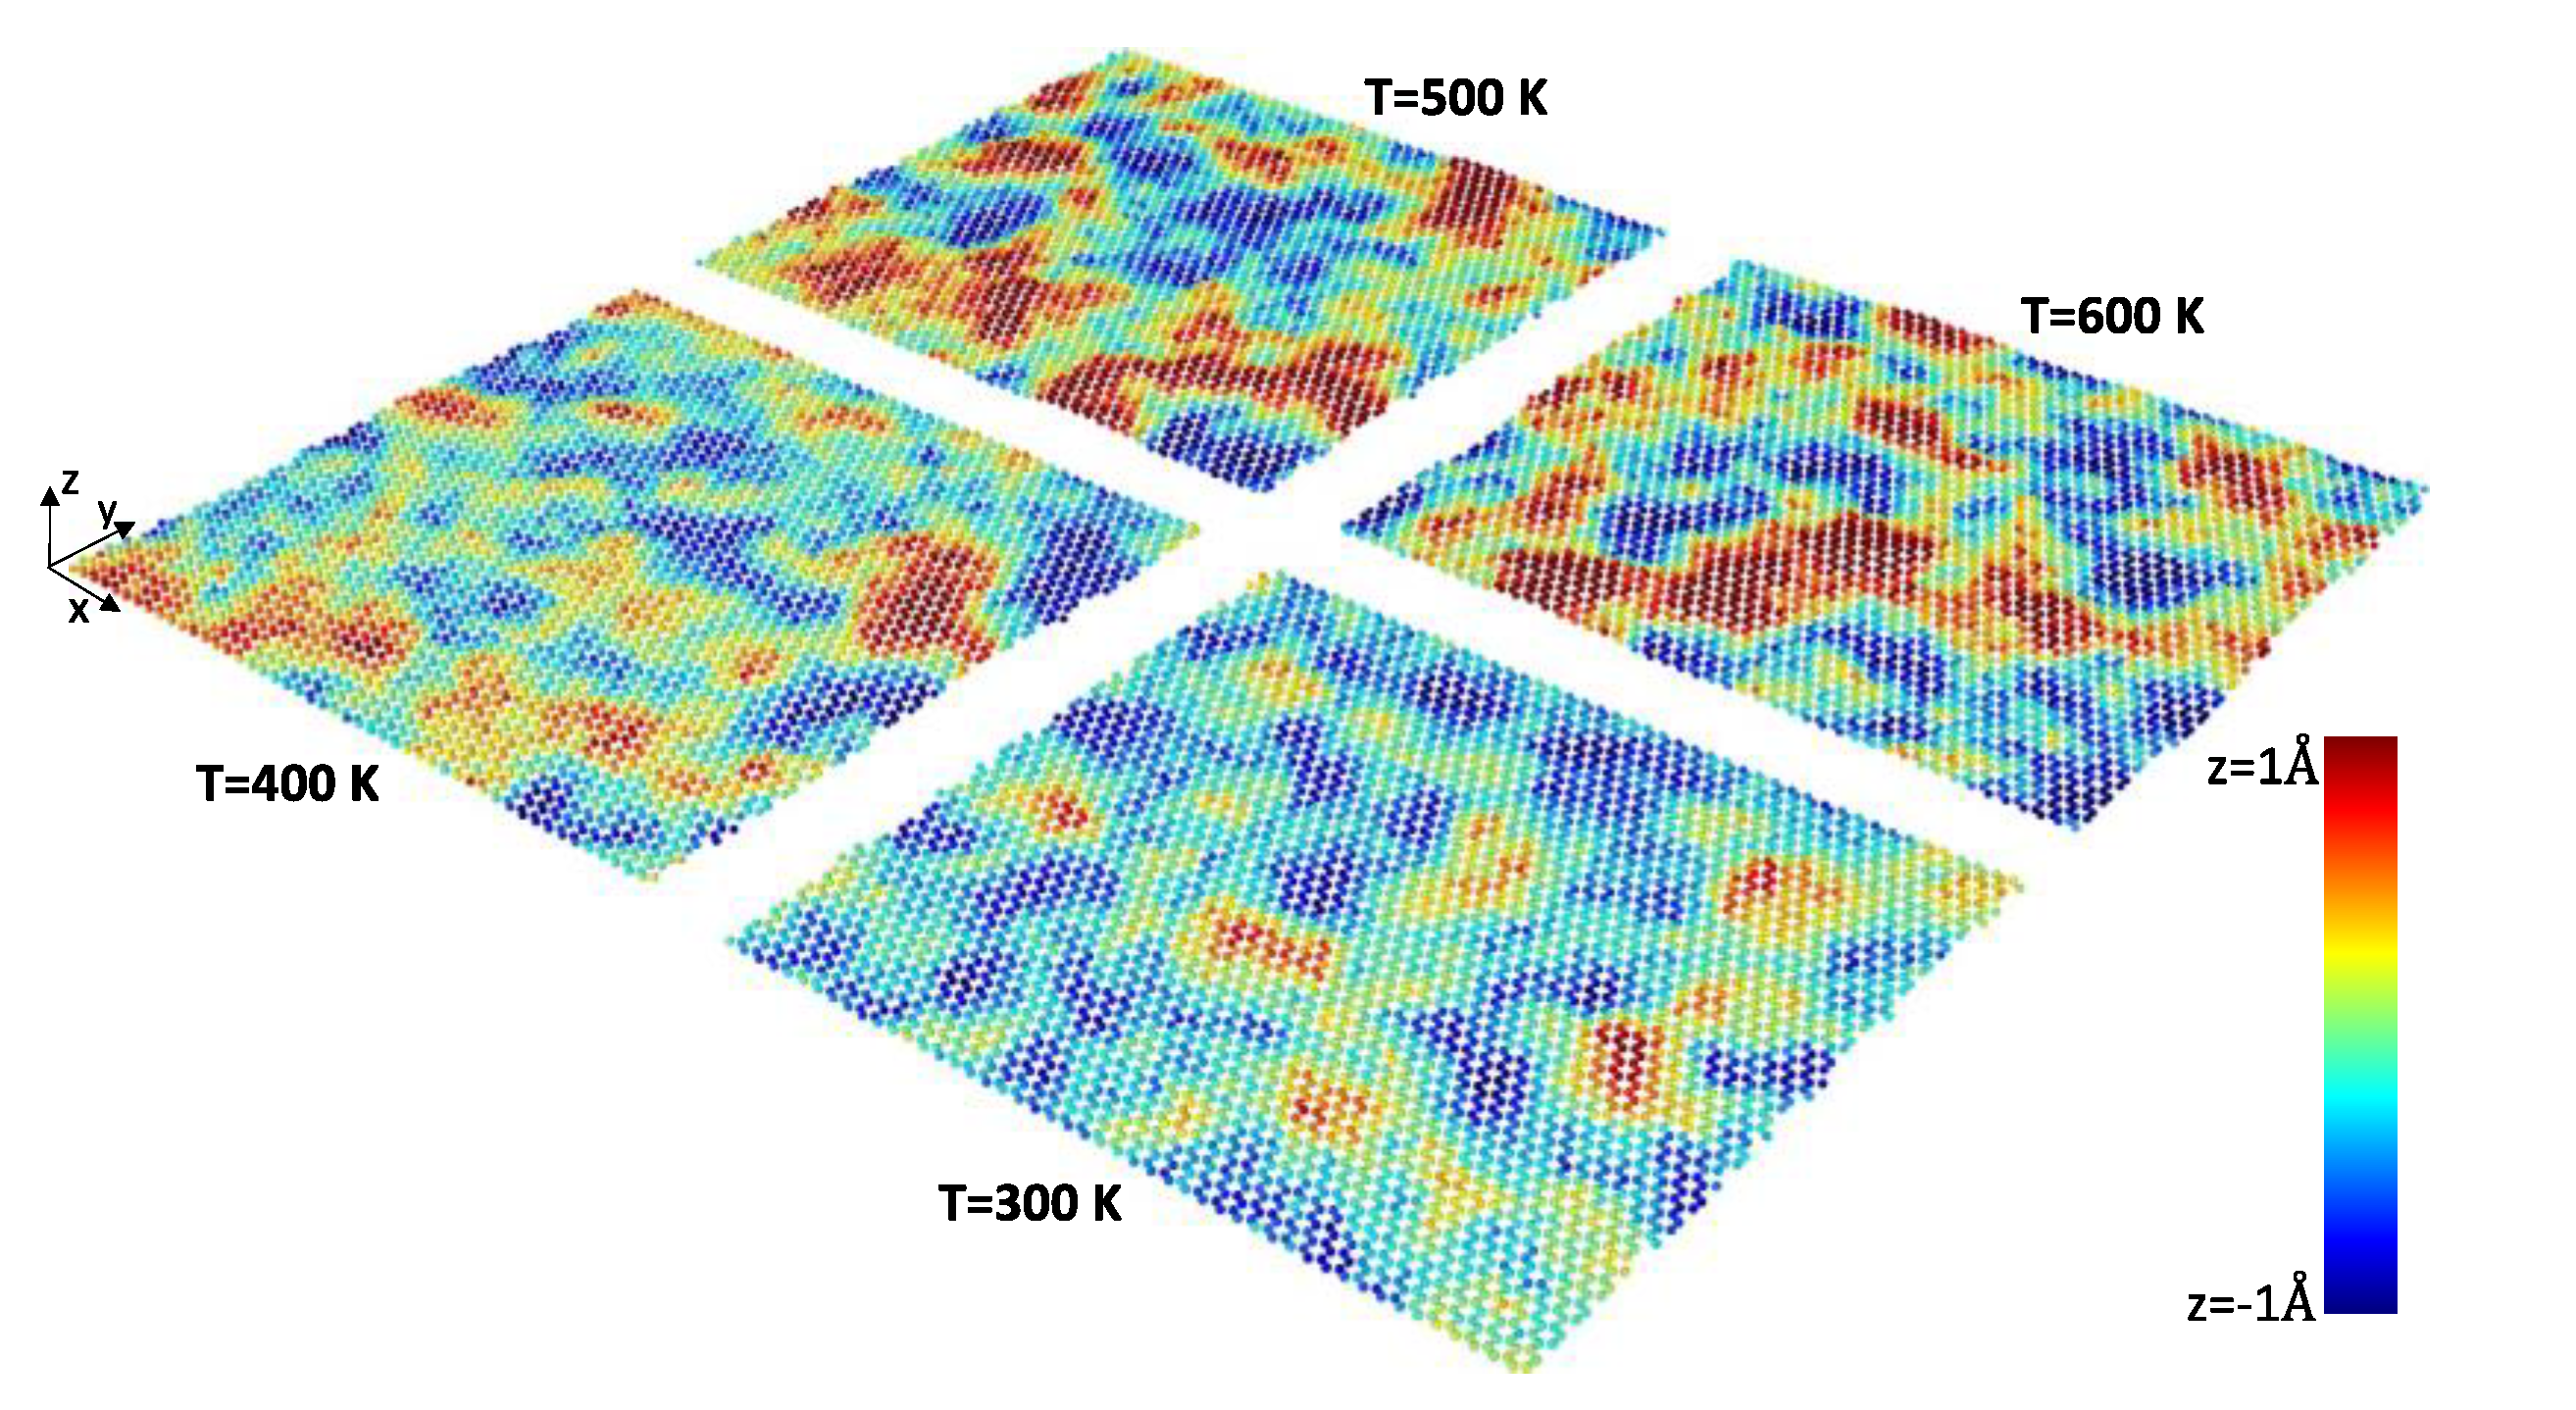
The presence of substrate can significantly reduce the wrinkles formation of nanosheets at elevated temperatures.
(2)
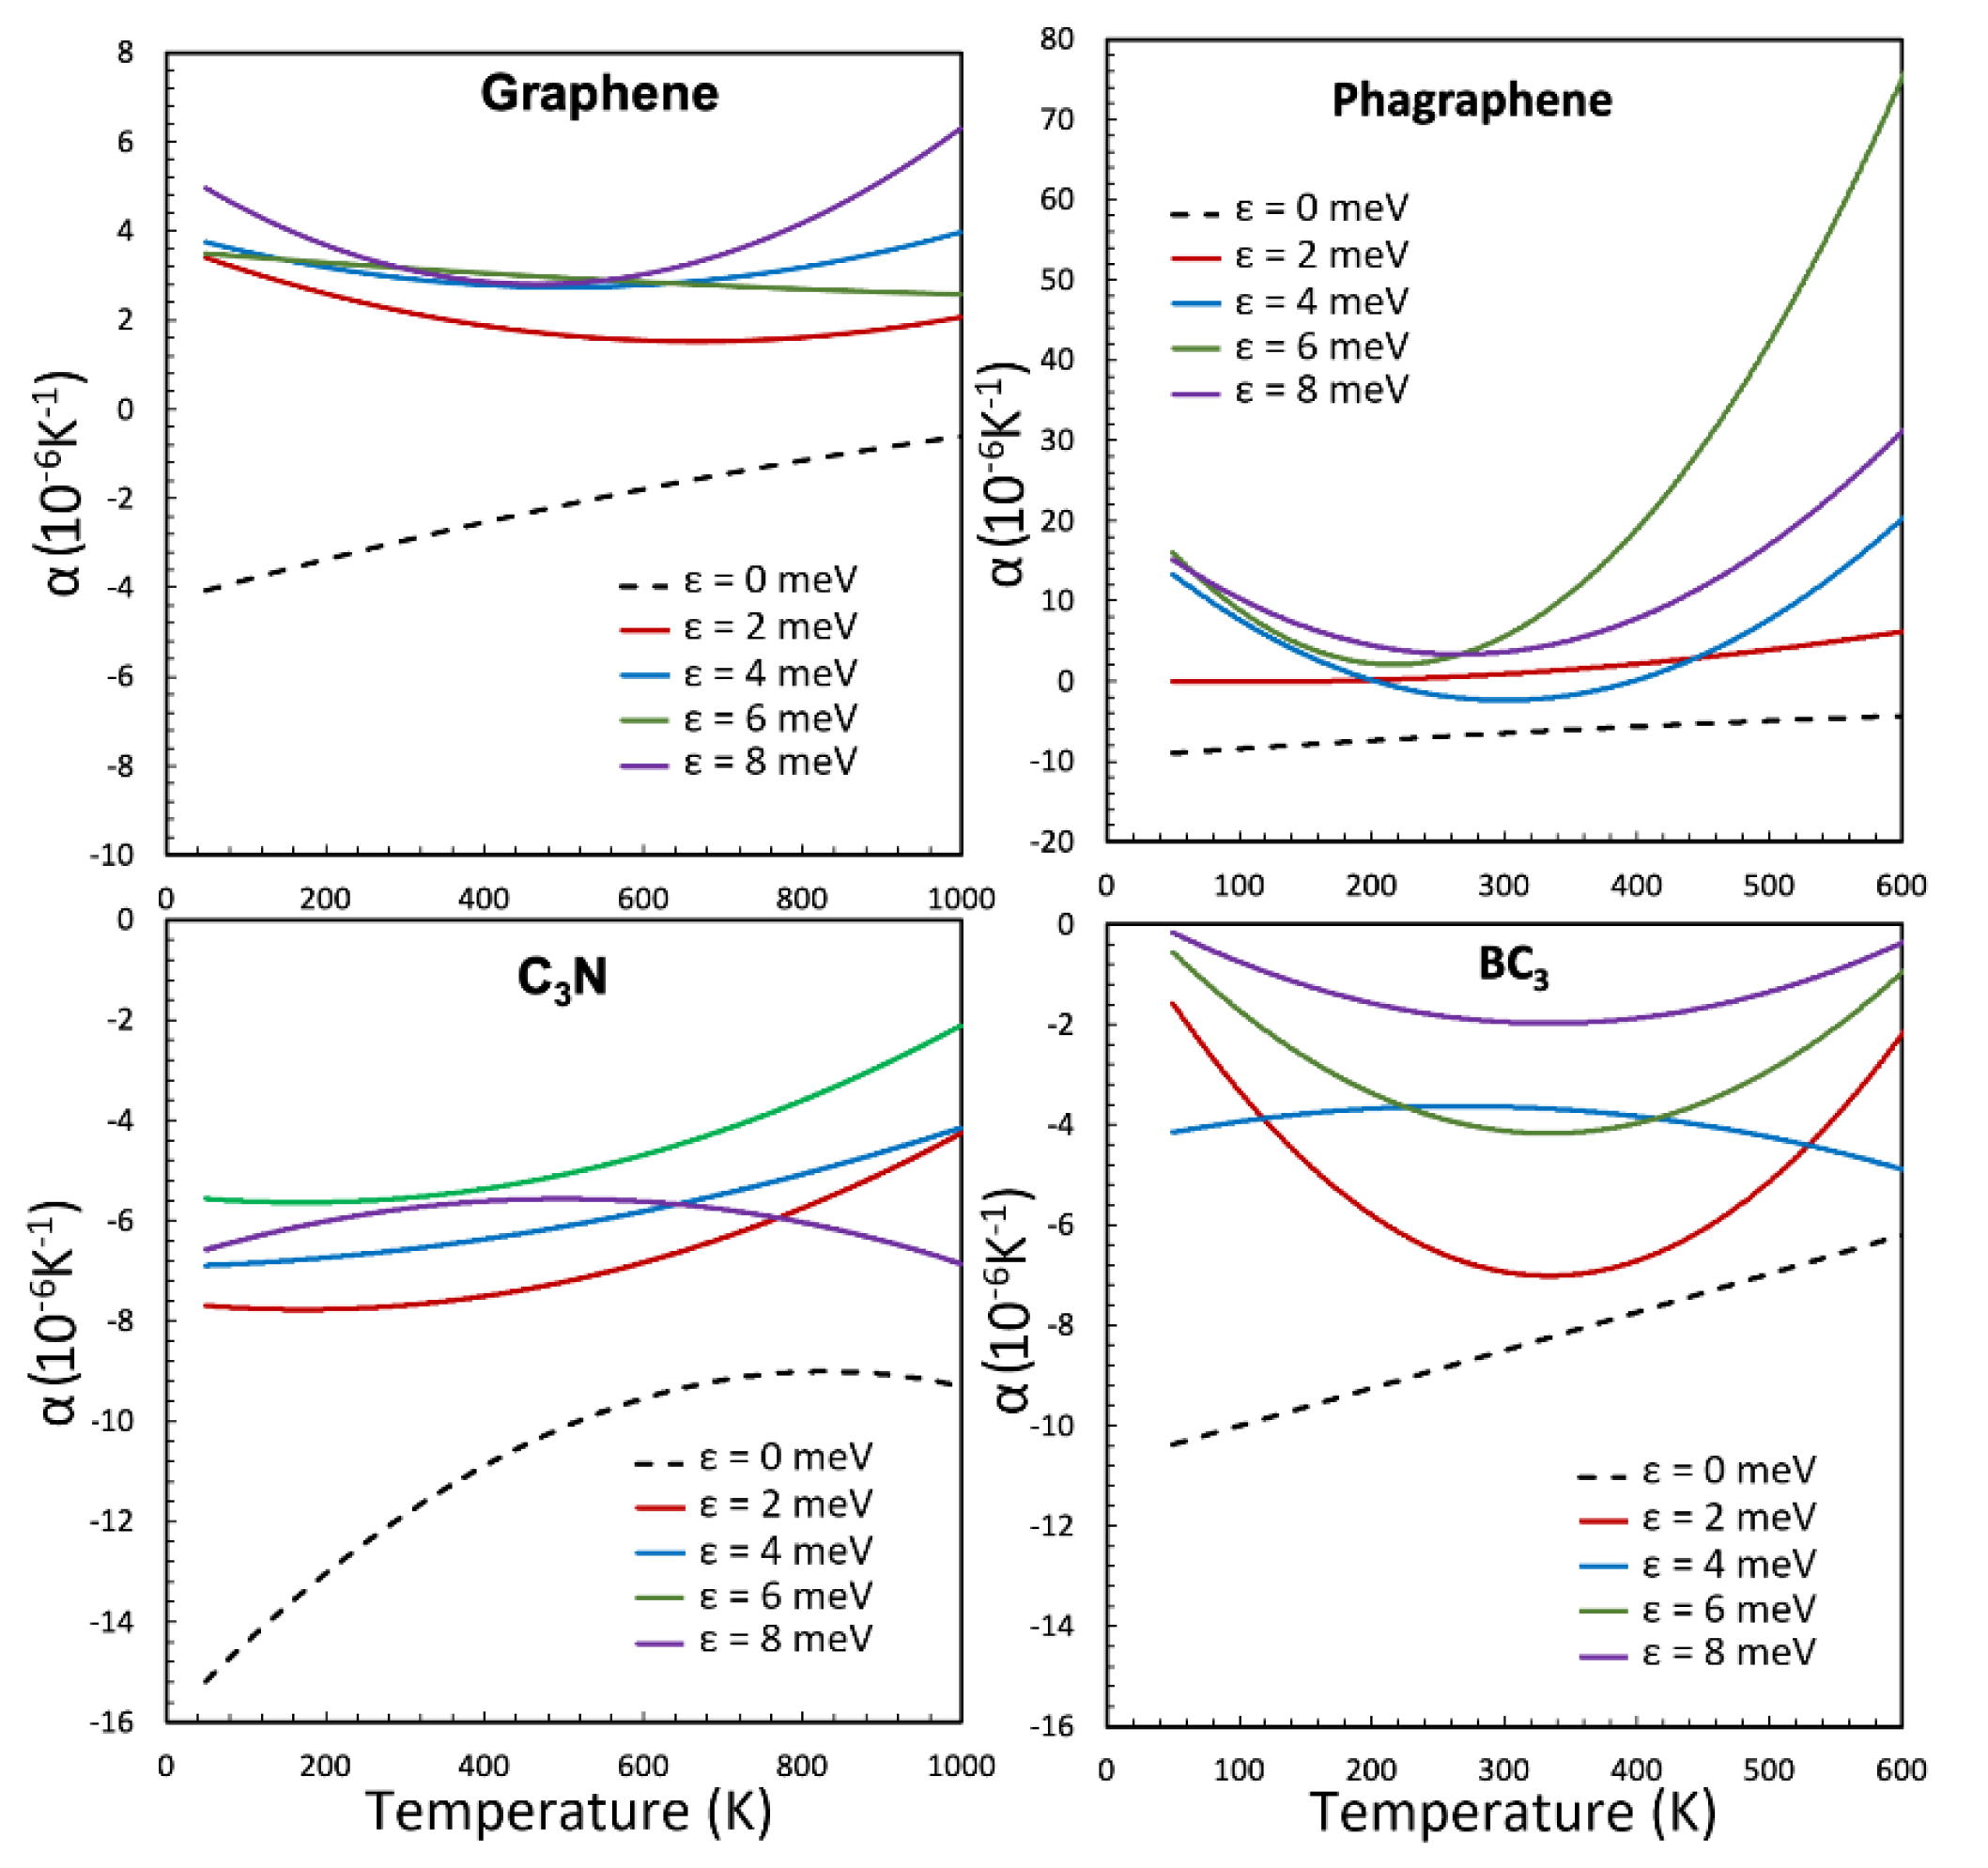
The projected area of graphene and phagraphene in two forms of with and without a substrate show different behavior with respect to the temperature. Without a substrate, the projected area decreases with increasing temperature. In contrast, for the supported monolayers with the presence of substrate, the size of the structure increases when the temperature rises. This behavior leads to a positive thermal expansion coefficient of supported graphene and phagraphene, whereas they both in the suspended form exhibit negative thermal expansion coefficients.
(3)
The projected area of the C3N and BC3 monolayers in the presence of substrate decreases with increasing temperature, similar to that occurs for their suspended forms. On other words, the presence of the substrate is not as strong to overcome the increase in the formation of wrinkles as the temperature rise, which result in retaining the negative thermal expansion coefficient of the C3N and BC3 nanosheets.
(4)
The increase in the strength of interaction between the substrate and the 2D material from 0 meV to 8 meV leads to increase of the algebraic value of the thermal expansion coefficient, which at room temperature was predicted to raise from: −2.95 × 10⁻⁶ K−1 to 3.15 × 10⁻⁶ K−1 for graphene, from −6.49 × 10⁻⁶ K−1 to 3.62 × 10⁻⁶ K−1 for phagraphene, from −11.9 × 10⁻⁶ K−1 to −5.76 × 10⁻⁶ K−1 for the C3N, and from −8.51 × 10⁻⁶ K−1 to −1.95 × 10⁻⁶ K−1 for the BC3 monolayer.

Supplementary Materials

The following supporting information can be downloaded at: https://www.mdpi.com/article/10.3390/condmat7040067/s1, Figure S1: Evolution of the supported monolayers per-atom area as a temperature function for the interaction strength of ε = 4 meV; Figure S2: Contour of out-of-plane displacement with respect to the center of mass of considered monolayers in suspended form (without substrate) and supported form (with substrate) in ε = 4 meV.

Author Contributions

Conceptualization, A.R. and B.M.; Data curation, A.R. and B.M.; Methodology, A.R. and B.M.; Writing—original draft, A.R. and B.M.; Writing–review & editing, B.M.; Funding acquisition, A.R. All authors have read and agreed to the published version of the manuscript.

Funding

This research was funded by Iran National Science Foundation (INSF) under project number of 4002089 and Deutsche Forschungsgemeinschaft (DFG, German Research Foundation) under Germany’s Excellence Strategy within the Cluster of Excellence PhoenixD (EXC 2122, Project ID 390833453).

Data Availability Statement

The raw data required to reproduce these findings are available upon a reasonable request to the corresponding author email.

Acknowledgments

The authors would like to thank Alexander Shapeev and Xiaoying Zhuang for very valuable discussions and support to this work.

Conflicts of Interest

The authors have no conflict of interest to declare that are relevant to the content of this article.

References

  1. Dove, M.T.; Fang, H. Negative Thermal Expansion and Associated Anomalous Physical Properties: Review of the Lattice Dynamics Theoretical Foundation. Rep. Prog. Phys. 2016, 79, 66503. [Google Scholar] [CrossRef] [PubMed]
  2. Chen, J.; Zhang, G.; Li, B. Substrate Coupling Suppresses Size Dependence of Thermal Conductivity in Supported Graphene. Nanoscale 2013, 5, 532–536. [Google Scholar] [CrossRef] [PubMed] [Green Version]
  3. Rajabpour, A.; Bazrafshan, S.; Volz, S. Carbon-Nitride 2D Nanostructures: Thermal Conductivity and Interfacial Thermal Conductance with the Silica Substrate. Phys. Chem. Chem. Phys. 2019, 21, 2507–2512. [Google Scholar] [CrossRef] [PubMed]
  4. Schelling, P.K.; Keblinski, P. Thermal Expansion of Carbon Structures. Phys. Rev. B 2003, 68, 35425. [Google Scholar] [CrossRef]
  5. Mounet, N.; Marzari, N. First-Principles Determination of the Structural, Vibrational and Thermodynamic Properties of Diamond, Graphite, and Derivatives. Phys. Rev. B 2005, 71, 205214. [Google Scholar] [CrossRef] [Green Version]
  6. Kano, E.; Malac, M.; Hayashida, M. Substrate and Contamination Effects on the Thermal Expansion Coefficient of Suspended Graphene Measured by Electron Diffraction. Carbon N. Y. 2020, 163, 324–332. [Google Scholar] [CrossRef]
  7. Tian, S.; Yang, Y.; Liu, Z.; Wang, C.; Pan, R.; Gu, C.; Li, J. Temperature-Dependent Raman Investigation on Suspended Graphene: Contribution from Thermal Expansion Coefficient Mismatch between Graphene and Substrate. Carbon N. Y. 2016, 104, 27–32. [Google Scholar] [CrossRef]
  8. Linas, S.; Magnin, Y.; Poinsot, B.; Boisron, O.; Förster, G.D.; Martinez, V.; Fulcrand, R.; Tournus, F.; Dupuis, V.; Rabilloud, F.; et al. Interplay between Raman Shift and Thermal Expansion in Graphene: Temperature-Dependent Measurements and Analysis of Substrate Corrections. Phys. Rev. B 2015, 91, 75426. [Google Scholar] [CrossRef] [Green Version]
  9. Pozzo, M.; Alfè, D.; Lacovig, P.; Hofmann, P.; Lizzit, S.; Baraldi, A. Thermal Expansion of Supported and Freestanding Graphene: Lattice Constant versus Interatomic Distance. Phys. Rev. Lett. 2011, 106, 135501. [Google Scholar] [CrossRef] [PubMed] [Green Version]
  10. Feng, Q.; Wei, D.; Su, Y.; Zhou, Z.; Wang, F.; Tian, C. Study of Thermal Expansion Coefficient of Graphene via Raman Micro-Spectroscopy: Revisited. Small 2021, 17, 2006146. [Google Scholar] [CrossRef] [PubMed]
  11. Mortazavi, B.; Rajabpour, A.; Zhuang, X.; Rabczuk, T.; Shapeev, A.V. Exploring Thermal Expansion of Carbon-Based Nanosheets by Machine-Learning Interatomic Potentials. Carbon N. Y. 2022, 186, 501–508. [Google Scholar] [CrossRef]
  12. Wang, Z.; Zhou, X.F.; Zhang, X.; Zhu, Q.; Dong, H.; Zhao, M.; Oganov, A.R. Phagraphene: A Low-Energy Graphene Allotrope Composed of 5-6-7 Carbon Rings with Distorted Dirac Cones. Nano Lett. 2015, 15, 6182–6186. [Google Scholar] [CrossRef] [PubMed] [Green Version]
  13. Lindsay, L.; Broido, D.A. Optimized Tersoff and Brenner Empirical Potential Parameters for Lattice Dynamics and Phonon Thermal Transport in Carbon Nanotubes and Graphene. Phys. Rev. B Condens. Matter Mater. Phys. 2010, 81, 1–6. [Google Scholar] [CrossRef] [Green Version]
  14. Mortazavi, B.; Novikov, I.S.; Shapeev, A.V. A Machine-Learning-Based Investigation on the Mechanical/Failure Response and Thermal Conductivity of Semiconducting BC2N Monolayers. Carbon N. Y. 2022, 188, 431–441. [Google Scholar] [CrossRef]
  15. Arabha, S.; Aghbolagh, Z.S.; Ghorbani, K.; Hatam-Lee, M.; Rajabpour, A. Recent Advances in Lattice Thermal Conductivity Calculation Using Machine-Learning Interatomic Potentials. J. Appl. Phys. 2021, 130, 210903. [Google Scholar] [CrossRef]
  16. Shapeev, A.V. Moment Tensor Potentials: A Class of Systematically Improvable Interatomic Potentials. Multiscale Model. Simul. 2016, 14, 1153–1173. [Google Scholar] [CrossRef]
  17. Nosé, S. A Unified Formulation of the Constant Temperature Molecular Dynamics Methods. J. Chem. Phys. 1984, 81, 511. [Google Scholar] [CrossRef] [Green Version]
  18. Plimpton, S. Fast Parallel Algorithms for Short-Range Molecular Dynamics. J. Comput. Phys. 1995, 117, 1–19. [Google Scholar] [CrossRef] [Green Version]
  19. Ghasemi, H.; Rajabpour, A. A Novel Approach to Calculate Thermal Expansion of Graphene: Molecular Dynamics Study. Eur. Phys. J. Plus 2017, 132, 221. [Google Scholar] [CrossRef]
Figure 1. (a) Atomic structures of studied 2D materials: graphene, phagraphene, C3N (C: blue, N: yellow points), and BC3(C: blue, B: red points). (b) The schematic view for a supported 2D material over a van der Waals substrate.
Condensedmatter 07 00067 g001
Figure 2. Contour of out-of-plane displacement with respect to the center of mass of supported graphene on the substrate with the interaction strength of ε = 4 meV between the substrate and the graphene.
Condensedmatter 07 00067 g002
Figure 3. Thermal expansion coefficient (α) as a function of temperature for the cases of suspended (ε = 0 meV) and supported monolayers with four different interaction strengths of ε = 2, 4, 6 and 8 meV.
Condensedmatter 07 00067 g003
Table 1. Per-atom area fitting curve (aT3 + bT2 + cT + d) coefficients between 50–1000 K for the supported monolayers with interaction strength of ε = 4 meV.
Graphene PhagrapheneC3NBC3
a (K−32)4.34 × 10−122.26 × 10−101.95 × 10⁻¹²−1.09 × 10⁻¹¹
b (K−22)8.68 × 10⁻⁹−2.04 × 10−76.51 × 10−108.68 × 10⁻⁹
c (K−12)9.79 × 10−65.46 × 10−5−1.77 × 10⁻⁵−1.28 × 10⁻⁵
d (Å2)2.6292.6982.5572.893
Publisher’s Note: MDPI stays neutral with regard to jurisdictional claims in published maps and institutional affiliations.

