Article

Nanoscale Phase Separation of Incommensurate and Quasi-Commensurate Spin Stripes in Low Temperature Spin Glass of La2−xSrxNiO4

by
Gaetano Campi
1,*,
Antonio Bianconi
1,2,3 and
Alessandro Ricci
2,4,5,*
1
Institute of Crystallography, CNR, Via Salaria Km 29.300, 00015 Monterotondo, Italy
2
RICMASS Rome International Center for Materials Science, Superstripes Via dei Sabelli 119A, 00185 Roma, Italy
3
Moscow Engineering Physics Institute, National Research Nuclear University MEPhI, 115409 Moscow, Russia
4
Duferco Corporate Innovation, Via Trevano 2A, 6900 Lugano, Switzerland
5
Deutsches Elektronen-Synchrotron DESY, Notkestraße 85, D-22607 Hamburg, Germany
*
Authors to whom correspondence should be addressed.
Condens. Matter 2021, 6(4), 45; https://doi.org/10.3390/condmat6040045
Submission received: 26 October 2021 / Revised: 15 November 2021 / Accepted: 18 November 2021 / Published: 23 November 2021
(This article belongs to the Special Issue Quantum Complex Matter from Charge Density Waves to Superstripes)

Abstract

:
While spin striped phases in La2−xSrxNiO4+y for 0.25 < x < 0.33 are the archetypal case of a 1D spin density wave (SDW) phase in doped antiferromagnetic strongly correlated perovskites, few information is available on the SDW spatial organization. In this context, we have measured the spatial variation of the wave vector of the SDW reflection profile by scanning micro X-ray diffractions with a coherent beam. We obtained evidence of a SDW order–disorder transition by lowering a high temperature phase (T > 50 K) to a low temperature phase (T < 50 K). We have identified quasi-commensurate spin stripe puddles in the ordered phase at 50 < T < 70 K, while the low temperature spin glassy phase presents a nanoscale phase separation of T = 30 K, with the coexistence of quasi-commensurate and incommensurate spin stripe puddles assigned to the interplay of quantum frustration and strong electronic correlations.

1. Introduction

Commensurate–incommensurate (C–IC) transitions [1] and the related complex multiscale distribution of dislocations with the formation of striped phases are of high interest in the quantum complex matter research field. Recently, this phenomenon has been observed in two-dimensional atomic layers with strongly correlated electronic matter forming stacks held together by a week Van der Waals force. For example, stripes appear in Ca-Intercalated bilayer graphene, induced by commensurate lattice matching [2] in graphene on hexagonal boron nitride [3] and in the monolayers on a honeycomb substrate [4].
The commensurate (C) phase in a crystalline lattice occurs when the ratio between a superlattice oscillation period (λ = 1/ε) (where ε is the wave vector) and the number of lattice units is a rational number. On the contrary, the incommensurate (IC) phase occurs if this ratio is an irrational number. In the C phase, the wave modulation is locked or pinned to the periodicity of the crystal while, in the incommensurate state, the wave is unlocked with the crystal periodicity. In this case the wave can be easily unpinned by a weak perturbation and dislocations, as bosonic strings can wander and sweep an increasingly greater volume at low temperatures driven by quantum fluctuations. As a consequence, a crystalline phase with real space ordering in a single state in the k-space can become disordered at lower temperatures.
Between any two commensurate phases, there is a sequence of quasi-commensurate (QC) locked-in and incommensurate (IC) phases forming a complex landscape called the Devil’s Staircase [1]. It has been observed in several systems, namely the Kr monolayer on graphite [5]; atomic Pb layer on Si(111) surface [6]; charge density wave (CDW) and spin density wave (SDW) [7]; ferroelectric smectic phases in liquid crystalline binary mixtures [8]; ferroelectrics [9]; atomic concentration waves in alloys [10]; periodic atomic displacements in NaV2O5 [11]; colloidal particles on a periodic substrate [12]; and field-induced SDW states in anisotropic two-dimensional conductors [13].
Commensurate or incommensurate stripes modulations can be formed by doping two dimensional (2D) strongly correlated magnetic quantum materials. Indeed, doping introduces charged solitons that can be viewed as a generalized Wigner charge density wave, as proposed by Hubbard [14], or as lines of domain walls in doped nickelates, which are the archetypal case of a multi orbital Hubbard model in a strained 2D atomic lattice [15,16,17,18,19]. Charge–spin stripes modulations are accompanied by orbital modulations and lattice distortions, like those that occur in cuprates [20,21,22,23,24,25], providing the archetypal case of quantum complex matter composed from a nanoscale phase separation [26,27,28,29]. Moreover, evidence now exists that proves this nanoscale phase separation is controlled by (i) the misfit strain between atomic layers in hetero-structures at the atomic limit [30,31,32,33], which is great in La2−xNiO4, giving a compressed [NiO2] plane and an expanded [La2O2] layer; and (ii) by the proximity of the chemical potential to a Lifshitz transition [30,34,35] in multiband multiorbital Hubbard systems.
The layered La2−xSrxNiO4+y nickelate is an archetypal doped Mott insulator exhibiting the universal features of the inhomogeneous spatial distribution of spin stripes phases in complex quantum materials [36,37,38], as lightly doped La2−xSrxCuO4 [39,40], and photo-induced stripes in La2CuO4+y [41]. The nanoscale phase separation [42,43] can be generated by oxygen interstitial ordering [24,25,44,45,46,47], CDW [24,25] strain driven superstripes in cuprates [21,22,31,32,33], in iron-based superconductors [48,49], and diborides [50,51,52,53].
We have used scanning micro X-ray diffraction with a high coherent flux of X-ray, to visualize the spin stripes phase separation at different temperatures in La1−xSrxNiO4. Nowadays, scanning micro X-ray diffraction is recognized as a general and powerful tool to investigate the emergence of complex geometry in several fields, such as complex biological systems [54,55,56,57,58,59,60], using time-resolved and space-resolved synchrotron radiation techniques and space–time dependent photo-induced structure evolution [61]. In this paper, we report the study of the SDW order–disorder transition in La1−xSrxNiO4, which was observed as transitioning from the spin ordered phase at 50 < T < 70 K to the low temperature disordered phase at T = 30 K [62]. The formation of a glassy electronic phase at a low temperature was observed in other nickelates and related materials [63,64,65,66,67,68]. Moreover, it was found that the spin stripe phase in La1−xSrxNiO4 below 120 K presented a strong spatially inhomogeneous landscape, with the formations of the spin stripe rich regions and spin stripes poor regions [43] providing evidence of nanoscale electronic phase separation [69,70] observed in several strongly correlate systems [71,72,73].
The formation of the inhomogeneous stripes landscape has been assigned to long-range interactions in combination with the confinement to periodic potentials, which generate a proliferation of metastable low-energy states, resulting in Devil’s Staircase-type structures [74,75,76,77]. Quantum frustration becomes relevant at low temperatures [78,79], in which stripe behavior called the superstripes phase can be generated, while preserving super fluidity [80,81,82] or superconductivity [83,84,85] or favoring competing glassy spin stripes landscape realizations. In the present study, we have identified a nanoscale phase separation at T = 30 K between quasi-commensurate and incommensurate glassy spin stripes, assigned to the interplay of quantum frustration and strong electronic correlations.

2. Results

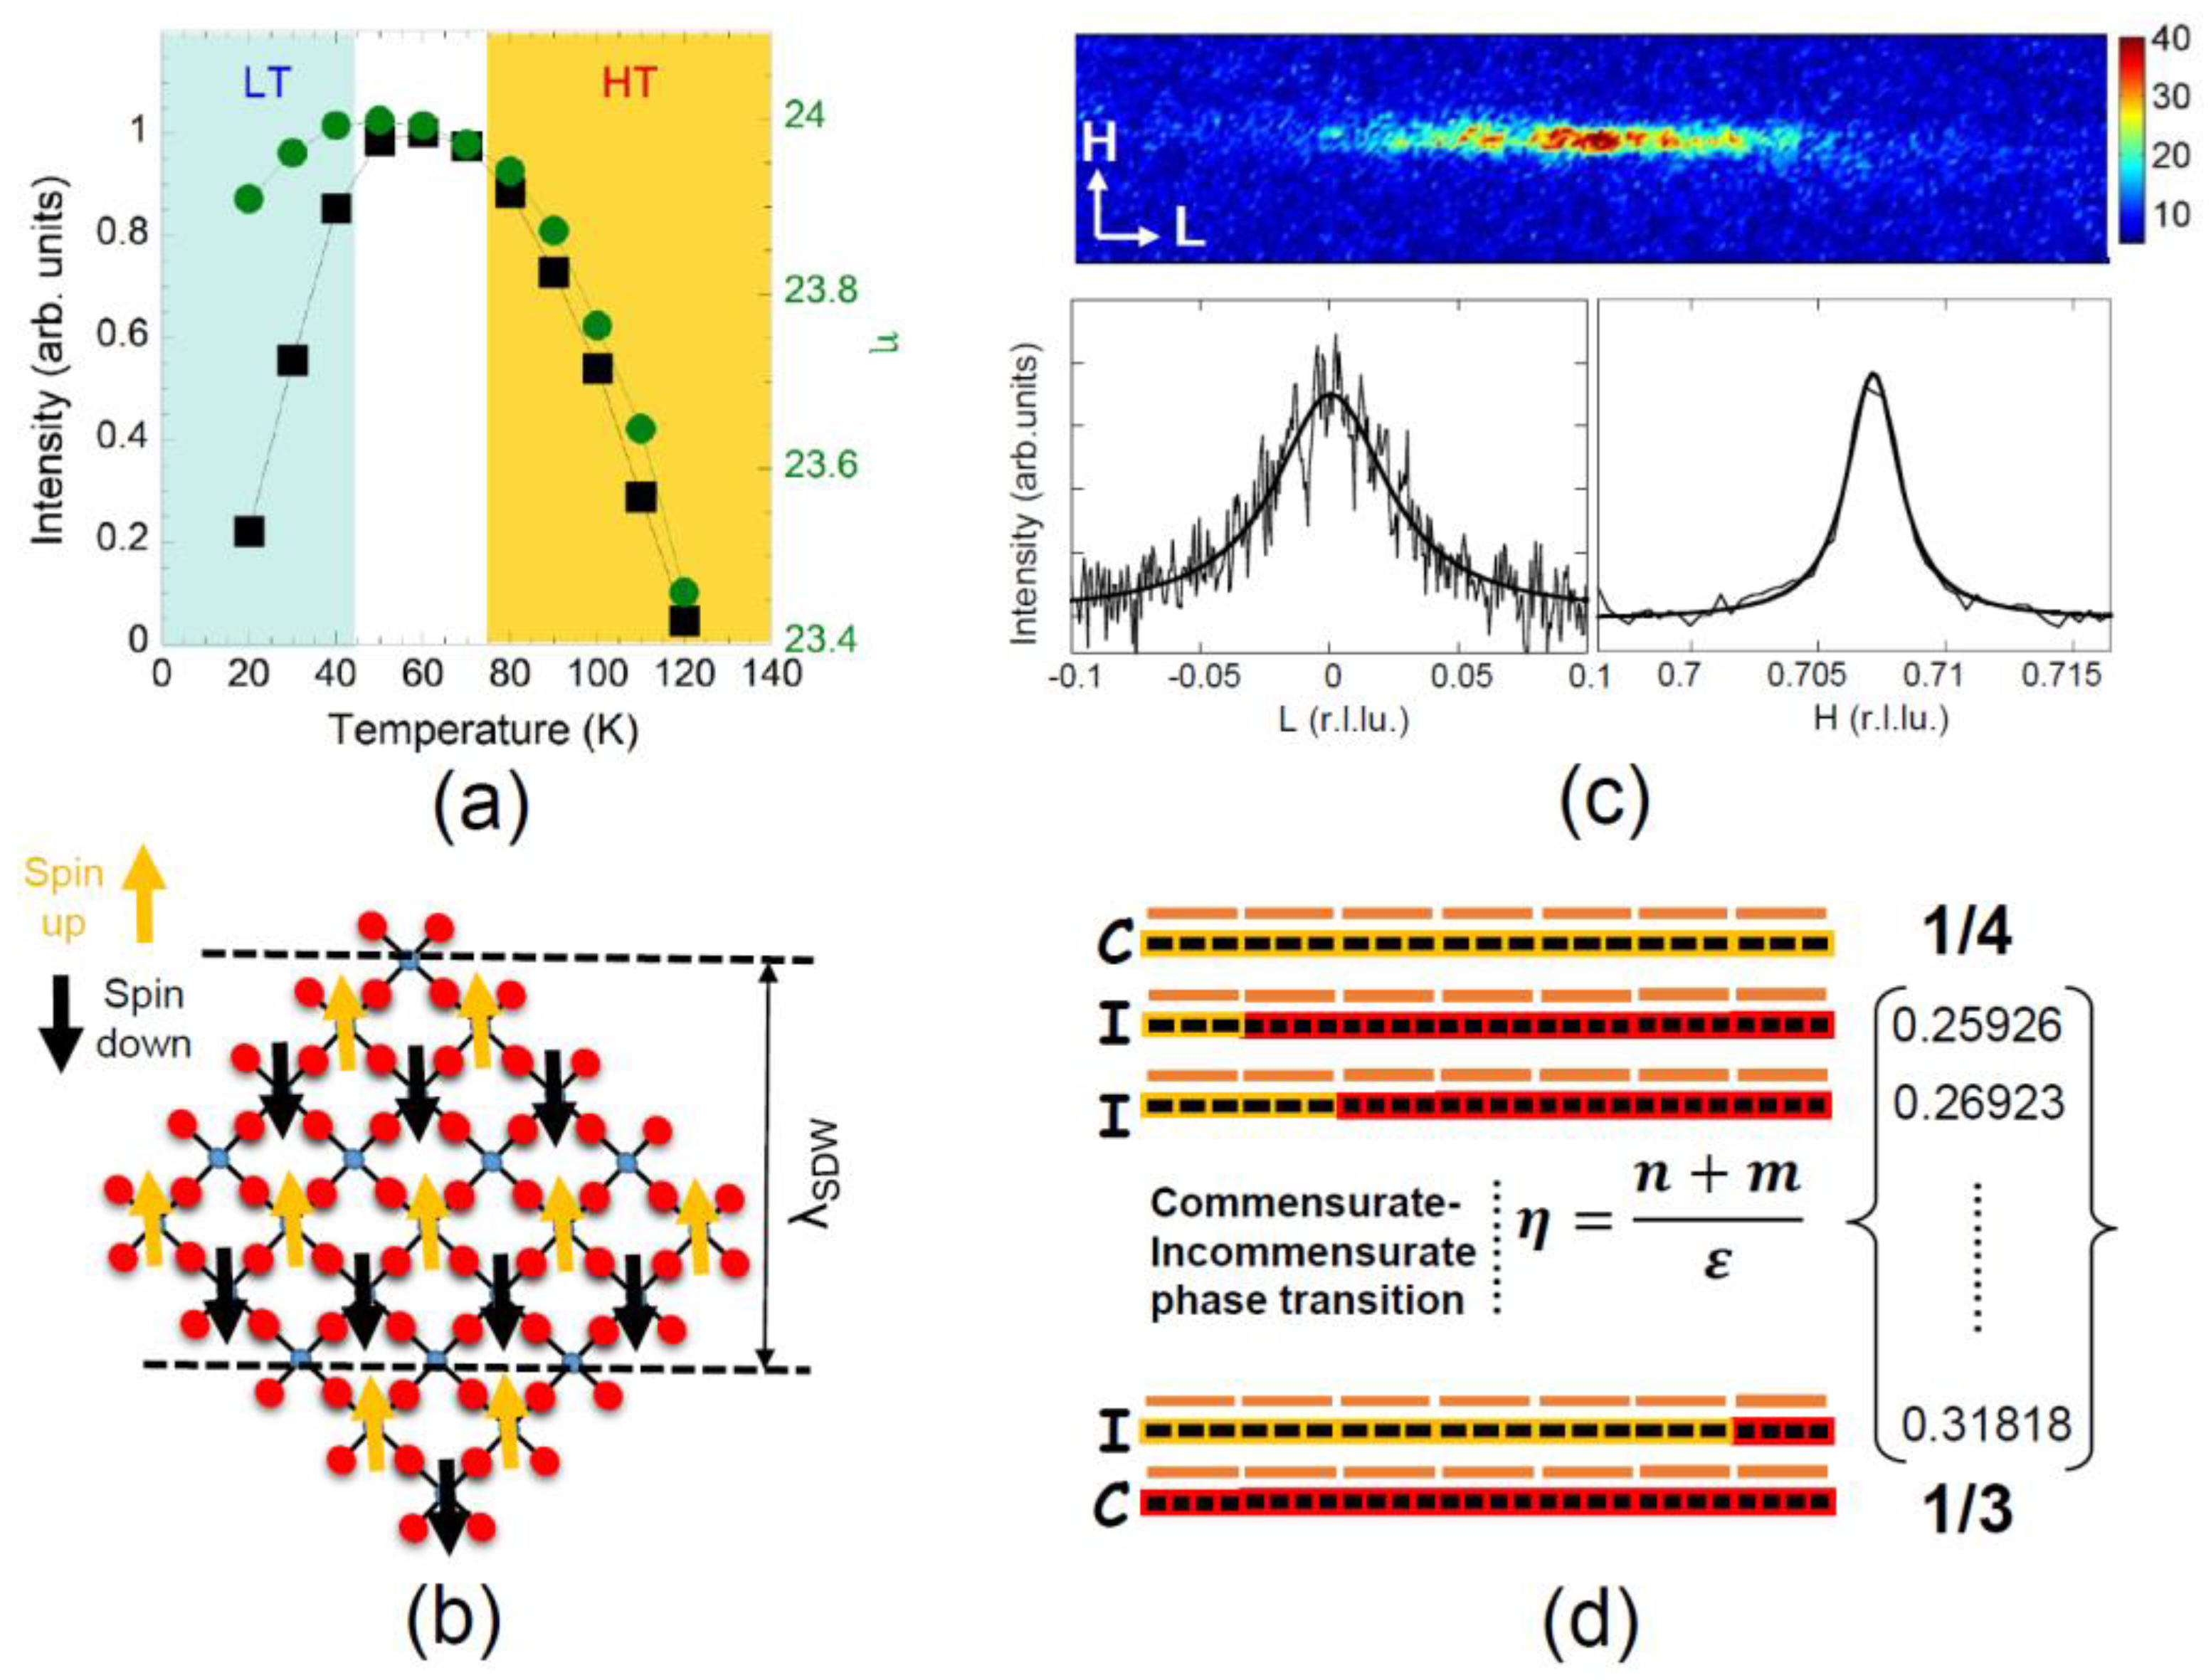
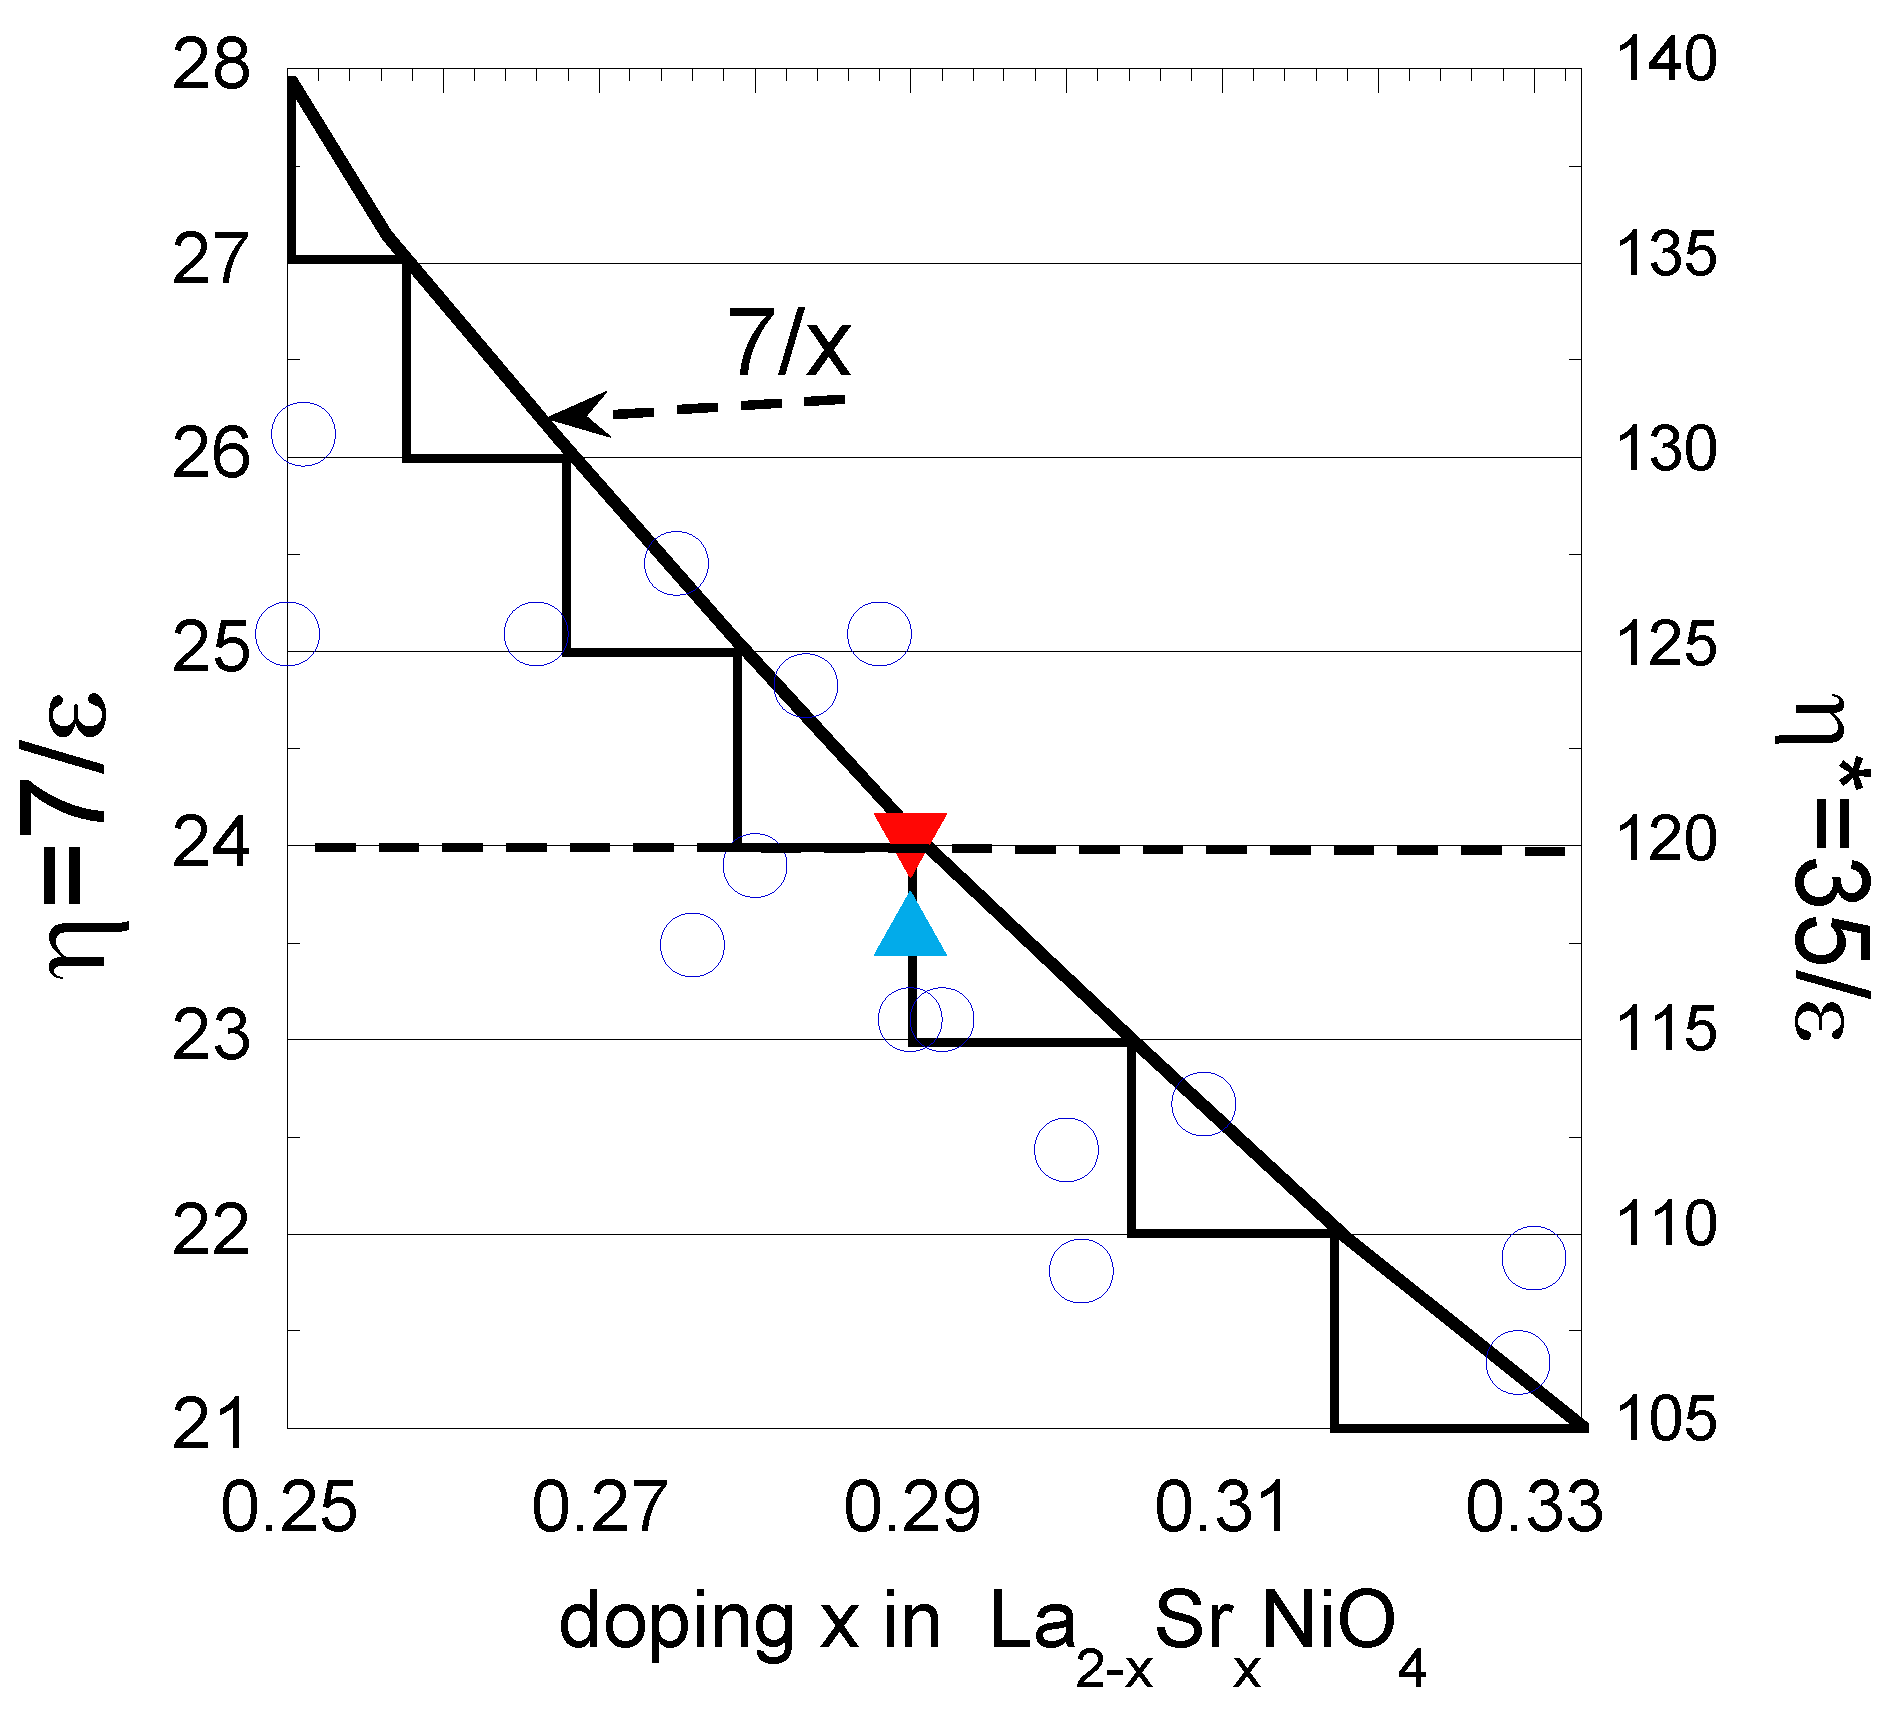
2.1. Iincommensurate and Quasi-Commensurate Spin Stripes in La2−xSrxNiO4

The temperature–doping phase diagram of La2−xSrxNiO4 [36] presents the antiferromagnetic order (AFM) in the lower Sr-doping region with x < 0.2. In the higher Sr-doping region with x > 0.2, charge and spin stripes appear, extending diagonally to the Ni–O bond directions. For samples with tetragonal symmetry, such as the one analyzed here, the stripes order itself breaks the rotational symmetry of the ab-plane and, therefore, stripes with 2 different orientations show up, related by a 90-degree rotation around the c-axis. It has been found that the incommensurate superlattices of spin stripes occur at wave vectors (1−ε, 0, 0), where ε is a temperature dependent incommensurability value. A strong enhancement of the intensity peak can be obtained by resonant soft X-ray diffraction at the Ni 2p→3d L3-edge (852 eV), as reported in [62]. The temperature evolution of the SDW profile projected on the H and L directions is summarized in Figure 1a. The SDW rises for temperatures below TSDW = 120 K. On further cooling, its intensity increases, reaching a maximum value between 50 and 70 K. Subsequently, quite a dramatic intensity reduction is reached when the temperature is decreased further to approximately 30 K (light blue area). Moreover, the peak position changes with the temperature. The commensurate periods 1/ε = (nx + my)/(n + m) intermediate between two main commensurate wave vectors (ε1 = 1/n) and (ε2 = 1/m) with periods of m and n lattice units, respectively, occuring at integer numbers of lattice unit cells η = (n + m)/ε. Each step corresponds to a modulation wave with a number of (m + n) periods λ = 1/ε locked with the underlying lattice onto a rational number. The temperature evolution of η value, named here as the commensurability value, indicates that the system tends to reach the quasi-commensurate state, namely QC, at η = 24 when the intensity reaches its maximum value of approximately T = 50 K. As the system moves to lower and higher temperatures, η moves away from the QC state, and the SDW puddles density presents an anomalous decrease.
A scheme of the superlattice of spin ordering is presented in Figure 1b. The typical SDW peak generated by the spin ordering, with cuts along the tH and L directions of he reciprocal space, is shown in Figure 1c. Fitting profiles with a Lorentzian lineshape, provided us with the in-plane correlation length of approximately 20 nm (36 unit cells) and the out-of-plane correlation length of 2 nm (2 unit cells), which is significantly smaller, reflecting the quasi two-dimensionality of the stripes phase [35]. For the present investigation, we used a sample with the following doping level: x = 0.29. The incommensurate SDW, with ε = 0.29 ordering, consists of the mixture of the ε = 1/4 stripe order and the ε = 1/3 spin order, i.e., alternating n = 3 stripes portions and m = 4 stripes portions as schematized in Figure 1d. The average modulation period is given by 1/ε = (3x + 4y)/(3 + 4), where x + y = 3 + 4. Therefore, η = 7/ε = 3x + 4y varies in the range 21 < η < 28 and, at each integer value of η, the system reaches a quasi-commensurate phase at the step of a Devil’s Staircase. The x = 0.29 doping is close to the staircase step of the quasi-commensurate spin modulation with 7/ε = 24 i.e., (x = 3, y = 4) 3 × 4+4 × 3 = 12 + 12 = 24 and, by changing the temperature and position, it fluctuates in the range 23 < η < 24.

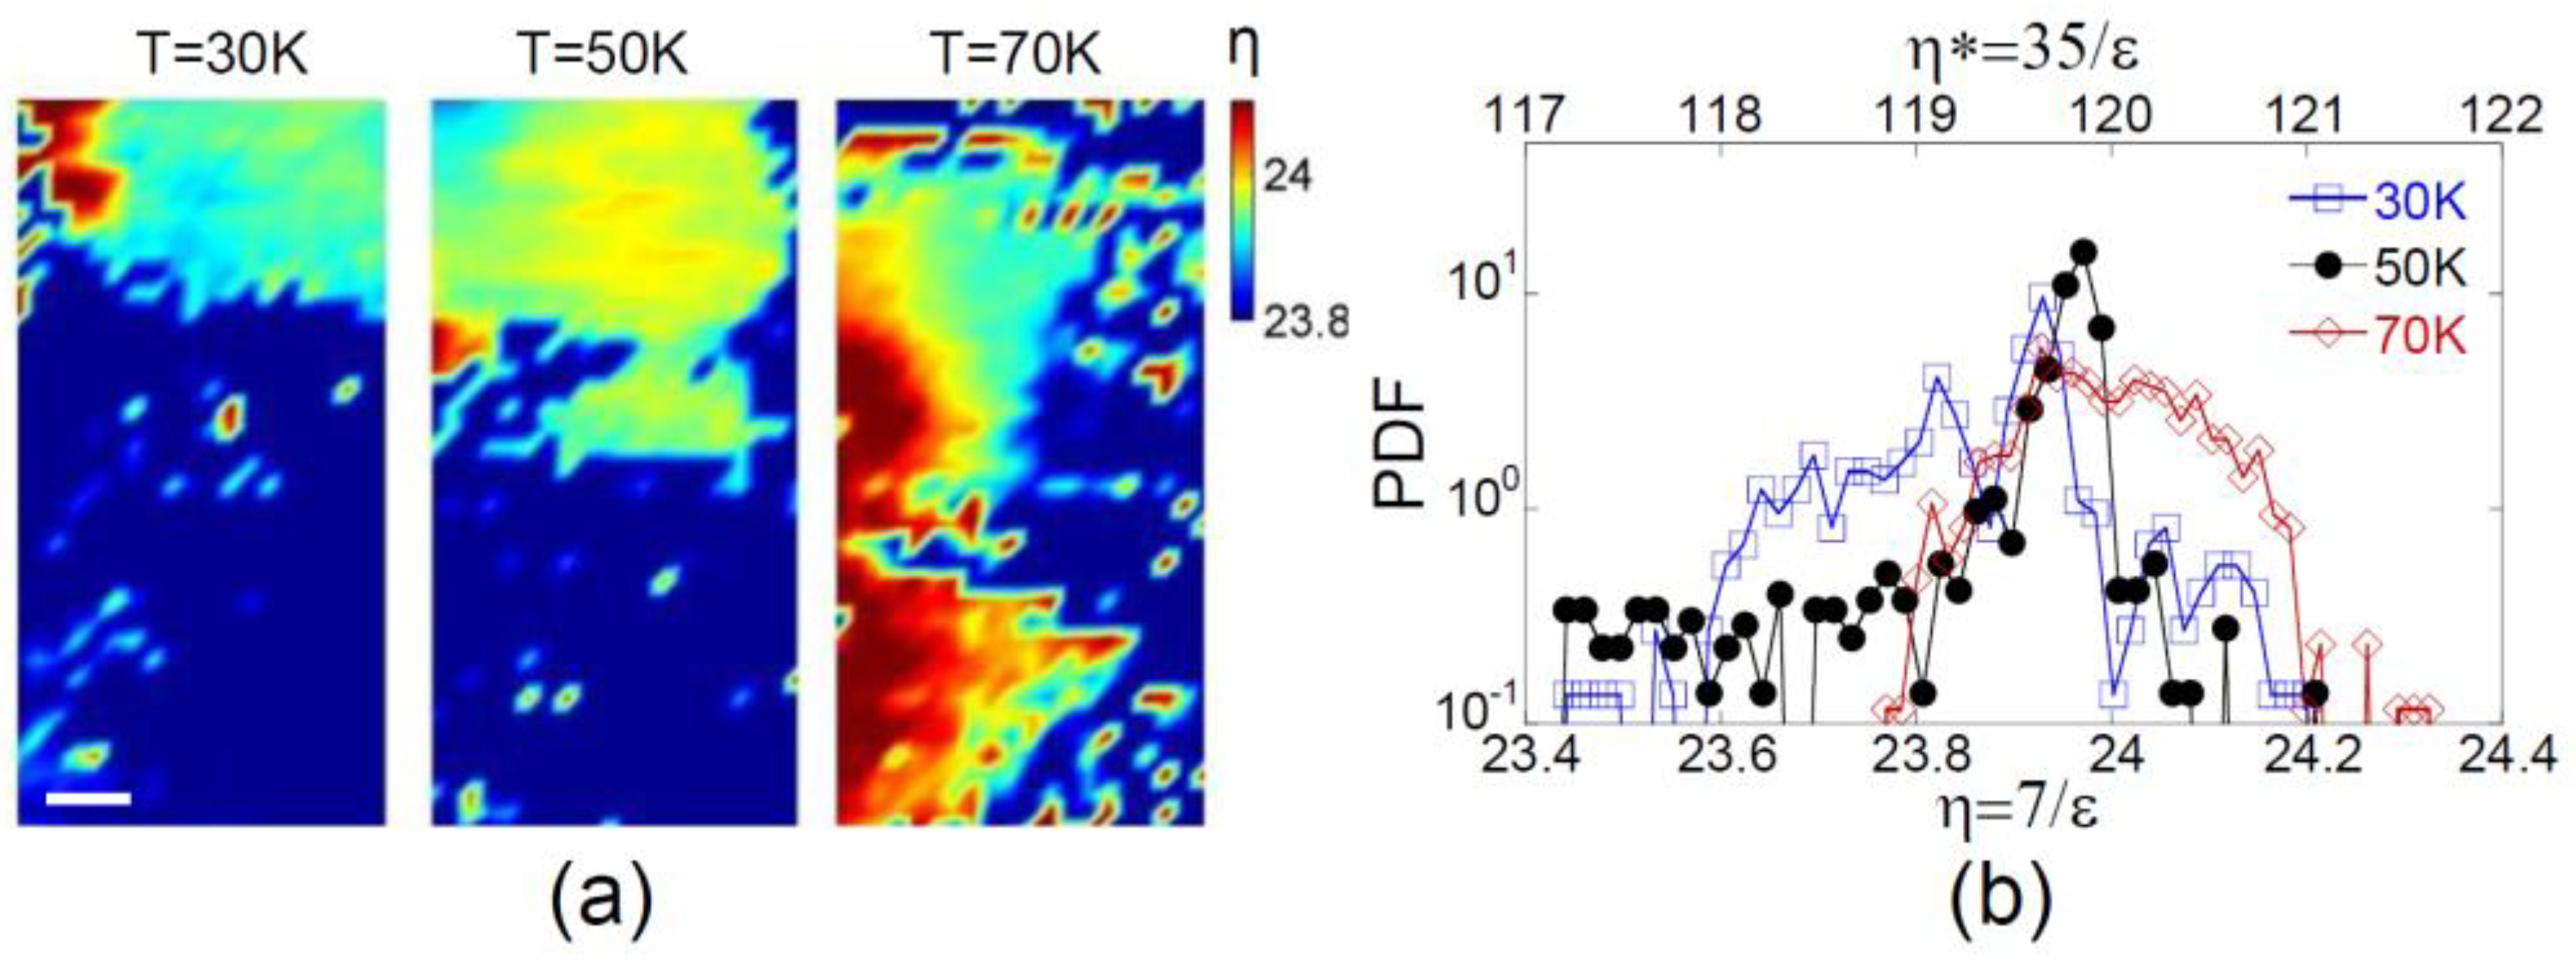
2.2. Maps of Incommensurate and Quasi-Commensurate Spin Stripes in La1.71Sr0.29NiO4

In order to shed light on the counterintuitive behavior of SDW disordering at low temperatures, we have investigated the spatial evolution of the SDW in real space. We used scanning micro X-ray diffraction (SµXRD), probing the local stripes order via the mapping of the superlattice peak at (1−ε, 0, 0) with ε = 0.29. We performed our measurements on the P10 beamline of the Petra III synchrotron. The key result obtained from this experiment has been the mapping of the spatial distribution of the (1−ε, 0, 0) stripes peak incommensurability over different areas of 40 × 80 μm2 in steps of 1 μm in both directions, resulting in 3321 diffraction images.
The variability of the incommensurability, η, has already be observed as a function of temperature (Figure 1a). In Figure 2a, we present the maps of η at T = 30 K, 50 K, and 70 K. In Figure 2b, we show the probability density function of η and its multiple value η* = 5η, indicating a higher degree of commensurability. Focusing on the maps measured at the temperature T = 50 K, we can observe that microscale puddles with a narrow distribution occur in the range 23.9 < η < 24 (119.5 < η* < 120), which is associated with the QC long range SDW phase with the η = 24 (η* = 120) phase. By increasing the temperature to T = 70 K, we can observe that the average value of η remains at the QC phase η = 24 (η* = 120), but we can also observe the increasing number of incommensurate micro puddles with 24.0 < η < 24.2 (120 < η* < 121) induced by thermal noise. In the phase probing the spin glass at T = 30 K, which is characterized by the small coherence length of the SDW reflection [62], we can observe a shorter average SDW incommensurability η = 23.85. This is due to the appearance of a relevant number of spots with incommensurate values 23.6 < η < 23.8 (118 < η* < 119). Thus, at low temperatures, T < 50 K, we observe the coexistence of a double set of spots: the first set with the quasi-commensurate η* = 120 spots, and the second set of spots associated with an incommensurate SDW phase, namely IC.

2.3. Low Temperature Phase Separation between Incommensurate and Quasi-Commensurate Spin Stripes in La1.71Sr0.29NiO4

The tendency of the system to assume a quasi-commensurate SDW conformation, when the intensity reaches a maximum at 50 K, is illustrated by plotting the SDW intensity as a function of η (η*), in Figure 3. Here, we can observe that the η distribution in the quasi-commensurate QC phase at T = 50 K is centered around the value of η = 24 and drops as soon as η overcomes this value.
The QC value of η is maintained at T = 70 K, even if the distribution appears larger due to the thermal noise. On the other hand, the incommensurability values decrease to approximately η = 23.6 in the IC phase at T = 30 K.
We can observe a continuous spread of the observed superlattice periods that broadens upon cooling below 50 K. At these low temperatures, a phase separation between the incommensurate and quasi-commensurate spin stripes phase occurs, as summarized in Figure 4. We indicate, here, the quasi-commensurate (QC) phase with η = 24 (η* = 120) and the incommensurate phase, at around η = 23.75 (η* = 118), with orange and blue light triangles, respectively. These phases correspond to slightly different x doping values, which can be estimated by fitting the experimental data of η (η*) as a function of Sr content, x [36]. These results indicate that the crystalline state at a low temperature is not a perfect periodic lattice but an intrinsic incommensurate lattice with expected dynamical lattice dislocations.

3. Discussion

We have investigated the spatial distribution of spin stripes order in La1.71Sr0.29NiO4. The results obtained regarding the temperature dependence of SDW intensity are similar to those reported for the nickelates of different doping levels. Thus, we can assume the observed behavior to be a general characteristic of stripe order. This behavior resembles what has been predicted for incommensurate cuprate stripes at low temperatures, when the freezing of the lattice potentially disturbs the long-range order. The temperature where the stripes peak intensity is maximum coincides with a reorganization of more isotropic and quasi-commensurate SDW puddles at T = T* = 50 K. By decreasing the temperature, T < T*, the SDW shows a nanoscale phase separation with the coexistence of quasi-commensurate (QC) and incommensurate (IC) SDW puddles. These results shed light on the intrinsic inhomogeneous spatial organization of magnetic stripes forming domains organized in micrometric puddles, and their different spatial arrangement transitioning from the so-called ordered high temperature phase (T > 50 K) to the so-called disordered glassy SDW phase (T < 50 K). This inhomogeneous aspect could be a key issue for theoretically understanding the basic mechanisms for the formation of superstripes on particular lattice geometries in the regime of strong interactions.
The inhomogeneous spatial distribution of the spin ordering wave vector can be related to the spatial distribution of chemical doping in [La2−xSrxO2+y] spacer layers, which are intercalated between [CuO2] planes. Therefore, doping can either be controlled by the x substitutions of Sr for La, or by the additional oxygen interstitials. Indeed, it has been shown that in HgBa2CuO4+y [25], the oxygen interstitial ions form atomic stripes in the spacer layer [HgOyBa2O2] between [CuO2] planes, which are anticorrelated with the spatial distribution of CDW order. Moreover, in the isostructural cuprate La2CuO4+y [24], in which oxygen interstitials form large La2CuO4.12 clusters, the CDW order appears in the poorly oxygen-doped domains anticorrelated with oxygen-interstitials-rich domains. In nickelates, the spatial distribution of dopants and spin/charge ordering is an open issue to be addressed by using new experiments with space resolved probes [86,87,88].
Our results show a disordered landscape of the spin stripes made of large striped puddles of about 20 nm, which are significantly larger than the CDW puddles observed in the cuprates [25]. The disordered striped landscape in manganites and cobaltites [89] has been described by the Anisotropic Random Field Ising Model (ARFIM), which predicts that any small amount of random field could stabilize long-range order, leading to a phase diagram with large critical regions corresponding to short-range quasi-2D spin/charge order. Furthermore, the ARFIM description has been applied to the nematic electronic phases in orthorhombic cuprates [90].
Finally, we observe that the spin stripes scenario in nickelates is similar to the spin stripes in isostructural multiband cobaltites. Indeed, the scattering pattern of the spin stripes shown in Figure 1c is similar to the spin order scattering found in cobaltites [91], which also presents nanoscale phase separation [42]. In these two perovskite families, the stripes are the result of the polaron ordering driven by lattice elastic interactions, as it has been proposed for the stripe formation in cuprates using X-ray spectroscopy [21,30].

4. Materials and Methods

Single-crystalline La1.71Sr0.29NiO4 was grown via the floating zone technique. The seed and feed rods were prepared from polycrystalline powder obtained by the solid state reaction of La2O3, SrCO3, and NiO with an excess of NiO. The reaction was performed at 1200 °C for 20 h with intermediate grinding. The rods were densified at 1500 °C for 5 h. All of the syntheses were carried out in air. The scanning micro X-ray diffraction μXRD experiments were carried out at the Coherence Beamline P10 of PETRA III synchrotron in Hamburg. The synchrotron radiation source was a 5 m long undulator (U29). The X-ray beam was monochromatized by a cooled Si(111) double-crystal monochromator with a bandwidth of ΔE/E ∼ 1.4 × 10⁻⁴ in the 8 KeV photon energy range. The collimated coherent X-ray beam was focused, using the beryllium refractive lens (CRL) transfocator, to a size of about 1 μm2 on the sample positioned 1.6 m downstream of the transfocator center. The incident flux on the sample was about 1011 photons/s. The exit window of the heating chamber and He cryostat, as well as the entrance window of the detector flight path, was covered by a 25 μm thick Kapton sheet. The scattered signal was detected using a large horizontal scattering setup with a sample-to-detector distance of 5 m with an evacuated flight path. A PILATUS 300 K detector was used to record the X-rays scattered by the sample. For the measurements, the sample was cooled to the lowest temperature (30 K) and the measurements were performed in a heating cycle. We aligned the crystal to detect the spin ordering satellite of the (100) reflection, which appeared only below the spin ordering temperature, TsDW = 120 K. The spin ordering satellite appeared at qh = 0.71, where the incommensurate stripes wave vector was ε = |1 − qh| = 0.29. The sample scanning was obtained by translating the sample over different areas of about 40 × 80 μm2 in steps of 1 μm in both directions, resulting in more the 3000 diffraction images. Data analysis was performed by using customized and homemade written MATLAB routines [61].

Author Contributions

A.R. and G.C., conceived the project and designed all the experiments; diffraction measurements were performed by A.R. and G.C.; data analysis was conducted by G.C., A.R. and A.B.; the manuscript was written by G.C., A.B. and A.R. All authors have read and agreed to the published version of the manuscript.

Funding

A.R. and G.C. acknowledge the Stephenson Distinguished Visitor Program by DESY. The Superstripes-onlus is gratefully acknowledged for support.

Institutional Review Board Statement

Not applicable.

Informed Consent Statement

Not applicable.

Data Availability Statement

The data presented in this study are available on request from the corresponding author.

Acknowledgments

We are grateful to Christian Schüßler-Langeheine and Christoph Trabant for providing the samples. We thank Michael Sprung, Alexey Zozulya, Nicola Poccia, and Boby Joseph for their experimental help. A.R. and G.C. acknowledge the Stephenson Distinguished Visitor Programme by DESY.

Conflicts of Interest

The authors declare no conflict of interest.

References

  1. Bak, P. Commensurate phases, incommensurate phases and the devil’s staircase. Rep. Prog. Phys. 1982, 45, 587–629. [Google Scholar] [CrossRef]
  2. Shimizu, R.; Sugawara, K.; Kanetani, K.; Iwaya, K.; Sato, T.; Takahashi, T.; Hitosugi, T. Charge-Density wave in Ca-Intercalated bilayer graphene induced by commensurate lattice matching. Phys. Rev. Lett. 2015, 114, 146103. [Google Scholar] [CrossRef] [PubMed]
  3. Woods, C.R.; Britnell, L.; Eckmann, A.; Ma, R.S.; Lu, J.C.; Guo, H.M.; Lin, X.; Yu, G.L.; Cao, Y.; Gorbachev, R.V.; et al. Commensurate–incommensurate transition in graphene on hexagonal boron nitride. Nat. Phys. 2014, 10, 451–456. [Google Scholar] [CrossRef]
  4. Elder, K.R.; Achim, C.V.; Granato, E.; Ying, S.C.; Ala-Nissila, T. Commensurate-incommensurate transition and domain wall dynamics of adsorbed overlayers on a honeycomb substrate. EPL 2016, 116, 56002. [Google Scholar] [CrossRef] [Green Version]
  5. Stephens, P.W.; Heiney, P.A.; Birgeneau, R.J.; Horn, P.M.; Moncton, D.E.; Brown, G.S. High-resolution x-ray-scattering study of the commensurate-incommensurate transition of monolayer Kr on graphite. Phys. Rev. B 1984, 29, 3512–3532. [Google Scholar] [CrossRef]
  6. Hupalo, M.; Schmalian, J.; Tringides, M.C. “devil’s staircase” in Pb/Si(111) ordered phases. Phys. Rev. Lett. 2003, 90, 216106. [Google Scholar] [CrossRef]
  7. Pouget, J.-P. The Peierls instability and charge density wave in one-dimensional electronic conductors. Comptes Rendus Phys. 2016, 17, 332–356. [Google Scholar] [CrossRef] [Green Version]
  8. Isozaki, T.; Fujikawa, T.; Takezoe, H.; Fukuda, A.; Hagiwara, T.; Suzuki, Y.; Kawamura, I. Devil’s staircase formed by competing interactions stabilizing the ferroelectric smectic-C* phase and the antiferroelectric smectic-CA* phase in liquid crystalline binary mixtures. Phys. Rev. B Condens. Matter 1993, 48, 13439–13450. [Google Scholar] [CrossRef]
  9. Lorenz, B.; Wang, Y.-Q.; Chu, C.-W. Ferroelectricity in perovskite HoMnO3 and YMnO3. Phys. Rev. B 2007, 76, 104405. [Google Scholar] [CrossRef] [Green Version]
  10. Murakami, A.; Tsunoda, Y. Atomic concentration waves in Pt-V and Pd-V alloys. Phys. Rev. B 2000, 61, 5998–6002. [Google Scholar] [CrossRef]
  11. Ohwada, K.; Fujii, Y.; Takesue, N.; Isobe, M.; Ueda, Y.; Nakao, H.; Wakabayashi, Y.; Murakami, Y.; Ito, K.; Amemiya, Y.; et al. “Devil’s Staircase”-Type phase transition in NaV2O5 under high pressure. Phys. Rev. Lett. 2001, 87, 086402. [Google Scholar] [CrossRef] [Green Version]
  12. McDermott, D.; Amelang, J.; Reichhardt, C.J.O.; Reichhardt, C. Dynamic regimes for driven colloidal particles on a periodic substrate at commensurate and incommensurate fillings. Phys. Rev. E 2013, 88, 062301. [Google Scholar] [CrossRef] [Green Version]
  13. Machida, K.; Nakano, M. Infinite cascades of Field-Induced spin density wave states in anisotropic two-dimensional conductors. J. Phys. Soc. Jpn. 1990, 59, 4223–4226. [Google Scholar] [CrossRef]
  14. Hubbard, J. Generalized Wigner lattices in one dimension and some applications to tetracyanoquinodimethane (TCNQ) salts. Phys. Rev. B 1978, 17, 494–505. [Google Scholar] [CrossRef]
  15. Katsufuji, T.; Tanabe, T.; Ishikawa, T.; Yamanouchi, S.; Tokura, Y.; Kakeshita, T.; Kajimoto, R.; Yoshizawa, H. Commensurability effect on the charge ordering of La2−xSrxNiO4. Phys. Rev. B 1999, 60, R5097–R5100. [Google Scholar] [CrossRef]
  16. Yoshizawa, H.; Kakeshita, T.; Kajimoto, R.; Tanabe, T.; Katsufuji, T.; Tokura, Y. Stripe order at low temperatures in La2−xSrxNiO4 with 0.289≲x≲0.5. Phys. Rev. B 2000, 61, R854–R857. [Google Scholar] [CrossRef] [Green Version]
  17. Yamanouchi, S.; Taguchi, Y.; Tokura, Y. Dielectric breakdown of the insulating Charge-Ordered state in La2−xSrxNiO4. Phys. Rev. Lett. 1999, 83, 5555–5558. [Google Scholar] [CrossRef]
  18. Zaanen, J.; Littlewood, P.B. Freezing electronic correlations by polaronic instabilities in doped La2NiO4. Phys. Rev. B 1994, 50, 7222–7225. [Google Scholar] [CrossRef]
  19. Raczkowski, M.; Frésard, R.; Oleś, A.M. Microscopic origin of diagonal stripe phases in doped nickelates. Phys. Rev. B 2006, 73, 094429. [Google Scholar] [CrossRef] [Green Version]
  20. Rościszewski, K.; Oleś, A.M. Jahn–Teller mechanism of stripe formation in doped layered La2−xSrxNiO4 nickelates. J. Phys. Condens. Matter 2011, 23, 265601. [Google Scholar] [CrossRef] [Green Version]
  21. Bianconi, A.; Saini, N.L.; Lanzara, A.; Missori, M.; Rossetti, T.; Oyanagi, H.; Yamaguchi, H.; Oka, K.; Ito, T. Determination of the local lattice distortions in the CuO2 plane of La1.85Sr0.15CuO4. Phys. Rev. Lett. 1996, 76, 3412–3415. [Google Scholar] [CrossRef] [Green Version]
  22. Saini, N.L.; Oyanagi, H.; Ito, T.; Scagnoli, V.; Filippi, M.; Agrestini, S.; Campi, G.; Oka, K.; Bianconi, A. Temperature dependent local Cu-O displacements from underdoped to overdoped La-Sr-Cu-O superconductor. Eur. Phys. J. B-Condens. Matter Complex Syst. 2003, 36, 75–80. [Google Scholar] [CrossRef]
  23. Chang, J.; Blackburn, E.; Holmes, A.T.; Christensen, N.B.; Larsen, J.; Mesot, J.; Liang, R.; Bonn, D.A.; Hardy, W.N.; Watenphul, A.; et al. Direct observation of competition between superconductivity and charge density wave order in YBa2Cu3O6.67. Nat. Phys. 2012, 8, 871–876. [Google Scholar] [CrossRef] [Green Version]
  24. Poccia, N.; Ricci, A.; Campi, G.; Fratini, M.; Puri, A.; Di Gioacchino, D.; Marcelli, A.; Reynolds, M.; Burghammer, M.; Saini, N.L.; et al. Optimum inhomogeneity of local lattice distortions in La2CuO4+y. Proc. Natl. Acad. Sci. USA 2012, 109, 15685–15690. [Google Scholar] [CrossRef] [Green Version]
  25. Campi, G.; Bianconi, A.; Poccia, N.; Bianconi, G.; Barba, L.; Arrighetti, G.; Innocenti, D.; Karpinski, J.; Zhigadlo, N.D.; Kazakov, S.M.; et al. Inhomogeneity of charge-density-wave order and quenched disorder in a high-Tc superconductor. Nature 2015, 525, 359–362. [Google Scholar] [CrossRef]
  26. Dagotto, E. Complexity in strongly correlated electronic systems. Science 2005, 309, 257–262. [Google Scholar] [CrossRef] [Green Version]
  27. Zaanen, J. High-temperature superconductivity: The benefit of fractal dirt. Nature 2010, 466, 825–827. [Google Scholar] [CrossRef] [PubMed]
  28. Carlson, E.W. Charge topology in superconductors. Nature 2015, 525, 329–330. [Google Scholar] [CrossRef]
  29. Kugel, K.I.; Rakhmanov, A.L.; Sboychakov, A.O.; Poccia, N.; Bianconi, A. Model for phase separation controlled by doping and the internal chemical pressure in different cuprate superconductors. Phys. Rev. B 2008, 78, 165124. [Google Scholar] [CrossRef] [Green Version]
  30. Innocenti, D.; Ricci, A.; Poccia, N.; Campi, G.; Fratini, M.; Bianconi, A. A model for liquid-striped liquid phase separation in liquids of anisotropic polarons. J. Supercond. Nov. Magn. 2009, 22, 529–533. [Google Scholar] [CrossRef]
  31. Agrestini, S.; Saini, N.L.; Bianconi, G.; Bianconi, A. The strain of CuO2 lattice: The second variable for the phase diagram of cuprate perovskites. J. Phys. A Math. Gen. 2003, 36, 9133–9142. [Google Scholar] [CrossRef] [Green Version]
  32. Poccia, N.; Ricci, A.; Bianconi, A. Misfit strain in superlattices controlling the Electron-lattice interaction via microstrain in active layers. Adv. Condens. Matter Phys. 2010, 2010, 261849-1–261849-7. [Google Scholar] [CrossRef] [Green Version]
  33. Poccia, N.; Ricci, A.; Bianconi, A. Fractal structure favoring superconductivity at high temperatures in a stack of membranes near a strain quantum critical point. J. Supercond. Nov. Magn. 2011, 24, 1195–1200. [Google Scholar] [CrossRef]
  34. Bianconi, A.; Valletta, A.; Perali, A.; Saini, N.L. High Tc superconductivity in a superlattice of quantum stripes. Solid State Commun. 1997, 102, 369–374. [Google Scholar] [CrossRef]
  35. Bianconi, A. Feshbach shape resonance in multiband superconductivity in heterostructures. J. Supercond. 2005, 18, 625–636. [Google Scholar] [CrossRef] [Green Version]
  36. Ulbrich, H.; Braden, M. Neutron scattering studies on stripe phases in non-cuprate materials. Phys. C Supercond. 2012, 481, 31–45. [Google Scholar] [CrossRef] [Green Version]
  37. Schüßler-Langeheine, C.; Schlappa, J.; Tanaka, A.; Hu, Z.; Chang, C.F.; Schierle, E.; Benomar, M.; Ott, H.; Weschke, E.; Kaindl, G.; et al. Spectroscopy of stripe order in La1.8Sr0.2NiO4 using resonant soft X-Ray Diffraction. Phys. Rev. Lett. 2005, 95, 156402. [Google Scholar] [CrossRef] [Green Version]
  38. Schlappa, J.; Chang, C.F.; Schierle, E.; Tanaka, A.; Feyerherm, R.; Hu, Z.; Ott, H.; Friedt, O.; Dudzik, E.; Hung, H.H.; et al. Static and fluctuating stripe order observed by resonant soft X-ray diffraction in La1.8Sr0.2NiO4. arXiv 2009, arXiv:0903.0994v1. [Google Scholar]
  39. Matsuda, M.; Fujita, M.; Yamada, K.; Birgeneau, R.J.; Endoh, Y.; Shirane, G. Electronic phase separation in lightly doped La2−xSrxCuO4. Phys. Rev. B 2002, 65, 134515. [Google Scholar] [CrossRef] [Green Version]
  40. Wakimoto, S.; Ueki, S.; Endoh, Y.; Yamada, K. Systematic study of short-range antiferromagnetic order and the spin-glass state in lightly doped La2−xSrxCuO4. Phys. Rev. B 2000, 62, 3547–3553. [Google Scholar] [CrossRef] [Green Version]
  41. Campi, G.; Ricci, A.; Poccia, N.; Fratini, M.; Bianconi, A. X-Rays Writing/Reading of charge density waves in the CuO2 plane of a simple cuprate superconductor. Condens. Matter 2017, 2, 26. [Google Scholar] [CrossRef] [Green Version]
  42. Drees, Y.; Li, Z.W.; Ricci, A.; Rotter, M.; Schmidt, W.; Lamago, D.; Sobolev, O.; Rütt, U.; Gutowski, O.; Sprung, M.; et al. Hour-glass magnetic excitations induced by nanoscopic phase separation in cobalt oxides. Nat. Commun. 2014, 5, 5731. [Google Scholar] [CrossRef]
  43. Campi, G.; Poccia, N.; Joseph, B.; Bianconi, A.; Mishra, S.; Lee, J.; Roy, S.; Nugroho, A.A.; Buchholz, M.; Braden, M.; et al. Direct visualization of spatial inhomogeneity of spin stripes order in La1.72Sr0.2 NiO4. Condens. Matter 2019, 4, 77. [Google Scholar] [CrossRef] [Green Version]
  44. Jarlborg, T.; Bianconi, A. Fermi surface reconstruction of superoxygenated La2CuO4 superconductors with ordered oxygen interstitials. Phys. Rev. B 2013, 87, 054514. [Google Scholar] [CrossRef] [Green Version]
  45. Campi, G.; Ricci, A.; Poccia, N.; Barba, L.; Arrighetti, G.; Burghammer, M.; Caporale, A.S.; Bianconi, A. Scanning micro-x-ray diffraction unveils the distribution of oxygen chain nanoscale puddles in YBa2Cu3O6.33. Phys. Rev. B 2013, 87, 014517. [Google Scholar] [CrossRef] [Green Version]
  46. Fratini, M.; Poccia, N.; Ricci, A.; Campi, G.; Burghammer, M.; Aeppli, G.; Bianconi, A. Scale-free structural organization of oxygen interstitials in La2CuO4+y. Nature 2010, 466, 841–844. [Google Scholar] [CrossRef] [PubMed] [Green Version]
  47. Bryant, B.; Renner, C.; Tokunaga, Y.; Tokura, Y.; Aeppli, G. Imaging oxygen defects and their motion at a manganite surface. Nat. Commun. 2011, 2, 212. [Google Scholar] [CrossRef] [PubMed]
  48. Ricci, A.; Poccia, N.; Joseph, B.; Innocenti, D.; Campi, G.; Zozulya, A.; Westermeier, F.; Schavkan, A.; Coneri, F.; Bianconi, A.; et al. Direct observation of nanoscale interface phase in the superconducting chalcogenide KxFe2−ySe2 with intrinsic phase separation. Phys. Rev. B 2015, 91, 020503. [Google Scholar] [CrossRef] [Green Version]
  49. Ricci, A.; Joseph, B.; Poccia, N.; Campi, G.; Saini, N.L.; Bianconi, A. Temperature Dependence of √2 × √2 Phase in Superconducting K0.8Fe1.6Se2 Single Crystal. J. Supercond. Nov. Magn. 2014, 27, 1003. [Google Scholar] [CrossRef] [Green Version]
  50. Bauer, E.; Paul, C.; Berger, S.; Majumdar, S.; Michor, H.; Giovannini, M.; Saccone, A.; Bianconi, A. Thermal conductivity of superconducting MgB2. J. Phys. Condens. Matter 2001, 13, L487. [Google Scholar] [CrossRef]
  51. Agrestini, S.; Metallo, C.; Filippi, M.; Simonelli, L.; Campi, G.; Sanipoli, C.; Liarokapis, E.; De Negri, S.; Giovannini, M.; Saccone, A.; et al. Substitution of Sc for Mg in MgB2: Effects on transition temperature and Kohn anomaly. Phys. Rev. B 2004, 70, 134514. [Google Scholar] [CrossRef] [Green Version]
  52. Campi, G.; Cappelluti, E.; Proffen, T.; Qiu, X.; Bozin, E.S.; Billinge, S.J.L.; Agrestini, S.; Saini, N.L.; Bianconi, A. Study of temperature dependent atomic correlations in MgB2. Eur. Phys. J. B-Condens. Matter Complex Syst. 2006, 52, 15–21. [Google Scholar] [CrossRef]
  53. Campi, G.; Ricci, A.; Bianconi, A. Local structure in Mg1−xAlxB2 system by high resolution neutron diffraction. J. Supercond. Nov. Magn. 2012, 25, 1319–1322. [Google Scholar] [CrossRef] [Green Version]
  54. Wadhawan, V.K. Smart Structures: Blurring the Distinction Between the Living and the Nonliving; Oxford University Press: Oxford, UK, 2007; Volume 65. [Google Scholar]
  55. Ciasca, G.; Campi, G.; Battisti, A.; Rea, G.; Rodio, M.; Papi, M.; Pernot, P.; Tenenbaum, A.; Bianconi, A. Continuous thermal collapse of the intrinsically disordered protein tau is driven by its entropic flexible domain. Langmuir 2012, 28, 13405. [Google Scholar] [CrossRef]
  56. Ciasca, G.; Papi, M.; Chiarpotto, M.; Rodio, M.; Campi, G.; Rossi, C.; De Sole, P.; Bianconi, A. Transient state kinetic investigation of ferritin iron release. Appl. Phys. Lett. 2012, 100, 073703. [Google Scholar] [CrossRef]
  57. Bukreeva, I.; Campi, G.; Fratini, M.; Spanò, R.; Bucci, D.; Battaglia, G.; Giove, F.; Bravin, A.; Uccelli, A.; Venturi, C.; et al. Quantitative 3D investigation of Neuronal network in mouse spinal cord model. Sci. Rep. 2017, 7, 41054. [Google Scholar] [CrossRef] [Green Version]
  58. Campi, G.; Fratini, M.; Bukreeva, I.; Ciasca, G.; Burghammer, M.; Brun, F.; Tromba, G.; Mastrogiacomo, M.; Cedola, A. Imaging collagen packing dynamics during mineralization of engineered bone tissue. Acta Biomater. 2015, 23, 309. [Google Scholar] [CrossRef]
  59. Campi, G.; Cristofaro, F.; Pani, G.; Fratini, M.; Pascucci, B.; Corsetto, P.A.; Weinhausen, B.; Cedola, A.; Rizzo, A.M.; Visai, L.; et al. Heterogeneous and self-organizing mineralization of bone matrix promoted by hydroxyapatite nanoparticles. Nanoscale 2017, 9, 17274. [Google Scholar] [CrossRef] [Green Version]
  60. Campi, G.; Di Gioacchino, M.; Poccia, N.; Ricci, A.; Burghammer, M.; Ciasca, G.; Bianconi, A. Nanoscale correlated disorder in out-of-equilibrium myelin ultrastructure. ACS Nano 2017, 12, 729. [Google Scholar] [CrossRef] [Green Version]
  61. Campi, G.; Bianconi, A. Evolution of complexity in out-of-equilibrium systems by time-resolved or space-resolved synchrotron radiation techniques. Condens. Matter 2019, 4, 32. [Google Scholar] [CrossRef] [Green Version]
  62. Ricci, A.; Poccia, N.; Campi, G.; Mishra, S.; Müller, L.; Joseph, B.; Shi, B.; Zozulya, A.; Buchholz, M.; Trabant, C.; et al. Measurement of spin dynamics in a layered nickelate using X-Ray Photon Correlation spectroscopy: Evidence for Intrinsic destabilization of incommensurate stripes at low temperatures. Phys. Rev. Lett. 2021, 127, 057001. [Google Scholar] [CrossRef] [PubMed]
  63. Park, T.; Nussinov, Z.; Hazzard, K.R.A.; Sidorov, V.A.; Balatsky, A.V.; Sarrao, J.L.; Cheong, S.-W.; Hundley, M.F.; Lee, J.-S.; Jia, Q.X.; et al. Novel Dielectric Anomaly in the Hole-Doped La2Cu1−xLixO4 and La2xSrxNiO4 Insulators: Signature of an Electronic Glassy State. Phys. Rev. Lett. 2005, 94, 017002. [Google Scholar] [CrossRef] [Green Version]
  64. Klingeler, R.; Büchner, B.; Cheong, S.W.; Hücker, M. Weak ferromagnetic spin and charge stripe order in La5∕3Sr1∕3NiO4. Phys. Rev. B 2005, 72, 104424. [Google Scholar] [CrossRef] [Green Version]
  65. Filippi, M.; Kundys, B.; Agrestini, S.; Prellier, W.; Oyanagi, H.; Saini, N.L. Charge order, dielectric response, and local structure of La5∕3Sr1∕3NiO4 system. J. Appl. Phys. 2009, 106, 104116. [Google Scholar] [CrossRef] [Green Version]
  66. Liu, X.Q.; Jia, B.W.; Yang, W.Z.; Cheng, J.P.; Chen, X.M. Dielectric relaxation and polaronic hopping in Al-substituted Sm1.5 Sr0.5 NiO4 ceramics. J. Phys. D Appl. Phys. 2010, 43, 495402. [Google Scholar] [CrossRef]
  67. Sippel, P.; Krohns, S.; Thoms, E.; Ruff, E.; Riegg, S.; Kirchhain, H.; Schrettle, F.; Reller, A.; Lunkenheimer, P.; Loidl, A. Dielectric signature of charge order in lanthanum nickelates. Eur. Phys. J. B 2012, 85, 1–8. [Google Scholar] [CrossRef] [Green Version]
  68. Petersen, J.; Bechstedt, F.; Furthmüller, J.; Scolfaro, L.M. Spontaneous symmetry breaking and electronic and dielectric properties in commensurate La7/4Sr1/4CuO4 and La5∕3Sr1∕3NiO4. Phys. Rev. B 2018, 97, 195. [Google Scholar] [CrossRef] [Green Version]
  69. Sboychakov, A.O.; Kugel, K.I.; Rakhmanov, A.L.; Khomskii, D.I. Phase separation in doped systems with spin-state transitions. Phys. Rev. B 2009, 80, 024423. [Google Scholar] [CrossRef]
  70. Kagan, M.Y.; Kugel, K.I.; Rakhmanov, A.L. Electronic phase separation: Recent progress in the old problem. Phys. Rep. 2021, 916, 1. [Google Scholar] [CrossRef]
  71. Kim, H.J.; Haines, C.R.S.; Liu, C.; Chun, S.H.; Kim, K.H.; Yi, H.T.; Cheong, S.W.; Saxena, S.S. Observation of new magnetic ground state in frustrated quantum antiferromagnet spin-liquid system Cs2CuCl4. Low Temp. Phys. 2017, 43, 901. [Google Scholar] [CrossRef] [Green Version]
  72. Chen, Y.; Dahal, A.; Rodriguez-Rivera, J.A.; Xu, G.; Heitmann, T.W.; Dugaev, V.; Ernst, A.; Singh, D.K. Perovskite magnet with quantum mechanical glassiness. Mater. Today Phys. 2020, 12, 100163. [Google Scholar] [CrossRef]
  73. Lekshmi, P.N.; Pillai, S.S.; Suresh, K.G.; Santhosh, P.N.; Varma, M.R. Room temperature relaxor ferroelectricity and spin glass behavior in Sr2FeTiO6 double perovskite. J. Alloy. Compd. 2012, 522, 90–95. [Google Scholar] [CrossRef]
  74. Bak, P.; Bruinsma, R. One-dimensional Ising model and the complete devil’s staircase. Phys. Rev. Lett. 1982, 49, 249. [Google Scholar] [CrossRef]
  75. Burnell, F.J.; Parish, M.M.; Cooper, N.R.; Sondhi, S.L. Devil’s staircases and supersolids in a one-dimensional dipolar Bose gas. Phys. Rev. B 2009, 80, 174519. [Google Scholar] [CrossRef] [Green Version]
  76. Capogrosso-Sansone, B.; Trefzger, C.; Lewenstein, M.; Zoller, P.; Pupillo, G. Quantum phases of cold polar molecules in 2D optical lattices. Phys. Rev. Lett. 2010, 104, 125301. [Google Scholar] [CrossRef] [PubMed] [Green Version]
  77. Pollet, L.; Picon, J.D.; Büchler, H.P.; Troyer, M. Supersolid phase with cold polar molecules on a triangular lattice. Phys. Rev. Lett. 2010, 104, 125302. [Google Scholar] [CrossRef] [Green Version]
  78. Powell, B.J.; McKenzie, R.H. Quantum frustration in organic Mott insulators: From spin liquids to unconventional superconductors. Rep. Prog. Phys. 2011, 74, 056501. [Google Scholar] [CrossRef]
  79. Marić, V.; Giampaolo, S.M.; Franchini, F. Quantum phase transition induced by topological frustration. Commun. Phys. 2020, 3, 220. [Google Scholar] [CrossRef]
  80. Bombin, R.; Boronat, J.; Mazzanti, F. Dipolar Bose supersolid stripes. Phys. Rev. Lett. 2017, 119, 250402. [Google Scholar] [CrossRef] [Green Version]
  81. Macia, A.; Hufnagl, D.; Mazzanti, F.; Boronat, J.; Zillich, R.E. Excitations and stripe phase formation in a two-dimensional dipolar bose gas with tilted polarization. Phys. Rev. Lett. 2012, 109, 235307. [Google Scholar] [CrossRef] [Green Version]
  82. Masella, G.; Angelone, A.; Mezzacapo, F.; Pupillo, G.; Prokof’ev, N.V. Supersolid stripe crystal from finite-range interactions on a lattice. Phys. Rev. Lett. 2019, 123, 045301. [Google Scholar] [CrossRef] [Green Version]
  83. Bianconi, A. Superstripes. Int. J. Mod. Phys. B 2000, 14, 3289. [Google Scholar] [CrossRef]
  84. Bianconi, A.; Innocenti, D.; Campi, G. Superstripes and superconductivity in complex granular matter. J. Supercond. Nov. Magn. 2013, 26, 2585. [Google Scholar] [CrossRef] [Green Version]
  85. Bianconi, A. Shape resonances in superstripes. Nat. Phys. 2013, 9, 536. [Google Scholar] [CrossRef]
  86. Liu, S.; Carlson, E.W.; Dahmen, K.A. Connecting complex electronic pattern formation to critical exponents. Condens. Matter 2021, 6, 39. [Google Scholar] [CrossRef]
  87. Campi, G.; Bianconi, A. Functional Nanoscale Phase Separation and Intertwined Order in Quantum Complex Materials. Condens. Matter 2021, 6, 40. [Google Scholar] [CrossRef]
  88. Poccia, N.; Chorro, M.; Ricci, A.; Xu, W.; Marcelli, A.; Campi, G.; Bianconi, A. Percolative superconductivity in La2CuO4.06 by lattice granularity patterns with scanning micro X-ray absorption near edge structure. Appl. Phys. Lett. 2014, 104, 221903. [Google Scholar] [CrossRef] [Green Version]
  89. Zachar, O.; Zaliznyak, I. Dimensional crossover and charge order in half-doped manganites and cobaltites. Phys. Rev. Lett. 2003, 91, 036401. [Google Scholar] [CrossRef] [Green Version]
  90. Carlson, E.W.; Dahmen, K.A. Using disorder to detect locally ordered electron nematics via hysteresis. Nat. Commun. 2011, 2, 379. [Google Scholar] [CrossRef]
  91. Savici, A.T.; Zaliznyak, I.A.; Gu, G.D.; Erwin, R. Stripeless incommensurate magnetism in strongly correlated oxide La1.5Sr0.5CoO4. Phys. Rev. B 2007, 75, 184443. [Google Scholar] [CrossRef]
Figure 1. (a) Temperature evolution of the integral intensity (black squares) and the incommensurability η = 7/ε (green dots) of the SDW peak, in agreement with the data in [62]. The intensity reaches a maximum value of around 50 K, followed by a decrease indicating the emergence of phase separation with coexisting ordered and disordered domains. We observe that, at the temperature onset of SDW, TSDW, η is close to 23.4 and it increases to reach the long period commensurate order with value 24 at the point where the diffraction intensity is at its maximum level, at approximately T = 50 K. In the surprisingly low temperature range, η moves away from the long period commensurate order value and moves back toward 23.85 with the intensity decrease, thus showing that, at a low temperature, the state with minimum energy is not the quasi-commensurate but the slightly incommensurate state. (b) Pictorial view of spin stripes ordering. (c) The 2D color plot of the SDW peak in the HL space measured by coherent X-ray diffraction. The experimental setup with the source and detector placed at 86 m and 6 m, respectively, ensures = high resolution in the reciprocal space, with the possibility to resolve speckles. (d) Graphic representation of the incommensurate phases between 1/n and 1/m (n = 4 and n = 3) commensurate phases.
Condensedmatter 06 00045 g001
Figure 2. (a) Maps of incommensurability η of the SDW peak measured at T = 30 K in the low temperature phase, LT, at the critical temperature for the transition T = 50 K, and at 70 K in the high temperature phase, HT. The values of each single pixel have been obtained by recording the intensity of the stripes in a specific (x, y) position of the sample. In order to reconstruct the spatial maps, the sample has been scanned over an area of about 40 × 80 μm2 in steps of 2 μm in both directions. The scale bar shown in the upper frame corresponds to 10 μm. (b) Probability density function of η (and η*) calculated at T = 30 K, 50 K, and 70 K.
Condensedmatter 06 00045 g002
Figure 3. The figure shows the intensity of the SDW reflection satellite versus η = 7/ε (η* = 35/ε), measured at different microscale spots (small, filled dots) at 3 fixed temperatures T = 30 K, (blue) T = 50 K (green), and T = 70 K (red), by scanning micro X-ray diffraction. The space averaged values of the XRD profile intensity versus η (η*) are indicated by the large colored spots. The black line and black dots indicate the values of the average intensity of the SDW reflection satellite. measured using standard XRD diffraction in [62] measured with no spatial resolution at different temperatures, as a function of the average incommensurate η value.
Condensedmatter 06 00045 g003
Figure 4. The Devil’s Staircase of quasi-commensurate and incommensurate phases for many LSNO samples at different x values (open circles). The open symbols are obtained from the measured incommensurability as a function of the doping in LSNO samples, as reported in the review paper [36]. The black line is the expected 7/x (where x is the doping) curve. The red and blue triangles represent the high temperature, HT, quasi-commensurate phase at around η = 24 (η* = 120), and the low temperature, LT, incommensurate phase in the range 23.6 < η < 23.9 or 118 < η* < 119.7.
Condensedmatter 06 00045 g004
Publisher’s Note: MDPI stays neutral with regard to jurisdictional claims in published maps and institutional affiliations.

