Article

Infrared Synchrotron Radiation and Its Application to the Analysis of Cultural Heritage

1
Spectroscopy and Imaging Division, Japan Synchrotron Radiation Institute, Hyogo 679-5187, Japan
2
Department of History and Culture, Showa Women’s University, Tokyo 154-8533, Japan
3
Tokyo Metropolitan Industrial Technology Research Institute, Tokyo 135-0064, Japan
4
Department of Home Economics, Iida Women’s Junior College, Nagano 395-8567, Japan
5
Archaeological Institute of Kashihara, Nara 634-0065, Japan
*
Author to whom correspondence should be addressed.
Condens. Matter 2020, 5(2), 28; https://doi.org/10.3390/condmat5020028
Submission received: 29 February 2020 / Revised: 5 April 2020 / Accepted: 6 April 2020 / Published: 9 April 2020

Abstract

:
Infrared synchrotron radiation (IR-SR) is a broad-band light source. Its brilliance is the main advantage for microspectroscopy experiments, when the limited size of the sample often prevents the use of conventional thermal radiation sources. Cultural heritage materials are delicate and valuable; therefore, nondestructive experiments are usually preferred. Nevertheless, sometimes, small pieces can be acquired in the process of preservation and conservation. These samples are analyzed by various experimental techniques and give information about the original material and current condition. In this paper, four attempts to analyze cultural heritage materials are introduced. All these experiments are performed at the microspectroscopy station of IR beamline BL43IR in SPring-8.

1. Introduction

Recently, many infrared (IR) beamlines have been in operation in synchrotron facilities around the world. The IR synchrotron radiation (SR) is emitted from a bending magnet, and it covers a broad spectral range, from near-IR to THz waves. Owing to the high brilliance of the IR-SR, broad-band microspectroscopy is the most frequently used technique at the IR beamlines, and scientific studies in various fields have been conducted. In particular, the low-wavenumber region is important, because commercial IR microspectroscopy equipment covers down to about 700 cm−1 and does not cover the lower range in many cases.
IR-SR has been applied to many fields of study, such as physics, chemistry, biology and others. Cultural heritage is one of the important fields among them. The materials are unique because they differ depending on the fabricated age, place, creator, material and storage conditions. Therefore, a nondestructive measurement is required in many cases. Nevertheless, sometimes, small pieces can be obtained from the cultural heritage for the investigation or in the process of preservation and conservation. The pieces are analyzed by many experimental techniques, to characterize the materials and investigate the conditions. IR analysis is often used for the analysis both in the mid-IR and THz region, using conventional source [1,2,3,4,5,6]. IR-SR provides high spatial resolutions, especially in the mid-IR region, which has played critical roles for the analysis of small fragments of cultural heritage materials [7,8,9]. IR-SR is a broad band light source. The low-wavenumber region is also important, since an absorption band of a metal complex is often observed and gives valuable information.
In this paper, the properties of infrared beamline BL43IR in SPring-8 are described in Section 2. In Section 3, four attempts to analyze cultural heritage materials at BL43IR are presented.

2. Infrared Beamline BL43IR at SPring-8

One of the most commonly used IR broad-band light sources for spectroscopy is a thermal radiation source, such as a globar lamp. IR-SR is another broad-band source for spectroscopy, with a high-brilliance feature. Figure 1 shows the brilliance of IR-SR estimated using BL43IR parameters, and that of the thermal radiation calculated using Planck’s formula at 1500 °C. The definition of brilliance is the number of photons emitted from electrons in a storage ring per second, per angular divergence of the photons, per cross-sectional area of the beam and per bandwidth of 0.1% of the central photon energy. In Figure 1, the brilliance of IR-SR is shown to be more than two orders higher than that of the thermal radiation in the whole spectral range, from near-IR to THz waves [10]. Various kinds of IR sources, other than IR-SR and the thermal radiation source, have been developed recently. The IR free electron laser is one of the high-power sources, and it is often used as an excitation source [11]. Recently, broad-band IR lasers have become popular, such as quantum cascade lasers and IR fiber lasers. They have strong power, and the bandwidth is large enough to be used as sources of spectroscopy [12]. The spectral range, however, is still limited in the mid-IR region. The lowest wavenumber is about 1000 cm−1. In the THz region, time-domain spectroscopy (TDS) is often used. The highest wavenumber of TDS is about 200 cm−1, and there is a gap between the broad-band IR laser. The IR-SR is an important source that covers the gap and also has a high-brilliance feature.
The light at BL43IR covers 100 to 10,000 cm−1, which includes part of THz waves. The lowest wavenumber is limited by the structure of the beam extraction port of BL43IR [13]. Commercial IR microspectroscopy equipment covers down to about 700 cm−1 in many cases. We describe wavenumber region between 700 and 100 cm−1 as low-wavenumber region in this paper. There are three microscope stations; a long-working-distance microscope station, a magneto-optical microscope station and a high-spatial-resolution microscope station [14]. The first and second stations use the same Fourier transform infrared (FTIR) spectrometer, Bruker IFS 120, and the microscopes are custom made by Bunko–Keiki. The working distance of the first station’s microscope is as long as 50 mm. Attachments that need a long working distance, such as a diamond anvil cell for high-pressure experiments, are used at this station. The microscope at the second station is assembled in a superconducting magnet. The maximum magnetic field is ± 14 T. Low-dimensional materials, as well as materials that undergo a phase transition in a magnetic field, are investigated at this station. The importance of the low-wavenumber region for physical research is that the electronic state close to the Fermi level of metallic materials, as well as low-energy-gap materials, can be investigated [15,16]. The magnifications of the objective mirrors in the first and second microscopes are 10 and 8, respectively. The FTIR spectrometer and the microscope at the third station are Bruker VERTEX70 and HYPERION2000 with objective mirror magnifications of 15× and 36×, respectively. All the cultural heritage experiments in this paper were performed at the third station. The beamsplitter in VERTEX70 was KBr and the detector was HYPERION2000 equipped with HgCdTe (MCT) for the mid-IR experiments. For experiments in the low-wavenumber-region, the beamsplitter was Si, and the detector was a Si bolometer.

3. Cultural Heritage Experiments

Many kinds of cultural heritage experiments have been conducted at BL43IR. Among them, four attempts are introduced in this section.

3.1. Iron Oxide in Bengala Pigment

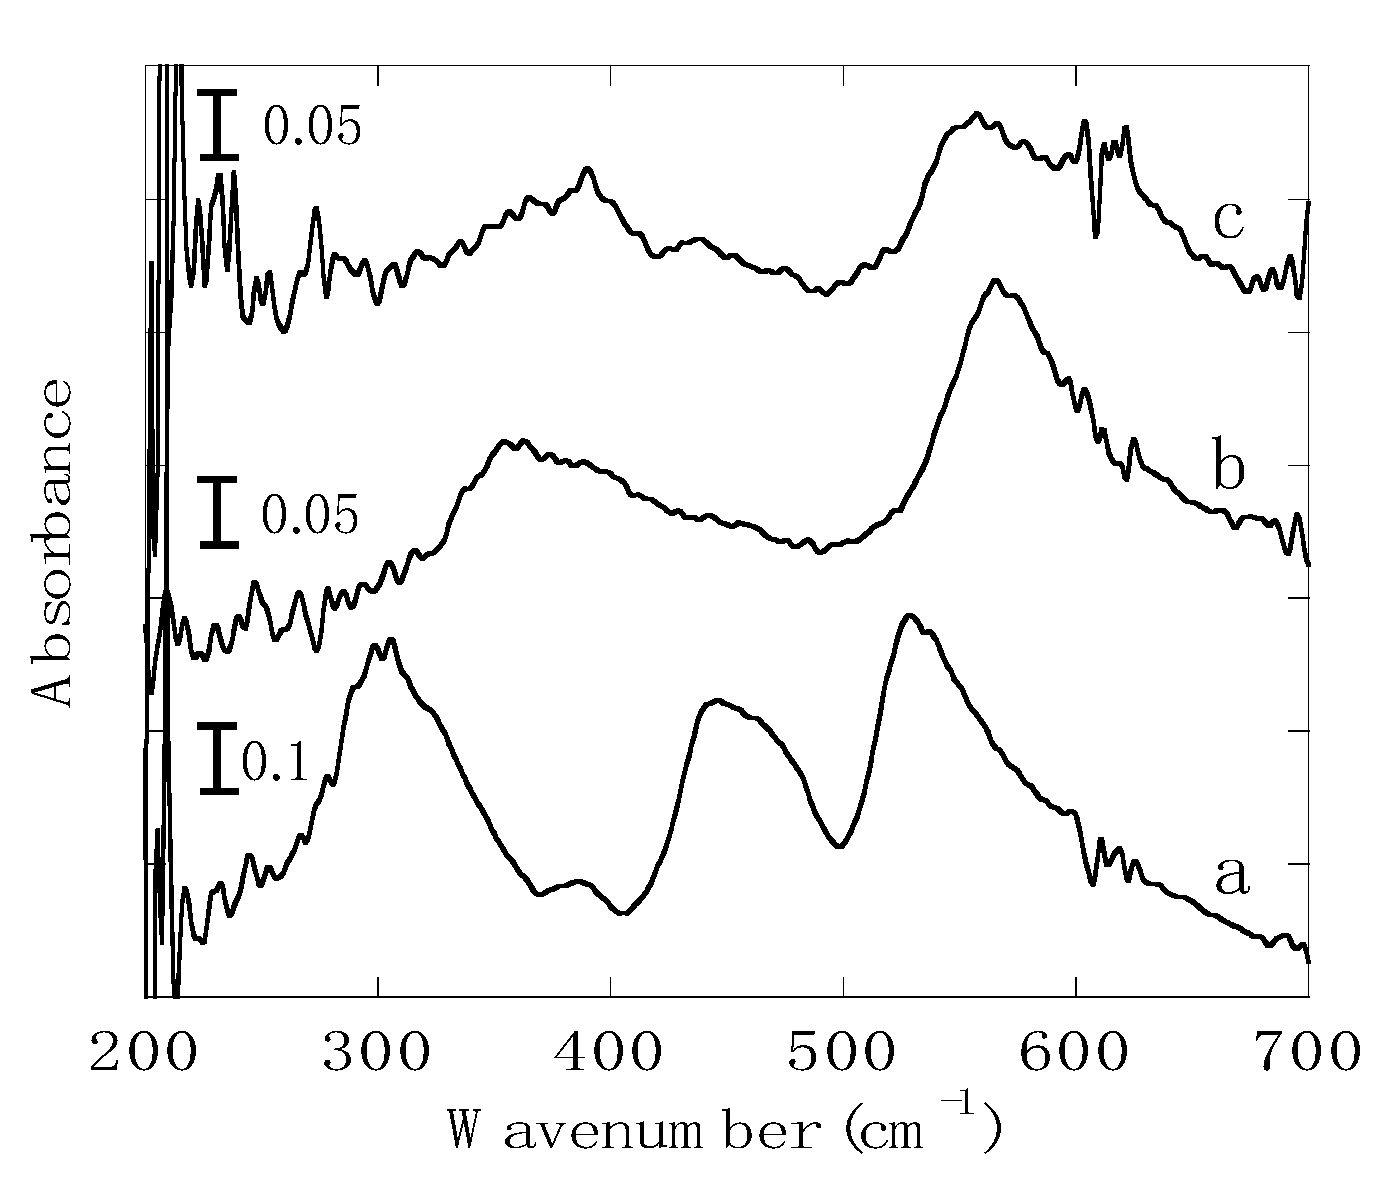
This study was conducted by Dr. Manako Tanaka. Bengala is a kind of red pigment that has been used for arts, crafts and buildings since ancient times. The main components are iron oxides that show different colors, depending on chemical composition: the red α-Fe2O3, blown γ-Fe2O3 and black Fe3O4. There are two shapes of bengala: pipe-shaped and non-pipe-shaped [17]. The former has been mainly found from Jomon and Kofun period archaeological sites in Japan. The pipe-shaped bengala consists of small particles, and the size of the pipe is about 1 μm in diameter and 10–20 m in length. They are considered to be derived from the iron-oxidizing bacterium, Leptothrix ochracea, but details of raw materials and making methods have not been revealed. In this study, the effectiveness of spectra in low-wavenumber region at BL43IR was investigated, to identify the kinds of iron oxide included in pipe-shaped bengala. Spectroscopy in this region is a powerful tool for analyzing metal oxide materials. In this study, powder samples of α-Fe2O3 (Nilaco Corp., Tokyo, Japan), γ-Fe2O3 (JFE Chemical Corporation, Tokyo, Japan) and Fe3O4 (Rare Metallic Co. LTD., Tokyo, Japan) were used as standard iron oxides. Note that α- and γ-Fe2O3 are called hematite, and the crystal structures are rhombohedral and cubic, respectively. Fe3O4 is called magnetite, and it has a cubic inverse spinel structure. The quality of the IR spectrum strongly depends on the external form of the sample. A flat and uniform shape is suitable, and IR-SR is advantageous because the small sample size, which is about 200 μm in diameter, is enough to be measured even in the low-wavenumber region. Moreover, because our final target is minute pipe-shaped bengala sample excavated from an archaeological site, microspectroscopy is indispensable. The powder iron oxide samples were pressed gently, using a hand press (Diamond EX’Press, S.T. Japan, Tokyo, Japan), to form a flat and uniform sample. Figure 2a–c shows absorption spectra of α-Fe2O3, Fe3O4 and γ-Fe2O3, respectively. The wavenumber resolution was 4 cm−1, and the number of scans was 256. In the shaded area, there is absorption from the beamsplitter of the FTIR spectrometer. Optical densities are shown by the bars in Figure 2. Fe-O stretching modes are observed at 302, 450 and 530 cm−1 in (a), 360 and 567cm−1 in (b), and 384 and 557 cm−1 in (c). These three iron oxides can be clearly identified from the absorption spectra. The low-wavenumber-region spectroscopy with IR-SR at BL43IR is expected to be a powerful tool for the analysis of pipe-shaped bengala samples.

3.2. Biomineral Distribution Generated by a Lichen Growing on a Stone Cultural Heritage

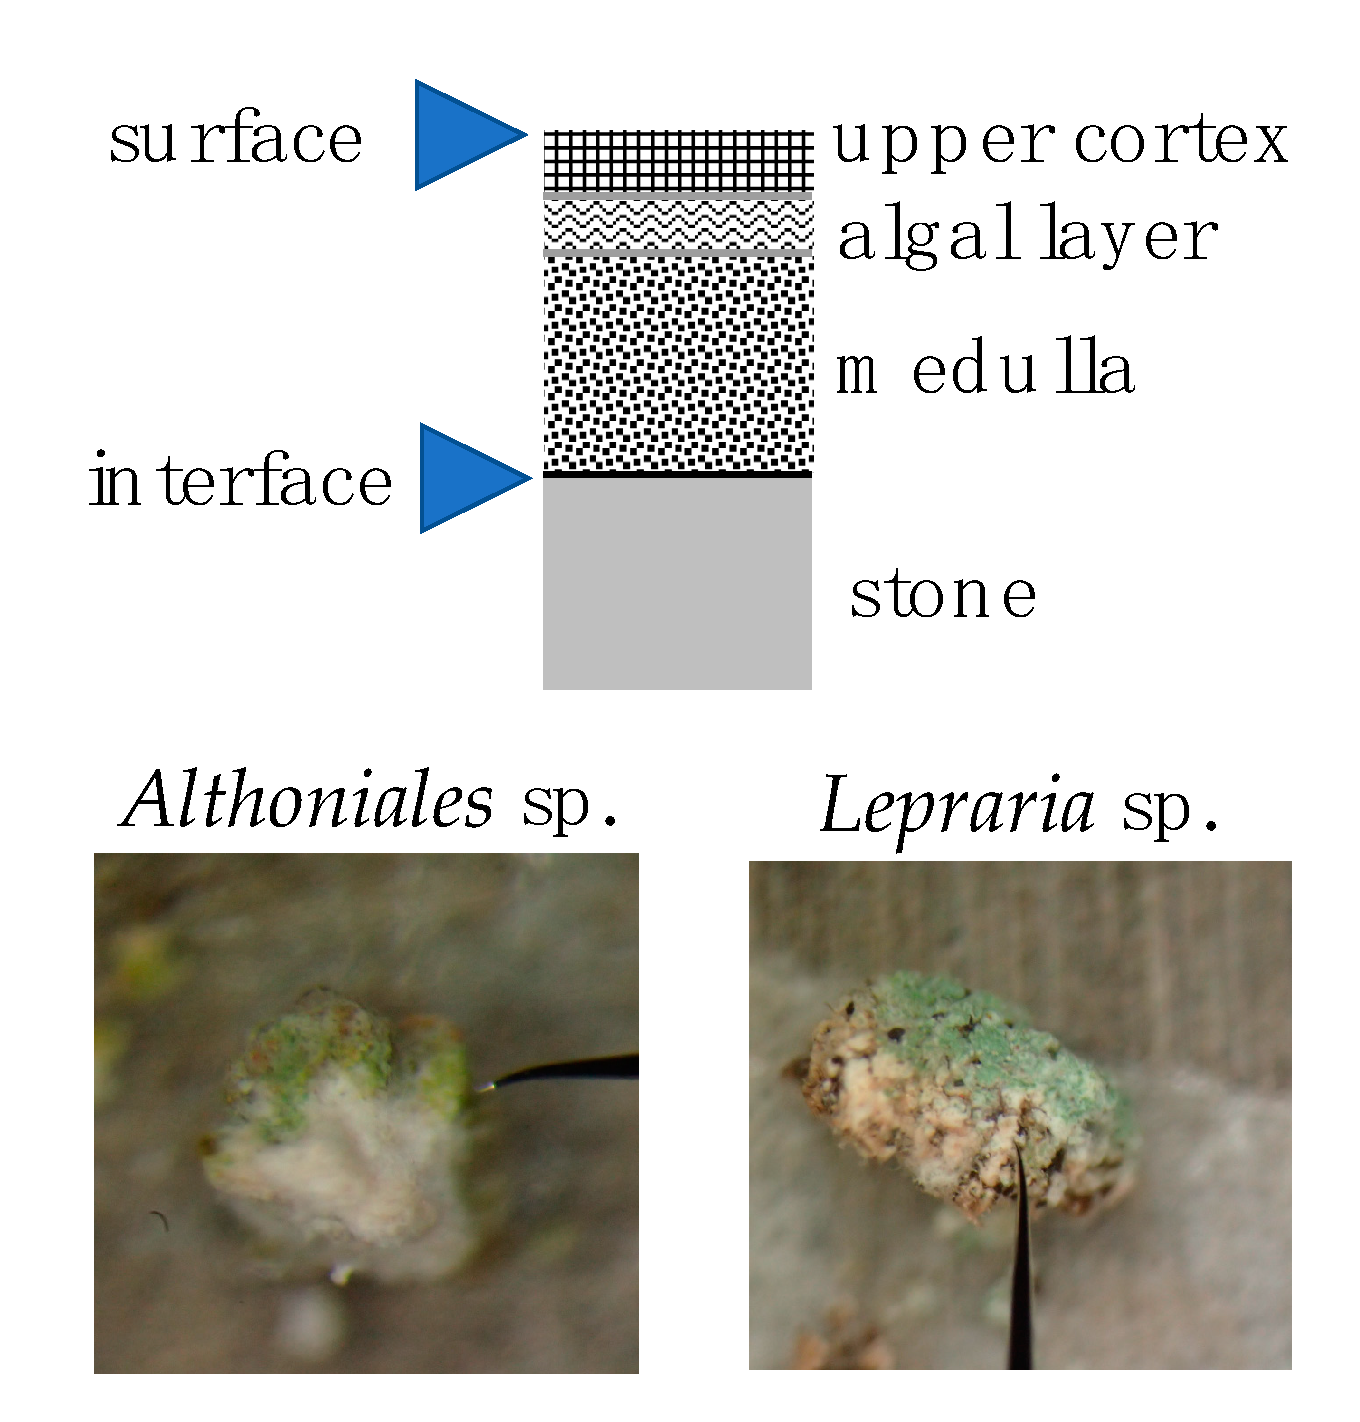
This attempt is to analyze biominerals generated by a lichen growing on a stone cultural heritage. This study was conducted by Dr. Emi Kawasaki. In order to evaluate the risk of stone heritage deterioration, the distribution of biomineral components at the interface between stone and lichen is analyzed. Lichen samples were collected from the Bayon temple in the Angkor archaeological complex in Cambodia. In this study, two kinds of lichen are used, Althoniales sp. (International Nucleotide Sequence Databases (INSD): AB764061) and Lepraria sp. (INSD: AB764076) [18]. The forms of Althoniales sp. and Lepraria sp. are crustose and granular, respectively, and the microscope photographs are shown in Figure 3. The tip of a needle indicates the algal layer in Althoniales sp. and the medulla in Lepraria sp. The illustration in Figure 3 shows the structure of lichen on stone. The algal layer was wrapped in fungal hyphae. The surface and interface between lichen and stone correspond to the top and bottom of the sample, respectively. The lichens were cut in the direction perpendicular to the interface, and a small sample was collected from the cut surface, using a manipulator needle or a knife. The size of the collected sample was as small as about 50 μm to identify each layer, and microspectroscopy using IR-SR played a critical role in this study. The pieces were made thin and flat, using a hand press (Diamond EX’Press, S.T. Japan, Tokyo, Japan). Sample preparation is an important process in the study of cultural heritage materials. Handling a small piece using a micro-sampling manipulator is a typical technique. The thin, flat shape is also important for the reason explained in Section 3.1.
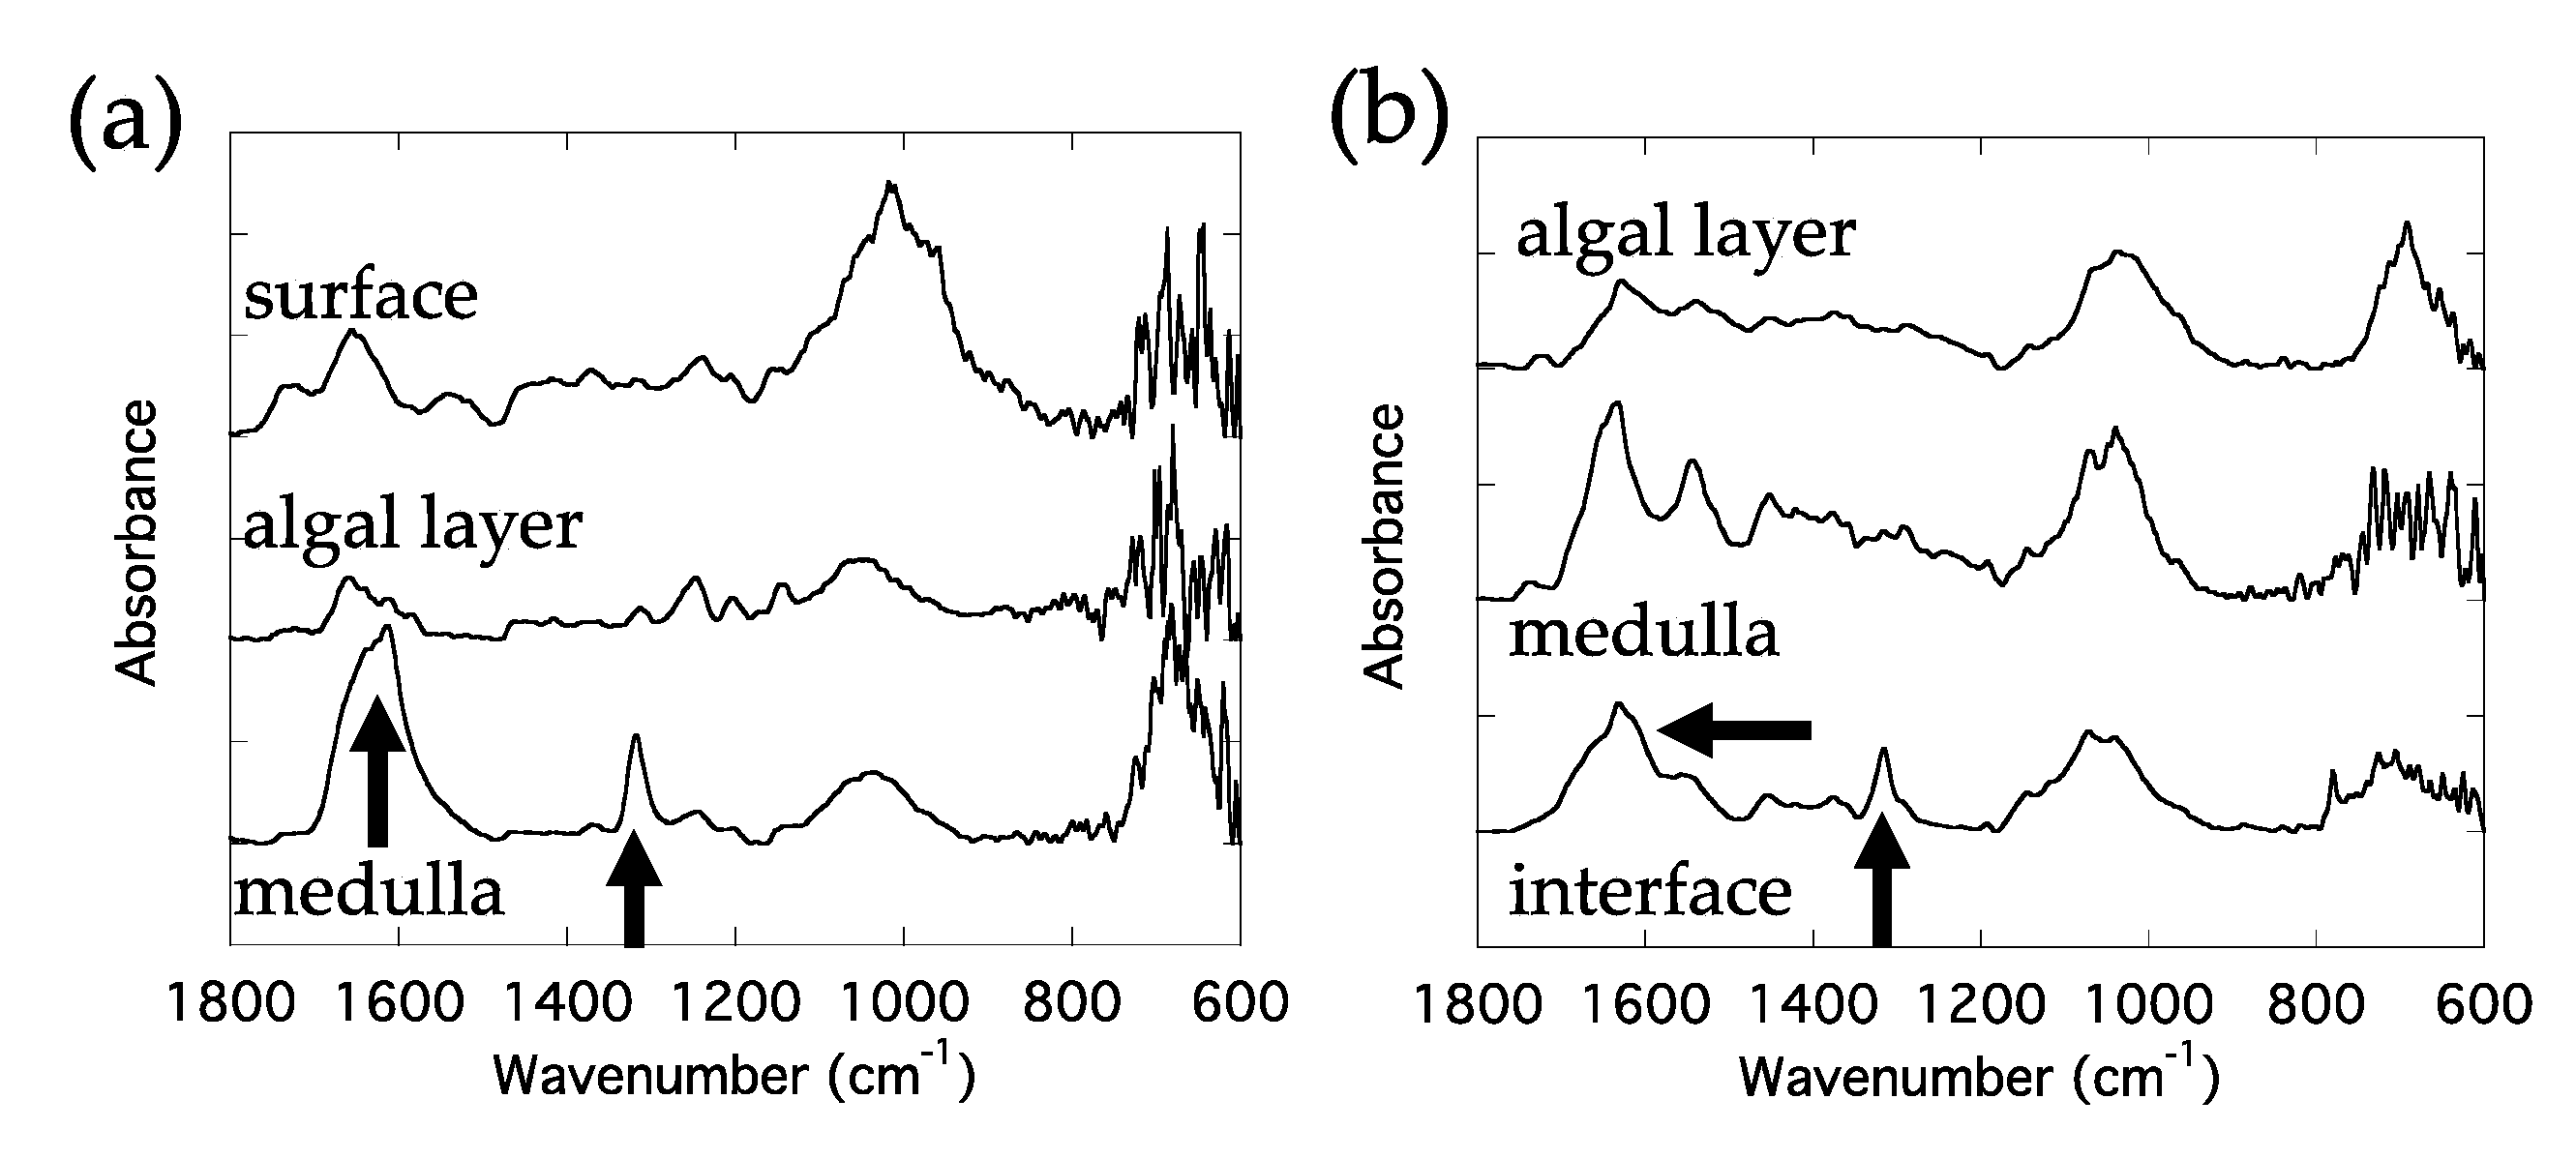
Figure 4a,b shows the absorption spectra of Althoniales sp. and Lepraria sp. The samples are set on a diamond substrate. The wavenumber resolution was 4 cm−1, and the number of scans was 64. An aperture with the size of 10 × 10 μm2 was used in the HYPERION 2000 microscope. Calcium oxalate is one of the typical biomineral components, and it is known to exhibit infrared absorption at about 1610 and 1315 cm−1 [19]. These peaks are observed in the medulla and are shown by the arrows in Figure 4a. In Figure 4b, the peaks are observed at the interface. The result indicates that the distribution of the biomineral component differs depending on the kind of lichen. Calcium oxalate also has a strong band at 274 cm−1, in the low-wavenumber region [20]. Further revelations are expected from the results of low-wavenumber-region experiments.

3.3. Adhesives on Fiber of Traditional Snow Festival Costume in Niino

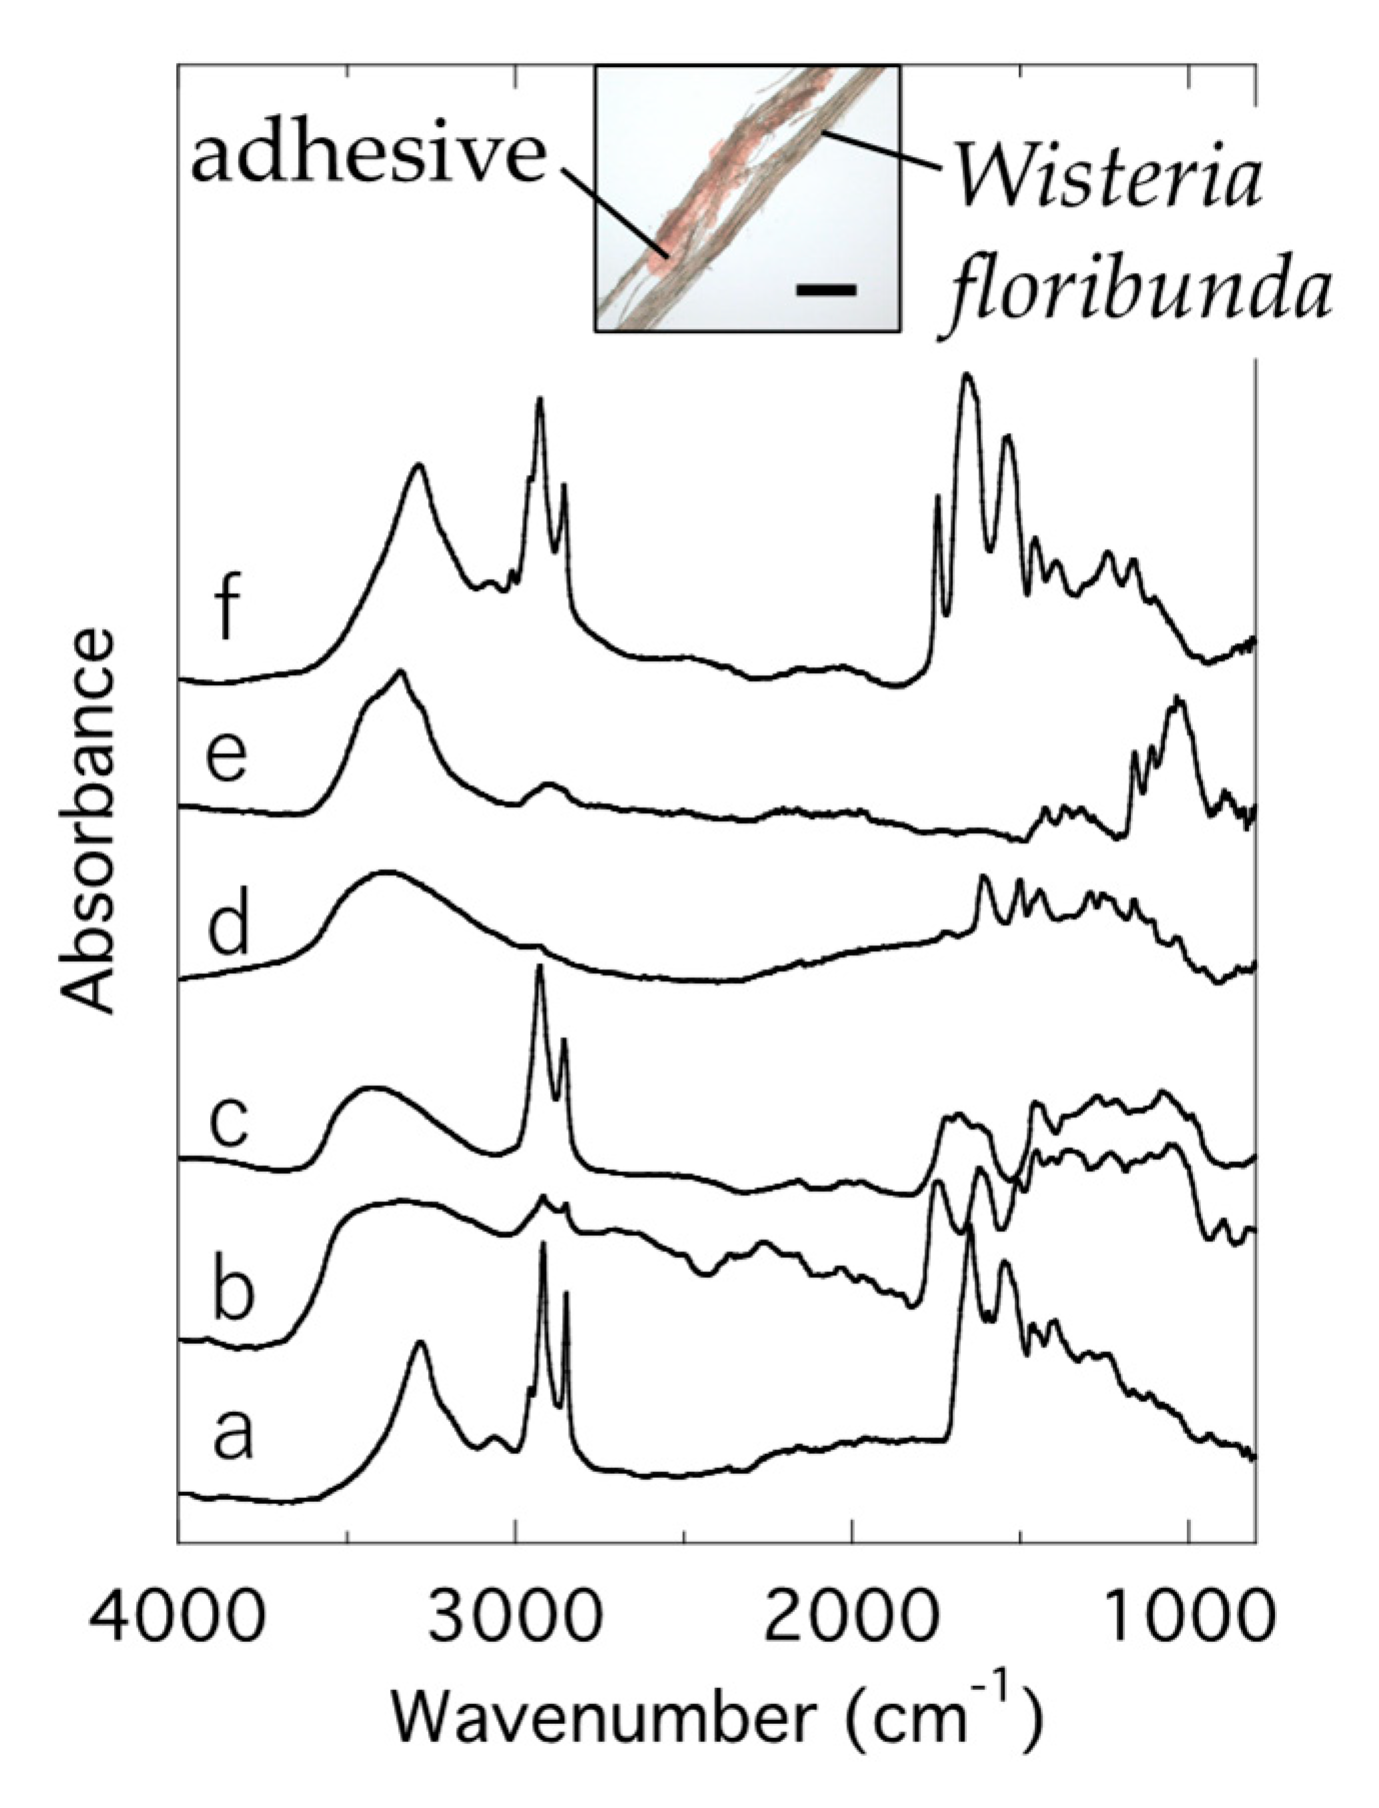
This study was conducted by Mr. Toshiro Semba. There is a project to restore a traditional costume worn in the snow festival in Niino, Nagano prefecture. The festival has a history of more than 500 years. The material is known to be made of Wisteria floribunda fibers. When the fibers are observed under an optical microscope, adhesives can be seen on them. The aim of this study is to determine the adhesive materials. There are several possible candidates, with lacquer being one of them. The other candidates are the materials used when the Wisteria floribunda fibers were colored, such as suou (a kind of dye made from Casaplania sappan) and soy bean. Figure 5 shows the mid-IR absorption spectra. The sample image under the HYPERION 2000 microscope is shown in the inset. The bar in the image corresponds to 300 μm. Only a small piece of sample was obtained from the costume, and microspectroscopy by IR-SR was indispensable. The measurement position was specified by the microscope. Spectra for adhesives at two different positions are shown by curves a and b. Curves c to f show the absorption spectra of lacquer, suou, Wisteria floribunda and soy bean. The bar in the image corresponds to 200 μm. The wavenumber resolution was 4 cm−1, and the number of scans was 500. An aperture with the size of 10 × 10 μm2 was used in the HYPERION 2000 microscope.
From Figure 5, the absorption spectra of the adhesives are seen to be different depending on the position. This means that the adhesives are composed of multiple substances. Some of the absorption peaks in Figure 5 can be assigned as follows. The peak at about 3300–3400 cm−1 corresponds to OH, double bands at 2926 and 2847 cm−1 correspond to CH3 and CH2 symmetric stretching modes, and the bands at 1660 and 1546 cm−1 correspond to amide I and II. For the assignments of other absorption bands, composition analysis may be useful. The lower wavenumber region experiments are also expected to yield information because the main components, such as protein and textile fibers, sometimes have peaks in that region [21]. The overall shape of spectrum a is similar to curve f of soy bean, and curve b is similar to the lacquer curve c, although there are some differences. Comparing spectra b and c, we see that the double band at about 2800 cm−1 is small in c and broad in b. The band at 2600 cm−1 in c splits in b. Spectra a and f are similar, but the band at 1740 cm−1 in f is not present in a. One possible reason for the differences may be the deterioration of samples a and b.

3.4. Organic Materials in Overglaze Layers on Ceramics

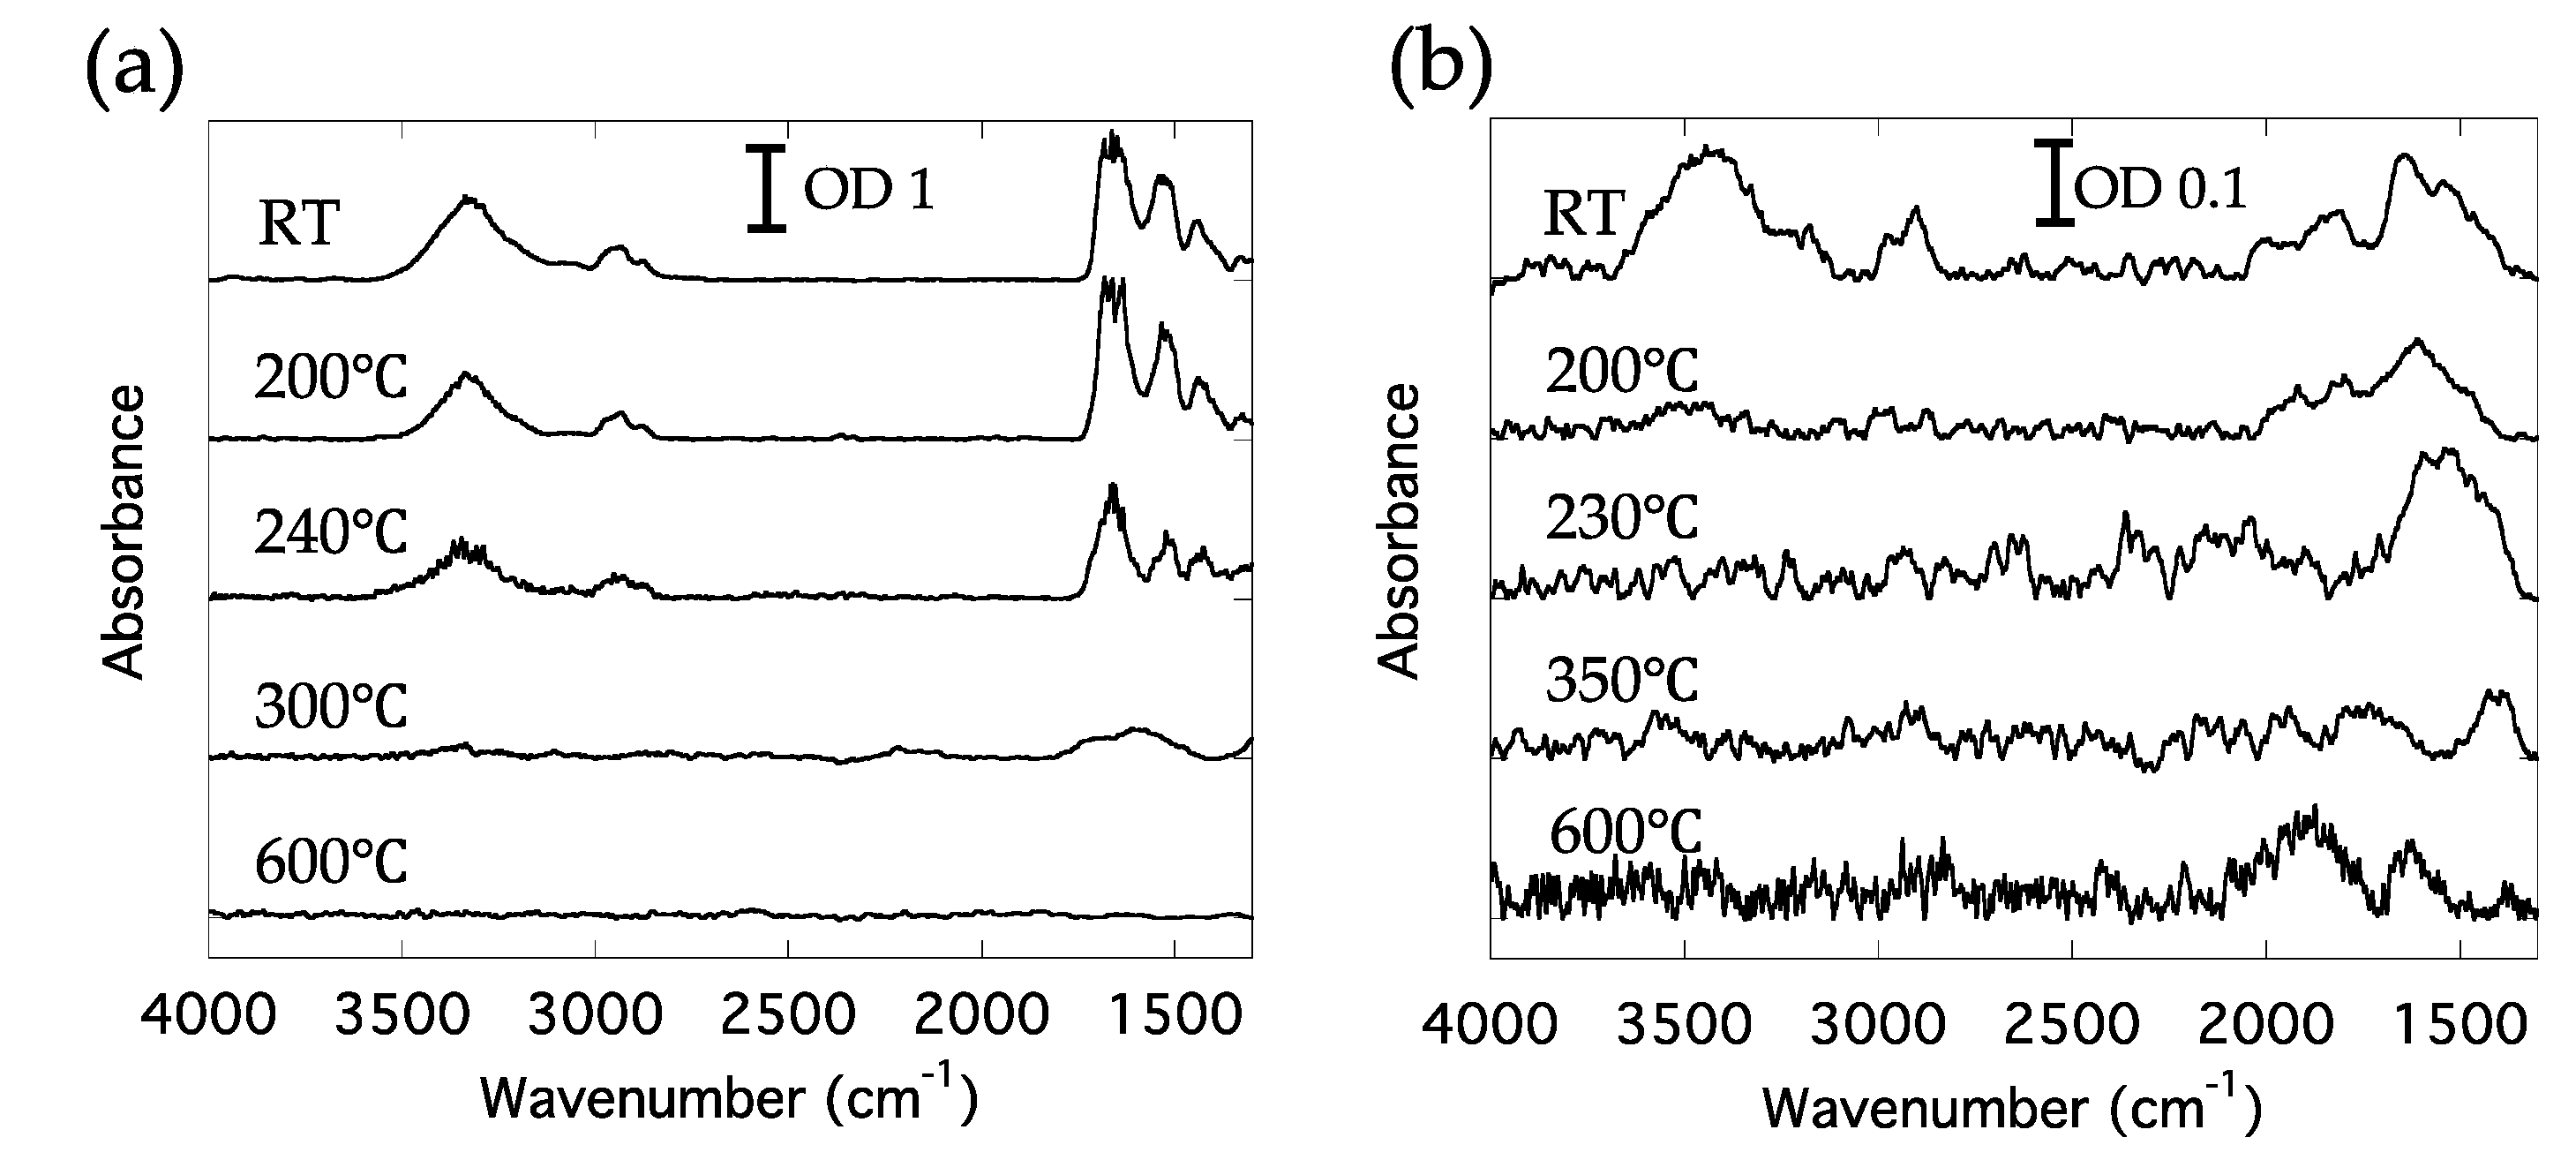
Dr. Tomohiro Higuchi conducted a study to analyze organic residuals in the overglaze layer of Japanese ceramics. When a Japanese ceramic is painted with overglaze, some kind of glue is used before it is fired at a high temperature [22]. After firing, a small amount of organic materials has been found to remain in the overglaze layer. The residual is thought to originate from the glue [23]. It is also predicted that the organic materials form compounds with metallic elements included in glass frit. These remains are expected to be observed in mid-IR and the low-wavenumber region. The final purpose of this study is to identify the glue from the residual organic materials observed in the fired ceramics. Information about the kind of glue is expected to provide knowledge about the place where the ceramic vessels were made. In this study, simulated samples were prepared, to observe the change in the state of the glue during the firing process. Two kinds of commonly used glue, nikawa (Kissho, granular animal glue) and funori (Isekyu, red seaweed glue) were used. They were dissolved in water at 10% m/m and 2% m/m, in mass concentration, and 1 mL of solution was mixed with 1 g of colored overglaze that contains Pb-included frits and iron oxides. The mixed colored overglaze was applied to a CaF2 substrate. Absorption spectra of the sample were measured during heating to 600 °C, on a temperature-controlled stage (LINKAM 10036L). The heating rate was 100 °C/h, and the atmosphere was air. The wavenumber resolution was 4 cm−1, and the number of scans was 64. Figure 6a,b shows the absorption spectra of the nikawa- and funori-containing samples, respectively. The observed temperatures were room temperature, 200, 240, 300 and 600 °C in Figure 6a; and room temperature, 200, 230, 350 and 600 °C in Figure 6b. The optical densities (OD) are shown in the figures by the bars. The ODs are different between Figure 6a,b because the sample thicknesses where the spectra were measured were different. At a high temperature, such as 600 °C, the thermal radiation from the sample reaches the detector and increases the background noise. The spectrum at 600 °C in Figure 6b was measured under such conditions.
The absorption spectrum observed at room temperature (RT) in Figure 6a has bands at 3300, 2900 and 1800–1500 cm−1. These bands are assigned to a protein included in nikawa. The structures at 1800–1500 cm−1 are amide I and II bands. The RT spectrum in Figure 6b has absorption bands at 3300, 2900 and 1750–1400 cm−1, and they are assigned to a polysaccharide included in funori. In Figure 6a, the shape of the bands observed at RT does not change much, and only the intensities decrease up to 300 °C. At 600 °C, there is no obvious band. In Figure 6b, the absorption band intensity decreases and vanishes once at 230 °C. At 600 °C, a different absorption band appears at 2100–1000 cm−1. From Figure 6, the temperature dependence is found to differ depending on the kind of glue. The original organic component of the glue may be burned out at between 200 and 300 °C. Then, in the sample of Figure 6b, the transformed organic materials appear on the substrate at 600 °C, but not in the case of Figure 6a. In the overglaze material, metal elements were included, and the IR experiments in the low-wavenumber region are expected to yield information about the metal composition.

4. Summary

IR-SR has two important features, a high brilliance and a broad-band coverage. The brilliance was calculated by using the parameters of infrared beamline BL43IR in SPring-8 and was shown to be more than two orders of magnitude higher than that of a thermal radiation source. Compared with other IR light sources, low-wavenumber region between 700 and 200 cm−1 is a valuable region for IR-SR. BL43IR is dedicated to IR microspectroscopy and has three stations with different characteristics. Four attempts to analyze cultural heritage materials were introduced: iron oxides in bengala red pigment, biomineral distribution caused by lichen growing on a stone cultural heritage, adhesives of fibers of a traditional snow festival costume and organic materials in overglaze layers on ceramics. All these experiments were performed at the high-spatial-resolution microspectroscopy station, at BL43IR. In the analysis of cultural heritage materials, IR-SR can play an important role, especially in the low-wavenumber region.

Author Contributions

Y.I. wrote the manuscript; M.T., T.M., T.H., M.T., T.S., E.K. and M.O. conducted the experiments. All authors have read and agreed to the published version of the manuscript.

Funding

This research was partially supported by JPSJ KAKENHI grant numbers JP16K16339 and JP16K01188.

Acknowledgments

The authors thank Kazami Mizumoto (Tokyo University of the Arts), Toshiyasu Shinmen and Shuji Ninomiya (Tokyo Gakugei University) for their collaboration. Synchrotron radiation measurements were performed at SPring-8, with the approval of JASRI (2016B1795, 2017B1758, 2016A1696, 2016B1809, 2018A1330, 2017B1768, 2013B1232, 2016B1804, 2016B1808, 2014A1203, 2014A1827, 2017B1765, 2016B1803, 2016B1190, 2016A1380).

Conflicts of Interest

The authors declare no conflict of interest.

References

  1. Fukunaga, K.; Sekine, N.; Hosako, I.; Oda, N.; Yoneyama, H.; Sudou, T. Real0time terahertz imaging for art conservation science. J. Eur. Opt. Soc. Rapid 2008, 3, 08027. [Google Scholar] [CrossRef] [Green Version]
  2. Gallerano, G.P.; Doria, A.; Giovenale, E.; Messina, G.; Petralia, A.; Spassovsky, I.; Fukunaga, K.; Hosako, I. THz-ARTE: Non-Invasive Diagnostics for Art Conservation. In Proceedings of the 2008 33rd International Conference on Infrared, Millimeter and Terahertz Waves, Pasadena, CA, USA, 15–19 September 2008; pp. 1–2. [Google Scholar]
  3. Manceau, J.-M.; Nevin, A.; Fotakis, C.; Tzortzakis, S. Terahertz time domain spectroscopy for the analysis of cultural heritage related materials. Appl. Phys. B 2008, 90, 365–368. [Google Scholar] [CrossRef]
  4. Jackson, J.B.; Mourou, M.; Whitaker, J.F.; Duing, I.N.; Williamson, S.L.; Menu, M.; Mourou, G.A. Terahertz imaging for non-destructive evaluation of mural paitings. Opt. Commun. 2008, 281, 527–532. [Google Scholar] [CrossRef]
  5. Fukunaga, K. Terahertz spectroscopy for non-invasive analysis of cultural properties. J. Natl. Inst. Inf. Commun. Technol. 2009, 55, 67–71. [Google Scholar]
  6. van Loon, A.; Gambardella, A.A.; Gonalez, V.; Cotte, M.; Nolf, W.; Keune, K.; Leonhardt, E.; Groot, S.; Gaibor, A.N.P.; Vandivere, A. Out of the blue: Vermeer’s use of ultramarine in girl with a pearl earring. Herit. Sci. 2020, 8, 25. [Google Scholar] [CrossRef] [Green Version]
  7. Pronti, L.; Romani, M.; Vivian, G.; Stani, C.; Gioia, P.; Cestelli, M. Advanced methods for the analysis of Roman wall paintings: Elemental and molecular detection by means of synchrotron RT-IR and SEM icro-imaging spectroscopy. Rend. Lincei. Sci. Fis. Naurali 2020, 1–9. [Google Scholar] [CrossRef]
  8. Salvado, N.; Buti, S.; Tobin, M.J.; Pantos, E.; John, A.; Prag, N.W.; Pradell, T. Advantages of the use of SR-FT-IR microspectroscopy: Applications to cultural heritage. Anal. Chem. 2005, 77, 3444–3451. [Google Scholar] [CrossRef] [PubMed]
  9. Cinque, G.; Marcelli, A. Synchrotron radiation inraRed microspectroscopy and imaging in the characterization of archaeological materials and cultural heritage artefacts. EMU Notes Mineral. 2019, 20, 411–444. [Google Scholar]
  10. Ikemoto, Y.; Ishikawa, M.; Nakashima, S.; Okamura, H.; Haruyama, Y.; Matsui, S.; Moriwaki, T.; Kinoshita, T. Development of scattering near-field optical microspectroscopy apparatus using an infrared synchrotron radiation sources. Opt. Commun. 2012, 285, 2212–2217. [Google Scholar] [CrossRef]
  11. Torgasin, K.; Morita, K.; Zne, H.; Masuda, K.; Bakr, M.; Nagasaki, K.; Kii, T.; Ohgaki, H. Study on anormalous photoemission of LaB6 at high temperatures. Phys. Scr. 2019, 94, 7. [Google Scholar] [CrossRef]
  12. Bechtel, H.A.; Muller, E.A.; Olmon, R.L.; Martin, M.C.; Raschke, M.B. Ultrabroadband infrared nanospectroscopic imaging. PNAS 2014, 111, 7191–7196. [Google Scholar] [CrossRef] [PubMed] [Green Version]
  13. Kimura, H.; Moriwaki, T.; Takahashi, S.; Aoyagi, H.; Matsushita, T.; Ishizawa, Y.; Masaki, M.; Oishi, M.; Ohkuma, H.; Namba, T.; et al. Infrared beamline BL43IR at SPring-8:: design and commissioning. Nucl. Instrum. Methods Phys. Res. A 2001, 467–468, 441–444. [Google Scholar] [CrossRef]
  14. Moriwaki, T.; Ikemoto, Y. BL43IR at SPring-8. Infrared Phys. Technol. 2008, 51, 400–403. [Google Scholar] [CrossRef]
  15. Kobayashi, R.; Hashimoto, K.; Yoneyama, N.; Yoshimi, K.; Motoyama, Y.; Iguchi, S.; Ikemoto, Y.; Moriwaki, T.; Taniguchi, H.; Sasaki, T. Dimer-Mott and charge-ordered insulating states in the quasi-one-dimensional organic conducting δ′p- and δ′c-(BPDT-TTF)2ICl2. Phys. Rev. B 2017, 96, 115112. [Google Scholar] [CrossRef] [Green Version]
  16. Okamura, H.; Shoji, K.; Miyata, K.; Sugawara, H.; Moriwaki, T.; Ikemoto, Y. Pressure suppression of spin-density wave gap in the optical conductivity of SrFe2As2. J. Phys. Soc. Jpn. 2013, 82, 074720. [Google Scholar] [CrossRef] [Green Version]
  17. Kamijoh, T. Red Pigments used from Jomon Period to Kofun Period. J. Jpn. Soc. Colour Mater. 2004, 77, 86–90. [Google Scholar] [CrossRef]
  18. Kawasaki, E.; Matsui, T.; Yamamoto, Y.; Hara, K. The documentation method using lichens growing on stoneworks in order to protect cultural heritage stone monuments—The case of Angkor monuments of Cambodia. Lichenology 2013, 11, 39–52. [Google Scholar]
  19. Parsons, J.G.; Dokken, K.M.; McClure, J.; Gardea-Torresdey, J.L. FTIR, XA, and XRD study of cadmium complexes with l-crysteine. Phlyhedron 2013, 56, 237–242. [Google Scholar] [CrossRef]
  20. Pucetaite, M.; Tamosaityte, S.; Engdahl, A.; Ceponkus, J.; Sablinskas, V.; Uvdal, P. Microspectroscopic infrared specular reflection chemical imaging of multi-component urinary stones: MIR vs. FIR. Cent. Eur. J. Chem. 2014, 12, 44–52. [Google Scholar] [CrossRef] [Green Version]
  21. Yanchen, H.; Shengjie, L.; Zeming, Q.; Xin, C. Application of far-infrared spectroscopy to the structural identification of protein materials. Phys. Chem. Chem. Phys. 2018, 18, 11643–11648. [Google Scholar]
  22. Ohnishi, S. Chapter 6 Techniques of Overglaze. In Traditional Techniques of Ceramics Art, 1st ed.; Rikogakusya Publishing Co., Ltd.: Tokyo, Japan, 2001; pp. 231–278. [Google Scholar]
  23. Higuchi, T.; Ninomiya, S. Attempt to Analyze the Organic Residuals in Overglaze Layers on Ceramics. In Proceedings of the 31st Annual Meeting of the Japan Society for Scientific Studies on Cultural Property, Nara, Japan, 5 July 2014; pp. 258–259. [Google Scholar]
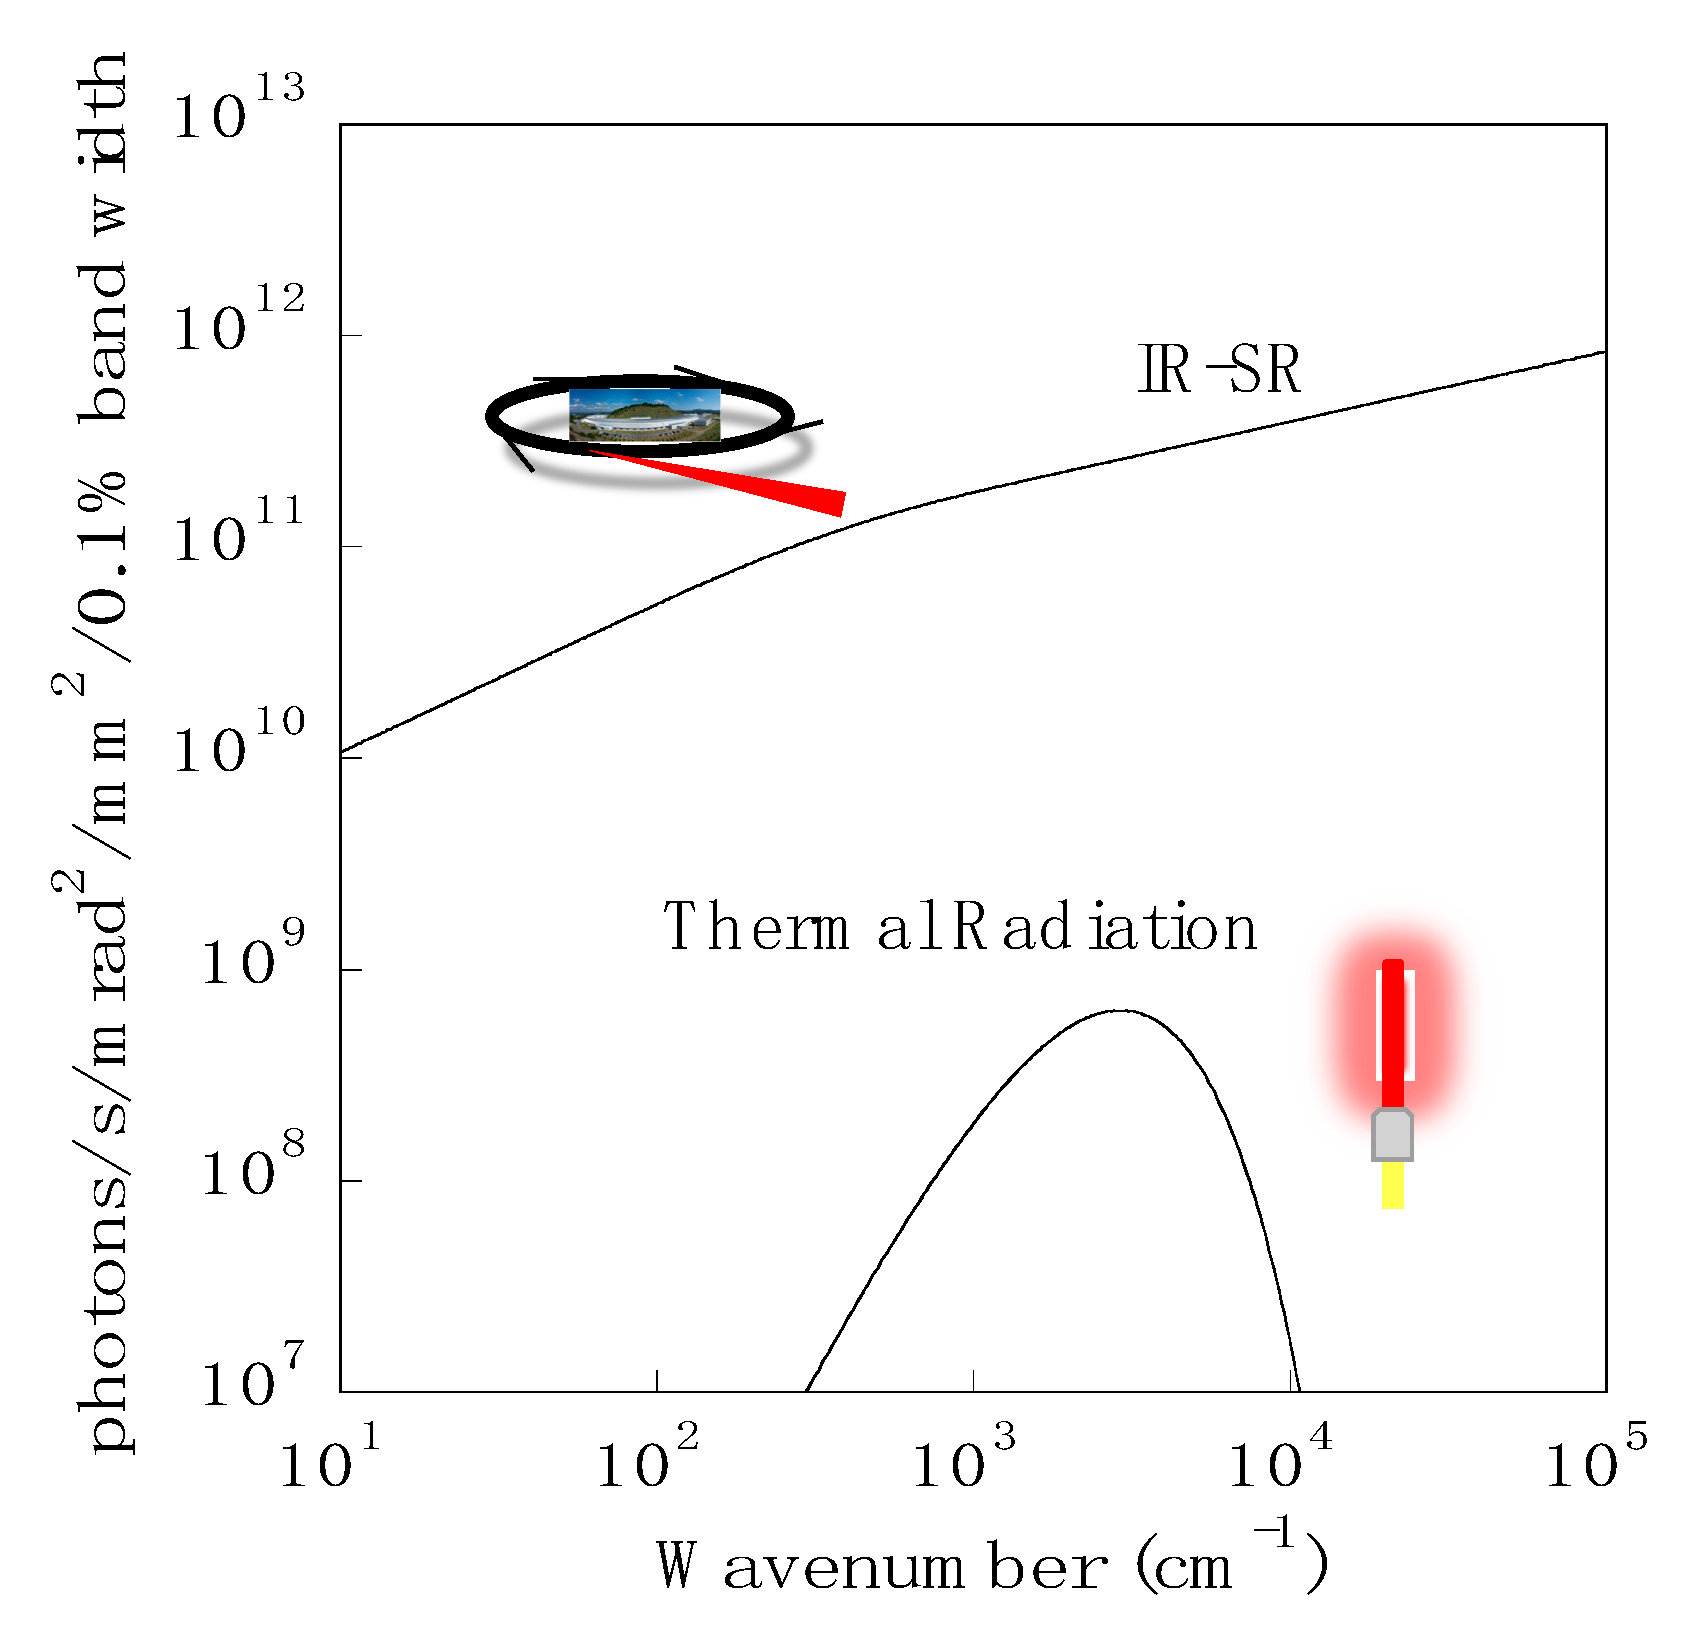
Figure 1. Brilliance of IR-SR and thermal radiation sources.
Condensedmatter 05 00028 g001
Figure 2. THz absorption spectra of (a) α-Fe2O3, (b) Fe3O4 and (c) γ-Fe2O3.
Condensedmatter 05 00028 g002
Figure 3. Schematic illustration of the structure of lichen on stone (top). Microscope photographs of Althoniales sp. and Lepraria sp. (bottom).
Condensedmatter 05 00028 g003
Figure 4. Absorption spectra of (a) Althoniales sp. and (b) Lepraria sp.
Condensedmatter 05 00028 g004
Figure 5. Absorption spectra of the adhesives and the candidate materials. Spectra of a and b are of adhesive samples. Spectra c to f show those of lacquer, suou (a kind of dye), Wisteria floribunda fibers and soy bean. Inset is the sample image under HYPERION 2000 microscope.
Condensedmatter 05 00028 g005
Figure 6. Absorption spectra from samples containing (a) nikawa and (b) funori.
Condensedmatter 05 00028 g006