Abstract
Out-of-equilibrium phenomena are attracting high interest in physics, materials science, chemistry and life sciences. In this state, the study of structural fluctuations at different length scales in time and space are necessary to achieve significant advances in the understanding of the structure-functionality relationship. The visualization of patterns arising from spatiotemporal fluctuations is nowadays possible thanks to new advances in X-ray instrumentation development that combine high-resolution both in space and in time. We present novel experimental approaches using high brilliance synchrotron radiation sources, fast detectors and focusing optics, joint with advanced data analysis based on automated statistical, mathematical and imaging processing tools. This approach has been used to investigate structural fluctuations in out-of-equilibrium systems in the novel field of inhomogeneous quantum complex matter at the crossing point of technology, physics and biology. In particular, we discuss how nanoscale complexity controls the emergence of high-temperature superconductivity (HTS), myelin functionality and formation of hybrid organic-inorganic supramolecular assembly. The emergent complex geometries, opening novel venues to quantum technology and to the development of quantum physics of living systems, are discussed.
1. Introduction
The structural fluctuations at the nanoscale and mesoscale play a fundamental role in the functionality of complex materials [1,2,3,4,5,6,7,8,9,10,11,12,13,14,15,16,17,18,19,20,21,22]. The monitoring and understanding of the spatio-temporal dynamics require highly spatially resolved probes. Although standard momentum-space probes such as X-ray diffraction (XRD), angle-resolved photoelectron spectroscopy and neutron scattering are excellent for characterizing the “average” order and coherent excitations, they are highly ambiguous when different phases coexist and evolve in space and time. To overcome this limitation, local probes such as X-ray spectroscopy and pair distribution function analysis from high resolution X-ray and neutron diffraction have been used to probe local fluctuations and disorder in complex materials showing nanoscale phase separation [23,24,25,26,27,28].
Nowadays, thanks to the advanced features of the latest generation synchrotron sources and new X-ray optics [29,30,31,32,33,34], new techniques have been developed for this purpose. Scanning X-ray (sub)micro-diffraction (SμXRD) and spectroscopy, e.g., scanning micro X-ray absorption (SμXAS) and scanning micro X-ray fluorescence (SμXRF), constitute an optimal approach [35] to investigate structure fluctuations in several systems like perovskite materials such as La2CuO4+y [36,37,38,39,40,41,42,43], YBa2Cu3O6.5 [44,45,46,47], K0.8Fe1.6Se2 [48,49,50]. Electronic fluctuations such as short-range Charge Density Waves (CDW) have been detected by resonant X-ray scattering [51,52,53,54,55,56] probing the average structure and by SμXRD [40,57,58,59,60] probing the spatial distribution of electronic nanometric patches. Scanning nano-probes with synchrotron radiation are now a hot topic in the investigation of structural fluctuations in biological systems [61,62,63,64].
In addition, fast detectors allow the in situ studies to monitor either physical or chemical modifications during data collection; for example, the few milliseconds readout time of the CMOS camera can be used for time-resolved measurements in different processes showing self-organization and pattern formation at the nanoscale [65,66,67,68,69]. Moreover, they allow us to prevent radiation damage on biological samples providing new key information [70,71,72].
In this work, we present some relevant results showing the relationship between new geometries developing at nano/mesoscale and the emerging macroscopic properties in complex and heterogeneous systems in different fields opening new fundaments in natural sciences [73,74,75,76,77,78,79,80,81,82,83,84].
2. Results
2.1. High Tc Superconductivity: Scale-Free Oxygen Distribution in La2CuO4+y
High-temperature superconducting perovskites are heterostructures at the atomic limit composed of parallel planes of active layers (copper oxide in the case of cuprates) sandwiched between rock-salt layers. The copper atoms lie on the plane where the charge is carried by “holes” compensated by dopants in the spacer layers. It is now accepted that the interplay of defects, charge, spin and orbitals play a fundamental role in copper-oxide-based superconductors, belonging to the wide family of quantum complex materials [1,2,3,4,5,6,7,8,9,10,11,12,13,14,15,16,17,18,19,20,21,22]. Early X-ray spectroscopy measurements XANES and EXAFS of copper oxide compounds revealed nanoscale local lattice fluctuations giving tilts and bond disproportionated CuO4 plaquettes [25] with the {3d9L} – 2d10L2} (where L = O(2p5) and L2 = O(2p4)) many body electronic configurations, associated with doped formal Cu3+ impurities, which are formed in the charge transfer correlation gap between the {3d9} and {3d10L} in undoped Cu2+ oxides.
Among high-temperature superconductors (HTS) the most simple compound is La2CuO4+y where y oxygen interstitial ions (O-i), are inserted in the rocksalt [La2O2+y] intercalated by [CuO2] layers [36,37,38,39,40,41,42,43]. Due to the mobility of oxygen interstitials, O-i, this compound exhibits a rich phase diagram. The multiscale structural conformations due to the dynamic distribution of mobile O-i have been studied by X-ray synchrotron diffraction. Thanks to the high photon flux, we have measured the weak “diffuse scattering” in a single-crystal of La2CuO4+y with orthorhombic Fmmm symmetry. Beyond the Bragg peaks, we have detected satellite peaks, associated with super-cells due to O-i dopants arrangement [36,37,38,39]. These O-i ordered domains show an intriguing inhomogeneous spatial distribution (see the maps in Figure 1a,b) as seen by space resolved SμXRD measurements [40,41,42]. We have characterized this inhomogeneity by the (i) probability density function and (ii) spatial correlation function (see Methods).
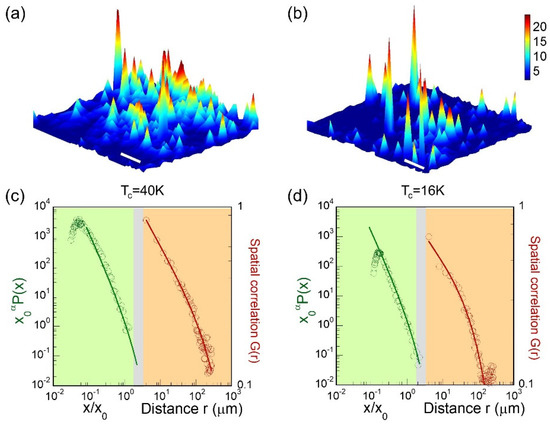
Figure 1.
The position dependence of the superstructure intensity for two typical samples with Tc = 40 K (a) and Tc = 16 K (b) phases in a 100 × 100 µm2 area. The white bar corresponds to 20 µm. The probability distribution, P(x), and spatial correlation function, G(r) of Q2 for the same two typical samples, are presented in panel (c) and (d), respectively.
Figure 1c,d (green regions) shows the probability distribution of the O-i domains in two different samples: the first one, named Tc = 40 K, has a superconducting Tc of 40 K while the second one presents a mixture of two superconducting phases with Tc of 16 K and 32 K, here named Tc = 16 K. In both cases we find a fat tail above the average intensity, <I>, following a clear power-law distribution with exponential cut-off, x0, given by
P(x) ~ x−αexp(−x/x0).
The power-law exponent, α, is always indistinguishable from 2.6 while the cut-off, x0, is less than 10 for the Tc = 16 K materials and greater than 10 for the high-Tc = 40 K materials.
The spatial correlation function, G(r) (orange regions of Figure 1c,d), where r = |Ri − Rj| is the distance between x–y positions on the sample and also follows a power law with a cut-off, as expected near a critical point:
with ξ = 0.3 ± 0.1 for all samples. The correlation length, ξ, increases with increasing <I>, varying between 50 and 250 mm for the Tc = 16 K samples and taking the respective values 400 ± 30 mm and 350 ± 30 mm for the Tc = 40 K samples. The results for both the intensity distribution and the two-point correlation function show that the unexpected fractal nature of O-i ordering, associated with the measured power laws, is robust, approaching a pure scale-free distribution in the sample with higher critical temperature [34].
G(r) ~ r−ξexp(−r/ξ)
2.2. High Tc Superconductivity: Scale Free Oxygen Distribution and Charge-Density-Waves in HgBa2CuO4+y
Alongside the oxygen ordering, the electronic inhomogeneity, namely charge density waves (CDW), has been measured in the HgBa2CuO4+y [58]. We have been able to measure the diffuse scattering associated with both CDW and oxygen interstitial arrangement in the lattice.
In Figure 2a we show the maps of the integrated intensity of (left panel) CDW peak and (right panel) oxygen O-i diffuse scattering. Both maps clearly show spatial inhomogeneity described by the PDFs assuming a power-law behavior, also in this case, as shown in Figure 3b. However, the critical exponent in the two distributions assumes different values: 1.8 ± 0.1 and 2.2 ± 0.1 in the O-i and CDW intensity, respectively. The other interesting feature of this spatial inhomogeneity is the negative spatial correlation between O-i and CDW. This is well depicted in the ‘difference map’ between CDW peaks and O-i diffuse streaks shown in Figure 3c. The poor CDW regions on the CuO2 basal plane correspond to O-i rich regions on the HgOy layers. The CDW puddles and O-i rich regions give rise to the positive (red) and negative (yellow) zones, respectively. Here we can highlight the interface, given by the white region, between the CDW puddles and O-i quenched disorder where interference between different pathways in a non-euclidean, hyperbolic geometry [77,78] can help to raise the critical temperature. This spatial negative correlation is also evident from the scatter plot of O-i intensity versus CDW intensity (Figure 3d). These results open new venues in the double-handed issue pertaining both to technology, relative to controlled fabrication of superconducting devices and to basic physics dealing with the formation and evolution of quantum coherence in relation to complex geometries at the nanoscale.
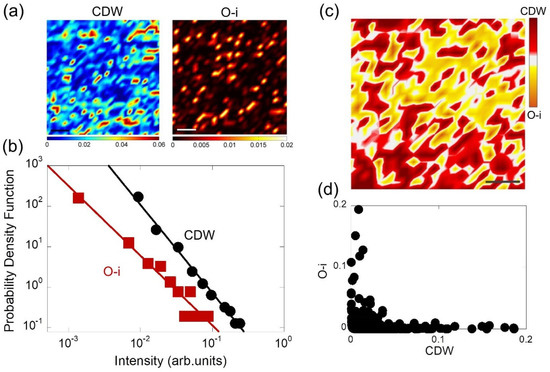
Figure 2.
(a) Color plot of the difference map between the Charge Density Waves (CDW)-peak and O-i-streak intensity. The positive red values indicate the CDW-rich regions and the negative yellow values correspond to O-i rich regions. The scale bar corresponds to 5 μm. (b) Probability density function calculated from the Oi-streaks and CDW intensity map. (c) Difference map between O-i and CDW highlighting the different O-i rich zones (red) and CDW puddles (yellow). The scale bar corresponds to 5 μm. (d) Scatter plot of O-i versus CDW intensity demonstrating the negative correlation between CDW-puddle and O-i.
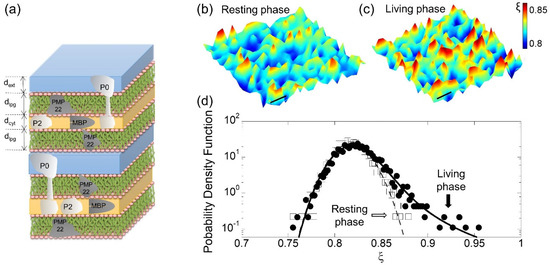
Figure 3.
(a) Pictorial view of the protein depleted membrane layers made of polar lipid groups, lpg, with thickness dlpg, intercalated by two hydrophilic layers: the Schwann cell cytoplasm, cyt, and the extracellular apposition, ext, with thickness dcyt and dext, respectively. The specific myelin sheath protein PMP22, P0, P2 and MBP are schematized. Map of the conformational parameter, ξ, in a selected central zone of the (b) unfresh and (c) fresh nerve (400 × 125 µm2). (d) The probability density function of ξ in the unfresh (open squares) and in the fresh (full circles) sample in semi-log plot. The Levy Probability Density Function curve found in the fresh sample (continuous line) is reported. We notice the loosing of the fat tail in the distribution assuming a Gaussian profile (dashed line) in the unfresh sample.
2.3. Biology: Ultrastructural Fluctuations in Biological Systems
Myelin can be considered a simple example of a biological ultrastructure. The scheme of the multilamellar ultrastructure of myelin is shown in Figure 3a. It is made of the stacking of (i) cytoplasmatic (cyt), (ii) lipidic (lpg), (iii) extracellular (ext) and iv) another lipidic (lpg) layer [61,62]. The individual thickness of each layer in a 1 μm2 spot area, named dλ, dcyt, dlpg, dext, has been extracted from electron density profiles computed by Fourier analysis of the diffraction patterns, as described in details in Campi et al. [61].
The structural fluctuations of myelin stacks and their spatial correlations have been quantified by introducing the appropriate conformational parameter, ξ, given by the ratio between hydrophilic and hydrophobic layers:
ξ = (dext + dcyt)/2dlpg
This parameter characterizes univocally the state of myelin. Typical maps of ξ measured on a 100 × 100 μm2 ROI of a nerve in the functional living phase and in the aged resting phase are shown in Figure 3b,c, respectively. The red spots represent areas where hydrophilic layers are larger, while in the blue spots they become smaller and the thickness of the hydrophobic layer increases. The PDF of ξ in the living phase shows a skewed line shape modelled by using Levy stable distributions (see Figure 3d). The Levy stable distribution provide a general statistical description of complex signals deviating from normal behavior and in recent years have found increasing interest in several applications in diverse fields [85,86]. This class of probability distributions are generally represented by a characteristic function defined by four parameters: stability index α, skewness parameter β, scale parameter γ taking into account the width of the distribution, and location parameter δ with varying ranges of 0 < α ≤ 2, −1 ≤ β ≤ 1, γ > 0 and δ real. Here we have used basic functions in the numerical evaluation of these parameters and goodness of data fitting as described by Liang and Chen [87]. We stress the fact that the closed-form expressions of density and distribution functions of Levy stable distributions are not available except for few particular cases such as the well-known normal distribution where the stability parameter α is 2, as occurs in the resting phase in the aged sample. In the functional living state, the ξ distribution function follows a Levy fitting curve, indicated by the continuous line in Figure 3d, with a stability index of 1.78 (<2), a location of 0.8242, a skewness of 1 and a scale parameter γ of 0.0138.
2.4. Hybrid Organic-Inorganic Supramolecular Assembly
In situ time-resolved small angle X-ray scattering (SAXS) has been used to monitor hybrid particle diffusion and aggregation at the nanoscale. We consider here the case of silver nanoparticle synthesized in aqueous solution with polynaphtalene sulphonate polymer as stabilizer [65,66,67]. We have monitored the particles formation by adding ascorbic acid as a reducing agent at a fixed slow rate, in order to control the Ag+ ions reduction, achieving the formation of the Ag0 crystalline colloidal dispersion. We have used SAXS at T = 40 °C in the 0.07 < q < 1.7 nm−1 range using a CCD detector with a time resolution of 0.9 s. SAXS normalized and water-subtracted intensity versus q at different time intervals are shown in Figure 4a. Before the addition of ascorbic acid, the scattered intensity, due to the Ag salt + polymer background in the aqueous solution, shows power law profiles (see the SAXS pattern collected at t = 22.5 s in Figure 3a). As the first micro drop of reduction agent falls in the solution mixture, the scattered intensity starts to gradually increase in the low q region indicating particle nucleation and growth. In the following minutes we detect (i) the development of interference oscillations whose maxima and minima progressively shift to smaller q and (ii) a change in the profile slopes at larger q that increase as a function of the time (Figure 4a).
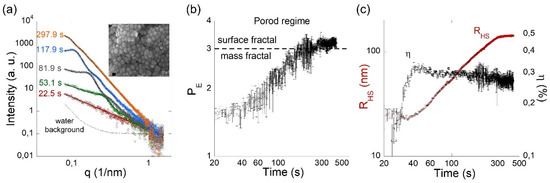
Figure 4.
(a) Small Angle X Ray Scattering normalized profiles (open circles) collected at the time intervals indicated, at T = 40 °C; solid lines show the best-fitted curves calculated using the two components model described in the text. In the inset we show an image of formed nanoparticles obtained by Transmission Electron Microscopy (b) The fractal background dimension is given by the exponent, PE; confidence intervals from optimization procedure are indicated with error bars. (c) Time evolution of correlation length RHS and volume fraction η.
These essential features of nucleation and growth mechanism are captured by assuming a physical model with two components constituted by interacting spherules forming in an aqueous solution of Ag salt and polymer [66,67,68,69] template. The first component, IB(q) ~ qPE is ascribed to the polymeric template in the solution; the second one describes highly dispersed particles interacting via hard-sphere potential modelled by Percus-Yevick structure factor S(q, RHS, η) where RHS and η represent the correlation length and the volume fraction of interacting particles, respectively [66,67]. Time evolution of both power law exponent, PE, associated with polymer-Ag matrix fluctuations, and structure factor taking into account the inter-particle interactions, are shown in Figure 4b,c respectively. We can observe how fractal dimension changes leading to a mass-surface fractal transition; at the same time the correlation length increases up to very large distances of about 120 nm, comparable with the final nanoparticle shown by the Transmission Electron Microscopy (TEM) image in the inset of Figure 4a. This procedure gives rise to different geometries at the nanoscale, just by changing the temperature [67]. This wet easy approach has been used for different hybrid organic-inorganic mixtures, where interactions developing between structural units of supramolecular assembly give rise to complex geometries down to few nanometers, with intriguing functionality for applications in different fields [68,69].
3. Discussion
A wide variety of systems in nature work out of thermodynamic equilibrium where spatial and time fluctuations give rise to complex patterns showing correlated disorder at nanoscale and mesoscale. The visualization and understanding of this disorder represent a challenge in experimental as well as theoretical science. Although self-organizing criticality and fractal geometry has been the preferred description for these phenomena, new, more complex and unexpected insights enrich this field of research as the emergent role of hyperbolic geometry determining the functionality of complex networks
In our approach, we first visualize the spatial and time fluctuations at nano and mesoscale using time and space resolved synchrotron radiation techniques; afterwards, we quantify these fluctuations using advanced statistical physics. What we find is that nanoscale and mesoscale fluctuations follow a normal behavior in the equilibrium state. In the out of equilibrium status, where all the biological matter works, these fluctuations deviate from normal behavior assuming fat-tailed distributions, relate to the emergence of a correlation degree in the disorder. We have found that these fluctuations show a power law in the HTS and a Levy behavior in the myelin. This can be particularly important in the biomedical field where the approaching of morphological fluctuations to a normal behavior can indicate a pathological condition. This could be used as new preclinical early stage detection of degenerative processes and disease.
4. Materials and Methods
4.1. Experimental Set Up for Space-Time Resolved Measurements
A typical space resolved experimental setup with synchrotron radiation includes an in-vacuum undulator as the primary source, mirrors for beam focusing, monochromators for energy selection and focusing optics such as compound refractive lenses (CRLs) [29,30], Kirkpatrick Baez (KB) mirrors [31], crossed Fresnel zone plates [32] and waveguides [33,34]. The different optics provide different beam spot sizes ranging from 50 nm to few microns. In Figure 5a is illustrated the scheme of a typical experimental apparatus for space-resolved X-ray scattering in transmission geometry.
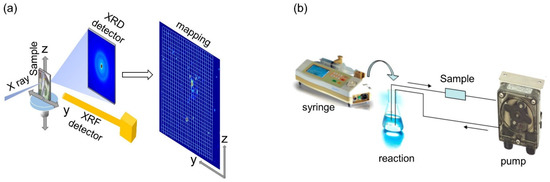
Figure 5.
Typical X-ray diffraction and spectroscopy apparatus for (a) space and (b) time-resolved measurements.
The scanning micro X-ray diffraction measurements of HTS and myelin of frog’s sciatic nerve were performed on the ID13 beamline of the European Synchrotron Radiation Facility, ESRF, France. The experimental methods were carried out in “accordance” with the approved guidelines. The source of the synchrotron radiation beam is an 18 mm period in a vacuum undulator. The beam is first monochromatized by a liquid nitrogen cooled Si-111 double monochromator (DMC) and then is focused by the diffractive lens. These optics produce an energy X-ray beam of λ = 12.6 KeV on a 1 × 1 μm2 spot. The sample holder allows both horizontal (y) and vertical (z) translation stages with 0.1 μm repeatability. A Fast Readout Low Noise (FReLoN) camera (1024 × 1024 pixels of 100 × 100 μm2) was used for data collection. In the case of myelin, we chose an exposure time of 300 ms for minimizing the radiation damage and for keeping a good sensitivity at the same time. 2-D diffraction patterns with the expected arc-rings corresponding to the Bragg diffraction orders h = 2, 3, 4, 5 were measured [61,62]. The electron density profiles were extracted by diffraction intensities using Fourier analysis [61].
The La2CuO4+y (LCO) single crystal with y = 0.1 has orthorhombic Fmmm space group symmetry with lattice parameters a = (5.386 ± 0.004) Å, b = (5.345 ± 0.008) Å, c = (13.205 ± 0.031) Å at room temperature. The HgBa2CuO4+y (Hg1201) single crystal with y = 0.12 has a sharp superconducting transition at Tc = 95 K. The crystal structure has tetragonal P4/mmm space group symmetry with lattice parameters a = b = 0.387480(5) nm and c = 0.95078(2) nm at T = 100 K. Diffraction measurements on single crystals of LCO and Hg1201, were performed on the ID13 beamline at ESRF.
The formation dynamics of chemical hybrid dispersions was monitored by in situ time-resolved measurements. Nowadays, the combination of microfluidics and SAXS allows us to investigate dynamic processes down to millisecond time resolution. In this case study, the batch reactor apparatus consisted of a glass flask, a remote-controlled syringe that allowed us to add 4 mL of reducing ascorbic acid solution at the fixed rate of 0.5 mL · min−1, and a peristaltic pump that continuously flows the solution mixture in a 1.5 quartz capillary through a closed circuit (see Figure 5b) The pumping rate was set to 20 mL · min−1 in order to change all the tubing (1 m × 2 mm) volume in less than 10 s, avoiding particle deposition on the walls. The exposure time for collecting each frame was 0.9 s.
4.2. Program MapX to Analyze X-ray Diffraction and Spectroscopy Big-Data Sets
If we consider a sample area of 100 × 100 µm, measured with a step of 100 nm in both y and z directions, we collect 1,000,000 patterns. At the same time, if we measure a slow chemical reaction taking place in 10 min, with a time resolution of 10 ms, we need to collect 60,000 frames.
Thus, the large quantity of collected data gives rise to new problems dealing with a big-data set to store and to analyze. For this aim, a dedicated software, MapX, has been developed and written in Matlab. In Figure 6 we show the main panel of this program for X-ray diffraction and spectroscopy big data sets analysis. It allows us to select specific features of each single diffraction pattern and to analyze and fit them to extract several parameters of interest, e.g., peak width, intensity or position. Once extracted, these parameters are used to build spatial maps.
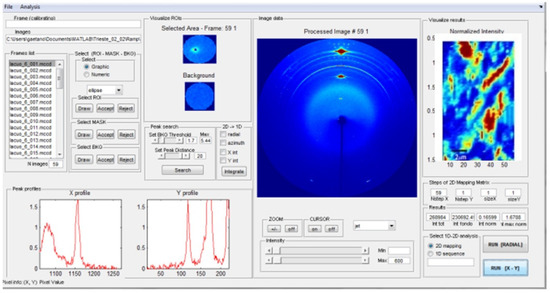
Figure 6.
Main panels of the software MapX for data analysis. The program allows the following operations: to download a big number of measured images; to select a diffraction feature such as a peak or some diffuse scattering; to integrate and build X-ray profiles that can be fitted by appropriate line-shapes. Finally, one cane builds spatial maps of each parameter extracted from the fit.
The second panel, shown in Figure 7, allows us to perform spatial statistical analysis of the obtained maps. The geometry at the nanoscale and mesoscale is characterized through several physical statistical quantities, such as the probability density function, spatial correlation function, clustering degree, tessellation, percolation. Different maps and map ROIs can be selected, calculating also cross-correlations.
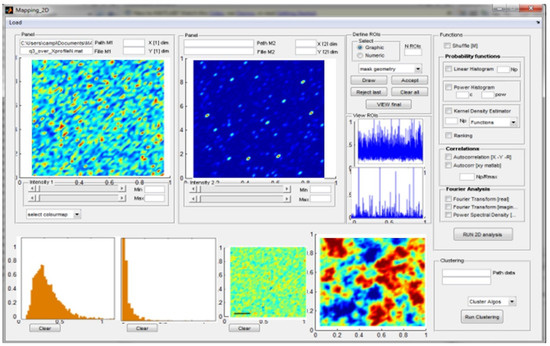
Figure 7.
Panels of the software MapX for spatial statistical data analysis. The geometry at nanoscale and mesoscale is characterized by calculating several physical spatial statistical quantities, such as the probability density function, spatial correlations, clustering degree, tessellation, percolation.
5. Conclusions
We have discussed the key role of nanoscale and mesoscale geometry arising from structural fluctuations in some simple model systems working in out-of-equilibrium functional conditions: High-temperature Superconducting La2CuO4+y and HgBa2CuO4+y crystals, myelin ultrastructure and hybrid nanostructures. In high-temperature superconductors, the quantum coherence is related to universal nanoscale fluctuations [36,37,38,39,40,41,42,43,44,45,46,47,48,49,50,51,52,53,54,55,56,57,58,59,60,88,89,90,91,92], where scale-free nanoscale phase separation create filamentary superconductivity in hyperbolic space [77,78]. In the myelin the Levy nanoscale ultrastructural fluctuations take place thanks to the correlated dynamics of cytosolic and lipid biological membranes, ensuring the physiological for the electrical transmission in nerves. In hybrid organic-inorganic nanostructures, we have visualized the evolution of supramolecular assembly associated with the mass-surface fractal transition.
These studies have been possible thanks to the new advanced features of the latest generation synchrotron sources and fast acquisition detectors. The different statistical physics found in these out-of-equilibrium systems tells us that the visualization of fluctuations can give us fundamental information about functionality in new advanced materials.
Author Contributions
G.C. and A.B. conceived and designed the work.
Funding
This research received no external funding.
Acknowledgments
The authors thank Luisa Barba, Heinz Amenitsch and XRD1 and SAXS beamlines staff at ELETTRA, Trieste, Italy. The authors thankManfred Burghammer and ID13 beamline staff at ESRF, Grenoble, France. We are grateful to Alessandro Ricci, Nicola Poccia, Michela Fratini, Michael Di Gioacchino and Lorenza Suber for long term scientific collaboration.
Conflicts of Interest
The authors declare no conflict of interest.
References
- Littlewood, P. Superconductivity: An X-ray oxygen regulator. Nat. Mater. 2011, 10, 726–727. [Google Scholar] [CrossRef] [PubMed]
- Dagotto, E. Complexity in strongly correlated electronic systems. Science 2005, 309, 257–262. [Google Scholar] [CrossRef] [PubMed]
- Tokura, Y. Critical features of colossal magnetoresistive manganites. Rep. Prog. Phys. 2006, 9, 797–851. [Google Scholar] [CrossRef]
- Wadhawan, V.K. Smart Structures: Blurring the Distinction Between the Living and the Nonliving; Oxford University Press: Oxford, UK, 2007. [Google Scholar]
- Bishop, A.R. HTC oxides: A collusion of spin, charge and lattice. J. Phys. Conf. Ser. 2008, 108, 012027. [Google Scholar] [CrossRef]
- Saxena, A.; Aeppli, G. Phase transitions at the nanoscale in functional materials. MRS Bull. 2009, 34, 804–813. [Google Scholar] [CrossRef]
- Cui, Y.; Li, B.; He, H.; Zhou, W.; Chen, B.; Qian, G. Metal–organic frameworks as platforms for functional materials. Acc. Chem. Res. 2016, 49, 483–493. [Google Scholar] [CrossRef]
- Awschalom, D.D.; Bassett, L.C.; Dzurak, A.S.; Hu, E.L.; Petta, J.R. Quantum Spintronics: Engineering and Manipulating Atom-Like Spins in Semiconductors. Science 2013, 339, 1174–1179. [Google Scholar] [CrossRef] [PubMed]
- Bryant, B.; Renner, C.; Tokunaga, Y.; Tokura, Y.; Aeppli, G. Imaging oxygen defects and their motion at a manganite surface. Nat. Commun. 2011, 2, 212. [Google Scholar] [CrossRef]
- Hilgenkamp, H.; Mannhart, J. Grain boundaries in high-Tc superconductors. Rev. Mod. Phys. 2002, 74, 485–549. [Google Scholar] [CrossRef]
- Mannhart, J.; Schlom, D.G. Oxide interfaces—An opportunity for electronics. Science 2010, 327, 1607–1611. [Google Scholar] [CrossRef]
- Hwang, H.Y.; Iwasa, Y.; Kawasaki, M.; Keimer, B.; Nagaosa, N.; Tokura, Y. Emergent phenomena at oxide interfaces. Nat. Mater. 2012, 11, 103–113. [Google Scholar] [CrossRef]
- Mermin, N.D. Crystalline order in two dimensions. Phys. Rev. 1968, 176, 250–254. [Google Scholar] [CrossRef]
- Geim, A.K.; Novoselov, K.S. The rise of graphene. Nat. Mater. 2007, 6, 183–191. [Google Scholar] [CrossRef]
- Fasolino, A.; Los, J.H.; Katsnelson, M.I. Intrinsic ripples in graphene. Nat. Mater. 2007, 6, 858–861. [Google Scholar] [CrossRef]
- Bao, W.; Miao, F.; Chen, Z.; Zhang, H.; Jang, W.; Dames, C.; Lau, C.N. Controlled ripple texturing of suspended graphene and ultrathin graphite membranes. Nat. Nanotechnol. 2009, 4, 562–566. [Google Scholar] [CrossRef]
- Zeljkovic, I.; Xu, Z.; Wen, J.; Gu, G.; Markiewicz, R.S.; Hoffman, J.E. Imaging the Impact of Single Oxygen Atoms on Superconducting Bi2+ySr2-yCaCu2O8+x. Science 2012, 337, 320–323. [Google Scholar] [CrossRef]
- Zaanen, J. High-temperature superconductivity: The benefit of fractal dirt. Nature 2010, 466, 825–827. [Google Scholar] [CrossRef]
- Bianconi, A. Quantum materials: Shape resonances in superstripes. Nat. Phys. 2013, 9, 536–537. [Google Scholar] [CrossRef]
- Carlson, E.W. Condensed-matter physics: Charge topology in superconductors. Nature 2015, 525, 329–330. [Google Scholar] [CrossRef]
- Bianconi, A.; Saini, N.L. Stripes and Related Phenomena; Springer: Boston, MA, USA, 2002. [Google Scholar] [CrossRef]
- Campi, G.; Ciasca, G.; Poccia, N.; Ricci, A.; Fratini, M.; Bianconi, A. Controlling photoinduced electron transfer via defects self-organization for novel functional macromolecular systems. Curr. Protein Pept. Sci. 2014, 15, 394–399. [Google Scholar] [CrossRef]
- Lausi, A.; Polentarutti, M.; Onesti, S.; Plaisier, J.R.; Busetto, E.; Bais, G.; Barba, L.; Cassetta, A.; Campi, G.; Lamba, D.; et al. Status of the crystallography beamlines at Elettra. Eur. Phys. J. Plus 2015, 130, 1–8. [Google Scholar] [CrossRef]
- Agrestini, S.; Metallo, C.; Filippi, M.; Simonelli, L.; Campi, G.; Sanipoli, C.; Liarokapis, E.; De Negri, S.; Giovannini, M.; Saccone, A.; et al. Substitution of Sc for Mg in MgB2: Effects on transition temperature and Kohn anomaly. Phys. Rev. B 2004, 70, 134514. [Google Scholar] [CrossRef]
- Saini, N.L.; Oyanagi, H.; Ito, T.; Scagnoli, V.; Filippi, M.; Agrestini, S.; Campi, G.; Oka, K.; Bianconi, A. Temperature dependent local Cu-O displacements from underdoped to overdoped La-Sr-Cu-O superconductor. Eur. Phys. J. B 2003, 36, 75–80. [Google Scholar] [CrossRef]
- Campi, G.; Cappelluti, E.; Proffen, T.; Qiu, X.; Bozin, E.S.; Billinge, S.; Agrestini, N.; Saini, L.; Bianconi, A. Study of temperature dependent atomic correlations in MgB2. Eur. Phys. J. B 2006, 52, 15–21. [Google Scholar] [CrossRef]
- Campi, G.; Ricci, A.; Bianconi, A. Local structure in Mg1−xAlxB2 system by high resolution neutron diffraction. J. Supercond. Nov. Magn. 2012, 25, 1319–1322. [Google Scholar] [CrossRef]
- Agrestini, S.; Metallo, C.; Filippi, M.; Campi, G.; Sanipoli, C.; De Negri, S.; Giovannini, M.; Saccone, A.; Latini, A.; Bianconi, A. Sc doping of MgB2: The structural and electronic properties of Mg1-xScxB2. J. Phys. Chem. Solids 2004, 65, 1479–1484. [Google Scholar] [CrossRef]
- Snigirev, A.; Kohn, V.; Snigireva, I.; Lengeler, B. A compound refractive lens for focusing high-energy X-rays. Nature 1996, 384, 49–51. [Google Scholar] [CrossRef]
- Lengeler, A.; Schroer, C.G.; Benner, B.; Guenzler, T.F.; Tuemmler, M.; Tuemmler, J.; Simionovici, A.S.; Drakopoulos, M.; Snigirev, A.; Snigireva, I. Parabolic refractive X-ray lenses: A breakthrough in X-ray optics. Nucl. Instrum. Meth. Phys. Res. A 2001, 467–468, 944–950. [Google Scholar] [CrossRef]
- Hignette, O.; Cloetens, P.; Lee, W.K.; Ludwig, W.; Rostaign, G. Hard X-ray microscopy with reflecting mirrors status and perspectives of the ESRF technology. J. Phys. IV France 2003, 104, 231–234. [Google Scholar] [CrossRef]
- David, C.; Noehammer, B.; Ziegler, E. Wet etching of linear Fresnel zone plates for hard X-rays. Microelectron. Eng. 2002, 61–62, 987–992. [Google Scholar] [CrossRef]
- Jark, W.; Di Fonzo, S.; Lagomarsino, S.; Cedola, A.; Fabrizio, E.D.; Riekel, A.; Riekel, C. Properties of a Submicrometer X-Ray Beam at the Exit of a Waveguide. J. Appl. Phys. 1996, 80, 4831–4836. [Google Scholar] [CrossRef]
- Mueller, M.; Burghammer, M.; Flot, D.; Riekel, C.; Morawe, C.; Cedola, B.; Cedola, A. Microcrystallography with an X-ray waveguide. J. Appl. Crystallogr. 2000, 33, 1231–1240. [Google Scholar] [CrossRef]
- Schϋlli, T.U.; Leake, S.J. X-ray nanobeam diffraction imaging of materials. Curr. Opin. Solid State Mater. Sci. 2018, 22, 188–201. [Google Scholar] [CrossRef]
- Poccia, N.; Fratini, M.; Ricci, A.; Campi, G.; Barba, L.; Vittorini, O.A.; Bianconi, G.; Aeppli, G.; Bianconi, A. Evolution and control of oxygen order in a cuprate superconductor. Nat. Mater. 2011, 10, 733–736. [Google Scholar] [CrossRef] [PubMed]
- Poccia, N.; Bianconi, A.; Campi, G.; Fratini, M.; Ricci, A. Size evolution of the oxygen interstitial nanowires in La2CuO4+y by thermal treatments and X-ray continuous illumination. Supercond. Sci. Technol. 2012, 25, 124004. [Google Scholar] [CrossRef]
- Campi, G.; Dell’Omo, C.; Di Castro, D.; Agrestini, S.; Filippi, M.; Bianconi, G.; Barba, L.; Cassetta, A.; Colapietro, M.; Saini, N.L.; et al. Effect of temperature and X-ray illumination on the oxygen ordering in La2CuO4.1 Superconductor. J. Supercond. 2004, 17, 137–142. [Google Scholar] [CrossRef]
- Campi, G.; Di Castro, D.; Bianconi, G.; Agrestini, S.; Saini, N.L.; Oyanagi, H.; Bianconi, A. Photo-induced phase transition to a striped polaron crystal in cuprates. Phase Trans. 2002, 75, 927–933. [Google Scholar] [CrossRef]
- Poccia, N.; Ricci, A.; Campi, G.; Fratini, M.; Puri, A.; Di Gioacchino, D.; Marcelli, A.; Reynolds, M.; Burghammer, M.; Saini, N.L.; et al. Optimum inhomogeneity of local lattice distortions in La2CuO4+y. Proc. Natl. Acad. Sci. USA 2012, 109, 15685–15690. [Google Scholar] [CrossRef] [PubMed]
- Poccia, N.; Ricci, A.; Campi, G.; Caporale, A.-S.; Bianconi, A. Competing striped structures in La2CuO4+y. J. Supercond. Nov. Magn. 2012, 26, 2703–2708. [Google Scholar] [CrossRef]
- Fratini, M.; Poccia, N.; Ricci, A.; Campi, G.; Burghammer, M.; Aeppli, G.; Bianconi, A. Scale-free structural organization of oxygen interstitials in La2CuO4+y. Nature 2010, 466, 841–844. [Google Scholar] [CrossRef]
- Poccia, N.; Chorro, M.; Ricci, A.; Xu, W.; Marcelli, A.; Campi, G.; Bianconi, A. Percolative superconductivity in La2 CuO4.06 by lattice granularity patterns with scanning micro x-ray absorption near edge structure. Appl. Phys. Lett. 2014, 104, 221903. [Google Scholar] [CrossRef]
- Ricci, A.; Poccia, N.; Campi, G.; Coneri, F.; Barba, L.; Arrighetti, G.; Polentarutti, M.; Burghammer, M.; Sprung, M.; Zimmermann, M.; et al. Networks of superconducting nano-puddles in 1/8 doped YBa2Cu3O6.5 controlled by thermal manipulation. New J. Phys. 2014, 16, 053030. [Google Scholar] [CrossRef]
- Campi, G.; Ricci, A.; Poccia, N.; Barba, L.; Arrighetti, G.; Burghammer, M.; Caporale, A.S.; Bianconi, A. Scanning micro-x-ray diffraction unveils the distribution of oxygen chain nanoscale puddles in YBa2Cu3O6.33. Phys. Rev. B 2013, 87, 014517. [Google Scholar] [CrossRef]
- Campi, G.; Ricci, A.; Poccia, N.; Bianconi, A. Imaging spatial ordering of the oxygen chains in YBa2Cu3O6+y at the insulator-to-metal transition. J. Supercond. Nov. Magnet. 2014, 27, 987–990. [Google Scholar] [CrossRef]
- Ricci, A.; Poccia, N.; Campi, G.; Coneri, F.; Caporale, A.S.; Innocenti, D.; Burghammer, M.; Zimmermann, M.; Bianconi, A. Multiscale distribution of oxygen puddles in 1/8 doped YBa2 Cu3 O6.67. Sci. Rep. 2014, 3, 2383. [Google Scholar] [CrossRef]
- Ricci, A.; Poccia, N.; Campi, G.; Joseph, B.; Arrighetti, G.; Barba, L.; Reynolds, M.; Burghammer, M.; Takeya, H.; Mizuguchi, Y.; et al. Nanoscale phase separation in the iron chalcogenide superconductor K0.8Fe1.6Se2 as seen via scanning nanofocused X-ray diffraction. Phys. Rev. B 2011, 84. [Google Scholar] [CrossRef]
- Ricci, A.; Poccia, N.; Joseph, B.; Arrighetti, G.; Barba, L.; Plaisier, J.; Saini, N.L. Intrinsic phase separation in superconducting K0.8Fe1.6 Se2 (Tc = 31.8 K) single crystals. Supercond. Sci. Technol. 2011, 24, 082002. [Google Scholar] [CrossRef]
- Ricci, A.; Poccia, N.; Joseph, B.; Innocenti, D.; Campi, G.; Zozulya, A.; Takeya, H. Direct observation of nanoscale interface phase in the superconducting chalcogenide KxFe2−ySe2 with intrinsic phase separation. Phys. Rev. B 2015, 91, 020503. [Google Scholar] [CrossRef]
- Croft, T.P.; Lester, C.; Senn, M.S.; Bombardi, A.; Hayden, S.M. Charge density wave fluctuations in La2−xSrxCuO4 and their competition with superconductivity. Phys. Rev. B 2014, 89, 224513. [Google Scholar] [CrossRef]
- Achkar, A.J.; Zwiebler, M.; McMahon, C.; He, F.; Sutarto, R.; Djianto, I.; Hao, Z.; Gingras, M.J.P.; Hucker, M.; Gu, G.D.; et al. Nematicity in stripe-ordered cuprates probed via resonant X-ray scattering. Science 2016, 351, 576–578. [Google Scholar] [CrossRef]
- Tabis, W.; Li, Y.; Tacon, M.L.; Braicovich, L.; Kreyssig, A.; Minola, M.; Dellea, G.; Weschke, E.; Veit, M.J.; Ramazanoglu, M.; et al. Charge order and its connection with fermi-liquid charge transport in a pristine high-Tc cuprate. Nat. Commun. 2014, 5, 5875. [Google Scholar] [CrossRef] [PubMed]
- Comin, R.; Sutarto, R.; da Silva Neto, E.H.; Chauviere, L.; Liang, R.; Hardy, W.N.; Bonn, D.A.; He, F.; Sawatzky, G.A.; Damascelli, A. Broken translational and rotational symmetry via charge stripe order in underdoped YBa2Cu3O6+y. Science 2015, 347, 1335–1339. [Google Scholar] [CrossRef] [PubMed]
- Chen, X.M.; Thampy, V.; Mazzoli, C.; Barbour, A.M.; Miao, H.; Gu, G.D.; Cao, Y.; Tranquada, J.M.; Dean, M.P.M.; Wilkins, S.B. Remarkable stability of charge density wave order in La1.875Ba0.125CuO4. Phys. Rev. Lett. 2016, 117, 167001. [Google Scholar] [CrossRef]
- Bianconi, A.; Lusignoli, M.; Saini, N.L.; Bordet, P.; Kvick Radaelli, P.G. Stripe structure of the CuO2 plane in Bi2Sr2CaCu2O8+y by anomalous X-ray diffraction. Phys. Rev. B 1996, 54, 4310. [Google Scholar] [CrossRef]
- Campi, G.; Ricci, A.; Poccia, N.; Fratini, M.; Bianconi, A. X-rays Writing/Reading of charge density waves in the CuO2 plane of a simple cuprate superconductor. Condensed. Matter. 2017, 2, 26. [Google Scholar] [CrossRef]
- Campi, G.; Bianconi, A.; Poccia, N.; Bianconi, G.; Barba, L.; Arrighetti, G.; Innocenti, D.; Karpinski, J.; Zhigadlo, N.D.; Kazakov, S.M.; et al. Inhomogeneity of charge-density-wave order and quenched disorder in a high-Tc superconductor. Nature 2015, 525, 359–362. [Google Scholar] [CrossRef] [PubMed]
- Poccia, N.; Campi, G.; Fratini, M.; Ricci, A.; Saini, N.; Bianconi, A. Spatial inhomogeneity and planar symmetry breaking of the lattice incommensurate supermodulation in the high-temperature superconductor Bi2Sr2CaCu2O8+y. Phys. Rev. B 2011, 84. [Google Scholar] [CrossRef]
- Poccia, N.; Ricci, A.; Campi, G.; Bianconi, A. Dislocations as a boundary between charge density wave and oxygen rich phases in a cuprate high temperature superconductor. Supercond. Sci. Technol. 2017, 30, 035016. [Google Scholar] [CrossRef]
- Campi, G.; Di Gioacchino, M.; Poccia, N.; Ricci, A.; Burghammer, M.; Ciasca, G.; Bianconi, A. Nanoscale correlated disorder in Out-of-Equilibrium myelin ultrastructure. ACS Nano 2018. [Google Scholar] [CrossRef]
- Di Gioacchino, M.; Campi, G.; Poccia, N.; Bianconi, A. Correlated disorder in myelinated axons orientational geometry and structure. Condensed. Matter. 2017, 2, 29. [Google Scholar] [CrossRef]
- Campi, G.; Fratini, M.; Bukreeva, I.; Ciasca, G.; Burghammer, M.; Brun, F.; Cedola, A. Imaging collagen packing dynamics during mineralization of engineered bone tissue. Acta Biomater. 2015, 23, 309–316. [Google Scholar] [CrossRef] [PubMed]
- Campi, G.; Cristofaro, F.; Pani, G.; Fratini, M.; Pascucci, B.; Corsetto, P.A.; Rea, G. Heterogeneous and self-organizing mineralization of bone matrix promoted by hydroxyapatite nanoparticles. Nanoscale 2017, 9, 17274–17283. [Google Scholar] [CrossRef]
- Suber, L.; Campi, G.; Pifferi, A.; Andreozzi, P.; La Mesa, C.L.; Amenitsch, H.; Cocco, R.; Plunkett, W.R. Polymer-assisted synthesis of two-dimensional silver meso-structures. J. Phys. Chem. C 2009, 113, 11198–11203. [Google Scholar] [CrossRef]
- Campi, G.; Mari, A.; Amenitsch, H.; Pifferi, A.; Cannas, C.; Suber, L. Monitoring early stages of silver particle formation in a polymer solution by in situ and time resolved small angle X-ray scattering. Nanoscale 2010, 2, 2447–2455. [Google Scholar] [CrossRef]
- Campi, G.; Mari, A.; Pifferi, A.; Amenitsch, H.; Fratini, M.; Suber, L. Control of silver-polymer aggregation mechanism by primary particle spatial correlations in dynamic fractal-like geometry. Nanoscale 2011, 3, 3774–3779. [Google Scholar] [CrossRef] [PubMed]
- Cannas, C.; Ardu, A.; Musinu, A.; Suber, L.; Ciasca, G.; Amenitsch, H.; Campi, G. Hierarchical formation mechanism of CoFe2O4 mesoporous assemblies. ACS Nano 2015, 9, 7277–7286. [Google Scholar] [CrossRef] [PubMed]
- Suber, L. Formation and Oriented Aggregation of Tabular Hexagonal Silver Particles. Condensed. Matter. 2018, 3, 13. [Google Scholar] [CrossRef]
- Ciasca, G.; Papi, M.; Chiarpotto, M.; Rodio, M.; Campi, G.; Rossi, C.; De Sole, P.; Bianconi, A. Transient state kinetic investigation of ferritin iron release. Appl. Phys. Lett. 2012, 100, 073703. [Google Scholar] [CrossRef]
- Ciasca, G.; Campi, G.; Battisti, A.; Rea, G.; Rodio, M.; Papi, M.; Bianconi, A.; Pernot, P.; Tenenbaum, A. Continuous thermal collapse of the intrinsically disordered protein tau is driven by its entropic flexible domain. Langmuir 2012, 28, 13405–13410. [Google Scholar] [CrossRef]
- Ciasca, G.; Papi, M.; Businaro, L.; Campi, G.; Ortolani, M.; Palmieri, V.; Cedola, A.; De Ninno, A.; Gerardino, A.; Maulucci, G. Recent advances in superhydrophobic surfaces and their relevance to biology and medicine. Bioinspir. Biomim. 2016, 11, 011001. [Google Scholar] [CrossRef] [PubMed]
- Innocenti, D.; Ricci, A.; Poccia, N.; Campi, G.; Fratini, M.; Bianconi, A. A model for Liquid-Striped liquid phase separation in liquids of anisotropic polarons. J. Supercond. Nov. Magn. 2009, 22, 529–533. [Google Scholar] [CrossRef]
- Campi, G.; Innocenti, D.; Bianconi, A. CDW and similarity of the Mott Insulator-to-Metal transition in cuprates with the Gas-to-Liquid-liquid transition in supercooled water. J. Supercond. Nov. Magn. 2015, 28, 1355–1363. [Google Scholar] [CrossRef]
- Bianconi, A. On the Fermi liquid coupled with a generalized Wigner polaronic CDW giving high Tc superconductivity. Solid State Commun. 1994, 91, 1–5. [Google Scholar] [CrossRef]
- Caivano, R.; Fratini, M.; Poccia, N.; Ricci, A.; Puri, A.; Ren, Z.-A.; Dong, X.-L.; Yang, J.; Lu, W.; Zhao, Z.-X.; et al. Feshbach resonance and mesoscopic phase separation near a quantum critical point in multiband FeAs-based superconductors. Supercond. Sci. Technol. 2009, 22, 014004. [Google Scholar] [CrossRef]
- Bianconi, G. Multilayer Networks: Structure and Function; Oxford University Press: Oxford, UK, 2018; ISBN 9780198753919. [Google Scholar]
- Campi, G.; Bianconi, A. High-Temperature Superconductivity in a Hyperbolic Geometry of Complex Matter from Nanoscale to Mesoscopic Scale. J. Supercond. Nov. Magn. 2016, 29, 627–631. [Google Scholar] [CrossRef]
- Marcelli, A.; Coreno, M.; Stredansky, M.; Xu, W.; Zou, C.; Fan, L.; Chu, W.; Wei, S.; Cossaro, A.; Ricci, A.; et al. Nanoscale phase separation and lattice complexity in VO2: The Metal–Insulator transition investigated by XANES via auger electron yield at the vanadium L23-Edge and resonant photoemission. Condensed. Matter. 2017, 2, 38. [Google Scholar] [CrossRef]
- Gioacchino, D.; Marcelli, A.; Puri, A.; Zou, C.; Fan, L.; Zeitler, U.; Bianconi, A. Metastability phenomena in VO2 thin films. Condensed. Matter. 2017, 2, 10. [Google Scholar] [CrossRef]
- Bianconi, A. Multiplet splitting of final-state configurations in x-ray-absorption spectrum of metal VO2: Effect of core-hole-screening, electron correlation, and metal-insulator transition. Phys. Rev. B 1982, 26, 2741. [Google Scholar] [CrossRef]
- Stizza, S.; Mancini, G.; Benfatto, M.; Natoli, C.R.; Garcia, J.; Bianconi, A. Structure of oriented V2O5 gel studied by polarized X-ray-absorption spectroscopy at the vanadium k edge. Phys. Rev. B 1989, 40, 12229–12236. [Google Scholar] [CrossRef]
- Barba, L.; Chita, G.; Campi, G.; Suber, L.; Bauer, E.; Marcelli, A.; Bianconi, A. Anisotropic thermal expansion of p-Terphenyl: A Self-Assembled supramolecular array of poly-p-phenyl nanoribbons. J. Supercond. Nov. Magn. 2018, 31, 703–710. [Google Scholar] [CrossRef]
- Mazziotti, M.V.; Valletta, A.; Campi, G.; Innocenti, D.; Perali, A.; Bianconi, A. May Possible fano resonance for high Tc multi-gap superconductivity in p-Terphenyl doped by k at the lifshitz transition. EPL (Europhys. Lett.) 2017, 118, 37003. [Google Scholar] [CrossRef]
- Fofack, H.; Nolan, J.P. Tail behavior, modes and other characteristics of stable distributions. Extremes 1999, 2, 9–58. [Google Scholar]
- Chechkin, A.V.; Gonchar, V.Y.; Klafter, J.; Metzler, R. Fundamentals of Lévy Flight Processes. Adv. Chem. Phys. 2006, 133, 439–496. [Google Scholar]
- Liang, Y.; Chen, W. A survey on computing Levy stable distributions and a new MATLAB toolbox. Signal Process. 2013, 93, 242–251. [Google Scholar] [CrossRef]
- Giraldo-Gallo, P.; Zhang, Y.; Parra, C.; Manoharan, H.C.; Beasley, M.R.; Geballe, T.H.; Kramer, M.J.; Fisher, I.R. Stripe-like nanoscale structural phase separation in superconducting BaPb1−xBixO3. Nat. Commun. 2015, 6, 8231. [Google Scholar] [CrossRef] [PubMed]
- Bianconi, A.; Poccia, N.; Sboychakov, A.O.; Rakhmanov, A.L.; Kugel, K.I. Intrinsic arrested nanoscale phase separation near a topological Lifshitz transition in strongly correlated two-band metals. Supercond. Sci. Technol. 2015, 28, 024005. [Google Scholar] [CrossRef]
- Kugel, K.I.; Rakhmanov, A.L.; Sboychakov, A.O.; Kusmartsev, F.V.; Poccia, N.; Bianconi, A. A two-band model for the phase separation induced by the chemical mismatch pressure in different cuprate superconductors. Supercond. Sci. Technol. 2009, 22, 014007. [Google Scholar] [CrossRef]
- Kugel, K.I.; Rakhmanov, A.L.; Sboychakov, A.O.; Poccia, N.; Bianconi, A. Model for phase separation controlled by doping and the internal chemical pressure in different cuprate superconductors. Phys. Rev. B 2008, 78, 165124. [Google Scholar] [CrossRef]
- De Mello, E.V.L. Describing how the Superconducting Transition in La2CuO4+y is Related to the iO Phase Separation. J. Supercond. Nov. Magn. 2012, 25, 1347–1350. [Google Scholar] [CrossRef]
© 2019 by the authors. Licensee MDPI, Basel, Switzerland. This article is an open access article distributed under the terms and conditions of the Creative Commons Attribution (CC BY) license (http://creativecommons.org/licenses/by/4.0/).