Bandgap Tunability in a One-Dimensional System


Abstract
1. Introduction
2. Results and Discussions
3. Computational Details
4. Conclusions
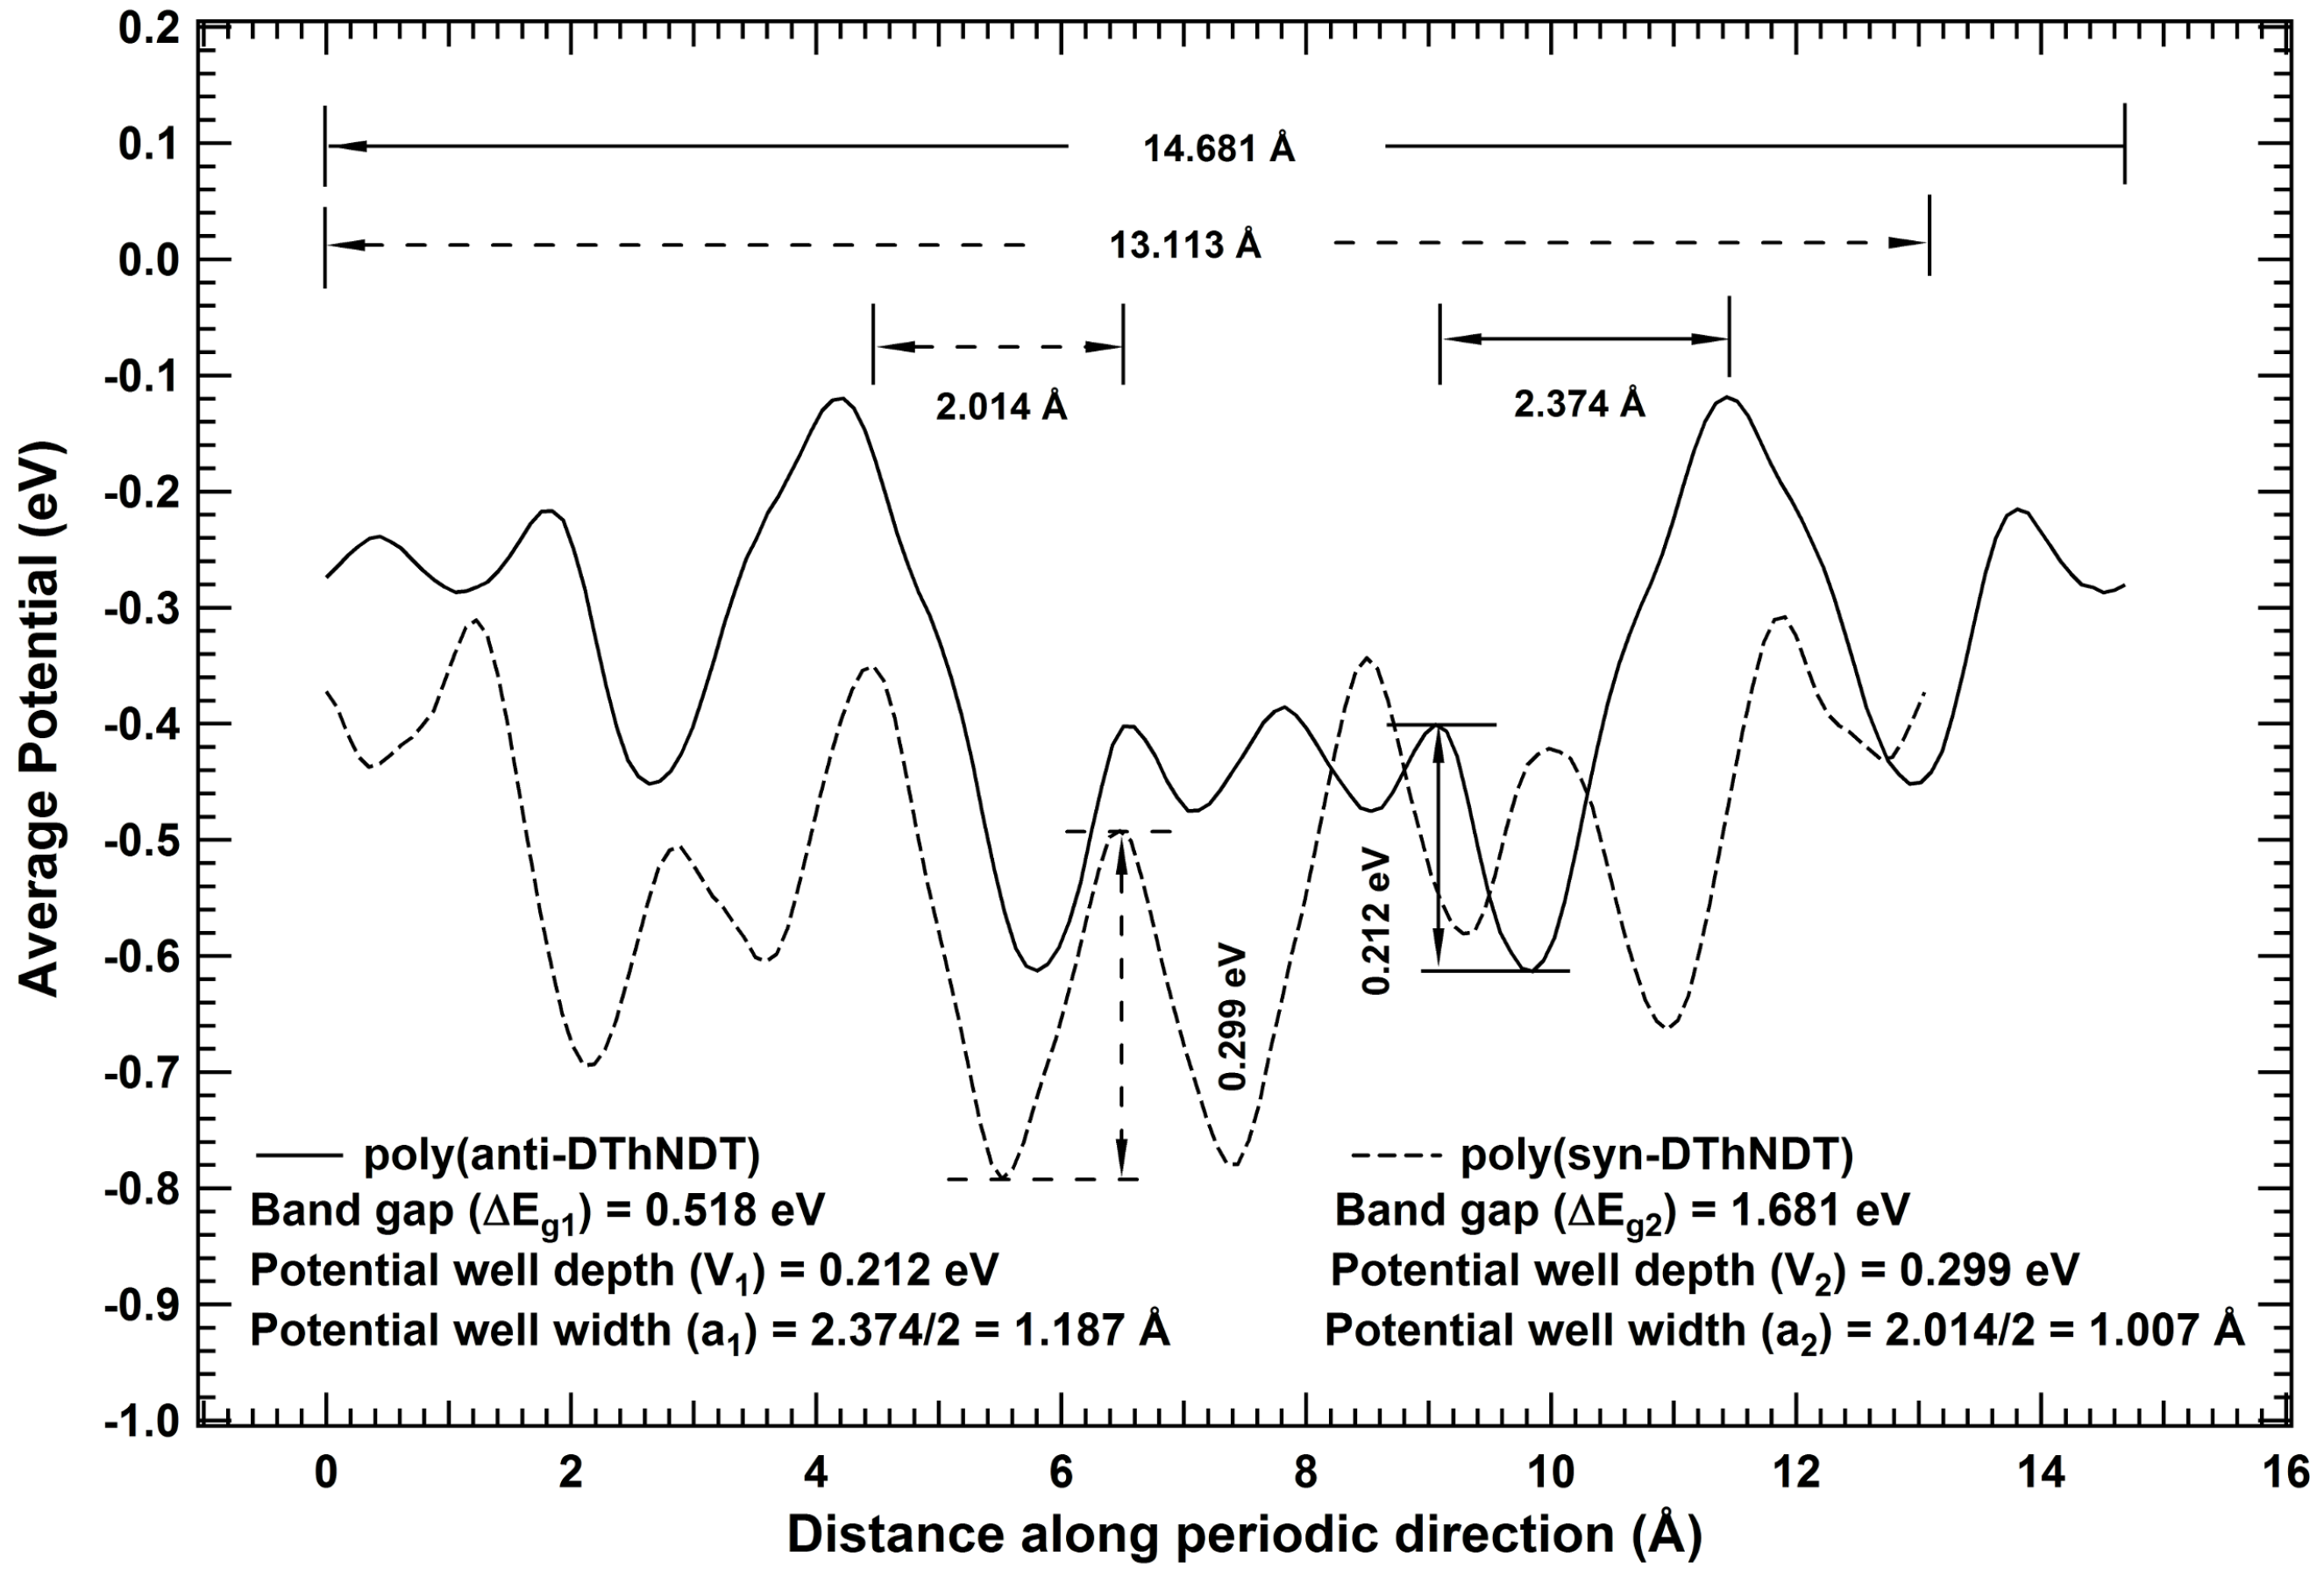
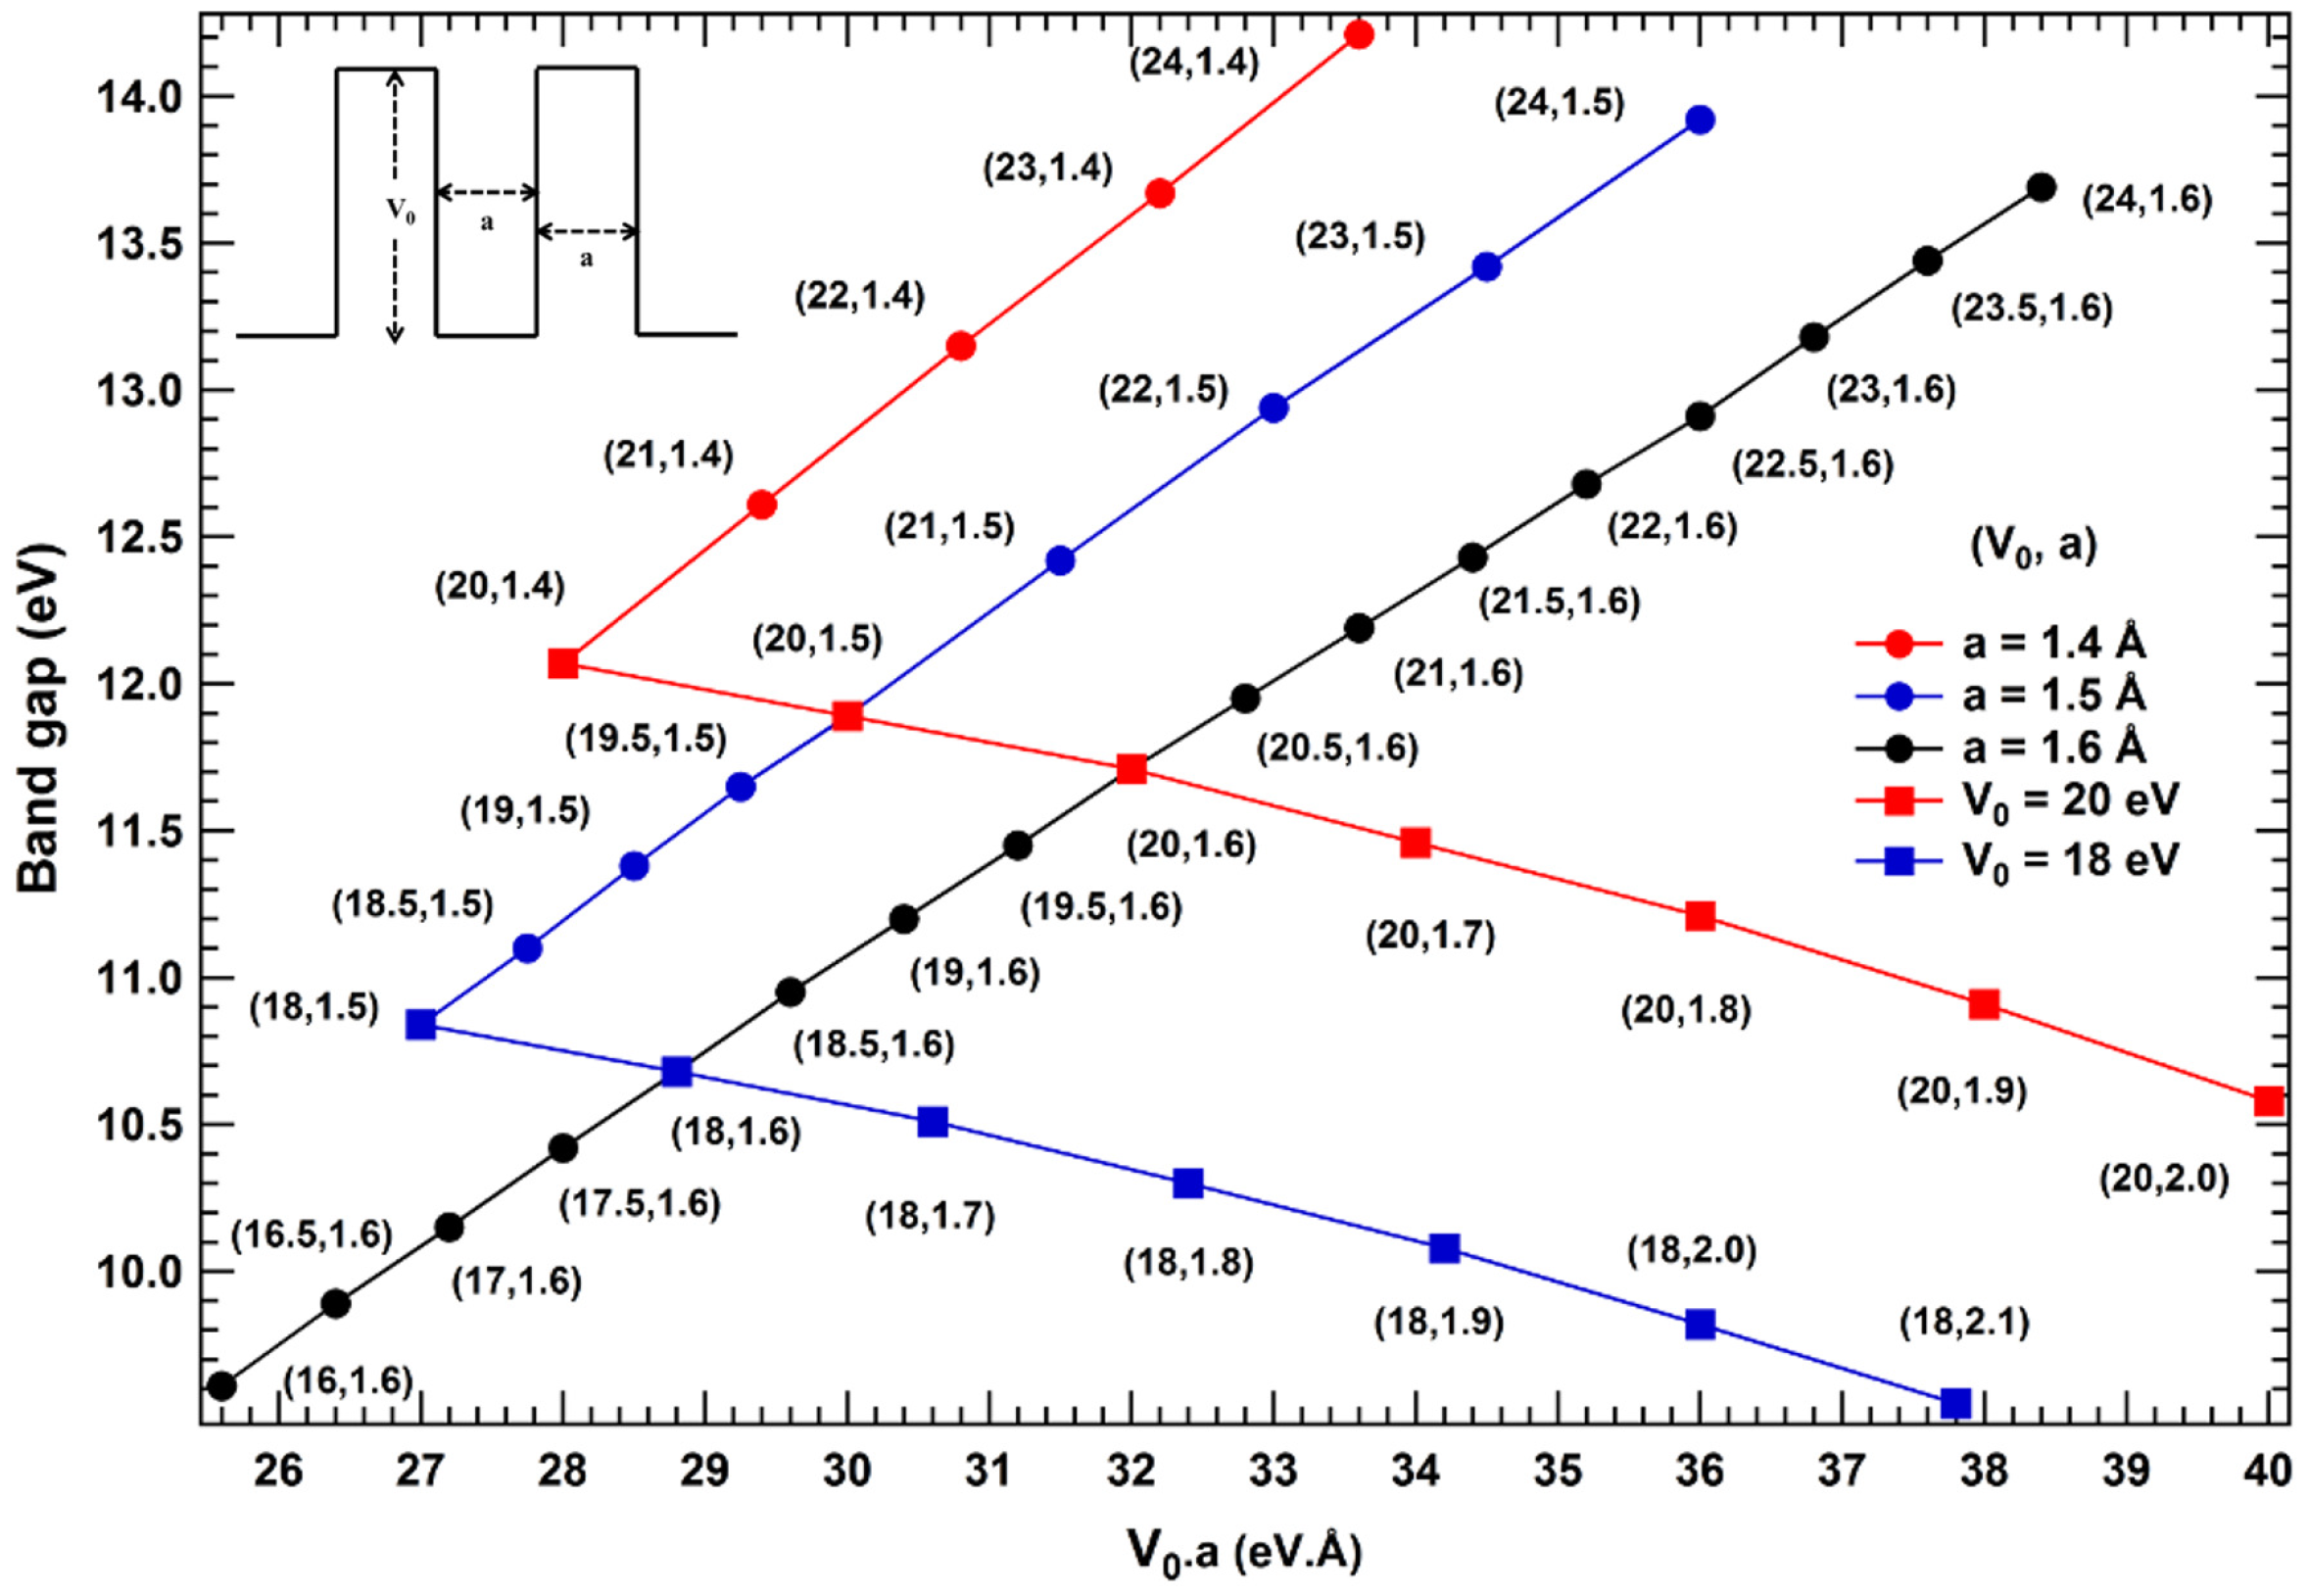
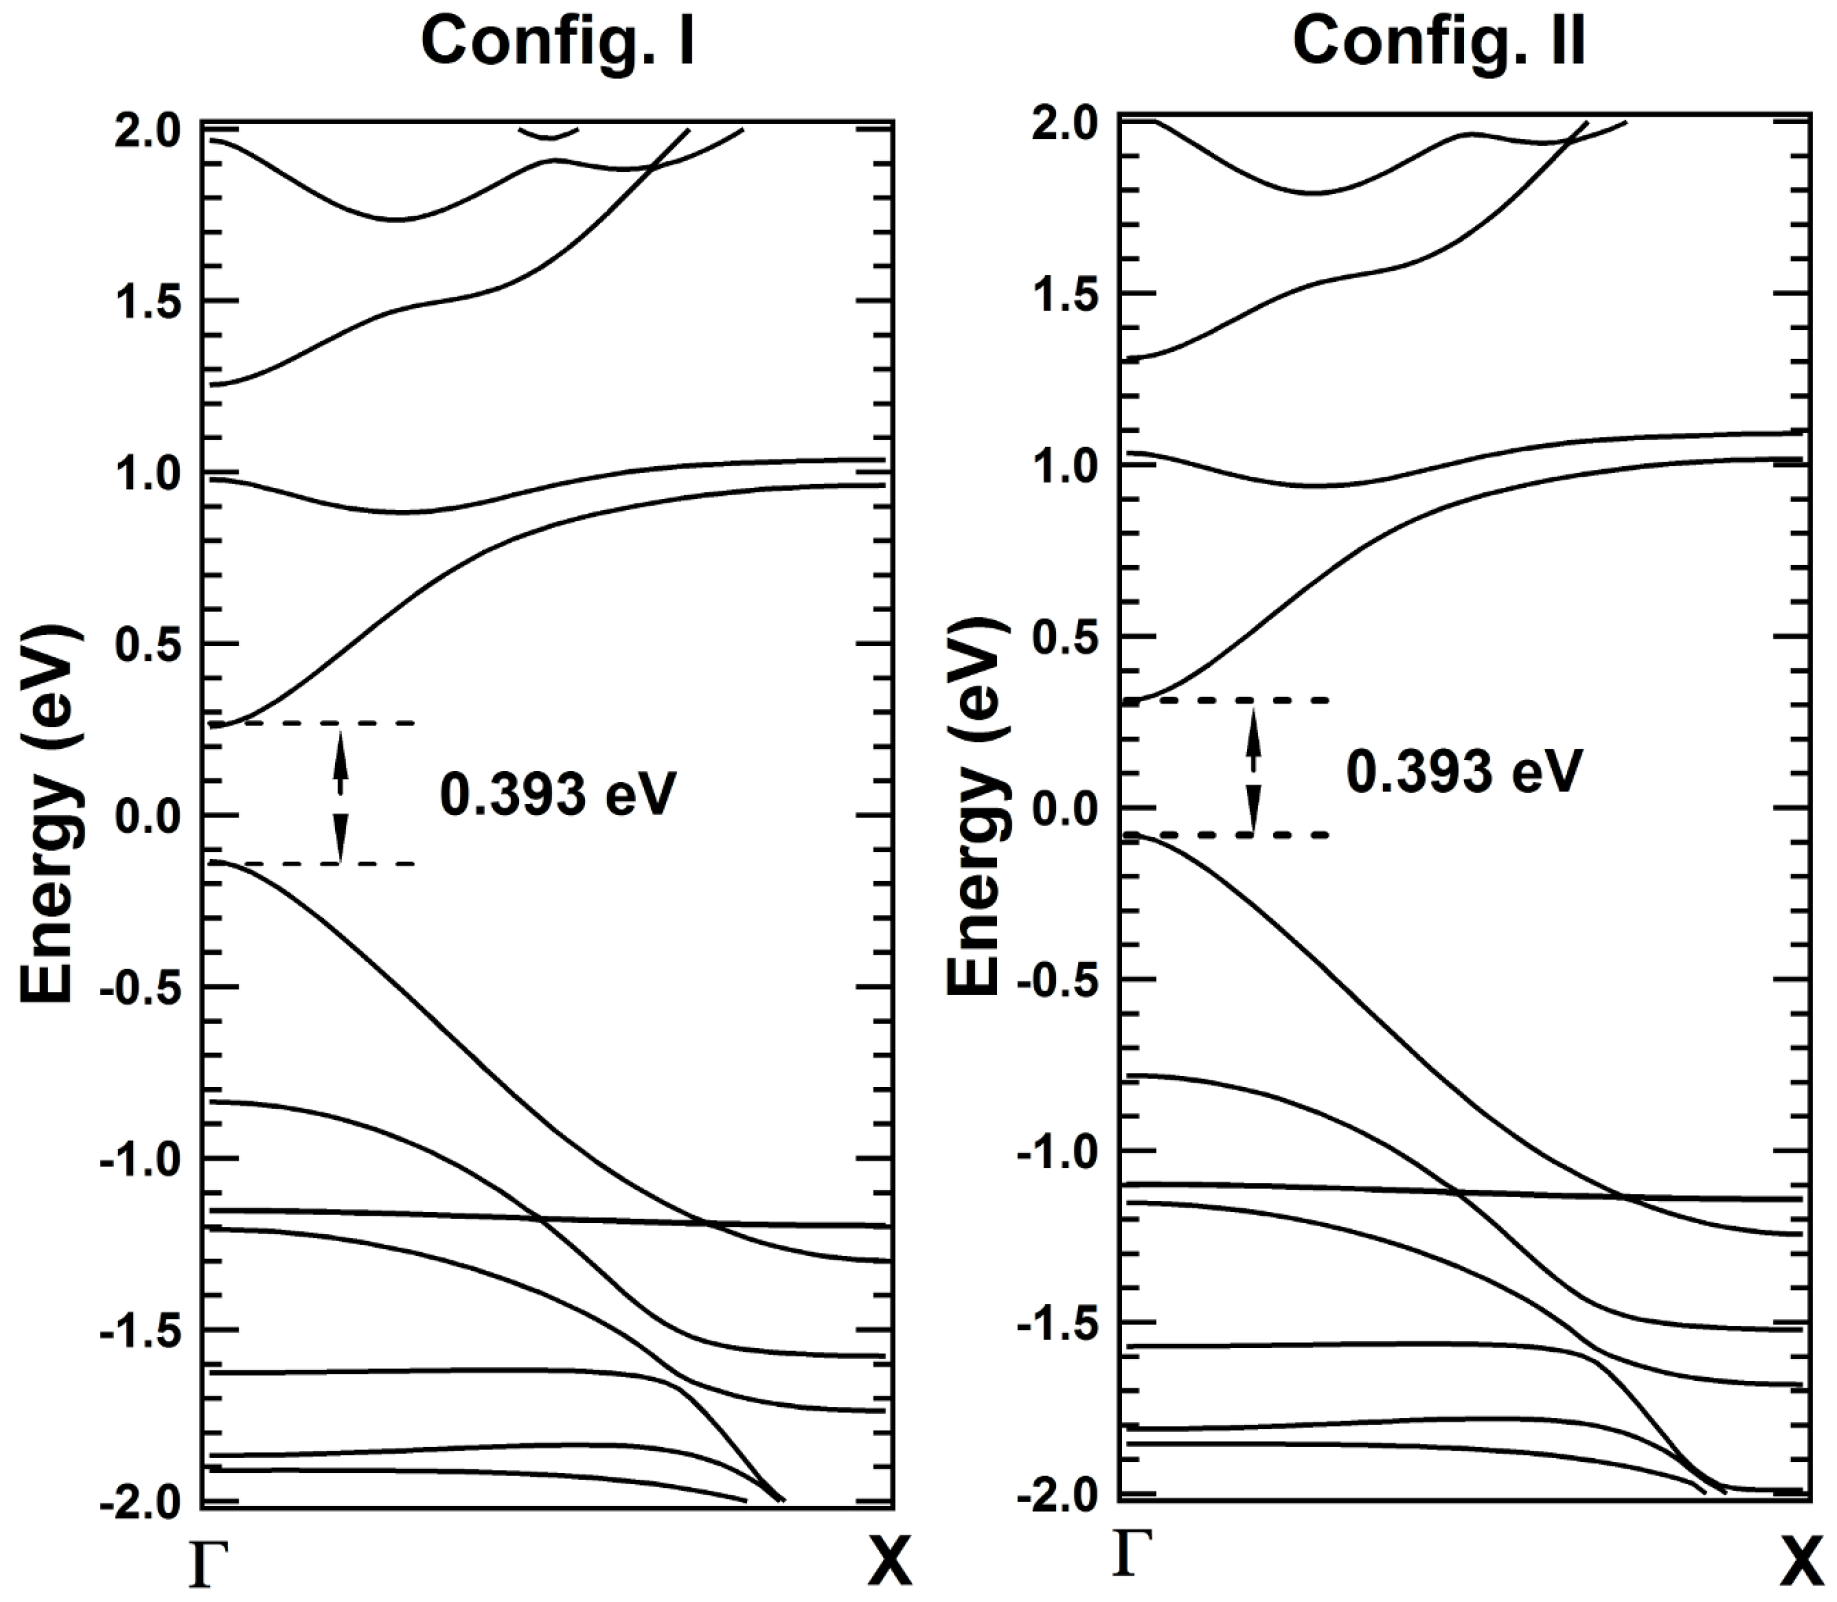
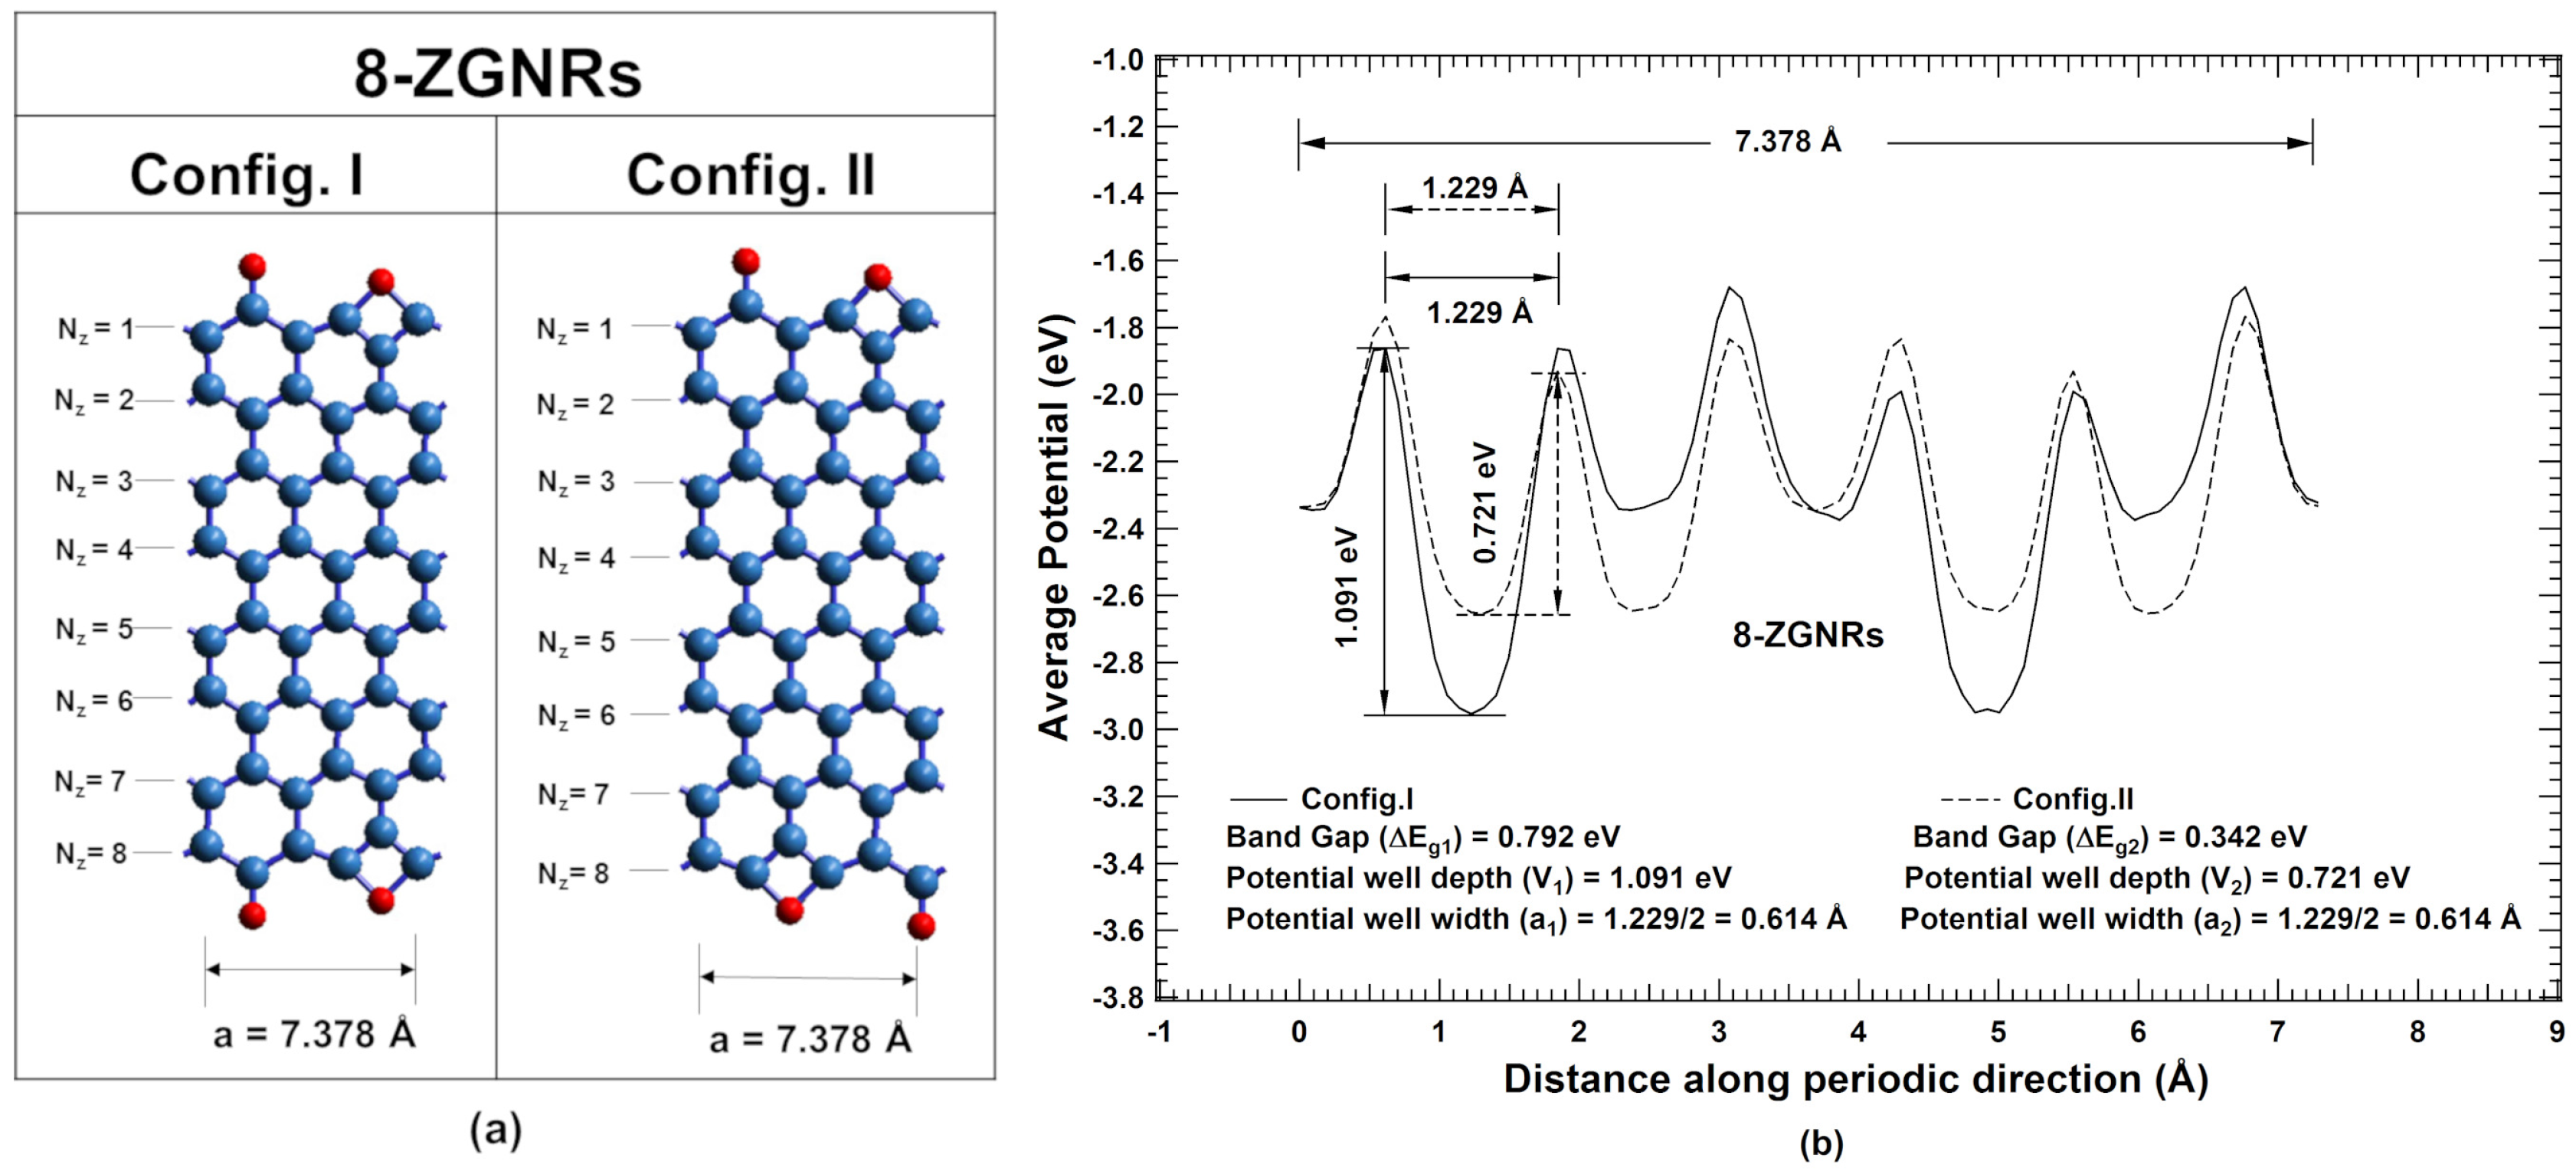
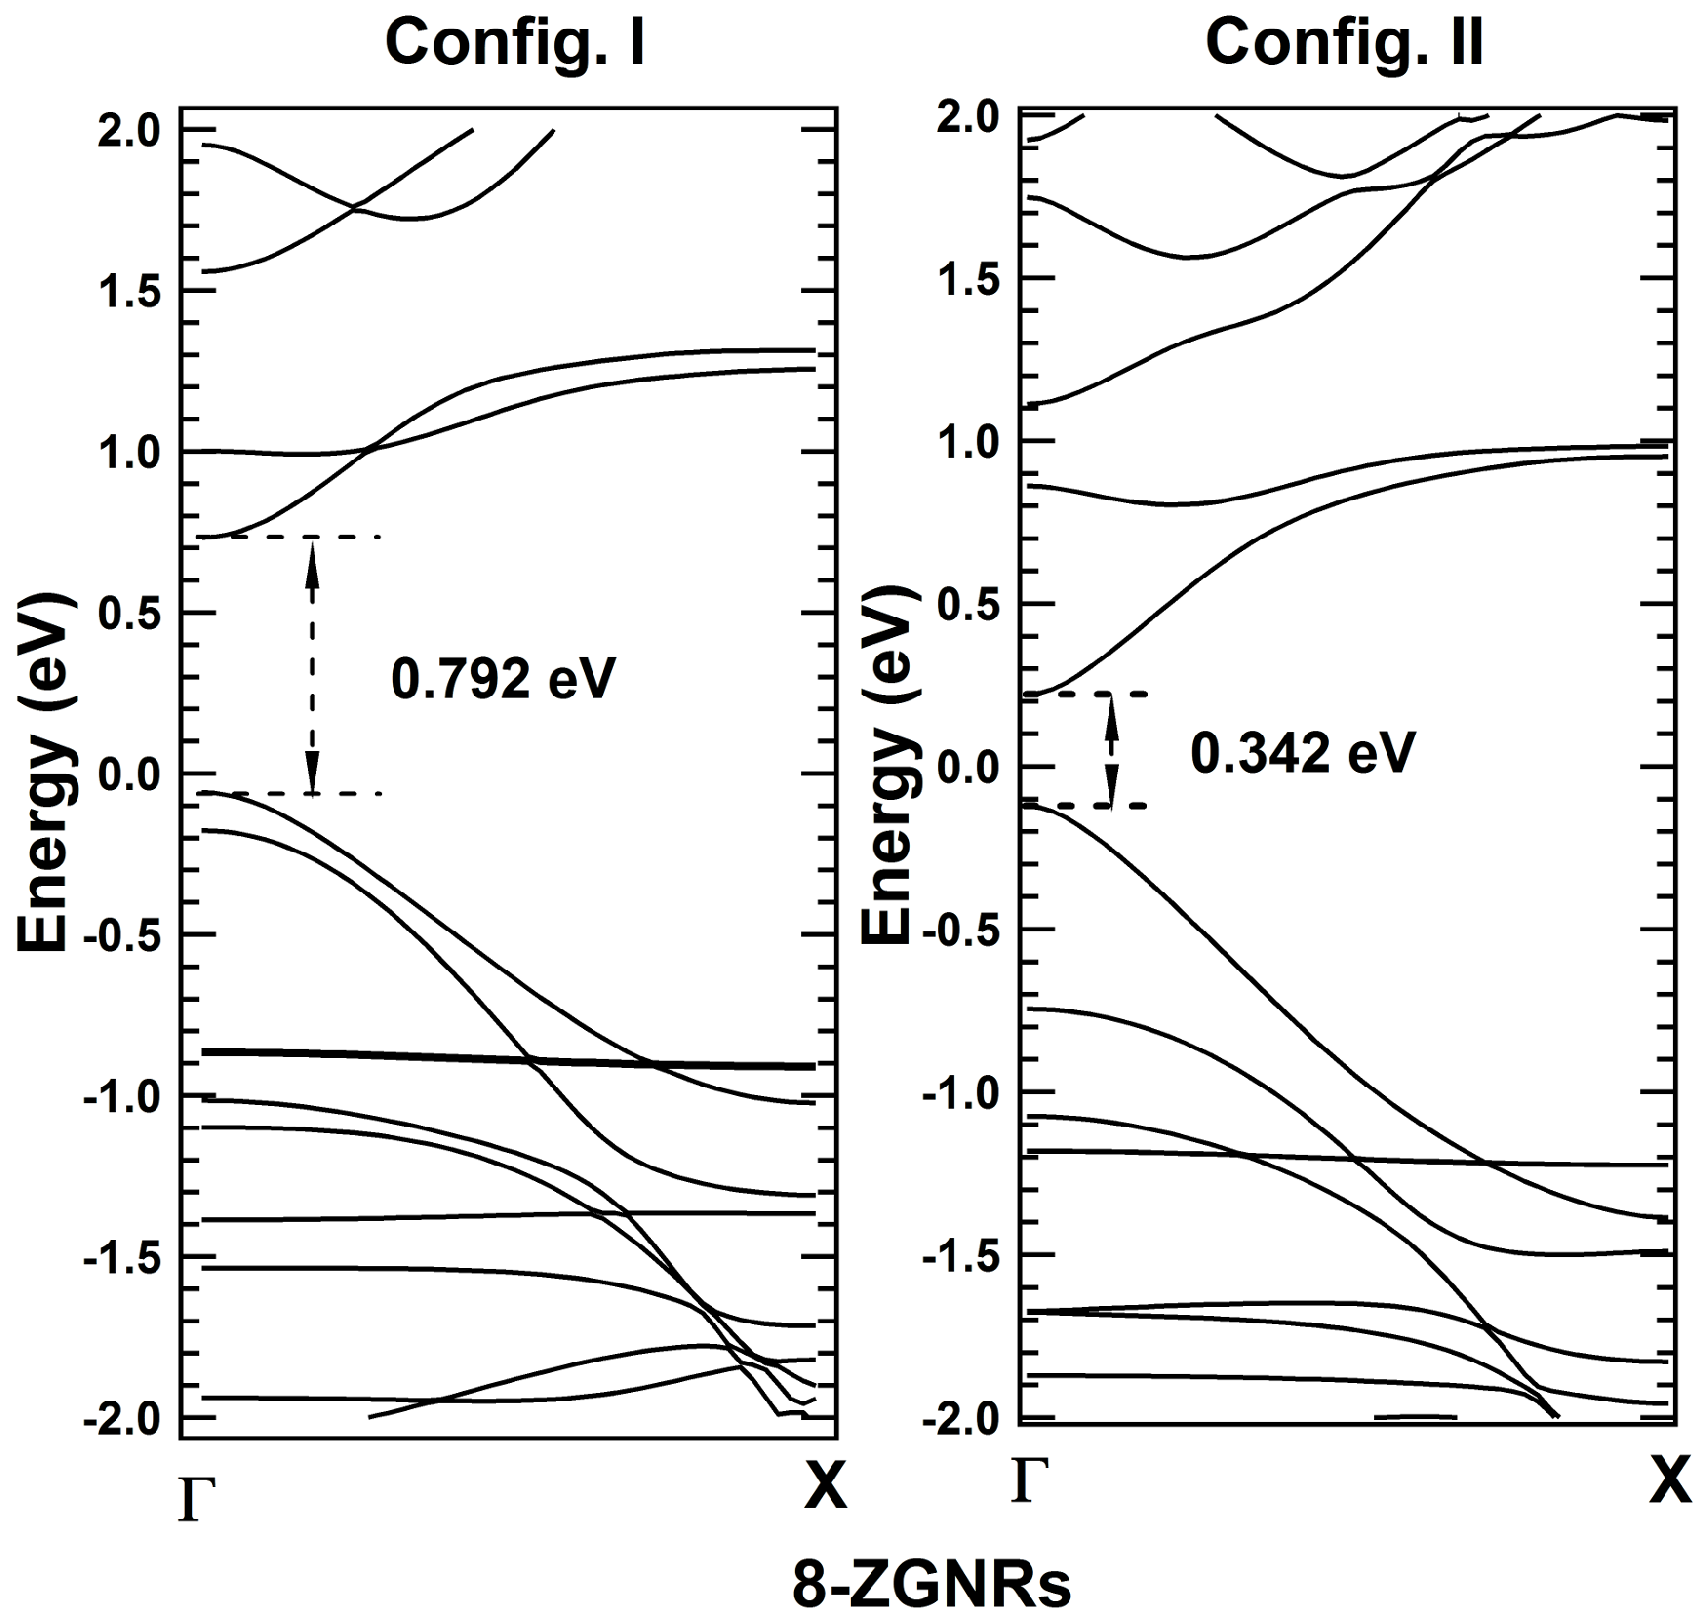
- Bandgaps of one-dimensional systems are correlated to the depth and width of potential well at global minimum in the periodic potential profile.
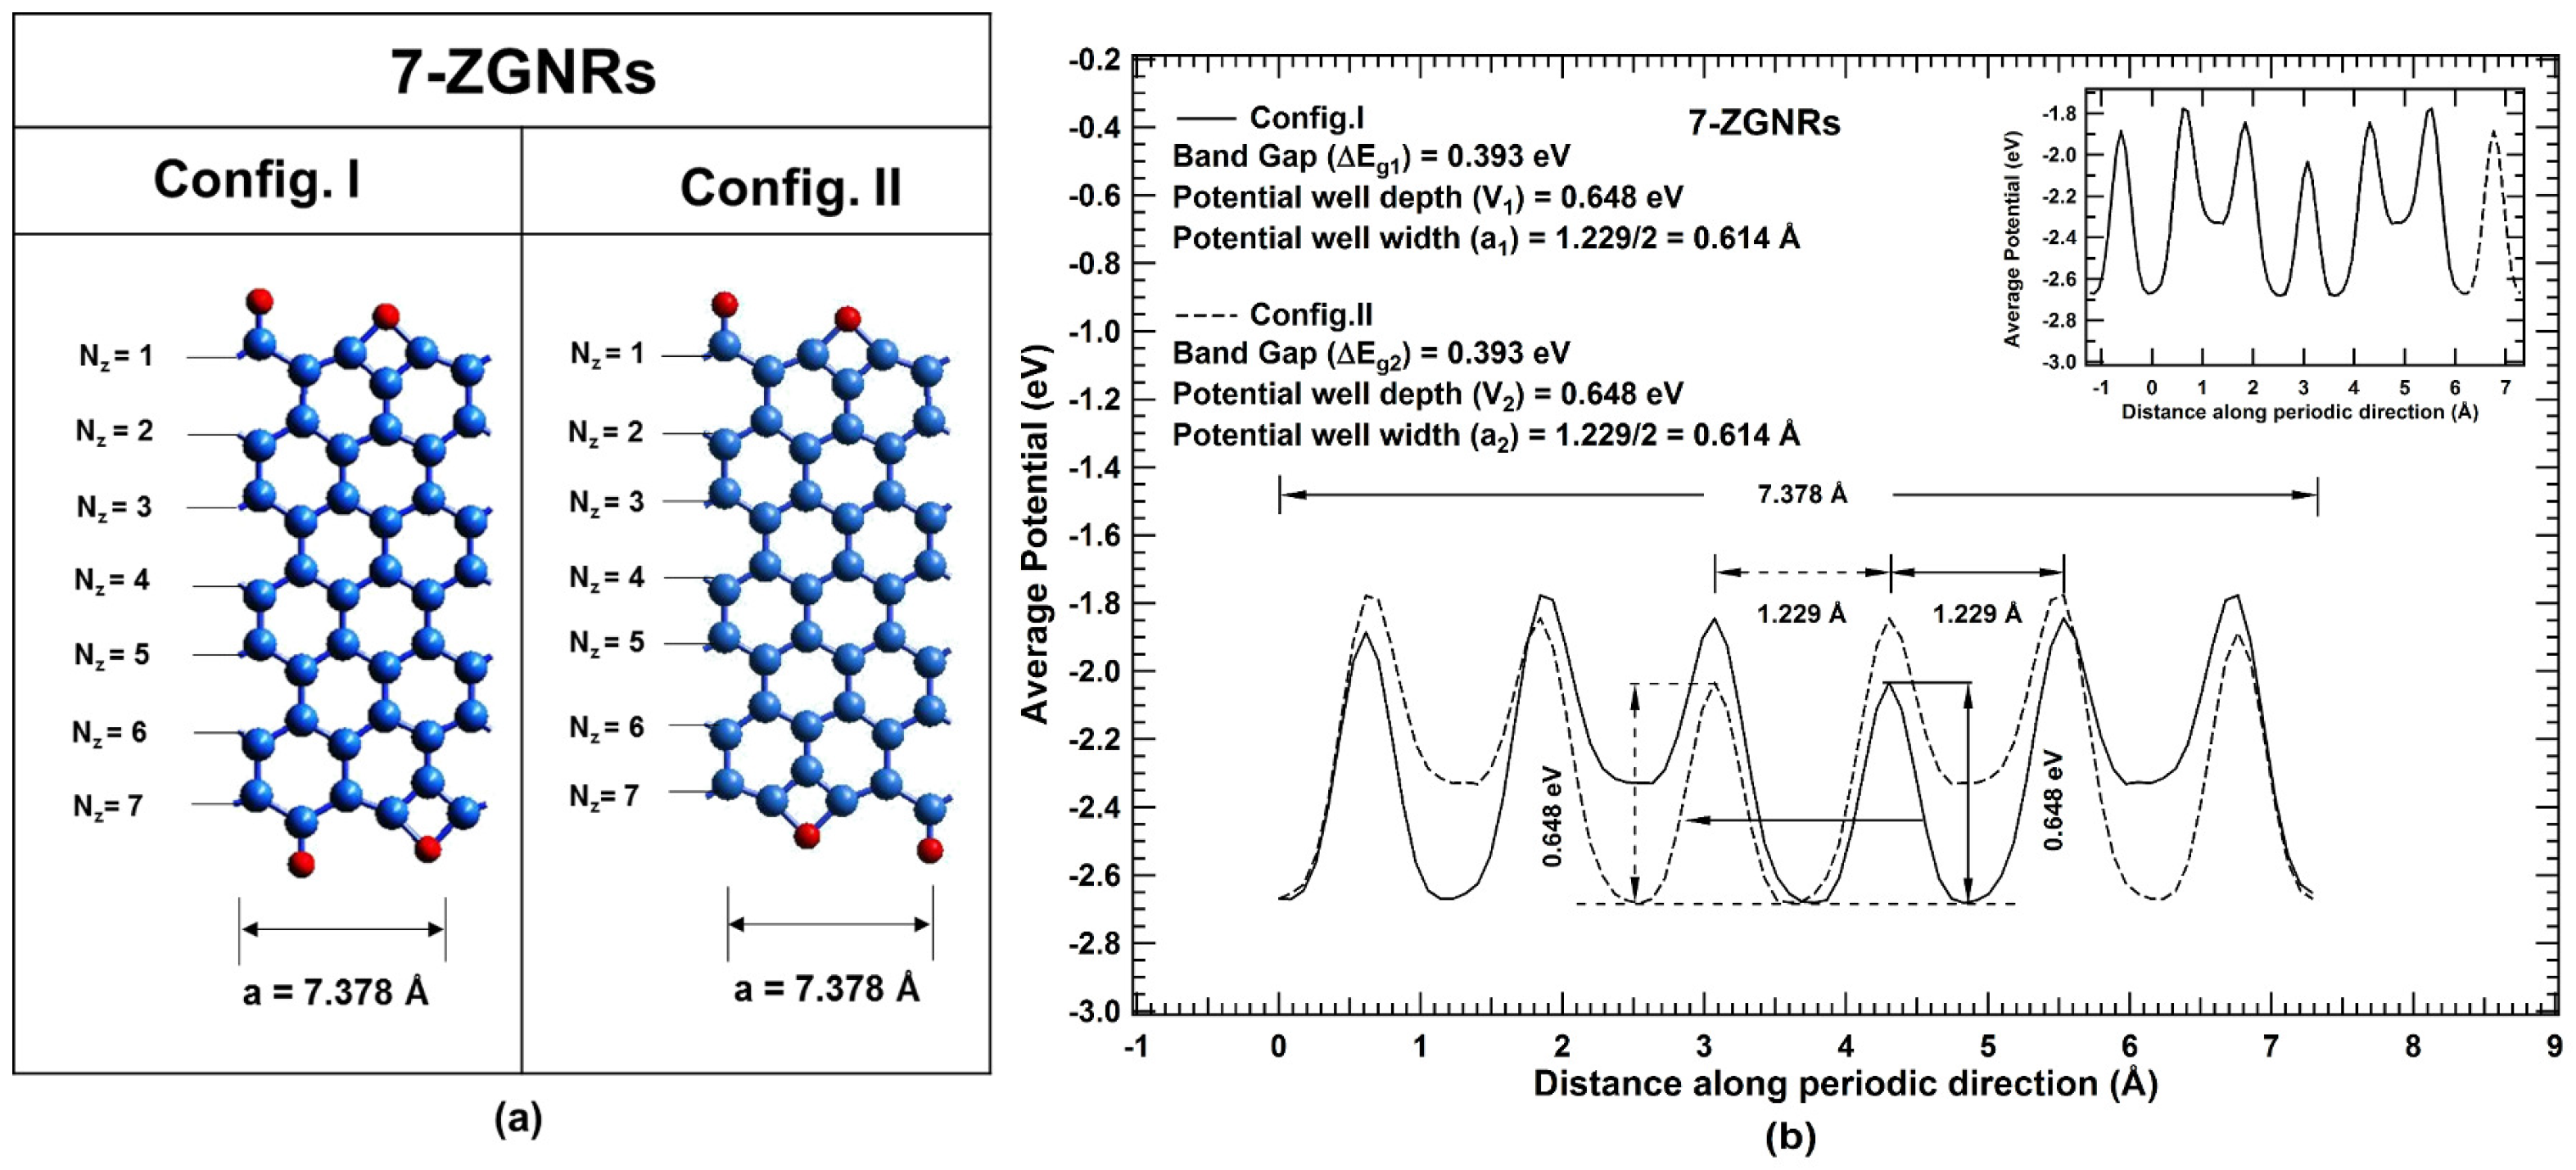
- The correlations derived between bandgap and dimension of periodic potential well at global minimum is verified for known isomeric systems of synthetic as well as natural polymers (biological and organic), and bandgap tunability is also established for one-dimensional nanoribbons.
Supplementary Materials
Author Contributions
Funding
Acknowledgments
Conflicts of Interest
Abbreviations
| DFT | Density functional theory |
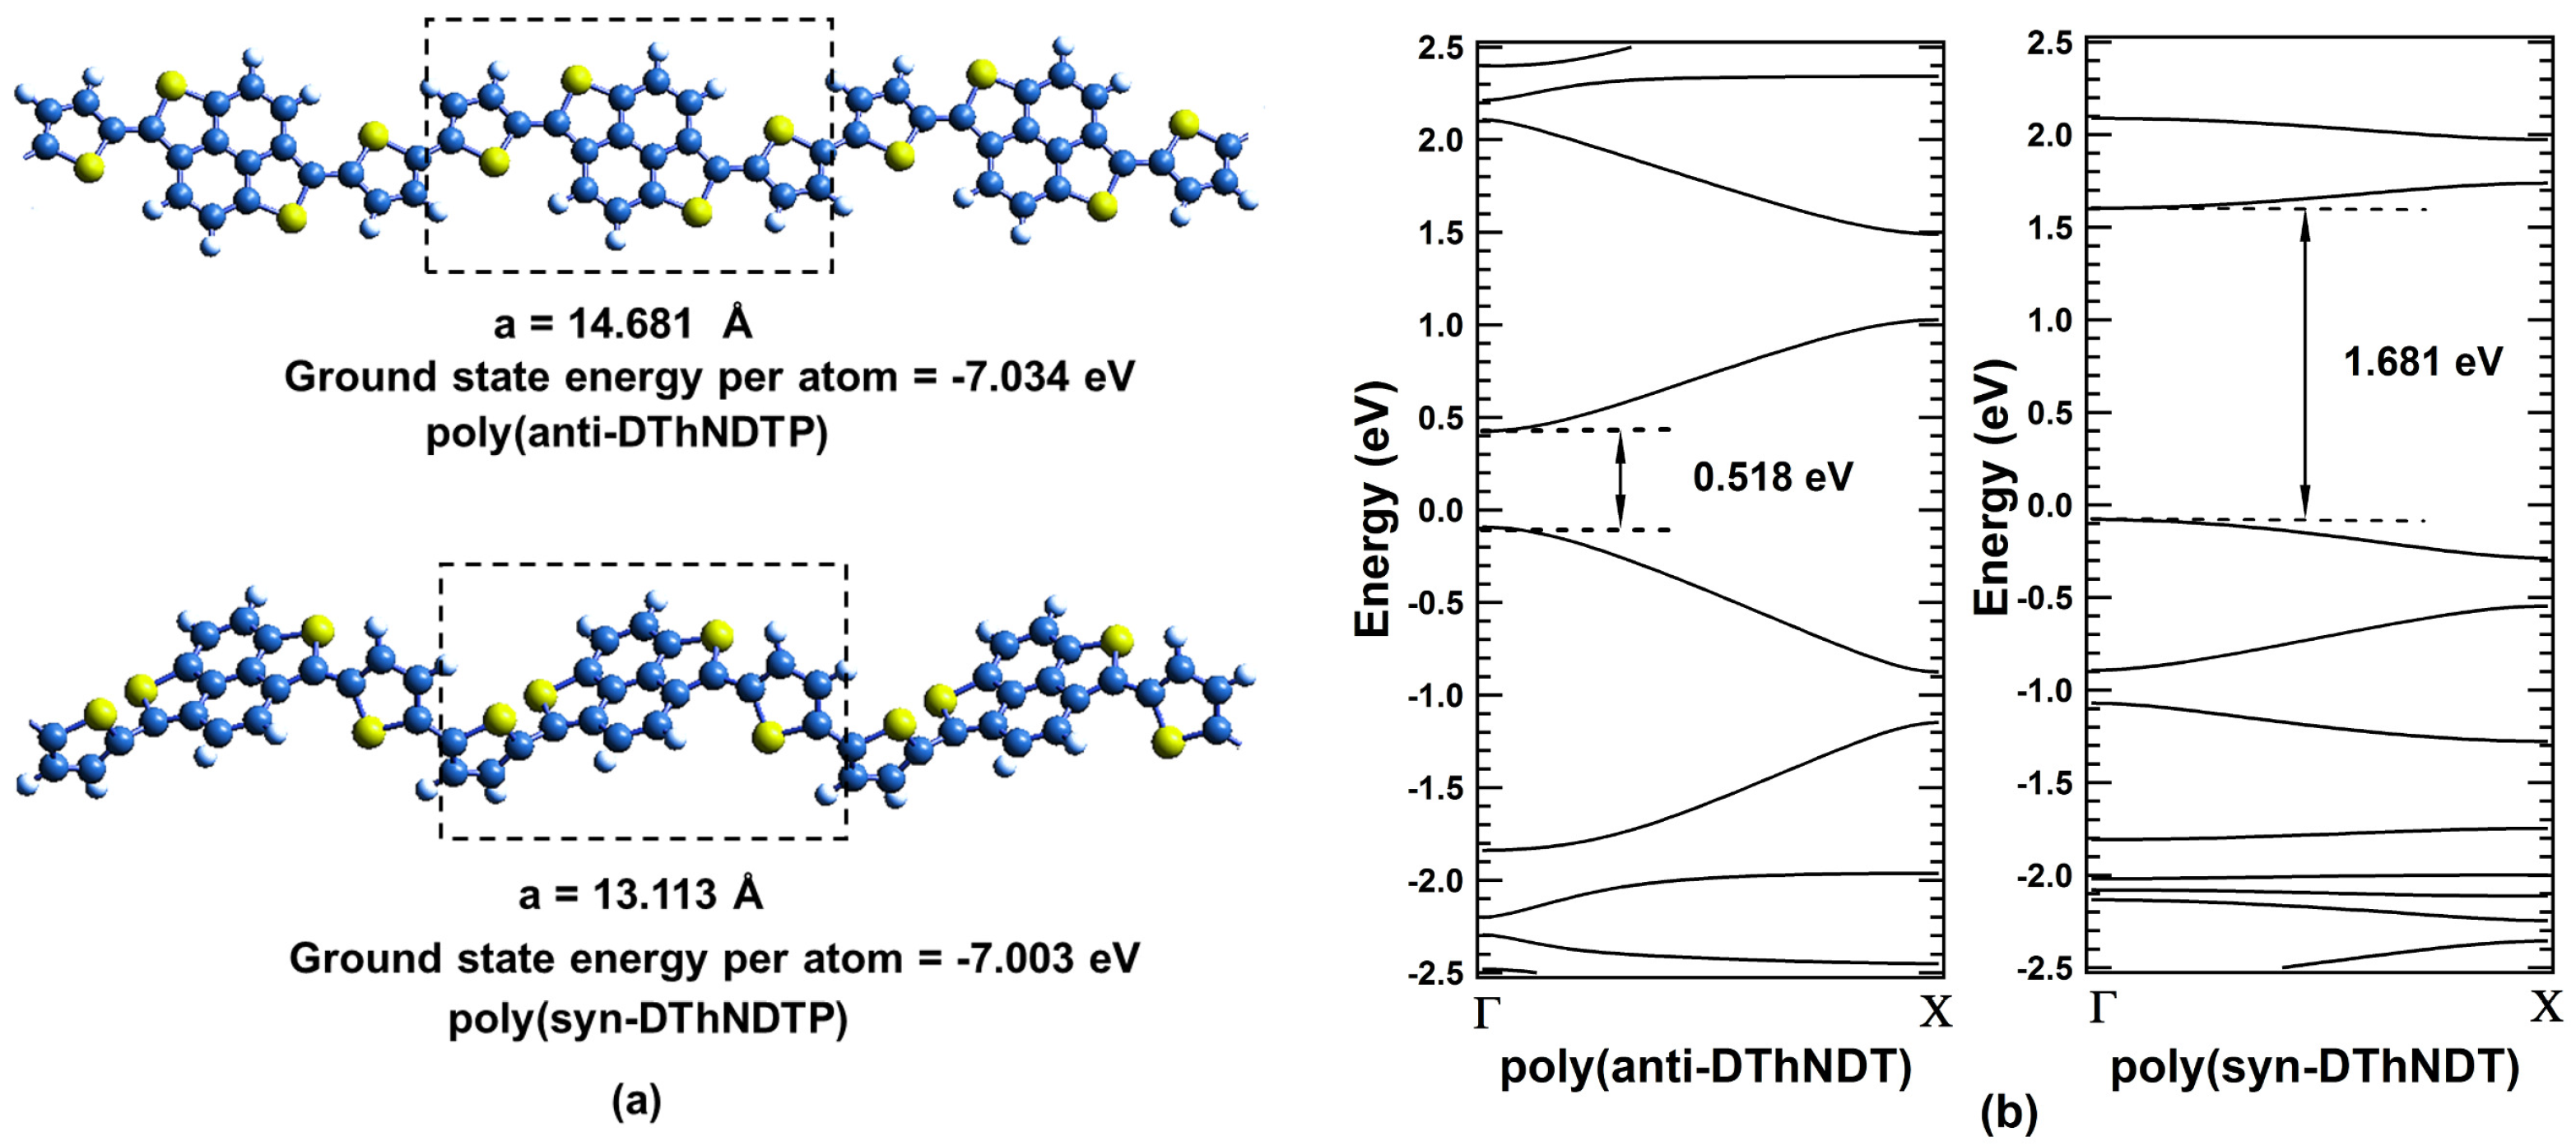
| DThNDT | polydithienyl naphthodithiophenes |
| ZGNRs | Zigzag graphene nanoribbons |
References
- Han, M.Y.; Özyilmaz, B.; Zhang, Y.; Kim, P. Energy Band-Gap Engineering of Graphene Nanoribbons. Phys. Rev. Lett. 2007, 98, 206805. [Google Scholar] [CrossRef] [PubMed]
- Li, X.; Wang, X.; Zhang, L.; Lee, S.; Dai, H. Chemically Derived, Ultrasmooth Graphene Nanoribbon Semiconductors. Science 2008, 319, 1229–1232. [Google Scholar] [CrossRef] [PubMed]
- Tseng, F.; Unluer, D.; Holcomb, K.; Stan, M.R.; Ghosh, A.W. Diluted chirality dependence in edge rough graphene nanoribbon field-effect transistors. Appl. Phys. Lett. 2009, 94, 223112. [Google Scholar] [CrossRef]
- Yan, J.-A.; Xian, L.; Chou, M.Y. Structural and Electronic Properties of Oxidized Graphene. Phys. Rev. Lett. 2009, 103, 086802. [Google Scholar] [CrossRef] [PubMed]
- Biel, B.; Blase, X.; Triozon, F.; Roche, S. Anomalous Doping Effects on Charge Transport in Graphene Nanoribbons. Phys. Rev. Lett. 2009, 102, 096803. [Google Scholar] [CrossRef] [PubMed]
- Lu, Y.; Guo, J. Band-gap of strained graphene nanoribbons. Nano Res. 2010, 3, 189. [Google Scholar] [CrossRef]
- Patra, D.; Lee, J.; Lee, J.; Sredojevic, D.N.; White, A.J.P.; Bazzi, H.S.; Brothers, E.N.; Heeney, M.; Fang, L.; Yoon, M.H.; et al. Synthesis of low band-gap polymers based on pyrrolo[3,2-d:4,5-d’]bisthiazole (PBTz) and thienylenevinylene (TV) for organic thin-film transistors (OTFTs). J. Mater. Chem. C 2017, 5, 2247–2258. [Google Scholar] [CrossRef]
- Hou, J.; Chen, H.-Y.; Zhang, S.; Li, G.; Yang, Y. Synthesis, Characterization, and Photovoltaic Properties of a Low band-gap Polymer Based on Silole-Containing Polythiophenes and 2,1,3-Benzothiadiazole. J. Am. Chem. Soc. 2008, 130, 16144–16145. [Google Scholar] [CrossRef] [PubMed]
- Bundgaard, E.; Krebs, F.C. Low band-gap polymers for organic photovoltaics. Sol. Energy Mater. Sol. Cells 2007, 91, 954–985. [Google Scholar] [CrossRef]
- Chen, W.-C.; Liu, C.-L.; Yen, C.-T.; Tsai, F.-C.; Tonzola, C.J.; Olson, N.; Jenekhe, S.A. Theoretical and Experimental Characterization of Small band-gap Poly(3,4-ethylenedioxythiophene methine)s. Macromolecules 2004, 37, 5959. [Google Scholar] [CrossRef]
- Ajayaghosh, A. Donor-acceptor type low band-gap polymers: Polysquaraines and related systems. Chem. Soc. Rev. 2003, 32, 181–191. [Google Scholar] [CrossRef] [PubMed]
- Hong, S.Y.; Lee, K.W. Small Band-Gap Polymers:Quantum-Chemical Study of Electronic Structures of Degenerate Π-Conjugated Systems. Chem. Mater. 2000, 12, 155–160. [Google Scholar] [CrossRef]
- Hong, S.Y. Zero Band-Gap Polymers:Quantum-Chemical Study of Electronic Structures of Degenerate Π-Conjugated Systems. Chem. Mater. 2000, 12, 495–500. [Google Scholar] [CrossRef]
- Hamid, S.H.; Usmani, A.M. Applications of Polymers in Led Devices. Polym.-Plast. Technol. Eng. 1984, 22, 155–176. [Google Scholar] [CrossRef]
- Yu, D.X. Light-Emitting Devices with Conjugated Polymers. Int. J. Mol. Sci. 2011, 12, 1575–1594. [Google Scholar] [PubMed]
- AlSalhi, M.S.; Alam, J.; Dass, L.A.; Raja, M. Recent Advances in Conjugated Polymers for Light Emitting Devices. Int. J. Mol. Sci. 2011, 12, 2036–2054. [Google Scholar] [CrossRef] [PubMed]
- Wang, C.; Xu, X.; Zhang, W.; Bergqvist, J.; Xia, Y.; Meng, X.; Bini, K.; Ma, W.; Yartsev, A.; Vandewal, K.; et al. Low band-gap Polymer Solar Cells With Minimal Voltage Losses. Adv. Energy Mater. 2016, 6, 1600148. [Google Scholar] [CrossRef]
- Mori, H.; Nonobe, H.; Nishihara, Y. Highly crystalline, low band-gap semiconducting polymers based on phenanthrodithiophene-benzothiadiazole for solar cells and transistors. Polym. Chem. 2016, 7, 1549. [Google Scholar] [CrossRef]
- Yiu, A.T.; Beaujuge, P.M.; Lee, O.P.; Woo, C.H.; Toney, M.F.; Fréchet, J.M.J. Side-Chain Tunability of Furan-Containing Low-Band-Gap Polymers Provides Control of Structural Order in Efficient Solar Cells. J. Am. Chem. Soc. 2012, 134, 2180–2185. [Google Scholar] [CrossRef] [PubMed]
- Woo, C.H.; Beaujuge, P.M.; Holcombe, T.W.; Lee, O.P.; Fréchet, J.M.J. Incorporation of Furan into Low Band-Gap Polymers for Efficient Solar Cells. J. Am. Chem. Soc. 2010, 132, 15547–15549. [Google Scholar] [CrossRef] [PubMed]
- Cheng, Y.J.; Yang, S.H.; Hsu, C.-S. Synthesis of Conjugated Polymers for Organic Solar Cell Applications. Chem. Rev. 2009, 109, 5868–5923. [Google Scholar] [CrossRef] [PubMed]
- Hou, J.; Chen, H.-Y.; Zhang, S.; Chen, R.I.; Yang, Y.; Wu, Y.; Li, G. Synthesis of a Low band-gap Polymer and Its Application in Highly Efficient Polymer Solar Cells. J. Am. Chem. Soc. 2009, 131, 15586–15587. [Google Scholar] [CrossRef] [PubMed]
- Ying, L.; Huang, F.; Bazan, G.C. Regioregular narrow-bandgap-conjugated polymers for plastic electronics. Nat. Commun. 2017, 8, 14047. [Google Scholar] [CrossRef] [PubMed]
- Huang, Y.; Xu, W.; Zhou, C.; Zhong, W.; Xie, R.; Gong, X.; Ying, L.; Huang, F.; Cao, Y. Synthesis of medium-bandgap Π-Conjugated polymers based on isomers of 5-Alkylphenanthridin-6(5H)-one and 6-Alkoxylphenanthridine. J. Polym. Sci., Part A: Polym. Chem. 2016, 54, 2119–2127. [Google Scholar] [CrossRef]
- Casado, J.; Joaquín Quirante, J.; Hernández, V.; López Navarrete, J.T.; Takimiya, K.; Otsubo, T. Raman and Computational Study of Two Dithienyl Naphthodithiophenes: Synthesis and Characterization of New Polymers Showing Low band-gap Optical and Electroactive Features. J. Phys. Chem. B 2004, 108, 7611–7619. [Google Scholar] [CrossRef]
- Hong, S.Y.; Kim, S.C. Towards Designing Environmentally Stable Conjugated Polymers with very Small Band-Gaps. Bull. Korean Chem. Soc. 2003, 24, 1649–1654. [Google Scholar]
- Kertesz, M. Structure and Electronic Structure of Low-Band-Gap Ladder Polymers. Macromolecules 1995, 28, 1475–1480. [Google Scholar] [CrossRef]
- Fabish, T.J. Electronic structure of polymers. Crit. Rev. Solid State Mater. Sci. 1979, 8, 383–420. [Google Scholar] [CrossRef]
- Salaneck, W.R.; Brédas, J.L. Electronic band structure of conjugated polymers. Synth. Met. 1994, 67, 15–22. [Google Scholar] [CrossRef]
- Duke, B.J.; O’Leary, B. The band structure of polymers: Its calculation and interpretation. Part 2. Calculation. J. Chem. Educ. 1988, 65, 379. [Google Scholar] [CrossRef]
- Duke, B.J.; O’Leary, B. The band structure of polymers: Its calculation and interpretation. Part 3. Interpretation. J. Chem. Educ. 1988, 65, 513. [Google Scholar] [CrossRef]
- Duke, C.B.; Ford, W.K. The electronic structure of polymers: Relation to molecular architecture. Int. J. Quantum Chem. 1983, 24, 597–608. [Google Scholar] [CrossRef]
- Kronig, R.D.L.; Penney, W.G. Quantum Mechanics of Electrons in Crystal Lattices. Proc. R. Soc. Lond. Ser. A 1931, 130, 499–513. [Google Scholar] [CrossRef]
- Deepika; Kumar, S.; Shukla, A.; Kumar, R. 2016 Origin of multiple band-gap values in single width nanoribbons. Sci. Rep. 2016, 6, 36168. [Google Scholar] [CrossRef] [PubMed]
- Kresse, G.; Furthmüller, J. Efficiency of ab-initio total energy calculations for metals and semiconductors using a plane-wave basis set. Comput. Mater. Sci. 1996, 6, 15–50. [Google Scholar] [CrossRef]
- Perdew, J.P.; Chevary, J.A.; Vosko, S.H.; Jackson, K.A.; Pederson, M.R.; Singh, D.J.; Fiolhais, C. Atoms, molecules, solids, and surfaces: Applications of the generalized gradient approximation for exchange and correlation. Phys. Rev. B 1992, 46, 6671. [Google Scholar] [CrossRef]
- Kresse, G.; Joubert, D. From ultrasoft pseudopotentials to the projector augmented-wave method. Phys. Rev. B 1999, 59, 1758. [Google Scholar] [CrossRef]


© 2018 by the authors. Licensee MDPI, Basel, Switzerland. This article is an open access article distributed under the terms and conditions of the Creative Commons Attribution (CC BY) license (http://creativecommons.org/licenses/by/4.0/).
Share and Cite
Wadhwa, P.; Kumar, S.; Kumar, T.J.D.; Shukla, A.; Kumar, R. Bandgap Tunability in a One-Dimensional System. Condens. Matter 2018, 3, 34. https://doi.org/10.3390/condmat3040034
Wadhwa P, Kumar S, Kumar TJD, Shukla A, Kumar R. Bandgap Tunability in a One-Dimensional System. Condensed Matter. 2018; 3(4):34. https://doi.org/10.3390/condmat3040034
Chicago/Turabian StyleWadhwa, Payal, Shailesh Kumar, T.J. Dhilip Kumar, Alok Shukla, and Rakesh Kumar. 2018. "Bandgap Tunability in a One-Dimensional System" Condensed Matter 3, no. 4: 34. https://doi.org/10.3390/condmat3040034
APA StyleWadhwa, P., Kumar, S., Kumar, T. J. D., Shukla, A., & Kumar, R. (2018). Bandgap Tunability in a One-Dimensional System. Condensed Matter, 3(4), 34. https://doi.org/10.3390/condmat3040034