1. Introduction
Over the past two decades, simple elemental metal superconductors have attracted significant attention from the scientific community [
1,
2,
3,
4,
5]. In contrast to traditional superconducting materials such as cuprates and iron-based compounds, which suffer from complex synthesis, difficult compositional regulation, and high costs, elemental metal superconductors exhibit enormous potential for large-scale fabrication. They can be prepared over large areas using mature techniques such as melt quenching, vapor deposition, and electrochemical exfoliation, providing a solid foundation for industrial applications. In high-pressure physics research, the superconducting properties of elemental metals under extreme conditions offer crucial experimental analogs for understanding Earth’s interior physics (e.g., the core superconductivity hypothesis). At the fundamental science level, although simple elemental metals like lithium, magnesium, aluminum, and lanthanum are typically categorized as ‘conventional superconductors’ within the BCS theory framework, recent studies have revealed unconventional superconducting behaviors under extreme conditions such as high pressure and strong magnetic fields. Recently, the teams led by Changqing Jin and Xiancheng Wang made new breakthroughs in elemental metal superconductivity research. Experiments demonstrated that metallic titanium exhibits superconductivity with a transition temperature
K under high pressure, updating the record for the highest transition temperature in elemental metal superconductors [
6]. Subsequently, the groups of Xianhui Chen and Changqing Jin independently reported superconducting transition temperatures of 36 K and 30 K for elemental scandium under pressure [
7,
8]. Tuson Park et al. investigated superconductivity in elemental yttrium under high pressure [
9], while Masaki Mito et al. studied superconductivity in elemental barium [
10]. These advancements have significantly reinvigorated research enthusiasm for elemental metal superconductors.
Group IV elements (carbon, silicon, germanium, tin, and lead) have attracted significant attention in the fields of materials science and condensed matter physics due to their rich and diverse physical and chemical properties. Elements in this group share the same outer electron configuration of , yet their atomic radii increase with increasing atomic number. Light elements such as carbon, silicon, and germanium, characterized by smaller atomic radii, can form bonds through various modes including or hybridization, thus exhibiting extremely rich diversity in crystal structures. In contrast, heavy elements like tin (Sn) and lead (Pb), with larger atomic radii and stronger metallicity, tend to form relatively simple close-packed structures via metallic bonding between atoms. Additionally, they show high structural stability at high temperatures, and the formation conditions for their metastable structures are stringent. These factors result in relatively limited related research, and current exploration into their structures and relevant physical properties under different pressures remains in its infancy.
Lead has long been an important material in the practical application of superconductors. As a superconducting element, it can maintain a simple structure under standard atmospheric pressure and exhibits excellent superconducting properties under high pressure, thus being widely used in lead-based superconductors and lead compounds. Investigating the superconducting properties of lead plays a crucial role in the research of all lead-based superconductors. There are relatively few reports on the phase transitions of lead. As one of the Group IV elements, lead does not possess the structural characteristics of carbon, silicon, germanium, and tin. Experiments have shown that lead has a face-centered cubic (fcc) metallic structure under normal pressure [
11], and a series of phase transitions—from fcc to hexagonal close-packed (hcp) structure and then to body-centered cubic (bcc) structure—occur with increasing pressure [
11,
12]. Shouxin Cui et al. studied the high-pressure phase transitions of lead through first-principles calculations, finding that it transforms from fcc to hcp at 16 GPa and from hcp to bcc at 109 GPa, with a focus on structural properties such as phase transition pressure, lattice parameters, and volume changes [
13]. Chen Qing-Yuan investigated the effect of compressive strain (0–10%) on the electronic structure and superconducting properties of lead in the fcc structure. However, no pressure range was provided, nor were the electronic structure and superconducting properties of the hexagonal and body-centered cubic phases of metallic lead under pressure studied [
14]. In summary, there have been no relevant reports on the research of the electronic structure and superconducting properties of elemental metallic lead under pressure, and revealing its electronic structure, superconducting properties, and their variation laws is an important subject.
In this paper, the first-principles calculation method is adopted to study the crystal structure and superconducting properties of lead under high pressure. The research shows that during the compression process, the lattice structure of lead remains stable with unchanged metallicity, while presents a decreasing trend. Therefore, the appropriate required in practical production can be achieved by applying suitable pressure. The analysis of electronic properties (such as the electronic density of states at the Fermi level) explains the physical origin of the changes in the electron-phonon coupling constant and . Our calculation results have important guiding significance for future experimental research and practical applications of lead-based superconductors.
2. Computational Method
The calculations of the geometric optimization, electronic properties, electron-phonon coupling (EPC) parameters, and superconducting properties of elemental metallic lead were performed using the QUANTUM ESPRESSO software (version 7.4.1) package, which is based on density functional theory (DFT), linear response theory, and the pseudopotential plane-wave method [
15].
To ensure the accuracy and reliability of calculations, the convergence criterion for the total energy in self-consistent electronic structure calculations is set to Ryd, while the force convergence criterion for structural optimization is Ryd. The exchange-correlation interaction between electrons is described by adopting the Perdew–Zunger (PZ) type local density approximation (LDA) exchange-correlation functional, and the pseudopotential type is ultrasoft pseudopotential. The plane-wave energy cutoff is 50 Ryd, and the charge density cutoff is 500 Ryd.
In the self-consistent calculation of the ground-state charge density, the reciprocal-space k-point mesh for Brillouin zone integration was a
-centered
grid, and the Methfessel–Paxton smearing technique with a parameter of 0.02 Ryd was applied [
16]. Within the framework of density functional perturbation theory, a
q-point grid was chosen to compute the dynamical matrices and perturbation potentials [
17].
When calculating the superconducting transition temperature
, the calculation is based on the McMillan equation modified by Allen–Dynes [
18,
19], and the formula is expressed as follows:
where
denotes the Coulomb pseudopotential,
is the electron-phonon coupling constant, and
represents the logarithmic mean frequency. The latter two quantities are intimately related to the Eliashberg spectral function
[
20]:
3. Results and Discussion
3.1. Crystal Structures and Phase Transitions
Lead, as a typical Group IVA metallic element, exhibits rich phase transition behaviors and evolutions of electronic properties under pressure in its crystal structure [
21]. The following sections investigate the crystal structure characteristics of elemental lead and illustrate the phase transitions, space group evolutions, and physical mechanisms under pressure.
Figure 1 presents the crystal structures of lead under different pressures, namely (a) face-centered cubic (fcc) structure, (b) hexagonal close-packed (hcp) structure, and (c) body-centered cubic (bcc) structure. At ambient pressure, lead exhibits metallic behavior with a close-packed face-centered cubic (fcc) structure, where the coordination number of lead atoms is 12 and the space group is
. In the low-pressure region (below tens of GPa), the unit cell volume and lattice constants gradually decrease as pressure increases. The crystal structure remains fcc (
), and pressure shortens the Pb–Pb bond length at a variation rate of approximately 0.5%/GPa.
With the increase of pressure, lead undergoes a series of phase transitions. When the pressure reaches tens of GPa, it transforms from the face-centered cubic (fcc) structure to the hexagonal close-packed (hcp) structure; the hcp phase has the space group , and the coordination number remains 12. As the pressure continues to increase, at approximately 100 GPa, lead transforms from the hcp structure to the body-centered cubic (bcc) structure with the space group .
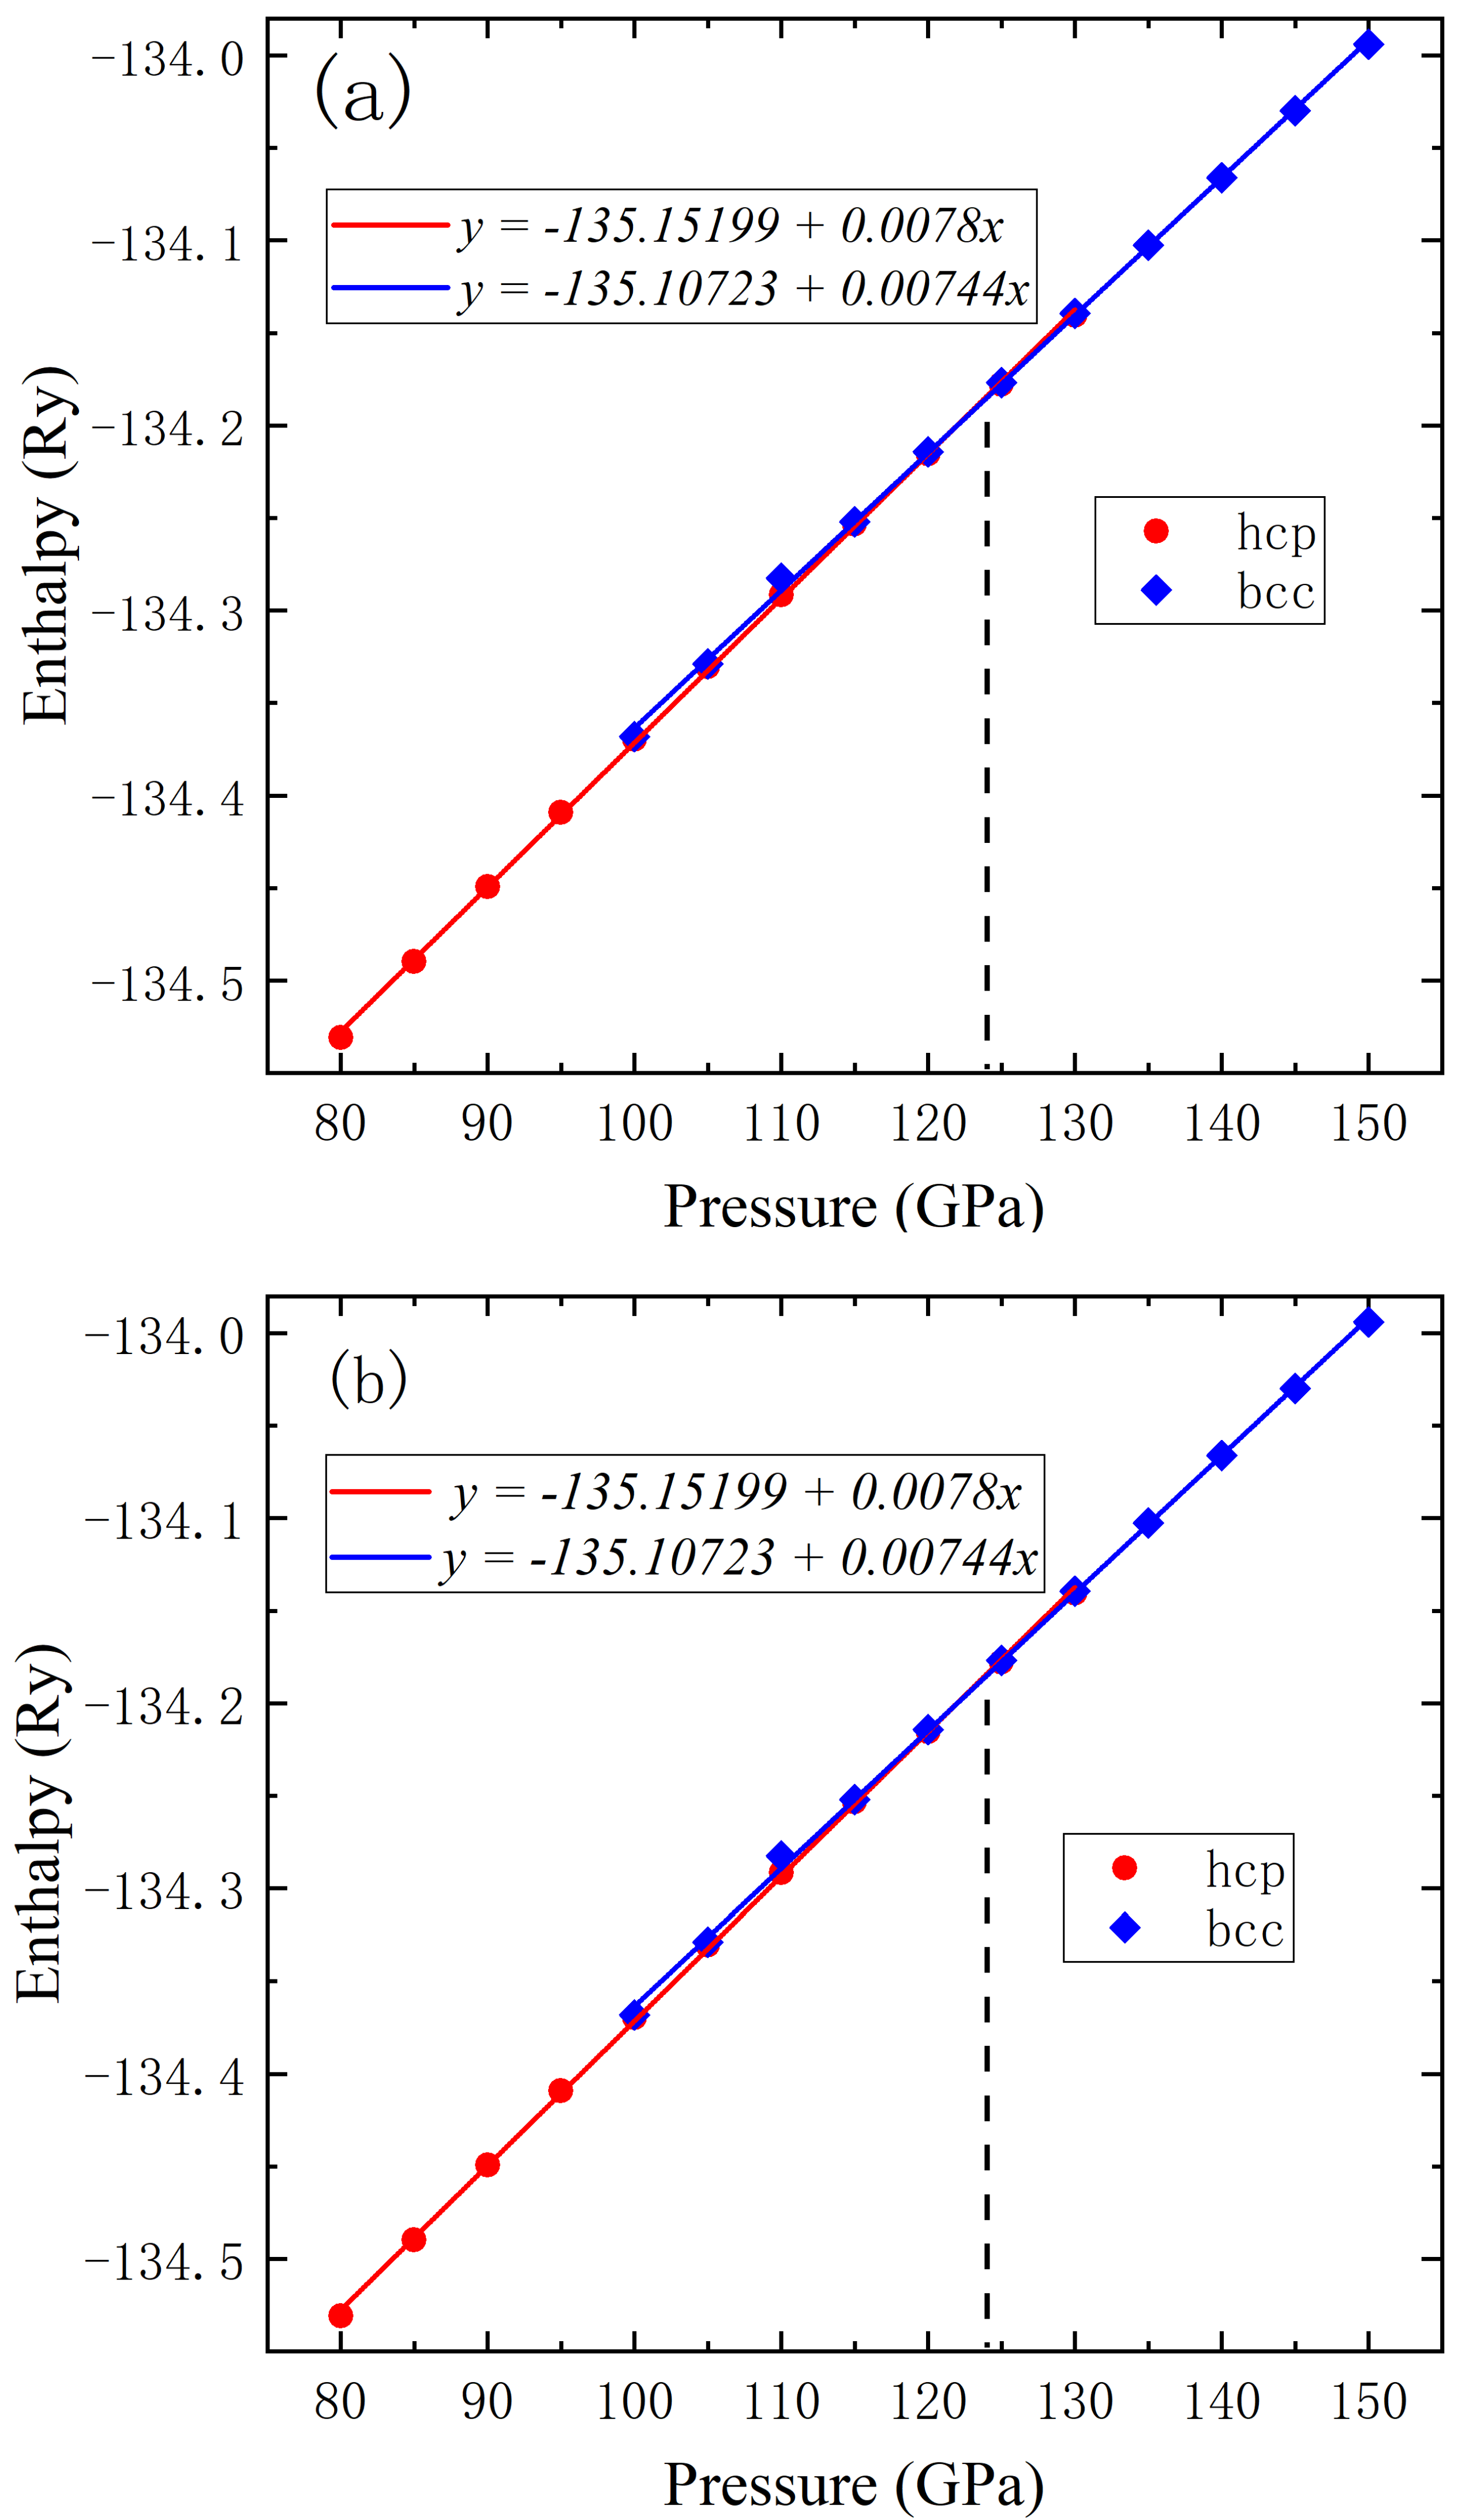
To determine the critical pressure for phase transition computationally, we calculated the enthalpy of elemental metallic lead as a function of pressure for both fcc and hcp structures, as shown in
Figure 2a, where blue squares denote fcc data and red circles represent hcp data. Near the phase transition point, linear fittings were performed for fcc and hcp data, respectively, yielding the following equations:
Consequently, the critical pressure for the phase transition from the fcc to hcp structure is determined to be approximately 11 GPa. Similarly, the calculated pressure-dependent enthalpies of the hcp and bcc phases are presented in
Figure 2b, with red circles representing hcp data and blue diamond markers denoting bcc data. Near the transition point, linear fits were performed on both datasets, yielding the following equations:
Above all, the phase transition pressure from the hcp to bcc structure is determined to be approximately 124 GPa. The obtained phase transition pressure data are in good agreement with experimental results [
21,
22,
23] and is also consistent with previous theoretical data [
12,
24,
25].
3.2. Electronic Properties
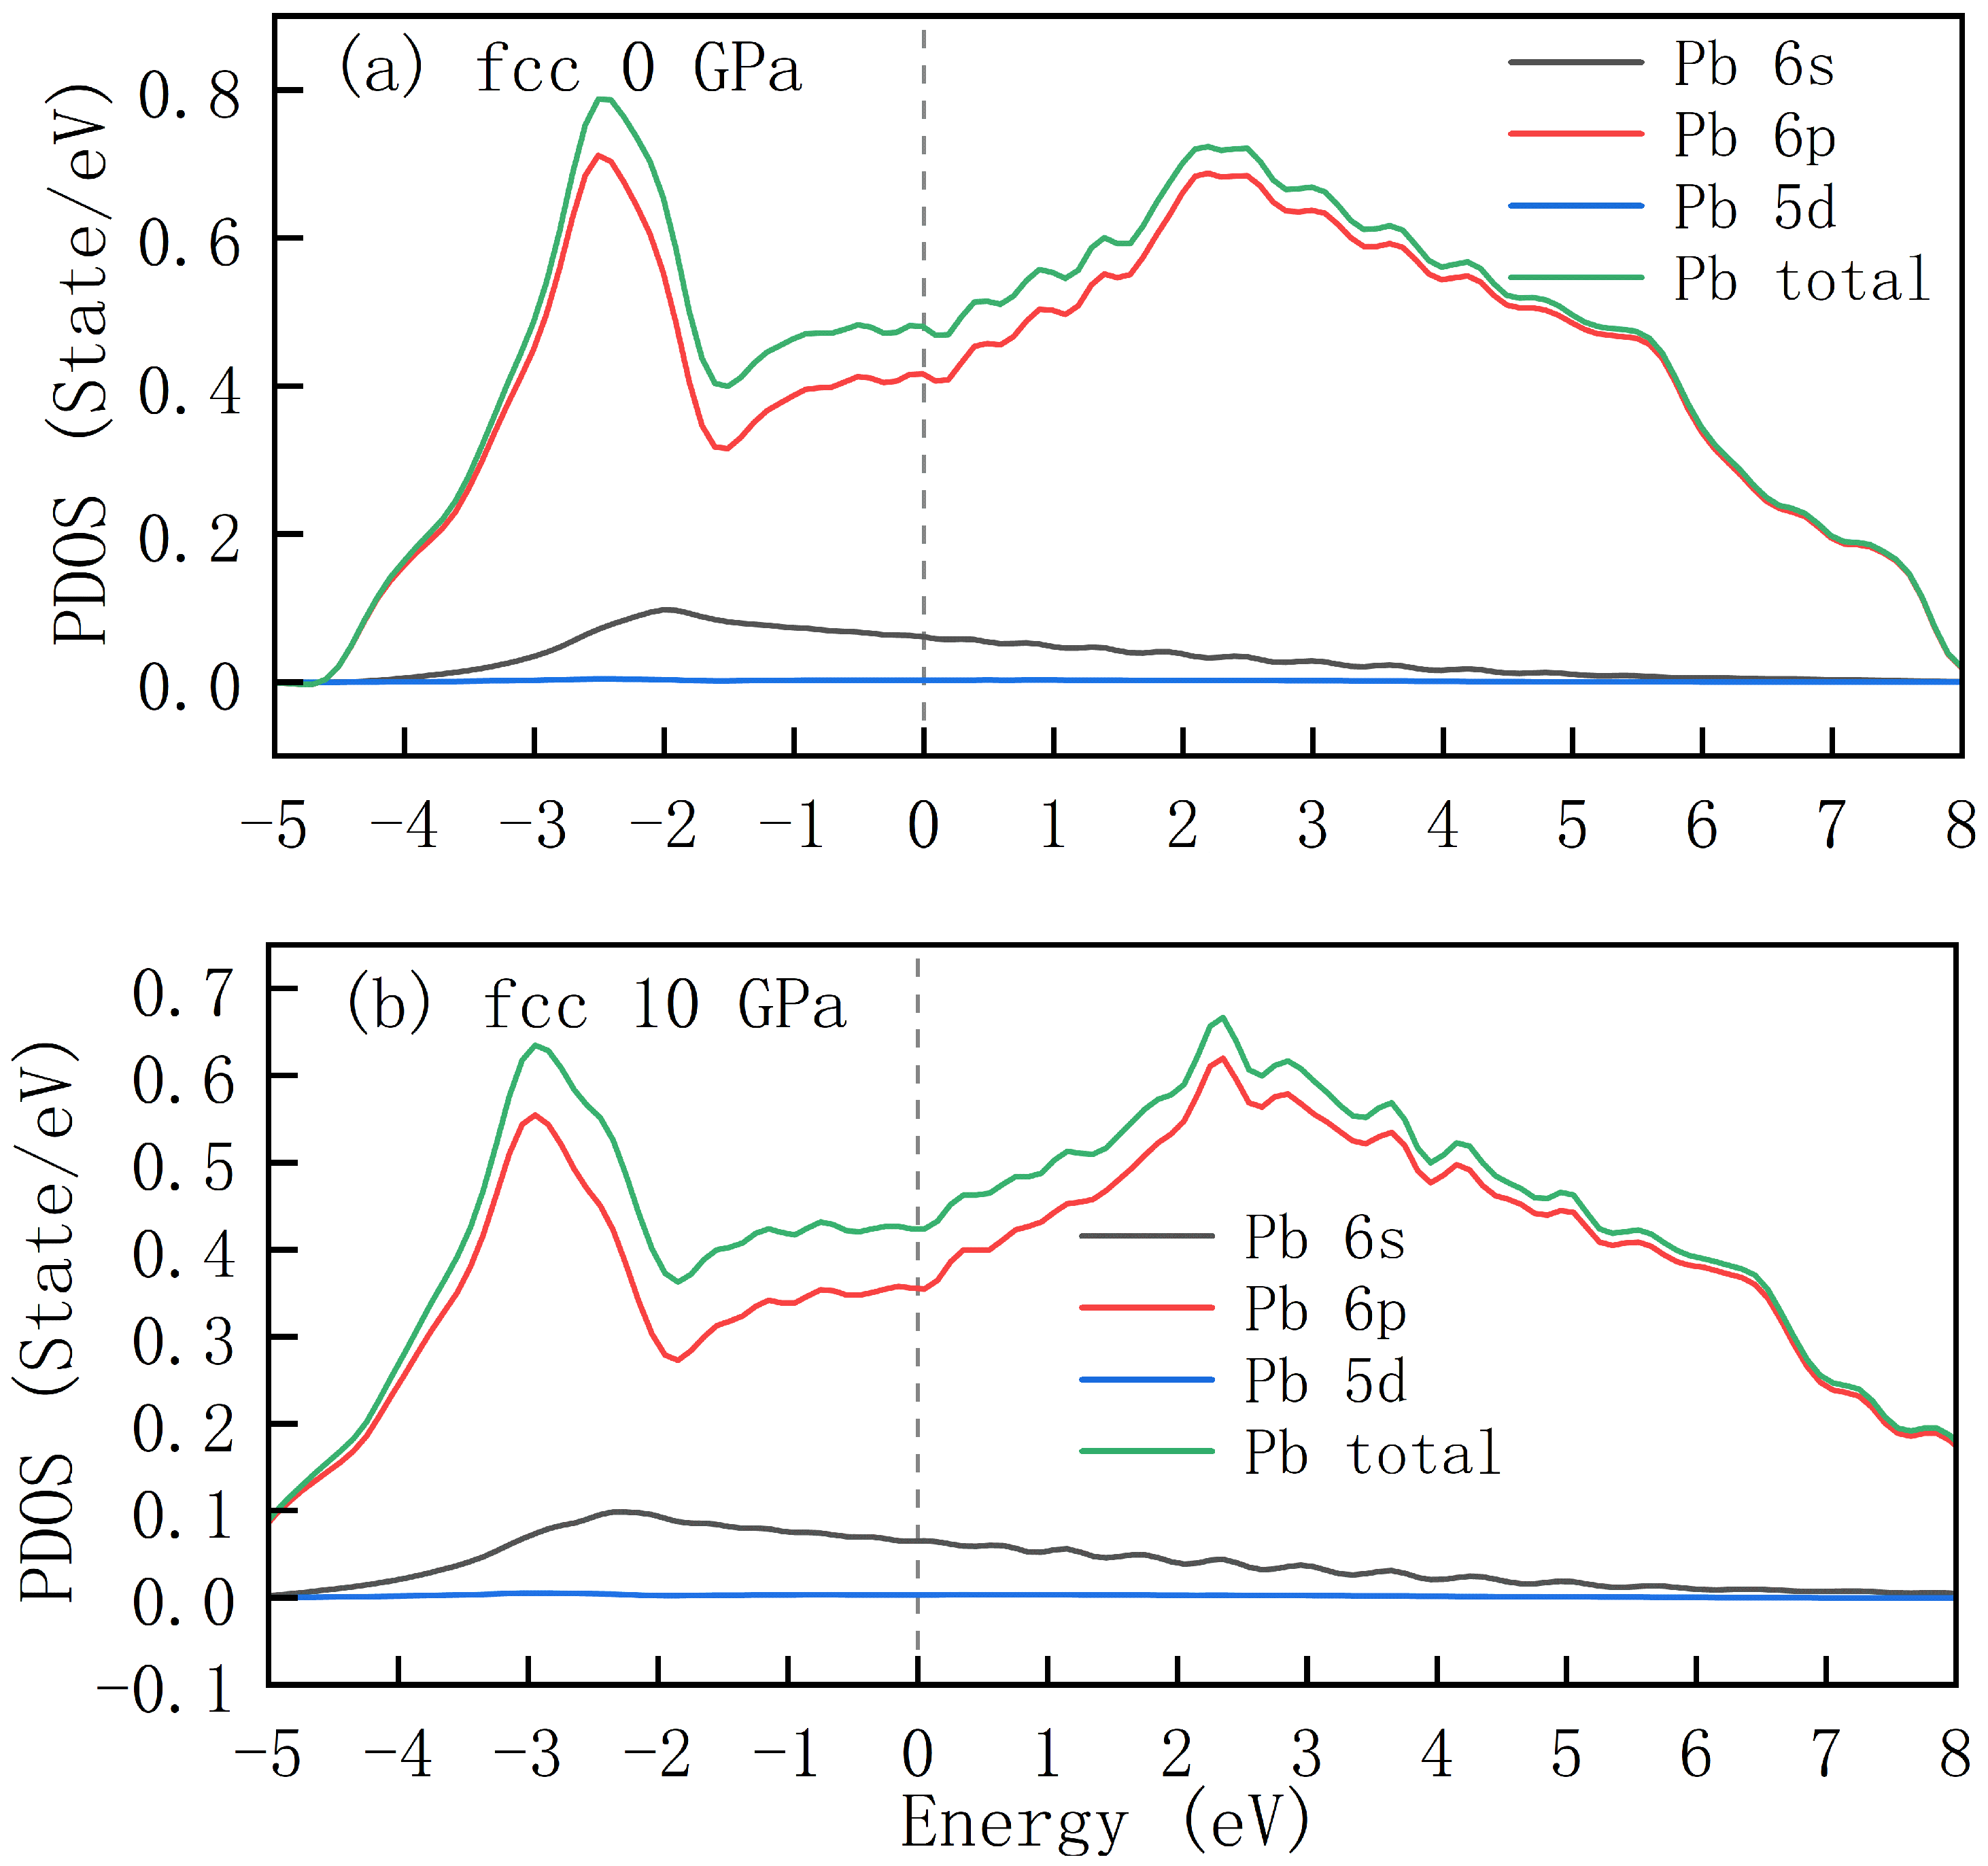
Figure 3 demonstrates the projected density of states (PDOS) for fcc-structured lead under pressure conditions of 0 GPa and 10 GPa. These plots enable an intuitive understanding of the energy-distribution patterns of different lead atomic orbitals (
) as well as the total density of states. Under both pressure conditions, the curve corresponding to the
orbital (black) exhibits a relatively low overall density of states, with a relatively flat distribution pattern. In the lower energy region, there exists a certain density of states, which gradually decreases with increasing energy, indicating that
electrons are relatively concentrated in the low-energy region in terms of energy distribution. The red curve represents the density of states of the
orbital. At both 0 GPa and 10 GPa, the density of states of the
orbital exhibits distinct peaks in the energy range of approximately −3 eV to 2 eV, serving as one of the primary contributors to the total density of states. The density of states (DOS) for the
orbital corresponding to the blue curve remains at an extremely low level, nearly aligning with the horizontal axis, indicating that it makes minimal contribution to the total density of states. With the increase in pressure, the curves of individual orbitals and the total density of states exhibit certain modifications in shape, peak positions, and heights, while maintaining overall similar profiles. Comparison of the total DOS at 0 GPa and 10 GPa reveals that the value of the total DOS at the Fermi level decreases from 0.48 states/eV to 0.43 states/eV.
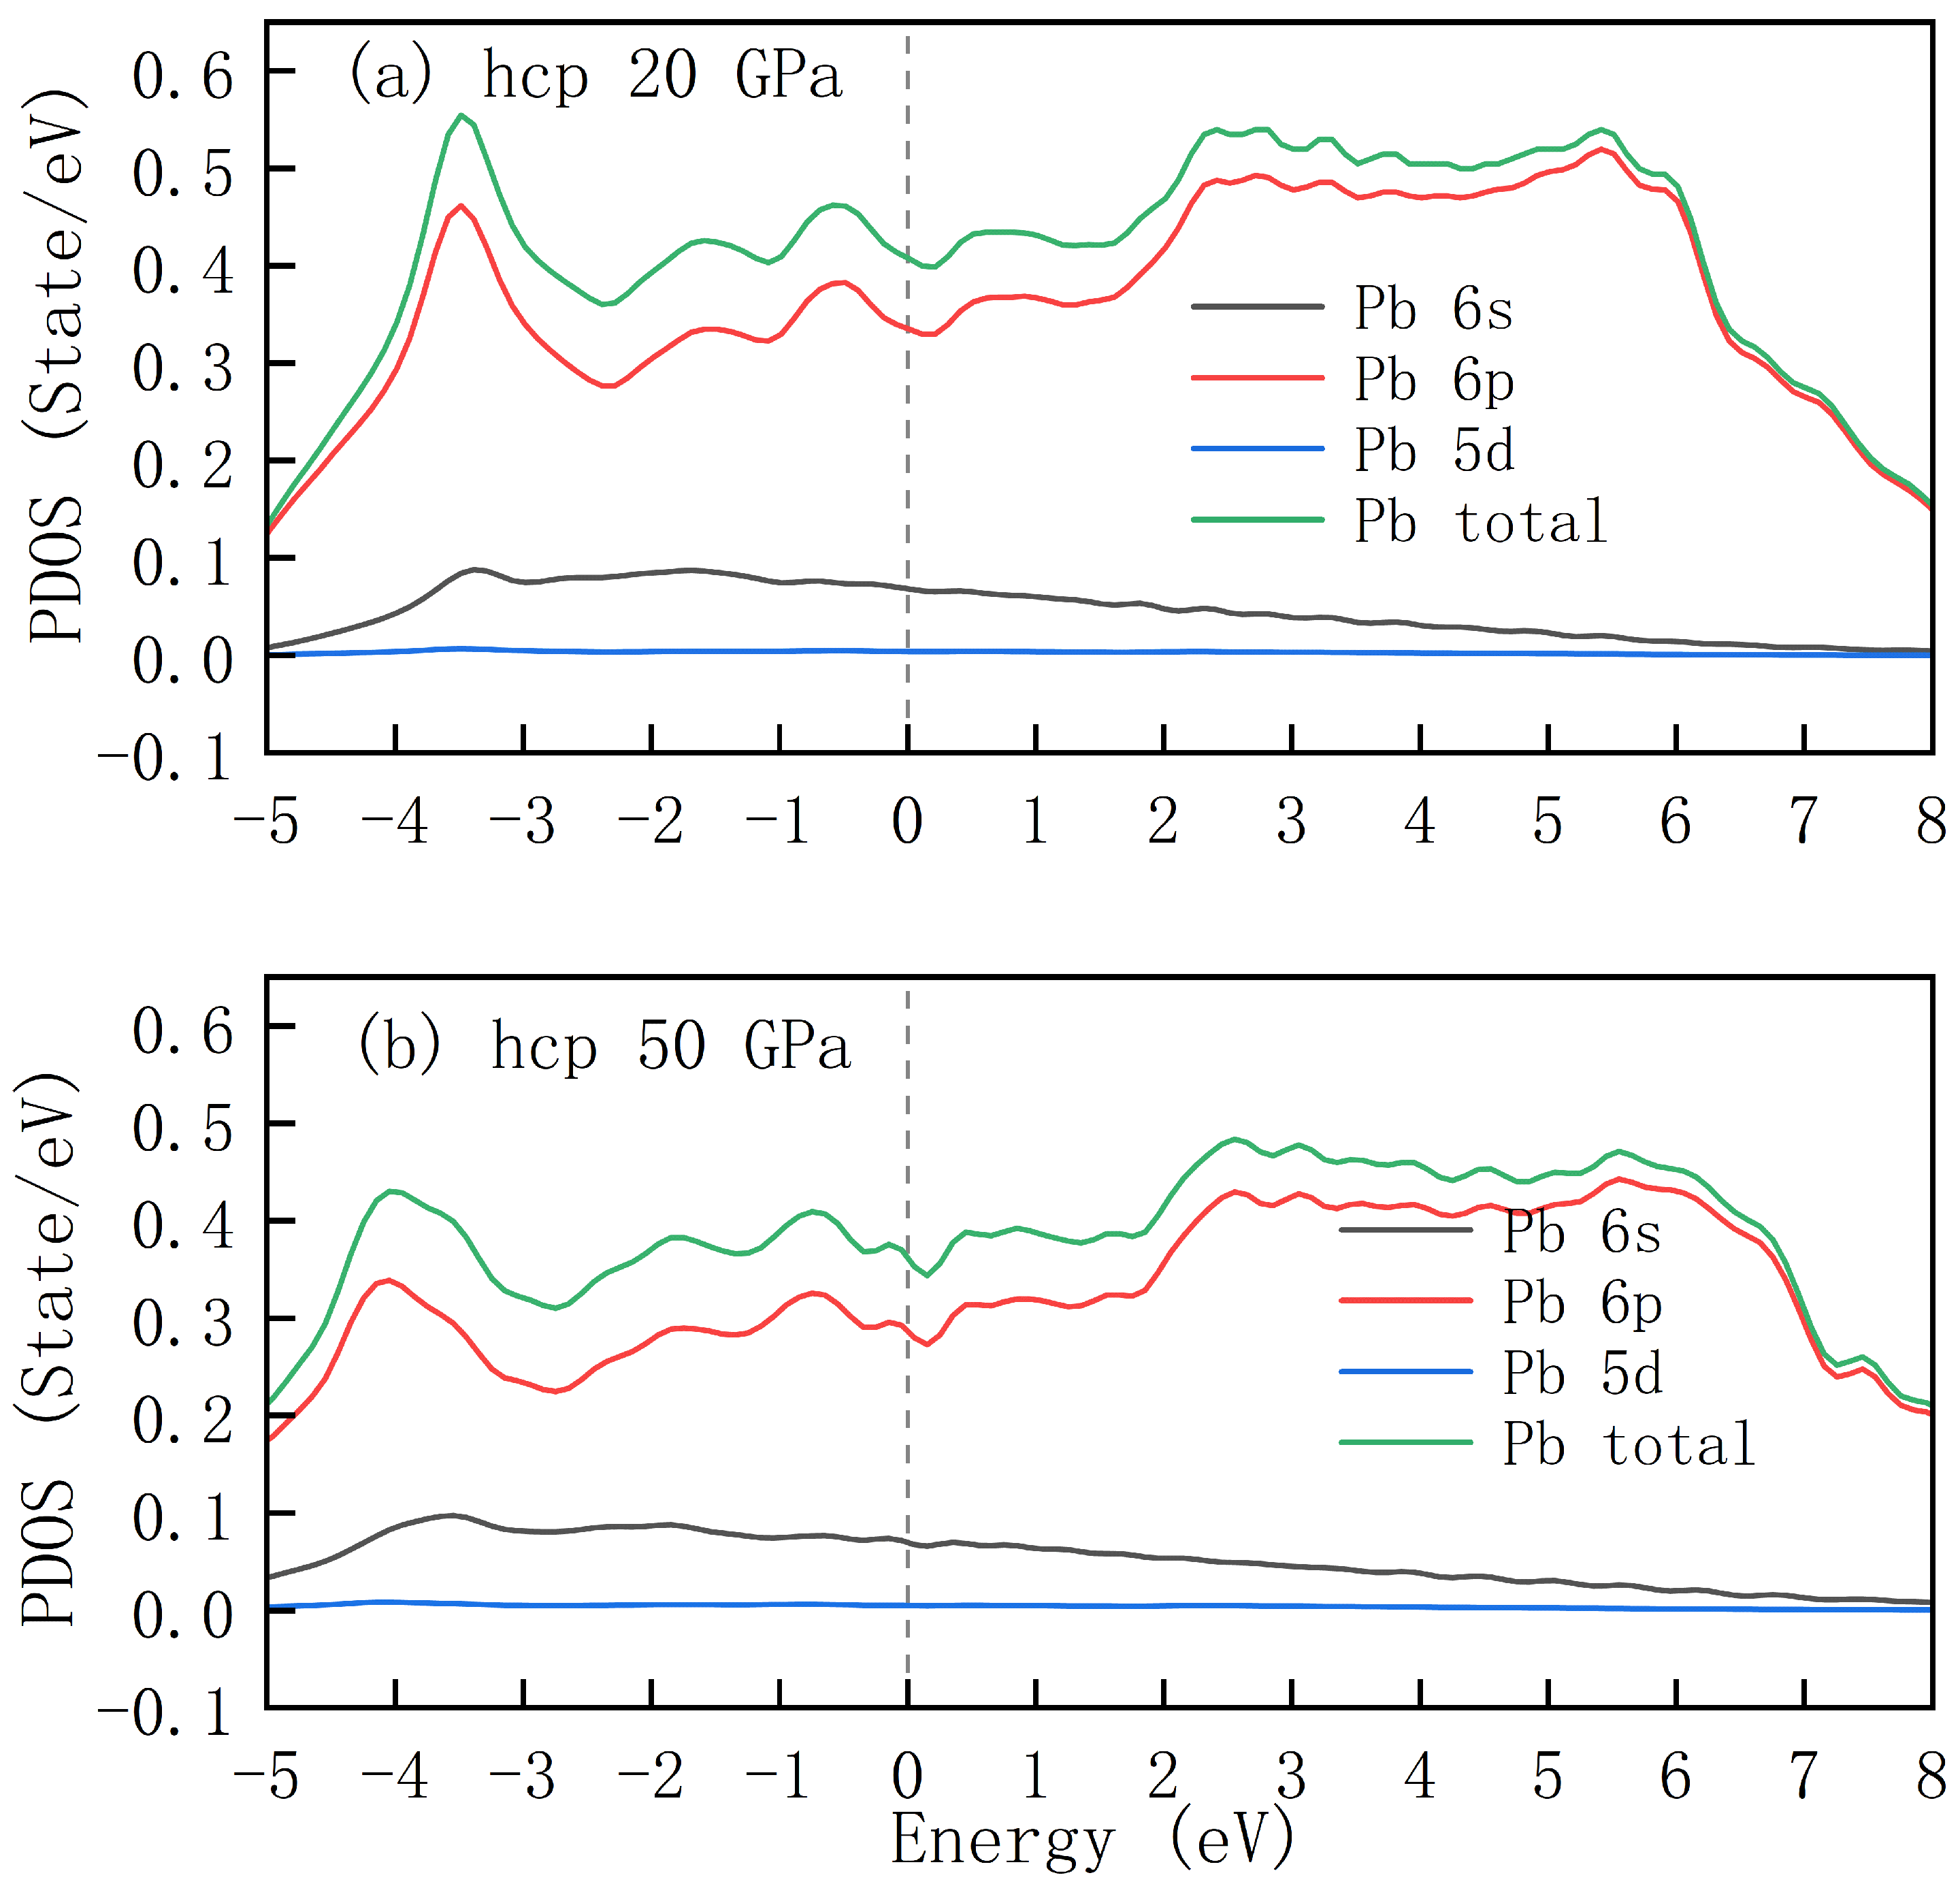
At approximately 11 GPa, elemental metallic lead undergoes a structural transition from the fcc to the hcp phase. To investigate the influence of pressure on the electronic structure of lead, we selected two pressure points, 20 GPa and 50 GPa, to compare the variations in the electronic density of states.
Figure 4 presents the PDOS of lead with an hcp structure under pressures of 20 GPa and 50 GPa. These plots enable an intuitive understanding of the energy-distribution patterns of different lead atomic orbitals (
) and the total density of states. It can be observed that at 20 GPa, the curves of individual orbitals and the total DOS exhibit a relatively high degree of similarity to those of the fcc structure in terms of shape, peak positions, and heights. However, at 50 GPa, the DOS curves demonstrate noticeable modifications. However, in general, the
orbital of lead remains as one of the primary contributors to the DOS, while the DOS of the
orbital corresponding to the blue curve consistently stays at an extremely low level. Comparison of the total DOS at 20 GPa and 50 GPa reveals that the value of the total DOS at the Fermi level decreases from 0.41 states/eV to 0.36 states/eV.
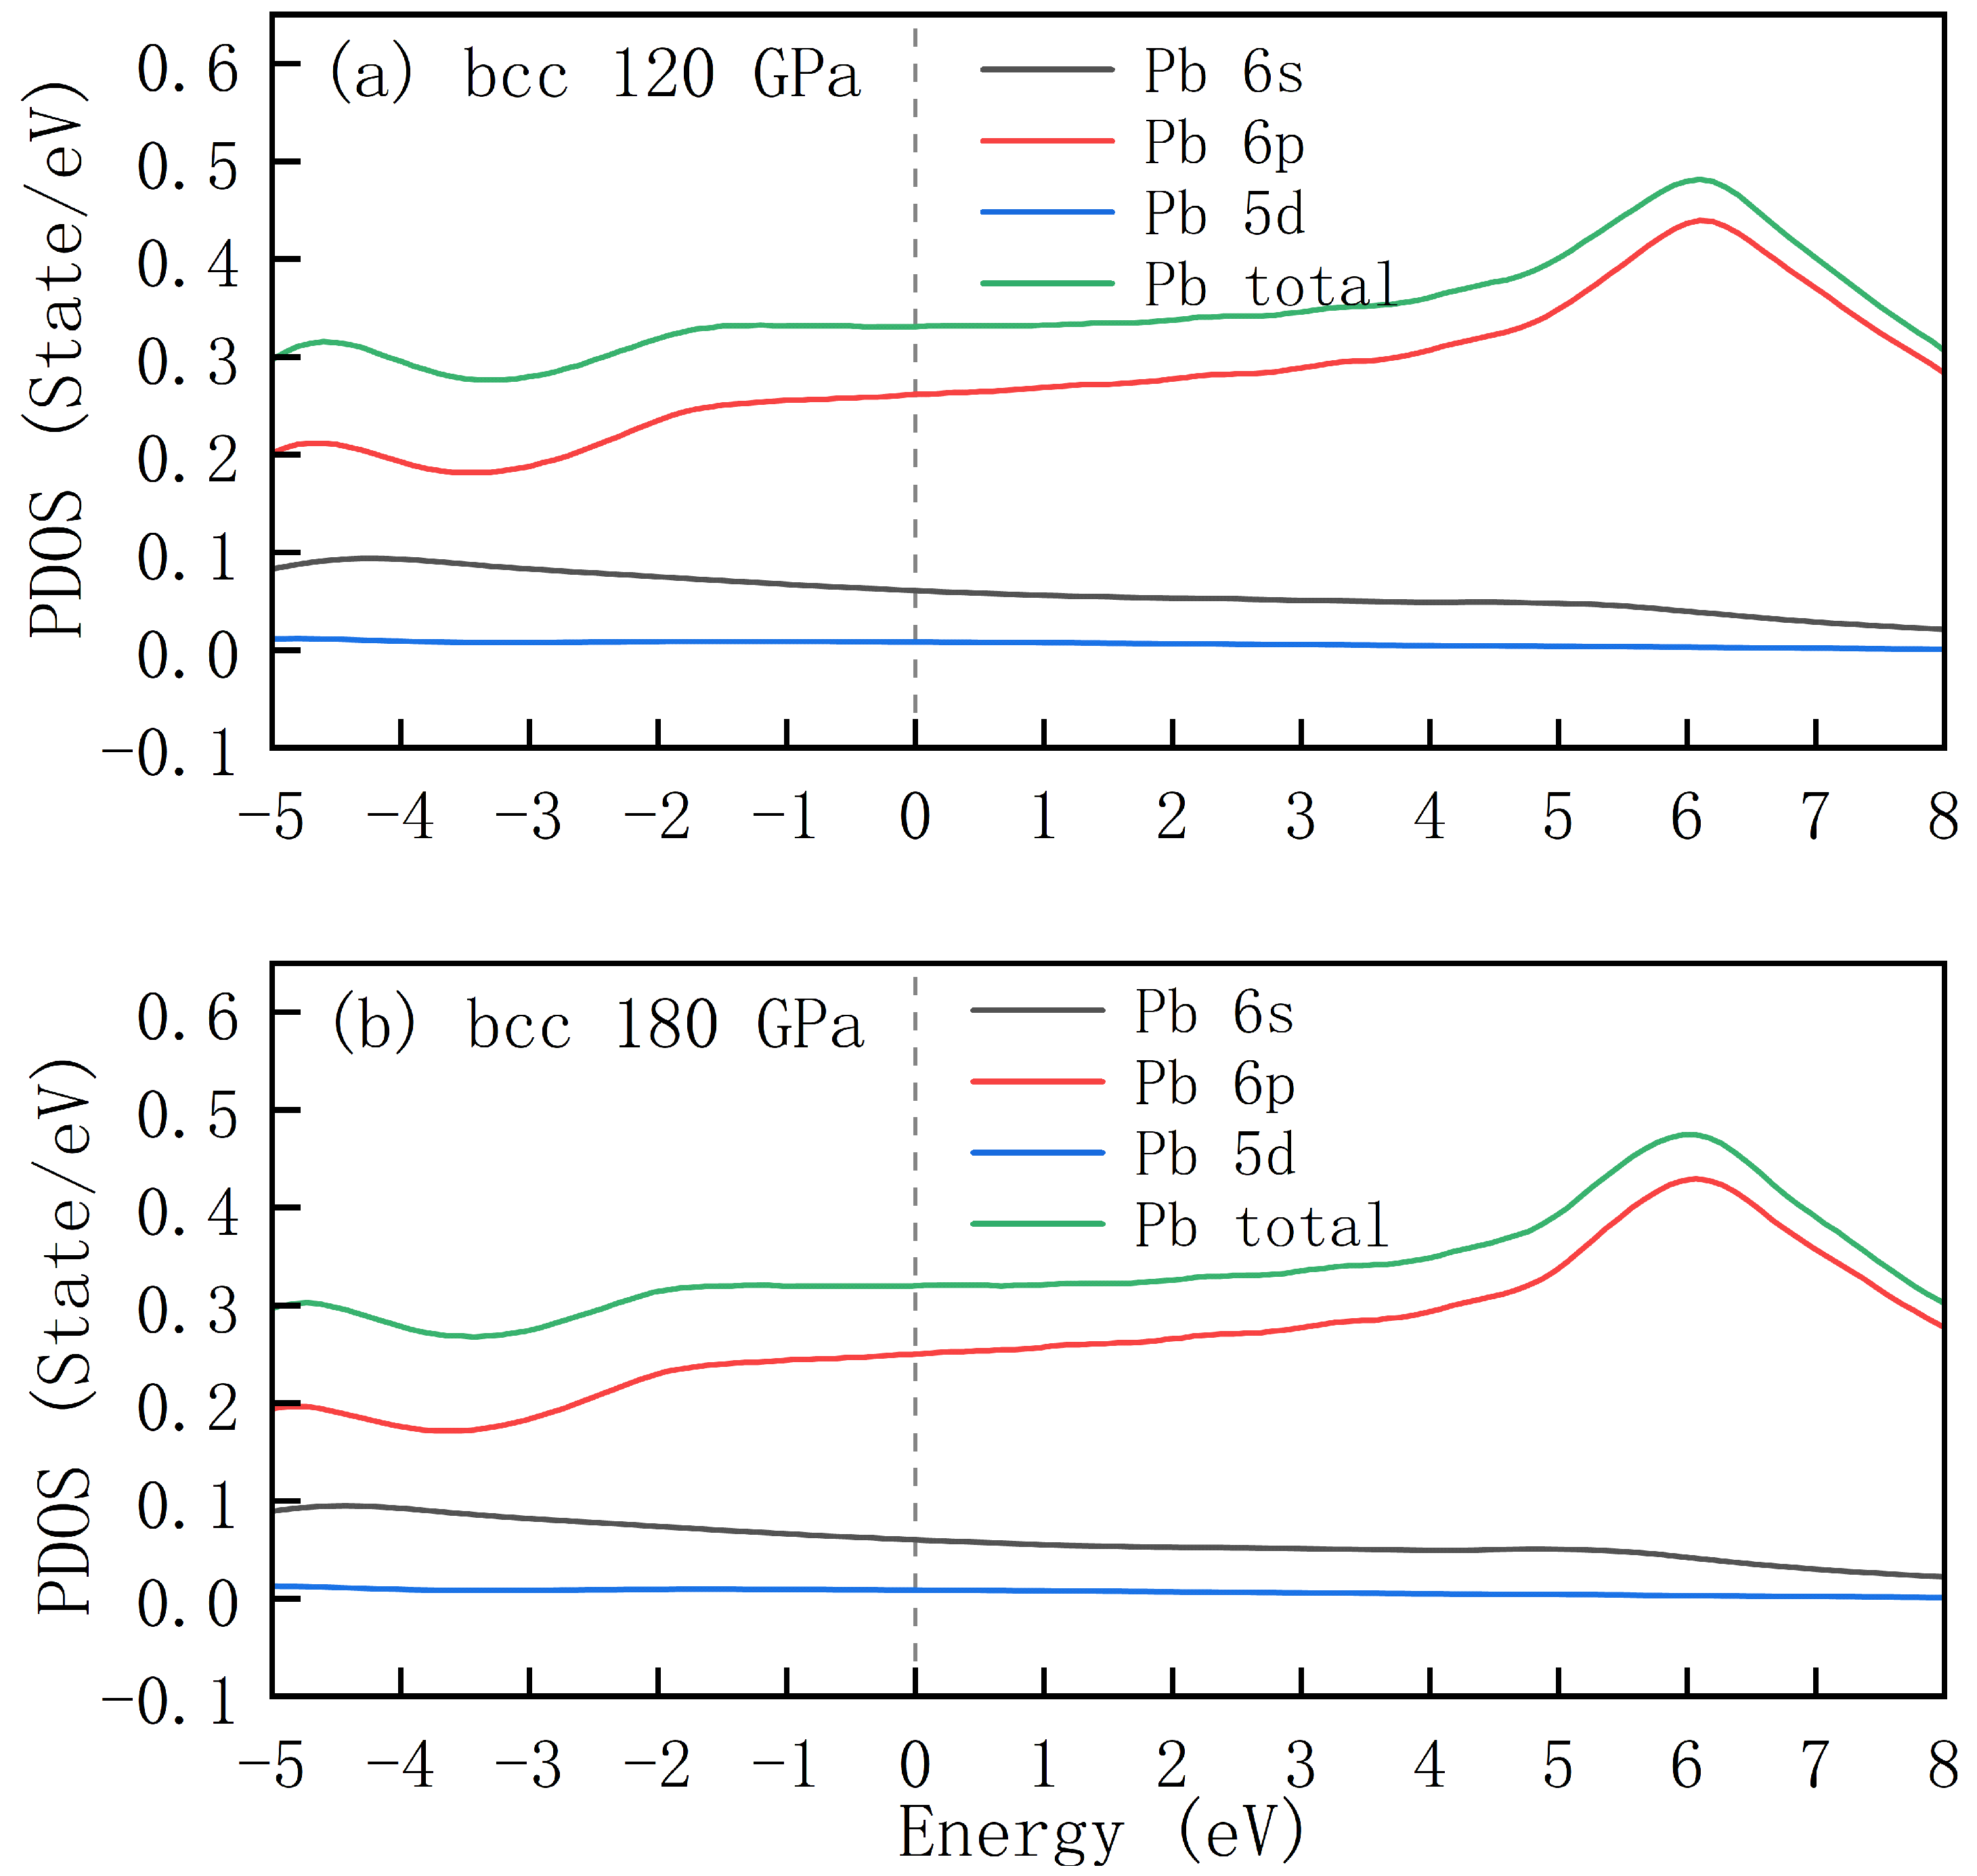
Figure 5 shows the PDOS of bcc-structured lead under pressures of 120 GPa and 180 GPa, with the Fermi level set to 0 eV. By comparing DOS distributions under different pressure conditions, the influence of high pressure on the electronic structure of lead can be analyzed.
The total DOS (green curves) under different pressures shows that the overall profiles at 120 GPa and 180 GPa are similar, yet exhibit slight discrepancies: as the pressure increases from 120 GPa to 180 GPa, the value of the total density of states at the Fermi level decreases from 0.32 states/eV to 0.28 states/eV, indicating that high pressure leads to a reduction in the electron density of states near the Fermi surface. Additionally, the peak positions of the density of states in the high-energy region (>2 eV) exhibit a slight leftward shift, which may be attributed to pressure-induced renormalization of the band structure.
Overall, the DOS distribution characteristics of bcc-structured lead are consistent with those of the previously discussed fcc and hcp structures. The orbital serves as the primary contributor, the orbital makes a partial contribution, while the orbital exhibits a negligible contribution. The increase in pressure leads to a decrease in the density of states at the Fermi level, accompanied by alterations in the energy distribution and occupation of electronic states. This phenomenon provides a theoretical basis at the electronic level for understanding the physicochemical properties of lead under high pressure, such as electrical conductivity and structural stability.
3.3. Phonon Spectra and Superconductivity
In
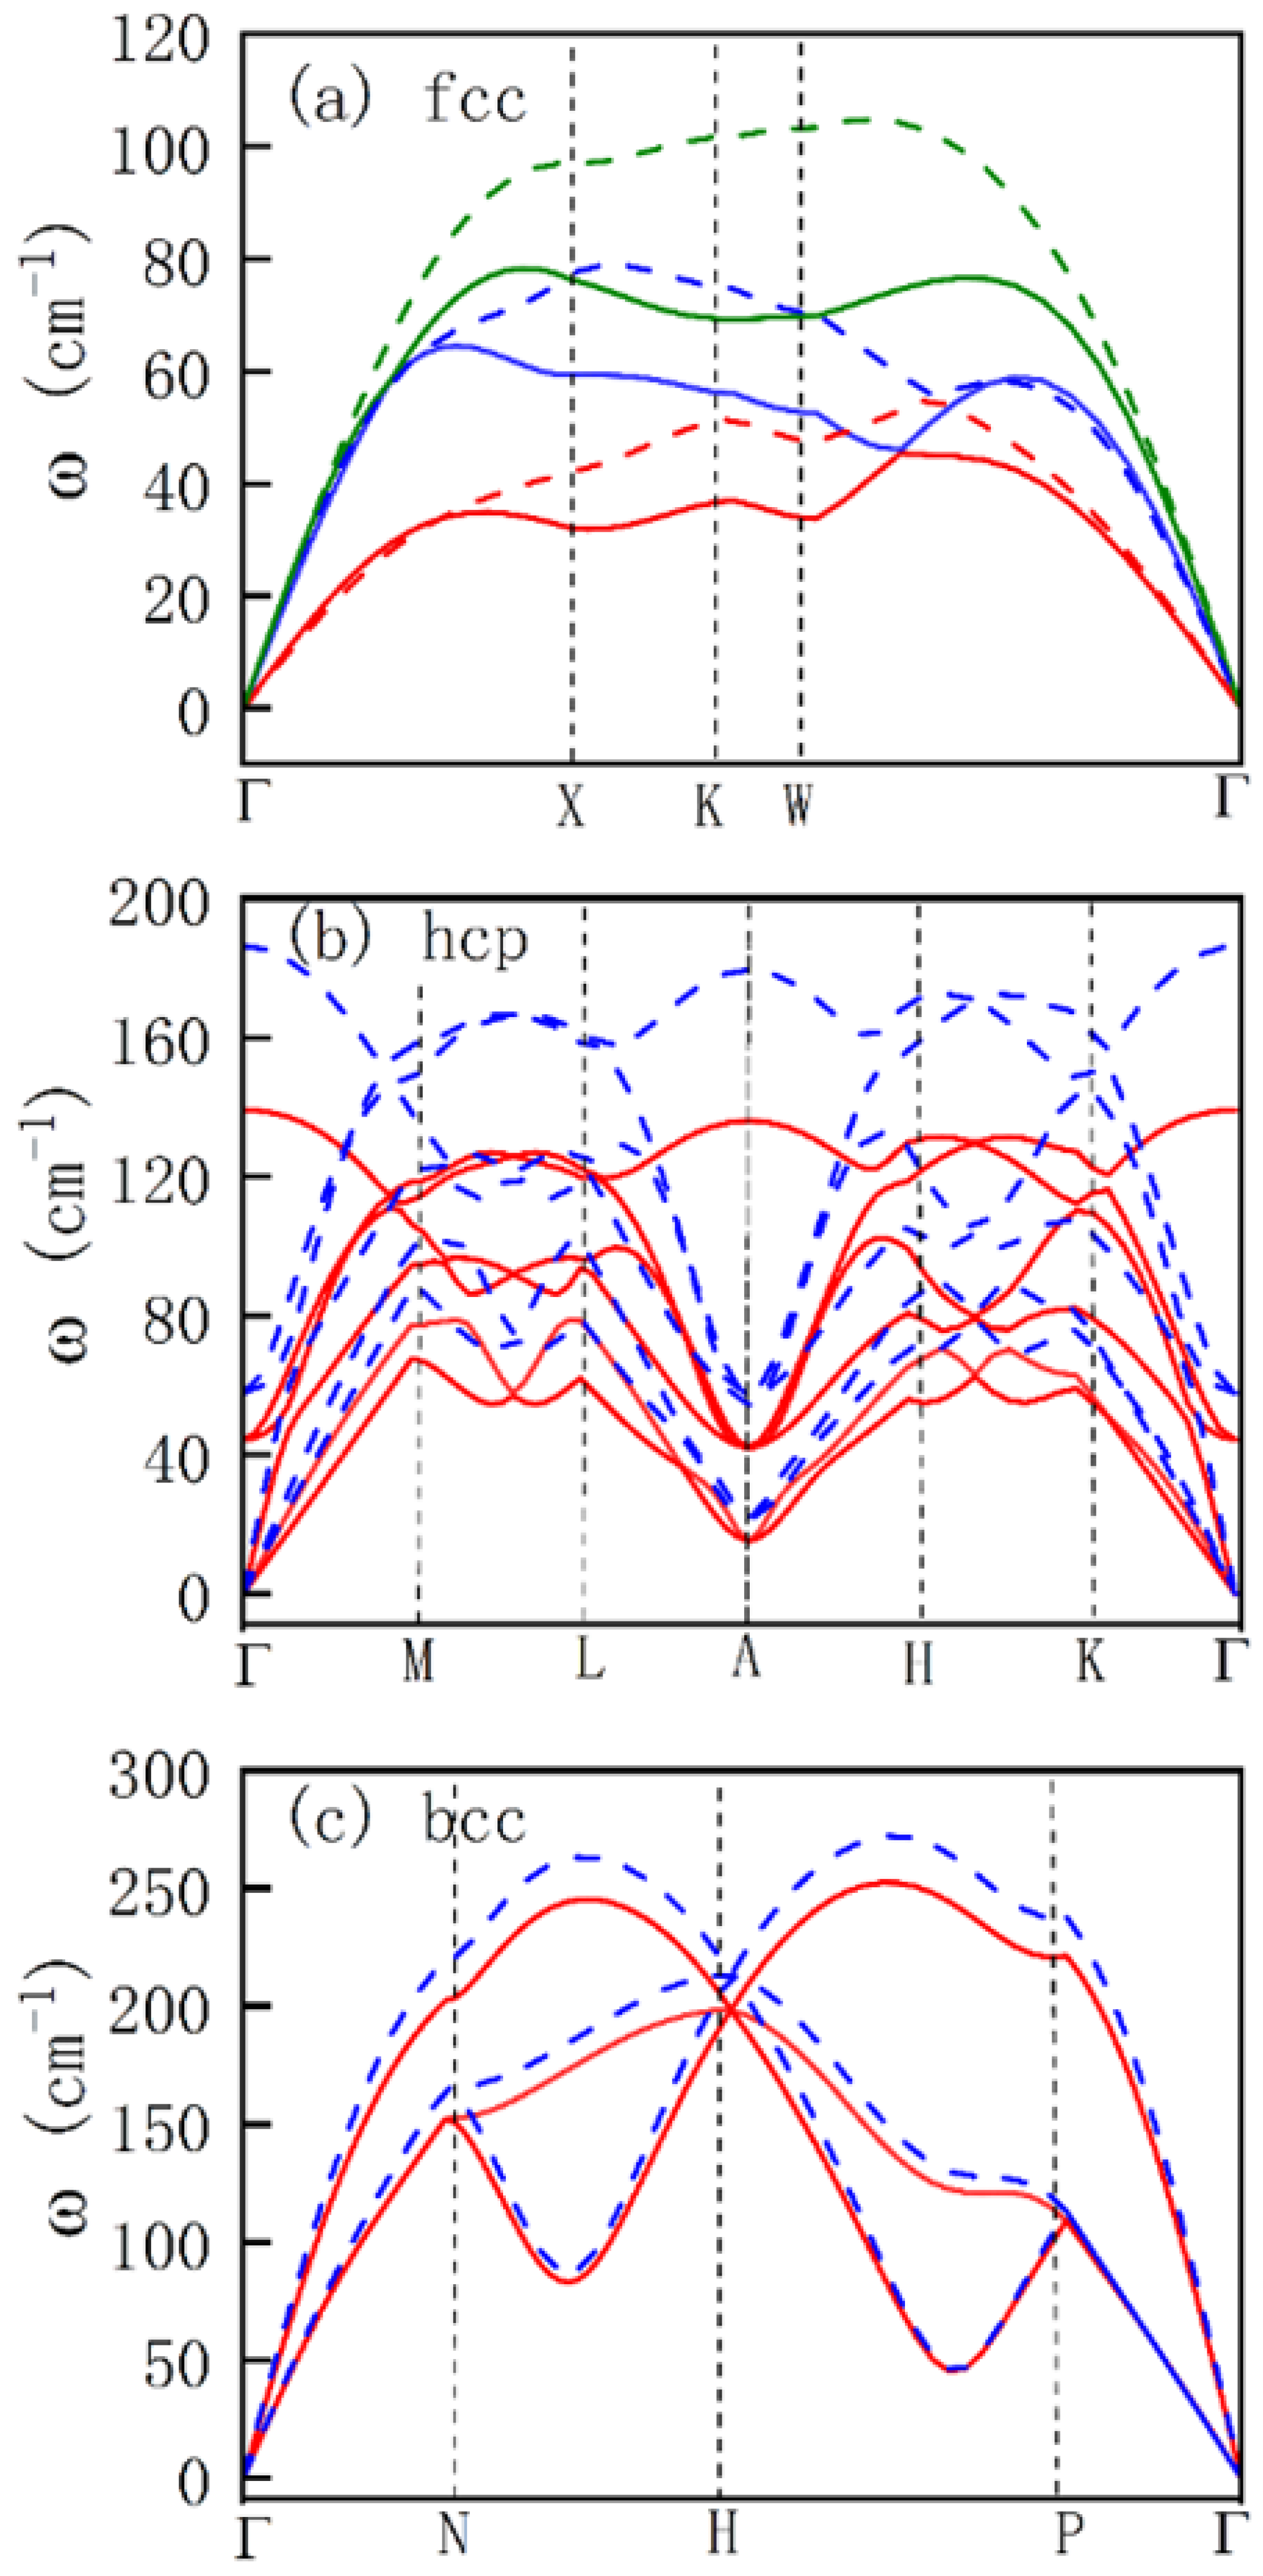
Figure 6, the phonon spectra of elemental metallic lead under different pressures are presented. Under the corresponding pressures, we calculated the electron-phonon coupling constants and superconducting transition temperatures, as listed in
Table 1. For the fcc phase (0–10 GPa) in
Figure 6a, the phonon spectra exhibit the symmetry characteristic of typical face-centered cubic metals. The frequencies of each phonon branch at high-symmetry points (such as
) increase linearly with pressure, reflecting the enhanced vibrational stiffness resulting from the shortening of interatomic bond lengths. Here, the DOS at the Fermi level is high (0.48–0.43 states/eV,
Figure 3), and the electron-phonon coupling is dominated by the
orbitals. Notably, negligible phonon softening is observed, corresponding to the trend of decreasing superconducting transition temperature
with increasing pressure.
For the hcp structure in
Figure 6b, the phonon spectra exhibit distinct anisotropy, with the difference in phonon frequencies along the c-axis (
–
A) and within the plane (
–
M) increasing significantly. When pressure increases from 20 GPa to 50 GPa, the magnitude of frequency increase for low-frequency phonon branches (such as acoustic branches) is greater than that for high-frequency branches, which is related to the strengthened interlayer interactions in the hcp structure. At this point, the DOS further decreases to 0.41–0.36 states/eV (
Figure 4), and the electron-phonon coupling constant
decreases accordingly, leading to a continuous decline in
. For the bcc structure,
Figure 6c presents the phonon spectra at 120 and 180 GPa, which exhibit higher symmetry with significantly increased frequencies, reflecting the strong repulsive interactions caused by the close packing of atoms under high pressure. Meanwhile, the DOS continues to decrease to 0.32–0.28 states/eV (
Figure 5), and the electron-phonon coupling constant
further decreases, leading to a continuous decline of
to nearly zero.
The frequency distribution of the phonon spectra directly affects the electron-phonon coupling strength
and the logarithmic average frequency, thus determining
. Contributions from low-frequency phonons: In the fcc and hcp phases, the frequencies of low-frequency acoustic branches (<100
) increase with pressure, leading to an increase in the logarithmic average frequency. However, since the decrease in DOS dominates,
still decreases, ultimately causing
to decline. Compared to the fcc and hcp phases, the acoustic branch frequencies at 180 GPa and 120 GPa in the bcc phase are very close, and the magnitude of the decrease in the electron-phonon coupling strength
is relatively smaller. The phonon frequencies in the hcp and bcc phases are significantly higher than those in the fcc phase (compared in
Figure 6). However, since the conduction electrons of lead are predominantly distributed in the
orbitals near the Fermi level, the energy matching efficiency between high-frequency phonons and electrons is relatively low, leading to a limited contribution to electron-phonon coupling. Thus, the increase in high-frequency phonon frequencies has an insignificant effect on enhancing the electron-phonon coupling strength
.
From the perspective of the superconducting mechanism, the decrease in the DOS of electrons at the Fermi surface, induced by pressure, dominates the decay of the electron-phonon coupling strength. Although the increase in phonon frequencies elevates the logarithmic average frequency, the reduction in electron-phonon coupling strength prevails according to the McMillan equation. Consequently, the superconducting transition temperature continues to decrease.

