Article

The Ecological Niches and Interspecific Associations of the Dominant Fishes in the Xiamen Seas, China

1
Fisheries College, Jimei University, Xiamen 361021, China
2
Fujian Provincial Key Laboratory of Marine Fishery Resources and Eco-Environment, Xiamen 361021, China
3
Fisheries Research Institute of Fujian, Xiamen 361021, China
*
Authors to whom correspondence should be addressed.
These authors contributed equally to this work.
Fishes 2024, 9(9), 354; https://doi.org/10.3390/fishes9090354
Submission received: 15 August 2024 / Revised: 2 September 2024 / Accepted: 9 September 2024 / Published: 10 September 2024
(This article belongs to the Section Fishery Economics, Policy, and Management)

Abstract

Fish are vital in enhancing the stability of marine ecosystems. Therefore, understanding the ecological niches and interspecific correlation characteristics of their dominant species provides a good scientific basis for the protection and management of marine biodiversity. In this study, on the basis of survey data from trawls conducted in the waters off Xiamen in the spring (April) and autumn (November) of 2021, the ecotopes and interspecies connectivity of the dominant fish species were investigated using the relative importance index (IRI), χ2 tests, the association coefficient (AC), and Pearson and Spearman analyses. According to the IRI, there were 23 fish species with higher values, including 15 species in spring and 15 species in autumn. The 15 dominant fish species could be subdivided into wide-, medium-, and narrow-ecotope species, of which there were 2 and 3 wide-ecotope types in spring and autumn. The niche overlap indices exhibited a range of 0.000–0.809 in the spring and 0.000–0.915 in the autumn, showing small differences between the two seasons. The interspecific correlations between the dominant fishes in Xiamen’s waters in spring and autumn were weak, and both showed non-significant positive correlations, indicating that the correlations between the dominant fishes in this sea area are relatively independent. The findings of this investigation provide a fundamental database and theoretical framework for researching the adaptive mechanisms of marine fish in the Xiamen Seas.
Key Contribution: This study is the first to investigate the ecological niches of dominant fish populations and their interactions with other species in Xiamen’s waters. This study provides an essential theoretical basis for further understanding of the structure of fish communities and the dynamic interactions between populations in the Xiamen offshore area. It reveals the diversity of the different fish species in terms of resource use, habitat requirements, and feeding habits. The results of this study indicate that the linkages between key fish populations are more independent. This not only enriches our understanding of Xiamen’s offshore fish populations but also provides a set of baseline data and a scientific research framework for an exploration of how fish adapt to environmental change.

1. Introduction

The concept of an ecological niche refers to the relationship between a species and the other species in a community in a certain period, space, and functional state [1]. This reflects the functional status and ecological adaptability of different groups in the community and reveals the level of competition among species for natural resources [2]. Therefore, it is the minimum threshold level of habitat required for the survival of each species in the ecosystem [3]. Ecological niche concepts play an essential role in the investigation of interspecific relationships, coexistence mechanisms between populations, and community dynamics [4,5,6,7]. The comprehensive initial formulation of the concept of the ecological niche was undertaken by Grinnell [8], who interpreted the ecological niche from a spatial perspective; thus, it was called the spatial ecological niche. Elton [9] described “the functional role and status of species in the community” to explain the ecological niche, which was referred to as a functional niche. Hutchinson [10] synthesized the concept of the ecological niche and proposed multi-dimensional super-volume ecological niche theory from the perspective of resource utilization and spatial factors. Some scholars have applied the ecological niche theory in modern ecology, and studies have been carried out on various groups of organisms, such as birds, plants, zooplankton, and macrobenthos [11,12,13].
The ecological niche width and ecological niche overlap reflect the spatial and temporal positions of populations in ecosystems through interspecific relationships and can be used to predict the direction of community succession [14]. The ecological niche width shows the level of exploitation of various resources by species, which is directly proportional to the efficiency of resource use and the capacity of biodiversity to respond to the demands of the environment. The extent to which different species occupy the same ecological niche is defined as the ecological niche overlap, reflecting the ecological similarity and competition between species [15]. Interspecific connectivity refers to the spatial distribution of various species, reflecting the interconnected relationships that exist through the mutual influence and interactivity of species in diverse habitats [16], and binary data have been used to analyze the correlations between plant species either qualitatively or quantitatively [17]. Ecological niches and interspecific connectivity can explain the ability of certain species to exploit resources, reflecting the synergistic and competitive relationships between species, which can then be used to analyze community stability and successional trends [18]. The ecological niche [19] and ecological niche theory [20,21,22,23] are widely used in the analysis of the succession of species, diversity, and community structure [24,25,26,27], and they have a certain practical reference value in ecological restoration.
Ecological niches and the interspecific connectivity of fish are important structural features of communities and important indicators of the ecological similarities between the species within a community. The study of interspecific connectivity enables us to objectively understand and assess how different species interact and how communities are structured and function. Fish are one of the most important ecological groups in marine ecosystems, and most are found at relatively high levels of the food chain. Currently, ecological studies of aquatic animals focus on the species’ composition, diversity, and community structure [28]. Ecological niche studies are mainly applied to shrub, insect, macrobenthic, and fish communities [29,30,31], and interspecific connectivity studies are mainly applied to shrub, seagrass, and bird communities [32,33,34].
Xiamen’s waters are located at the mouth of the Jiulong River and have a unique estuary ecological environment. Since this water area is an important place in which a variety of fish live and reproduce, it has a significant impact on the replenishment of fishery resources [35,36]. In recent years, many studies on benthic organisms in Xiamen’s waters have been conducted, and there are reports on the distribution of species and the number of spawning juveniles [37,38,39], the structure of benthic communities [40,41], spatial and temporal distribution [42], diversity [43,44,45,46], and resource assessment [47]. However, despite these studies, there is a lack of in-depth research on the composition and functioning of fish species in this area. In this study, survey information from the spring and autumn of 2021 was used to investigate the ecotope width, ecotope overlap, and interspecific connections of major fish species in Xiamen’s waters. The goals were (1) to assess the extent of resource use by the dominant fish species in the ecosystem and the range of ecological niches that they occupied; (2) to explore the potential competitive situation and patterns of resource allocation among the dominant fish species using ecological niche overlap analysis; and (3) to elucidate the patterns and strengths of the mutual interactions among the fish species within the ecosystem.

2. Materials and Methods

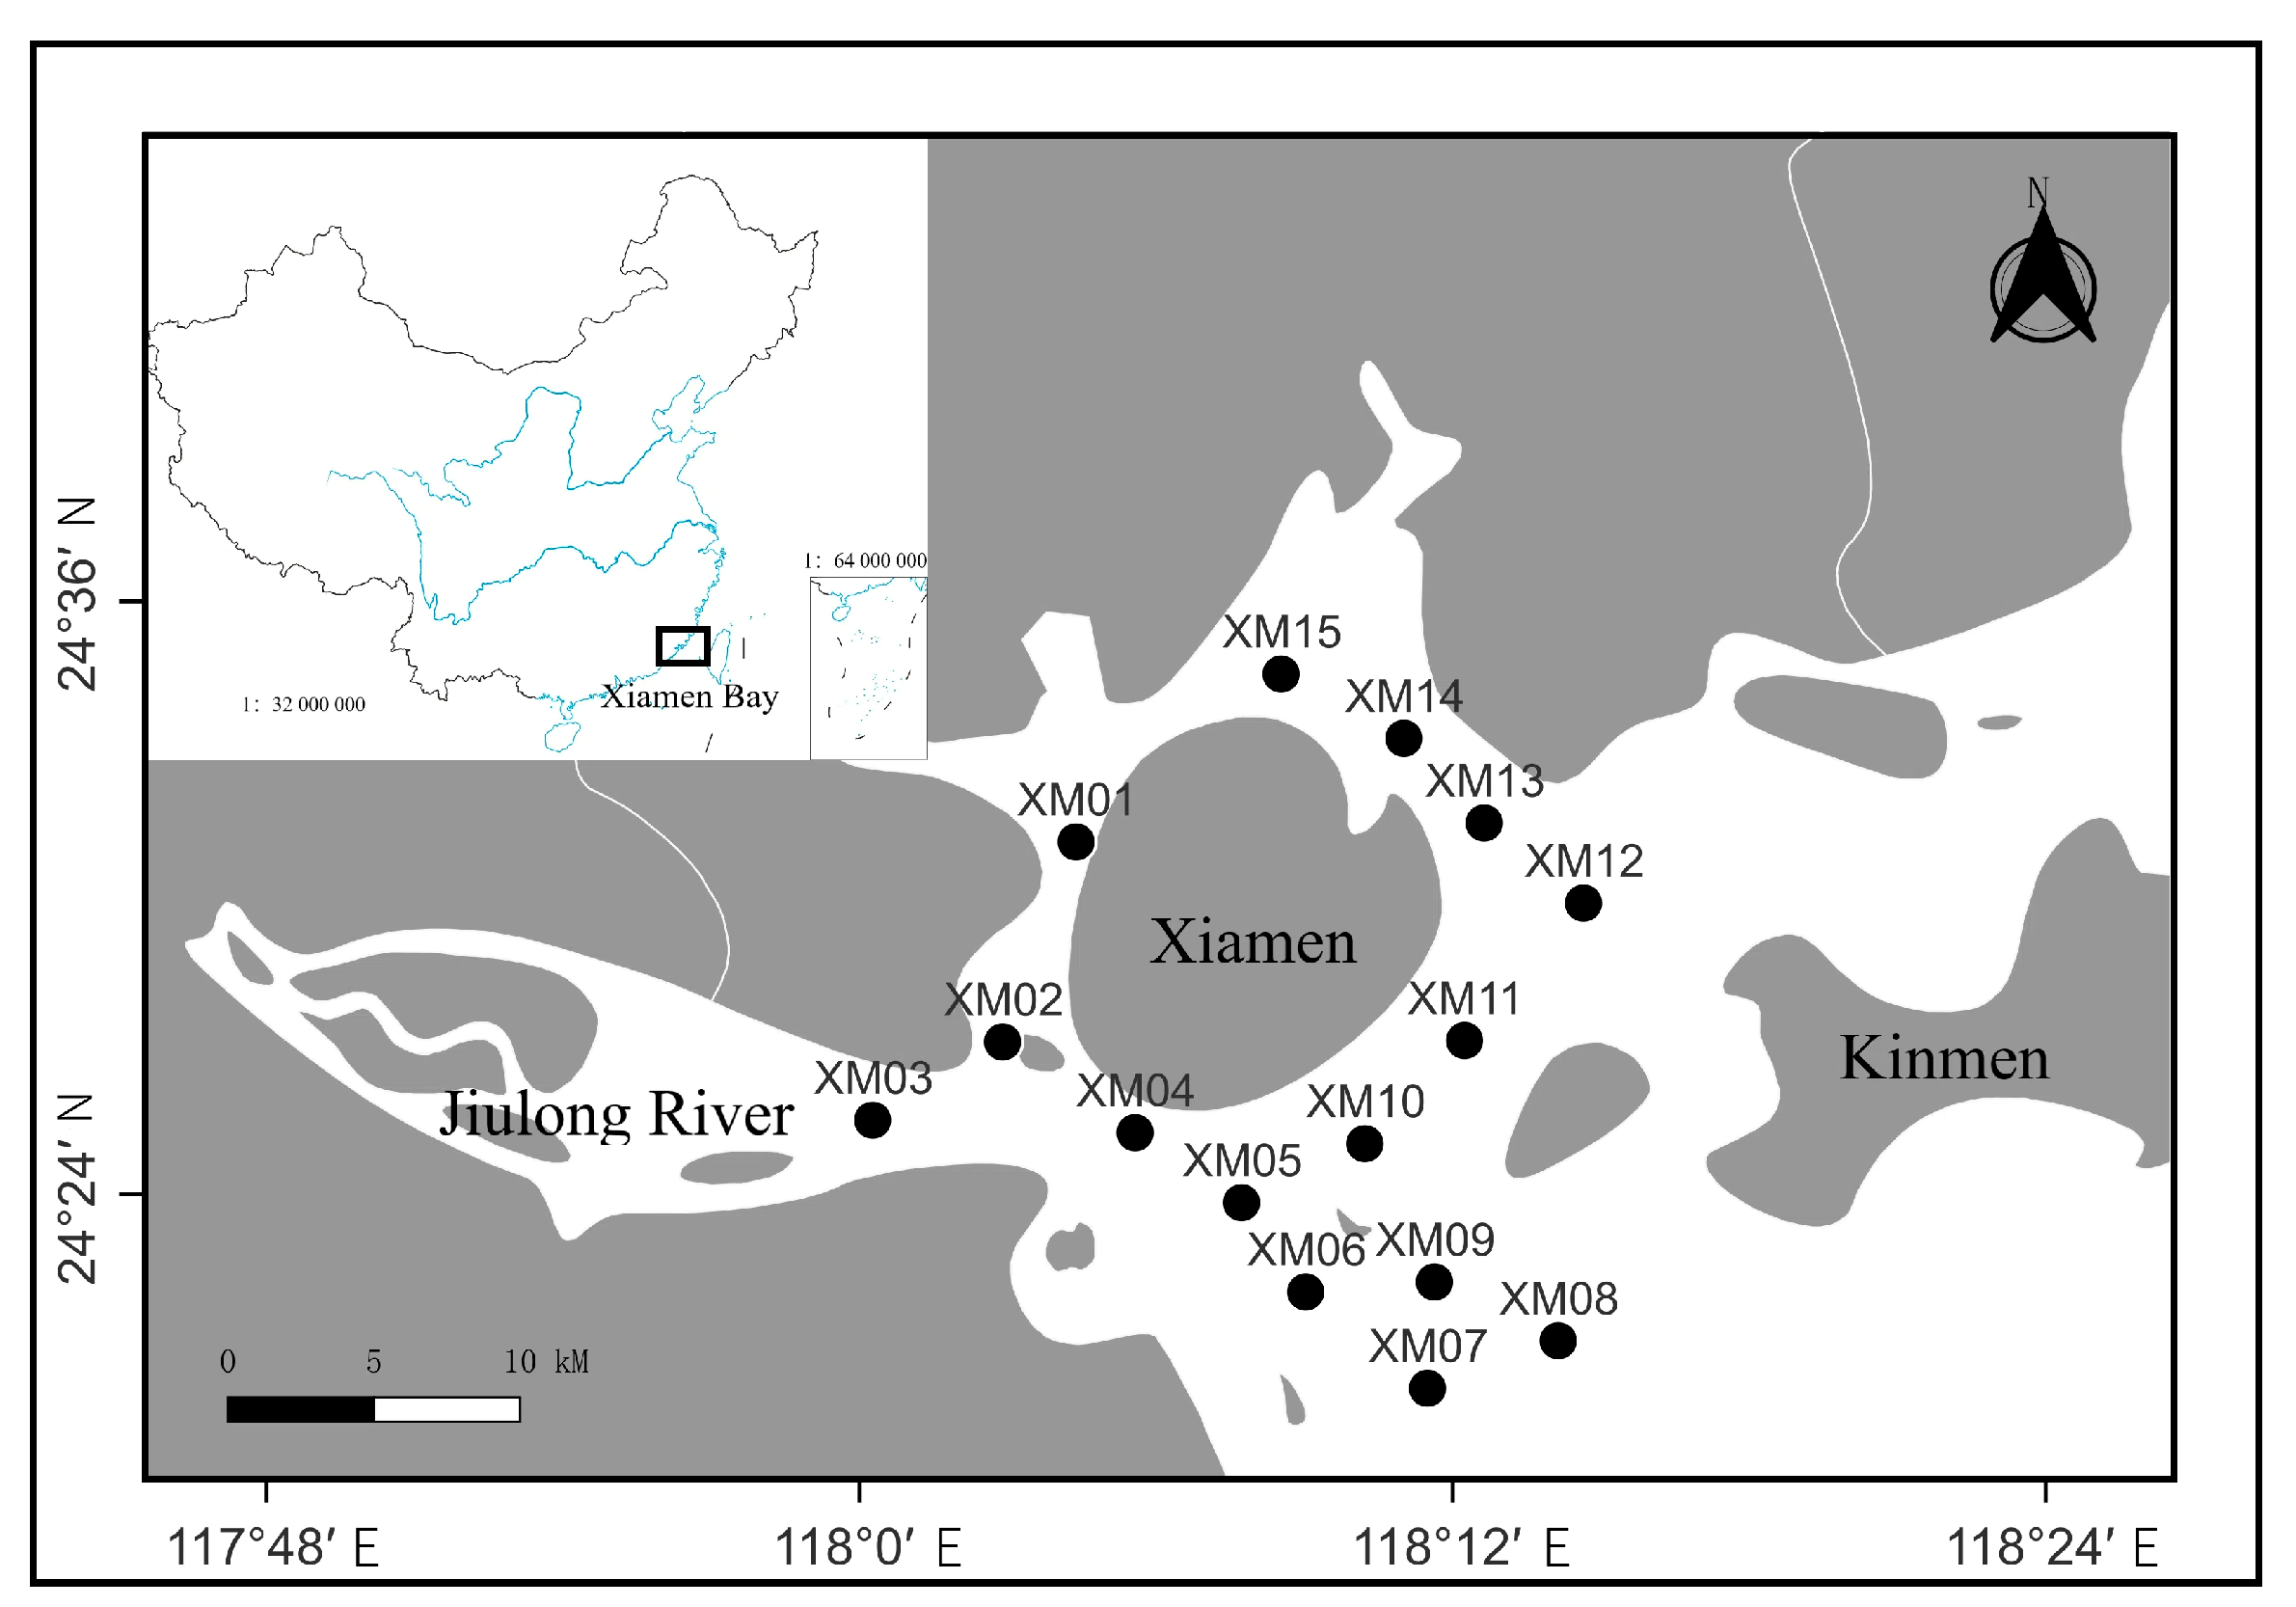
2.1. Study Area and Material Sources

A total of 15 survey stations were set up in Xiamen’s waters (Figure 1), classified as Xiamen West Sea (XM1–XM2), Jiulongjiang Estuary (XM3–XM5), Xiamen Bay (XM6–XM9), Xiamen Jinshui Channel (XM10–XM11), Xiamen East Sea (XM12–XM13), and Tong’an Bay (XM14–XM15). During the survey, a single bottom trawler with a tonnage of 100 t and a main engine power of 221 kW was used. The fishing gear included a 73.5 kW truss rod bottom trawler with a net 6 m in width, 14 m in length, and 30 mm mesh in the bladder mesh, and the survey was conducted within the range of 118°0.262′ E to 118°14.644′ E and 24°20.079′ N to 24°34.532′ N. Each net was towed for 60 min and with an average speed of 3 knots. The survey water depth was 10–50 m.
The trawling surveys of fish species were carried out for 2 cruises in April (spring) and November (autumn) of 2021. During the survey, all captured samples were returned to the laboratory for classification and identification, and the number and body weight of each sample were recorded to an accuracy level of 0.1 g. The survey and analysis were carried out in accordance with GB/T12763.6-2007 “Specification for Marine Surveys Part 6: Marine Biological Surveys”. The ecological types and temperature suitability of the swimming animals were determined according to the information recorded in the “List of Marine Organisms of China” and “Fishery Resources of Fujian Province”.

2.2. Dominance Analysis

2.2.1. Index of Relative Importance (IRI)

The IRI was initially developed from the analysis of nutritional relationships regarding relative abundance among organisms, and it later became a relative importance index. The index combines the individual fish biomass, abundance, and frequency of occurrence. Determination is performed in accordance with the IRI, as postulated by Pinkas [48] et al. (1971):
IRI = N + W × F × 10 4
In ecology, N is used to denote the percentage of a given species out of the total number of species in a given population; W is employed to indicate the percentage of a particular species’ biomass in relation to the overall biomass of all species. Similarly, F is employed to signify the percentage of a particular species’ occurrence at a specific station in relation to the overall species occurrence at that station.
In the present study, dominant species had an IRI of ≥1000; essential species were 100 ≤ IRI < 1000; frequent species were 10 ≤ IRI < 100; and unusual species had an IRI of <10 [49]. As the proportion of dominant and essential species occurring in both the spring and autumn surveys was relatively high in terms of quantity and quality, the fish in question were identified as being of significant importance.

2.2.2. Ecological Niche Width

The present study employs the Shannon–Wiener index to calculate the spatial ecological niche widths of the species and families. The following formula is utilized for this purpose [50]:
B i = J = 1 R P ij In P ij
Here, Bi represents the ecotope width of species I, [0, lnR] is the range of its values, there are R stations, and Pij represents the proportion of individuals belonging to species I at j stations (or j seasons) relative to the total number of species.
The Pkj ratio represents the proportion of individuals belonging to species k in resource state j, relative to the sum of all individuals within the species. It can be demonstrated that an increase in the value of Bi will result in a corresponding increase in the ecological niche width of the species. According to the width of the ecological niche, fishes can be classified into three types: narrow-ecological-niche species (1.0 > Bi > 0), medium-ecological-niche species (2.0 > Bi ≥ 1.0), and wide-ecological-niche species (Bi 2.0).

2.2.3. Ecological Niche Overlap

The ecological niche overlap is computed by means of the Pianka index according to the following formula [51]:
Q ik = J = 1 R P ij P kj / J = 1 R P i j 2 J = 1 R P k j 2
Here, the Qik value represents the degree of ecological niche overlap between taxon I and taxon k. The Qik value reflects the high or low degree of ecological niche overlap, and [0, 1] is the distribution range of its values; there are a total of R stations. The ratio of the number of individuals of species I and species k at the jth station (or jth season) to the sum of individuals of the species is represented by Pij and Pkj. According to Wathne et al., ecological niche overlap values of Qik > 0.6 were categorized as high overlap values between species pairs, those of 0.6 ≥ Qik ≥ 0.3 as moderate overlap values, and those of Qik < 0.3 as low overlap values.

2.3. Interspecific Association

Schluter [52] has proposed the variance ratio (VR) as an indicator of the overall associational status of the species in question. The significance of the correlation was tested using the statistical value W with the following formulas [52]:
δ T 2 = i = 1 s P i 1 P i 2
S T 2 = 1 n j = 1 s ( T j P i ) 2
VR = S T 2 δ T 2
W = VR × n
where δ T 2 is the total variance in the number of stations; S T 2 denotes the total variance in the whole number of species; Pi is used to quantify the diversity of species I in an ecosystem, Pi = ni/n; n is the number of locations at which the service is available. The symbol ni represents the number of stations in which species I is observed; Tj represents the number of dominant fish species at station j, while S denotes the total number of dominant fish species; and the mean number of species at station j is represented by the letter T.
VR = 1 indicates the absence of a relationship among the species in question; VR > 1 shows that there is a favorable correlation among the species in question; VR < 1 shows that there is a negative association among the species in question. The statistical value W was employed to ascertain the significance threshold of the deviation of the VR values from 1; should the value of W fall within the confidence range X 0.95 2 (n) <   X 0.05 2 n of the chi-square test, it would be concluded that there was no association between the species at a 90% confidence level.
The chi-squared test, as described by [53], was performed on a 2 × 2 column list and using Yates’ continuous correction method:
χ 2 = n ( | ad bd | 0.5 n ) 2 a + b b + d a + c c + d
In this equation, n represents the overall numerical value of the sites in question, a signifies the numerical value of the sites where both species are present, b and c indicate the numerical value of the sites where only one species is observed, and d corresponds to the numerical value of the sites where none of the species are detected.
The total quantity of samples is represented by the variable n. The values a and d correspond to the quantity of samples where both species are present simultaneously and where no species is present, respectively. Similarly, b and c represent the quantity of samples containing both species in isolation. If χ2 < 3 841, it represents p > 0.05 and the relationship between pairs of species is insignificant; if 3.841 ≤ χ2 ≤ 6.635, it represents 0.01 ≤ p ≤ 0.05 and the relationship between pairs of species is significant; when χ2 > 6.635, it represents p < 0.01, and the relationship between pairs of species is highly significant. The V value is the basis for the determination of a positive or negative relationship: when V > 0, it means that the pairs of species are positively associated with each other, and, when V < 0, it means that the pairs of species are negatively associated with each other. The χ2 test only qualitatively analyzes the associations between species, and it cannot accurately determine the degree of association among non-significant species pairs.

2.4. Correlation Analysis

2.4.1. Association Coefficient

The association coefficient or AC [54] reflects the strength of association of the relationship between species and is a test of the strength of the association. It represents a complementary refinement of the χ2 test.
The AC is calculated as follows:
If   ad     b c ,   then   AC = ad bc a + b b + d
If   bc   >   ad ,   d     a ,   then   AC = ad bc a + b a + c
If   bc   >   ad ,   a   >   d ,   then   AC = ad bc b + d c + d
In Formulas (9) to (11), the magnitude of AC oscillates between −1 and 1. A value of AC closer to 1 signifies a more robust affirmative association than a value closer to −1, which denotes a more pronounced negative association. When AC is 0, the species are not dependent on each other.
The χ2 test dichotomizes the dominant fish data (number of tails) and can only be used as a qualitative test, making it difficult to reflect the multidimensional information of the interspecies correlation.

2.4.2. Pearson Correlation Analysis and Spearman’s Rank Correlation Analysis

Pearson correlation analysis and Spearman’s rank correlation analysis are quantitative tools that can determine not only the significance level of the interspecies association but also the magnitude of the strength of the interspecies association. Therefore, Pearson’s correlation coefficient and Spearman’s ranks have been employed to examine interspecies associations, thus providing a means of enhancing the efficacy of the χ2 test [18]. The two correlation analyses were used in this study at a significance level of 0.05, serving to verify the reliability of the results and provide comprehensive analyses of the correlations between the variables from different perspectives, thus enabling us to objectively and accurately reflect the linear interspecies associations. The correlations between the variables were analyzed from different perspectives, allowing us to objectively and accurately reflect the strength and significance of the linear correlations between the species [55,56], and the formulas were as follows:
r p i , j = k = 1 N x ik x i ¯ x jk x j ¯ i = 1 N x ik x i ¯ 2 i N x ik x j ¯ 2
r s i , j = 1 6 k = 1 N ( x ik x jk ) 2 N 3 N
In this context, N represents the overall number of samples. The symbols rp (i,k) and rs (i,k) denote the Pearson’s and Spearman’s rank statistical correlation values, respectively, between species i and k within the given samples. These variables are constrained to a range of −1 to 1. A quantitative assessment of the relationship between pairs of species can be performed by assigning a value to each species, with positivity indicating a positive correlation, negativity indicating a negative correlation, and zero indicating no correlation.

2.5. Data Processing

The visualization of the stations and the markup of the relevant geographical coordinates were conducted using QGIS 3.28.12. The calculation of the species IRI was performed with the use of Excel version 2021, while the determination of the ecological niches was facilitated by the “spaa” functionality of the R language. The mapping was primarily executed through the corrplot package of the R 4.4.0 software and Origin 2022.

3. Results

3.1. Relative Importance

A total of 107 species of fish, categorized into 13 orders, 50 families, and 80 genera, were captured in Xiamen’s waters throughout the two bottom trawl surveys (Table 1). According to the IRI, there were 23 fish species with higher values, including 15 species in spring and 15 species in autumn. The dominant species (IRI ≥ 1000) in spring were Johnius belengerii, Chiloscyllium plagiosum, and Trypauchen vagina, while the dominant species in autumn were J. belengerii and Leiognathus brevirostris. In both seasons, three essential species (100 ≤ IRI < 1000) were identified, which included Dasyatis zugei, Argyrosomus argentatus, and the daggertooth pike conger (Table 1).

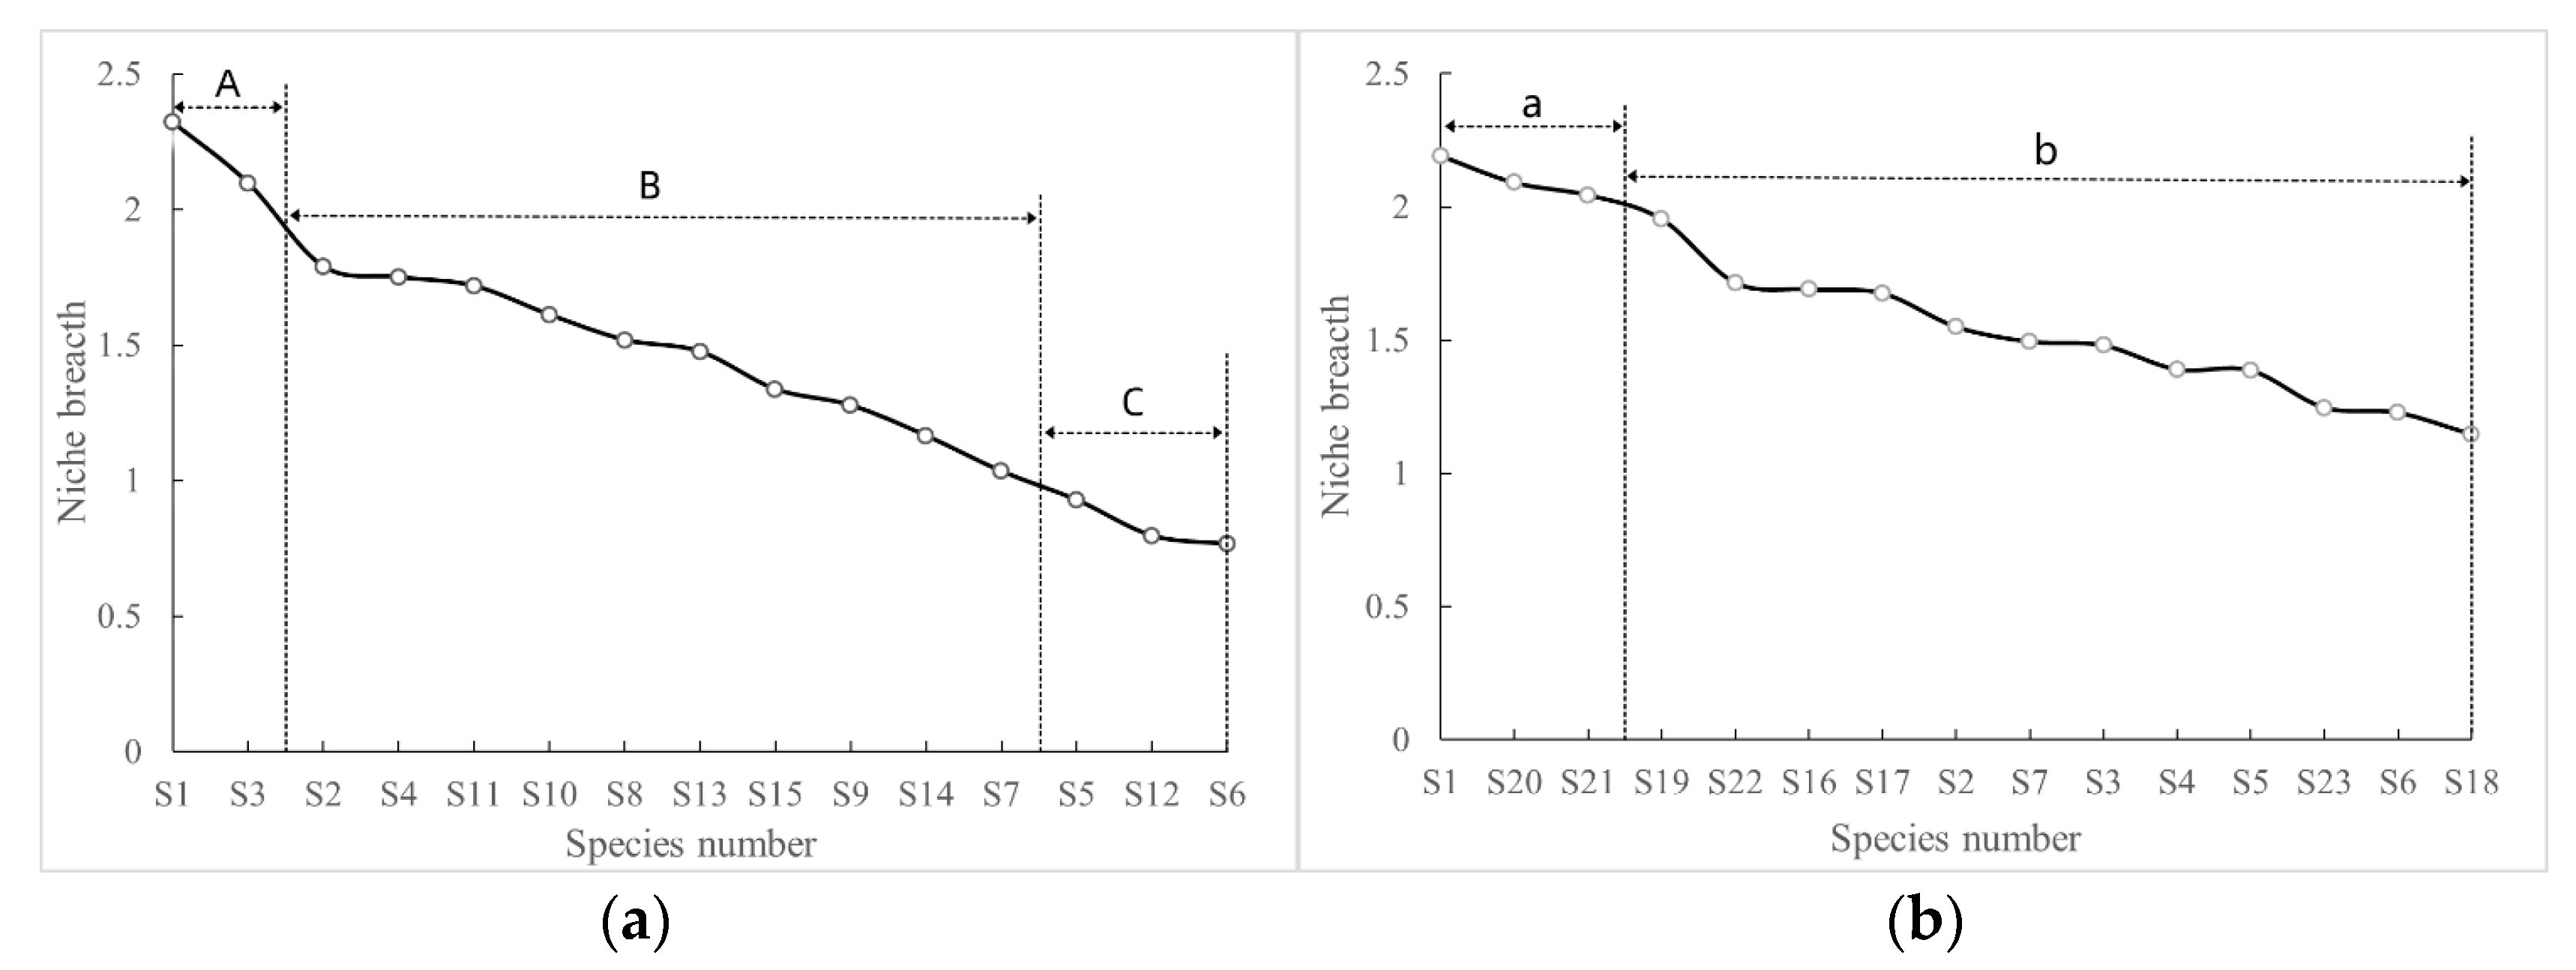
3.2. Main Species and Niche Width

The niche widths of the dominant fishes in the Xiamen Seas ranged from 0.765 to 2.321, with obvious differences and a low to high stage distribution. In spring, the niche width of J. belengerii was the largest (2.321), followed by that of T. vagina (2.097), and the smallest was that of S. marmoratus (0.765); in autumn, the largest ecotope width (2.192) was found for J. belengerii, followed by the largest (2.091) for S. sihama and the smallest (1.146) for P. anguillaris; there were no species where Bi < 1 in autumn, as shown in Table 1.
Within this research, the niche widths of the main fish species showed a clear phase distribution. There were 2 wide-ecotope species (band A), 10 medium-ecotope species (band B), and 3 narrow-ecotope species (band C) in spring; there were 3 wide-ecotope species (band a), 12 medium-ecotope species (band b), and 0 narrow-ecotope species in autumn (Figure 2).

3.3. Niche Overlap

The researchers found an ecological niche overlap between the dominant fish species in Xiamen’s waters. If the value of the ecological niche overlap was more than 0.6, this indicated that the overlap between the pairs of species was significant; if the value ranged from 0.3 to 0.6, this indicated that the ecological niche overlap was moderate among the species pairs; and when the ecological niche overlap index was lower than 0.3, it indicated that the overlap among the species pairs was small.
In the spring, the values for the ecological niche overlap varied considerably, with a range of 0.00 to 0.809 (Table 2). There were 7 species pairs with overlap values greater than 0.6, accounting for 6.67% of all species pairs; there were 40 species pairs with overlap values between 0.3 and 0.6, representing 38% of all species pairs. A total of 10% of pairs showed overlapping of less than 0.3, representing 55.24% of all pairs. Of these, the ecological niche overlap between the daggertooth pike conger and C. macrolepidotus (S13–S14) had the largest value (0.809). In autumn, the ecotope overlap scores were in the range of 0.00 to 0.915 (Table 3), with 16 species pairs exhibiting an overlap value greater than 0.6, representing 15.24% of the total; 26 species pairs displayed overlap values between 0.3 and 0.6, comprising 24.76% of the total; and 63 displayed pairwise overlap values below 0.3, representing 60% of the total. Notably, both the spring and autumn ecotope overlap values were relatively low.

3.4. Overall Association Analysis

The VR was used to assess the general correlations between the dominant fish species in Xiamen’s waters. In spring, the VR was 1.45; as this was more than 1, it pointed to a favorable correlation among the dominant fish species. The value of the computed value of W was 21.79, which was outside the credibility range (7.26, 25.0) of the chi-square distribution. Additionally, the VR deviation was considerable, indicating that the correlations between the 15 dominant fish species in spring were not statistically significant. In autumn, the VR was found to be 0.50; it was below 1, showing a negative relationship among the dominant fish species. Additionally, the W statistic was 7.56, which was not within the confidence interval (7.26, 25.0) of the chi-square test. This suggested that there was a non-significant negative relationship between the 15 dominant fish species in autumn, indicating that each species tended to be independent and that the community as a whole was unstable, with a certain degree of fluctuation (Table 4).

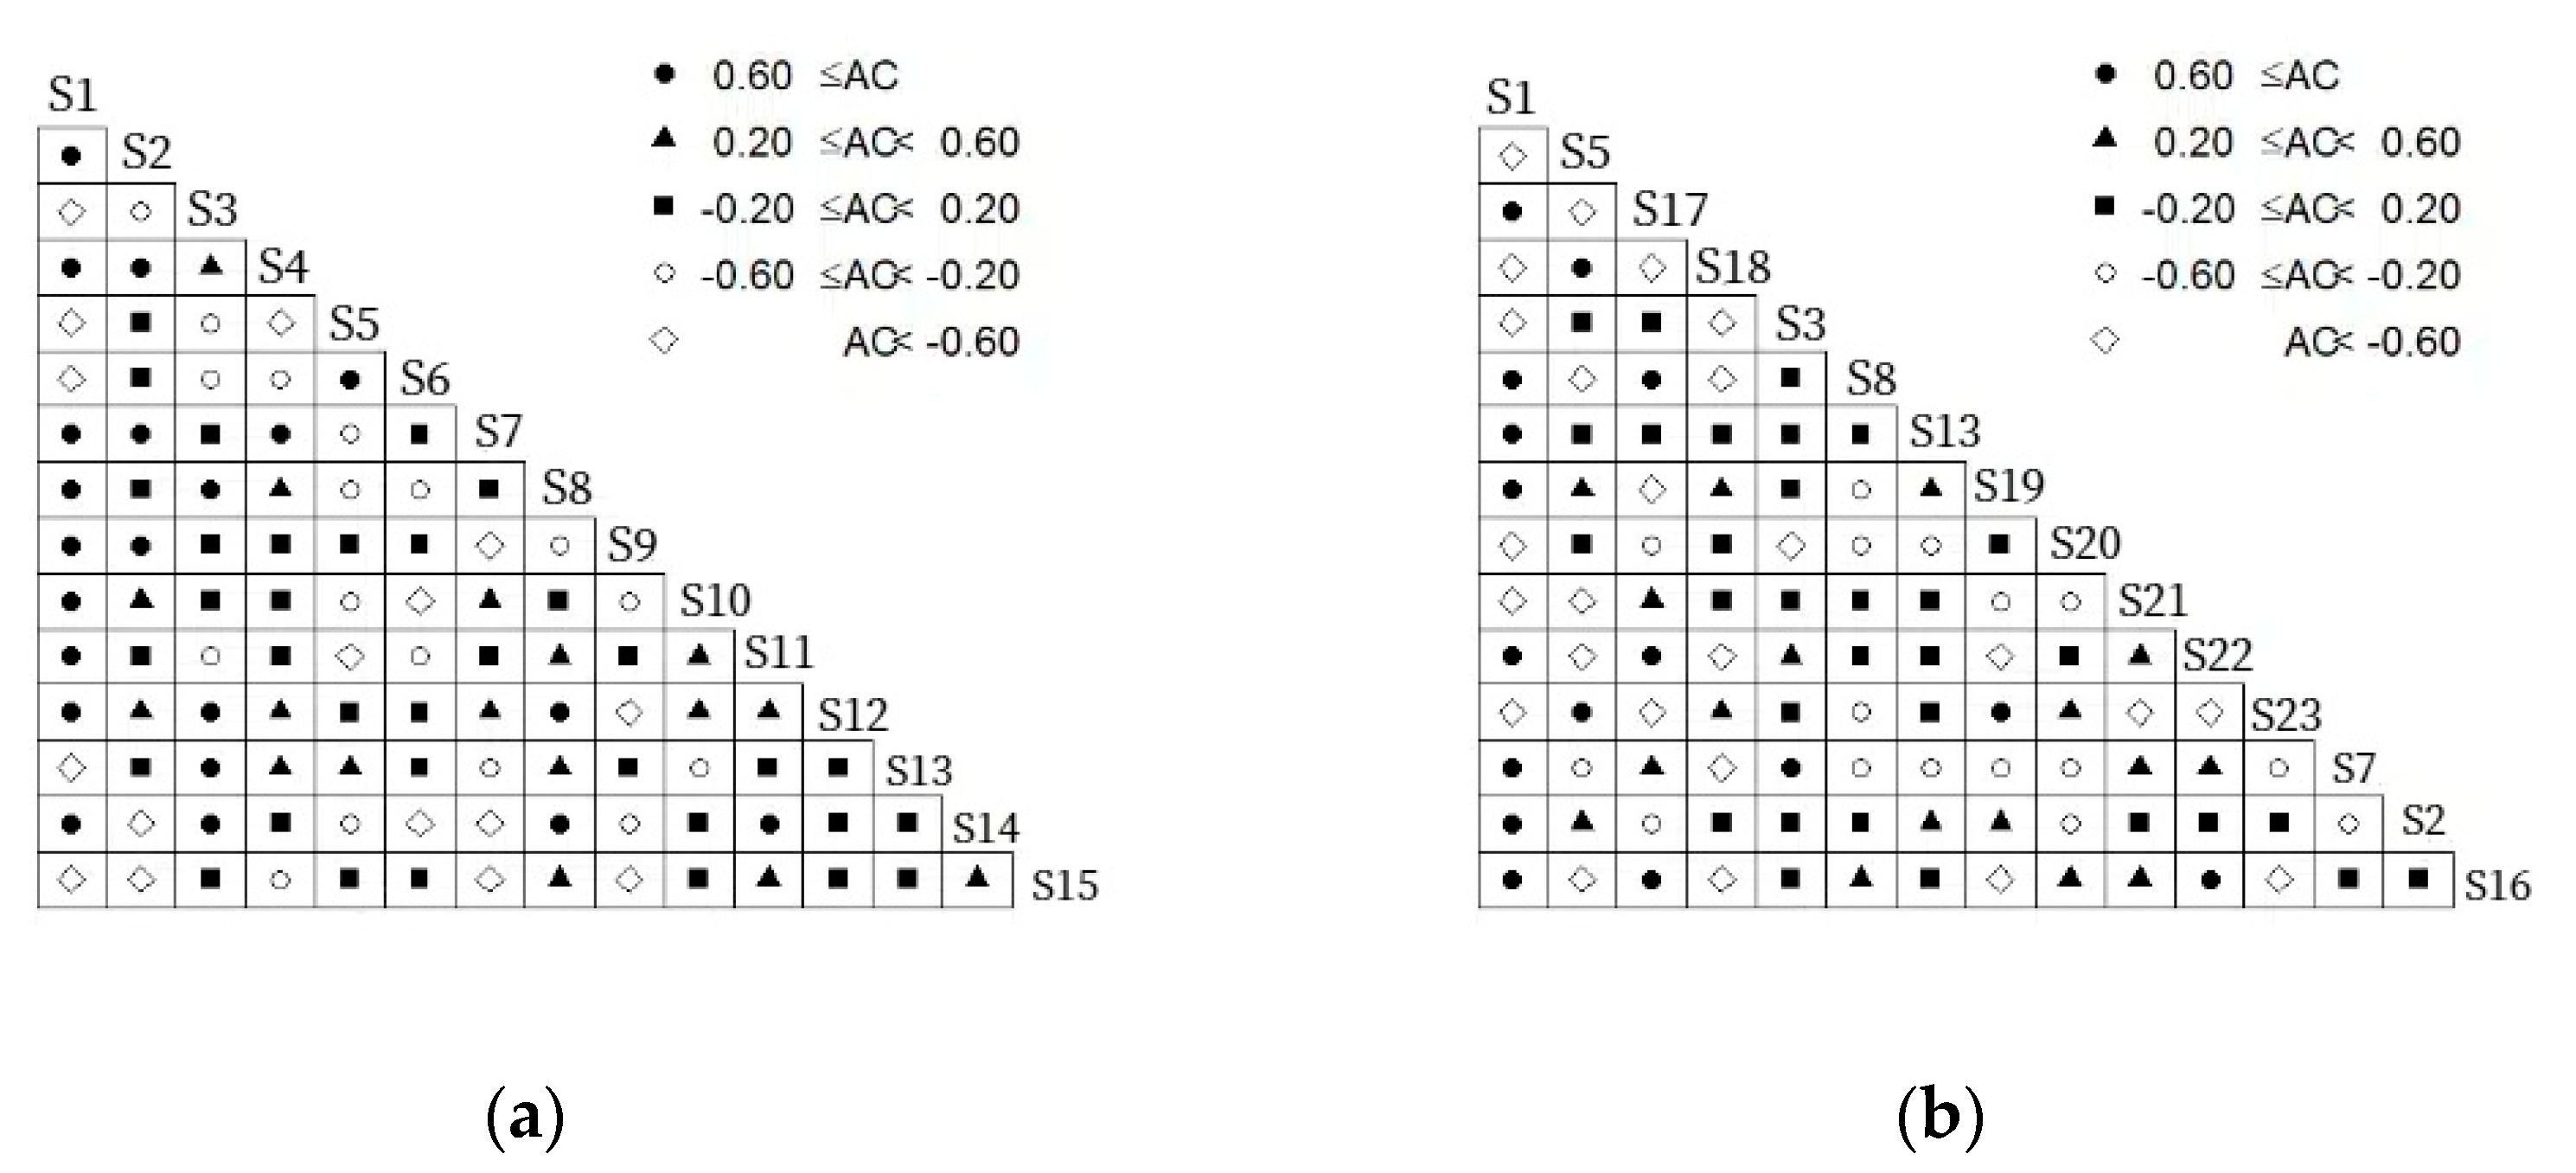
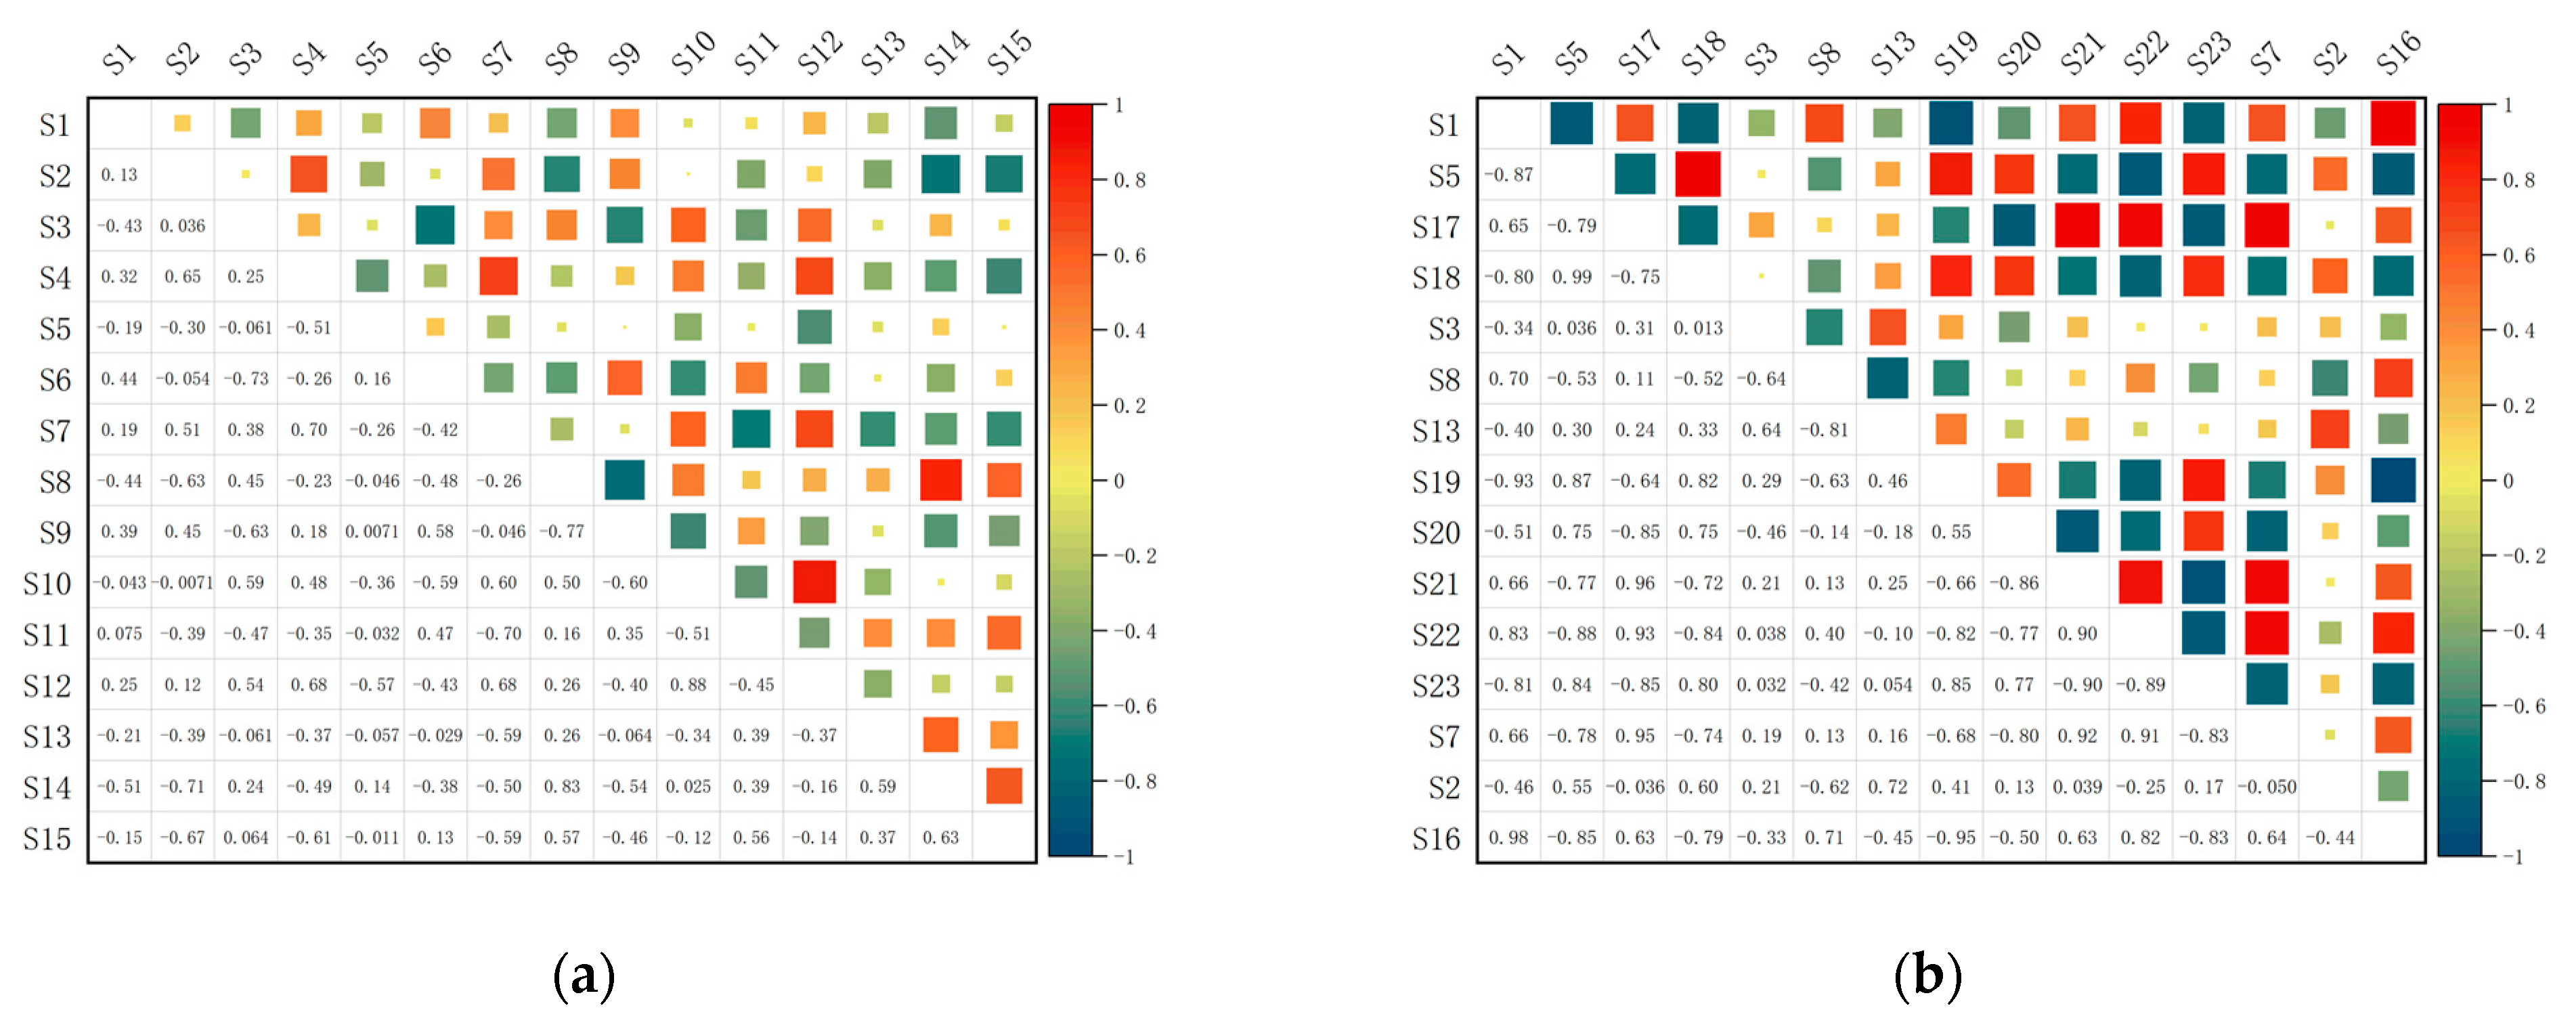
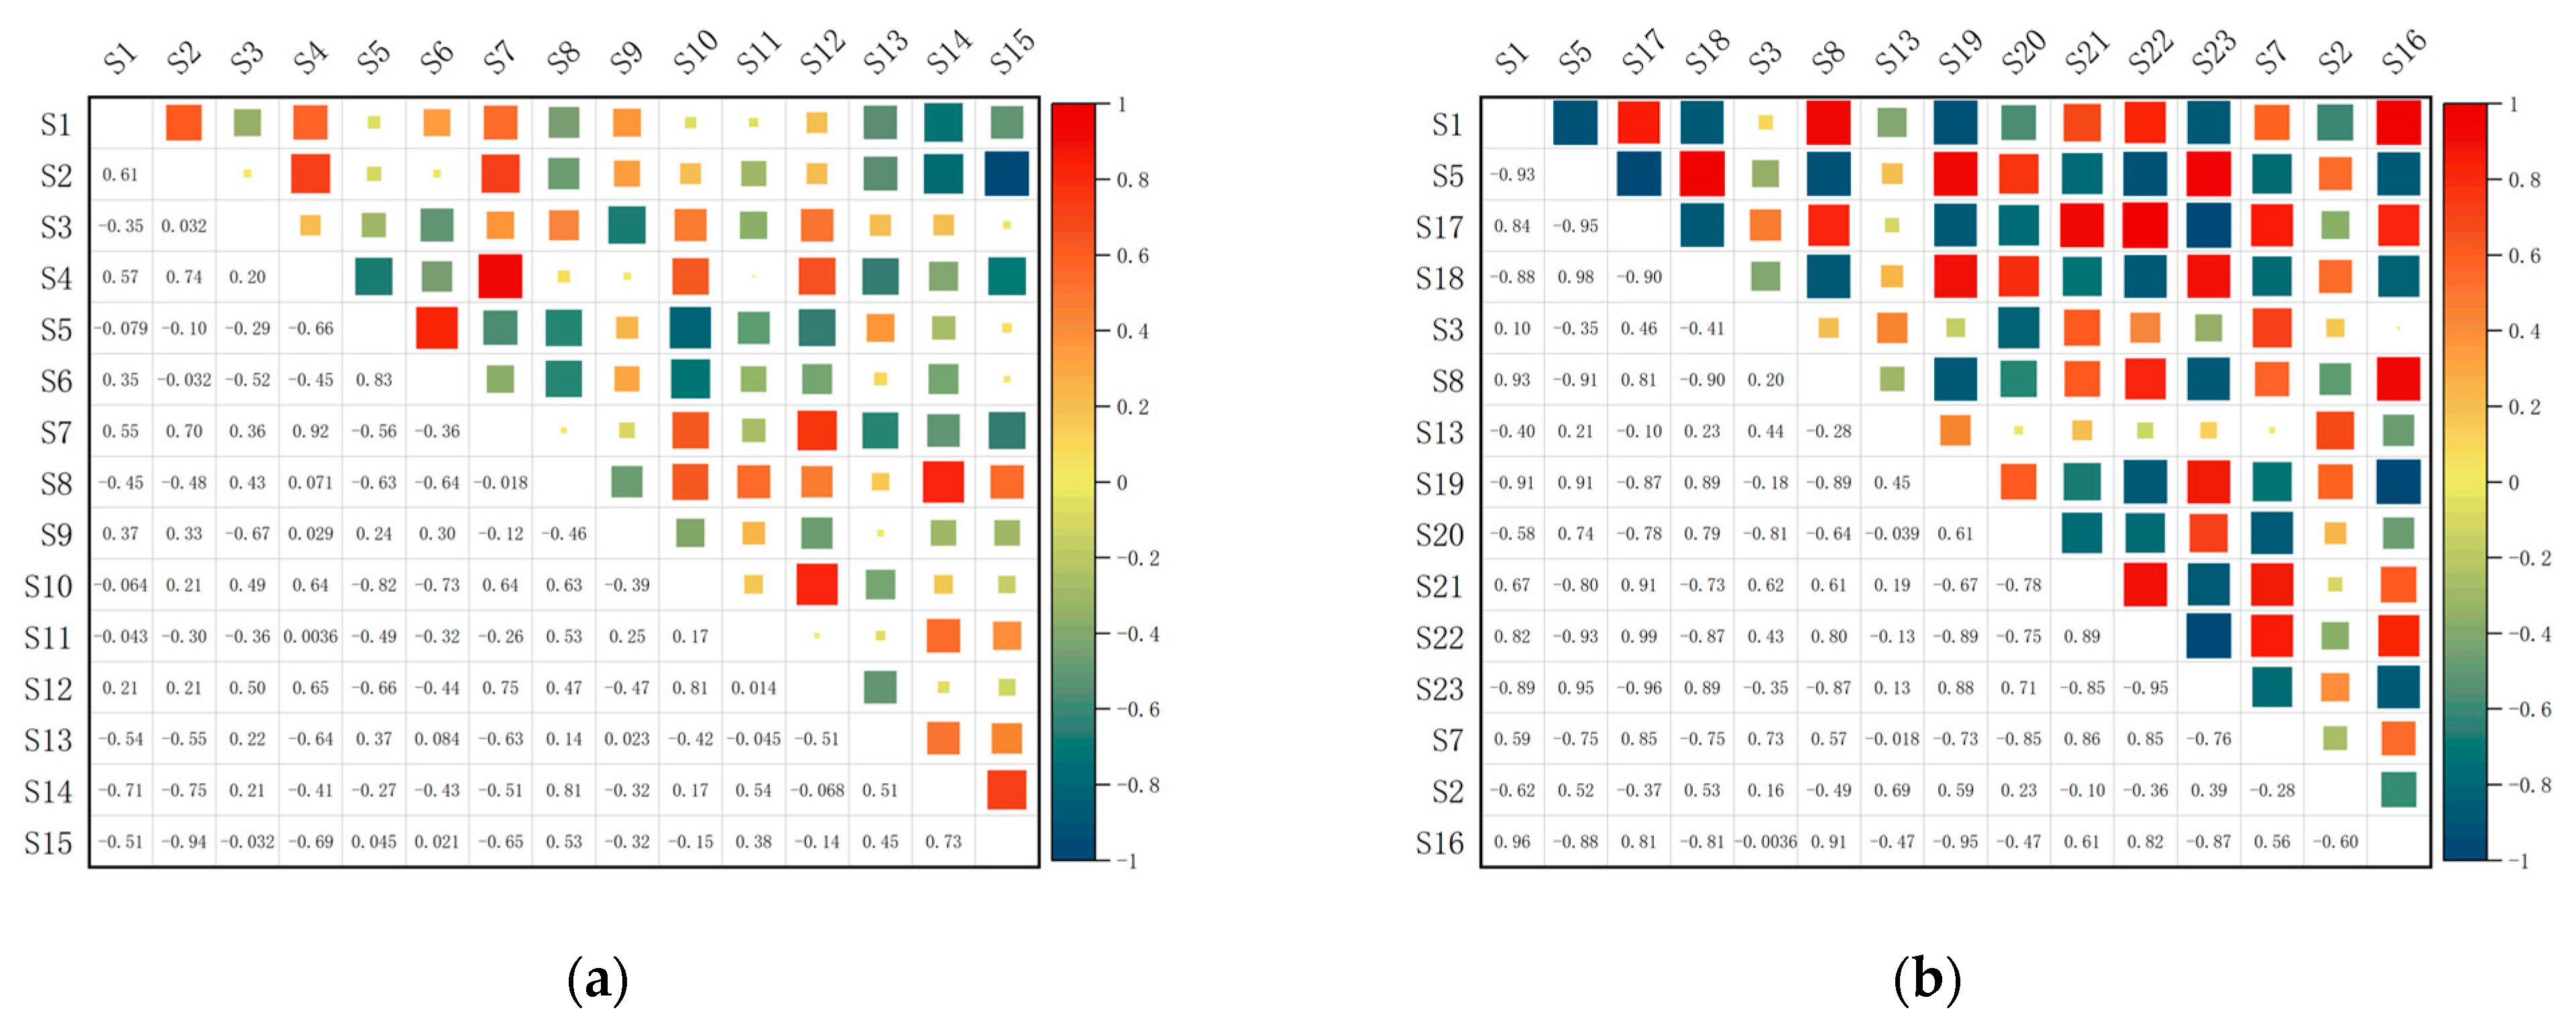
3.5. Interspecific Association Analysis

In spring, the 15 dominant fish species formed 105 pairs, of which 12 pairs exhibited highly significant associations, 2 pairs demonstrated significant associations, and 91 pairs displayed non-significant associations (Table 5). This represents 11.4%, 1.9%, and 86.7% of the overall number of pairs, respectively. In the autumn, 11 pairs reached highly significant associations, 9 pairs reached significant associations, and 85 pairs reached non-significant associations, accounting for 10.5%, 8.6%, and 81.0% of the overall number of pairs, respectively (Table 6).
As indicated by the AC, 21 out of 105 pairs of species exhibited a strong positive correlation (AC ≥ 0.60) during the spring season (Figure 3a), representing 20.0% of the overall pairs. Additionally, 17 pairs of species demonstrated a positive correlation on average (0.20 ≤ AC < 0.60), representing 16.2% of the overall pairs. Meanwhile, 34 of the overall number of pairs exhibited independence from one another (−0.20 ≤ AC < 0.20); this accounted for 32.4% of the total. Seventeen species pairs demonstrated a negative correlation (−0.60 ≤ AC ≤ −0.20), representing 16.2% of the total. Sixteen species pairs exhibited a strong negative correlation (AC ≤ −0.60), representing 15.2% of the total.
In autumn (Figure 3b), 16 out of 105 species pairs were strongly positively correlated (AC ≥ 0.6), representing 15.2% of the entire species list. Seventeen pairs were positively correlated on average (0.20 ≤ AC < 0.60), representing 16.2% of the entire species list. Meanwhile, 31 species pairs were independent (−0. 20 ≤ AC < 0.20), representing 29.5% of the entire species list; 16 pairs had an average negative correlation (− 0.60 ≤ AC < − 0.20), representing 15.2% of the species pairs; and 25 pairs of species were strongly negatively correlated (AC ≤ −0.60), constituting 23.8% of the species pairs.
The findings of the Pearson correlation test indicated that, in the spring season (Figure 4a), a total of 5 out of 105 species pairs exhibited a strong positive correlation (rp ≥ 0.54), amounting to 4.8% of the total number of pairs. Additionally, 11 species pairs showed a significant correlation (0.32 ≤ rp < 0.54), representing 10.5% of the total. A total of 17 of the species pairs exhibited independence (0.09 ≤ rp < 0.32), representing 16.2% of the overall sample. Conversely, 33 species pairs demonstrated a negative correlation (−0.14 ≤ rp < 0.09), comprising 31.4% of the total. Additionally, 39 species pairs exhibited a strong negative correlation (rp < −0.14), representing 37.1% of the total.
The Pearson correlation test showed that, in autumn (Figure 4b), a total of 9 out of 105 species pairs exhibited a strong positive correlation (rp ≥ 0.54), representing 8.6% of the total. Twelve pairs demonstrated a positive correlation on average (0.32 ≤ rp < 0.54), representing 11.4% of the total. Additionally, 16 species pairs exhibited independence from one another (0.09 ≤ rp < 0.32). This equated to 15.2% of the total. Additionally, 18 pairs of species exhibited a negative correlation on average, with a Pearson coefficient of (−0.14 ≤ rp < 0.09). This accounted for 17.1% of the total. Furthermore, 50 pairs of species demonstrated a strong negative correlation (rp < −0.14). This accounted for 47.6% of the total.
The results for Spearman’s rank order association revealed that, in the spring (Figure 5a), 5 out of the 105 species pairs exhibited a strong positive correlation (rs ≥ 0.54), representing 4.8% of the total number of pairs. Additionally, 14 species pairs demonstrated a favorable correlation on average (0.32 ≤ rs < 0.54), representing 13.3%, and 25 species pairs demonstrated independence from one another (0.09 ≤ rs < 0.32), which represented 23.8% of the total. Meanwhile, 27 species pairs exhibited a negative correlation on average (−0.14 ≤ rs < 0.09), which accounted for 25.7% of the total. Finally, 34 pairs exhibited a strong negative correlation (rs < −0.14), which accounted for 32.4% of the total.
The analysis of the findings of the Spearman’s rank correlation test indicated that, in the autumn (Figure 5b), 14 out of the 105 species pairs showed a highly positive relationship (rs ≥ 0.54), representing 13.3% of the overall number of pairs. Additionally, 11 species pairs demonstrated a highly positive relationship on average (0.32 ≤ rs < 0.54), representing 10.5% of the total. A total of 16 of the species pairs exhibited independence (0.09 ≤ rs < 0.32), representing 15.2% of the total number of pairs, and the average correlation between 22 species pairs was negative (−0.14 ≤ rs < 0.09), representing 21.0% compared to the total number of pairs in the sample. Additionally, 42 species pairs demonstrated a negative correlation (rs < −0.14), comprising 40.0% of the entirety of the data set.

4. Discussion

4.1. Niche Width

The term “ecotope width” is used to describe the variety of resources utilized by organisms within a given ecosystem [57], and the magnitude of the ecotope width values of aquatic animals is closely related to their range, distribution pattern, and population size [58]. In an ecological sense, the ecotope width can also be a reflection of species’ adaptability to the external environment and the wide variety of resources that they use [59]. The value of the ecotope width for swimming animals is related to their distribution range (i.e., number of stations), distribution pattern (uniform or patchy), and population size. Currently, there is no clear standard for ecotope width classification, which is based on the specifics of the ecotope width values of large benthic animals. In this experiment, the dominant fishes in spring and autumn were classified according to the spatial ecotope width as wide-ecotope species (Bi ≥ 2.0), medium-ecotope species (1 ≤ Bi < 2), and narrow-ecotope species (0 < Bi < 1).
The ecotope widths of the dominant fish species in Xiamen’s nearshore waters varied between 2.321 and 0.675. The proportions of wide-, medium-, and narrow-ecotope species were 13.3% and 66.7%, 20.0% and 20%, and 86.7% and 0% of the dominant fishes in spring and autumn, respectively. This implies that the dominant species of fishes in the region exhibited a medium ecotope. The study area exhibited a greater diversity of species, a more expansive spatial distribution, and a greater capacity to adapt to changes in the quality and availability of resources.
This study found that the ecological niche width values of the main fish species in spring and autumn were clearly segmented: (a) high ecological-niche-width values, with the abundance of the individual species ranging from 13% to 20%; (b) high ecological-niche-width values, with the frequency of occurrence of each species ranging from 67% to 80%, where the number of catches was high and the distribution of the individual species at each station was fairly even; (c) low ecological-niche-width values, with less than 20% of each species occurring in spring. The ecotope width values of the fishes in section C were low; less than 20% of each species was found to occur in spring, the number of catches was low, and there were no fish with narrow ecotopes in autumn. It can be seen that the ecotope width values reflect not only the number of catches of each species but also its distribution range and uniformity. Thus, the method of classifying the dominant fishes into three classes, namely, narrow, medium, and wide ecotopes, according to the three ranges of ecotope widths (a, b, and c) is reliable and trustworthy. This classification method can be seen to be analogous to that used in the study conducted by Hu, Chengye, et al. [58].
In our study, we found that the ecotope widths of the dominant species were more significantly segmented, as shown in Figure 2. The species that appeared in the spring (a) segment were J. belengerii, T. vaginas, and C. plagiosum, and the species that appeared in the autumn (a) segment were J. belengerii, appearing as both light and dominant ecotope species. These are both wide-ecological-niche species and dominant species, with strong advantages in resource use and environmental adaptability in this area.
The IRI values of the fishes investigated in this study are not exactly the same as the ecotope width values of wide-ecotope species, such as S20 (S. sihama) and S21 (O. quadrifasciatus). The ecotope width value of (2.09) for the largest S. sihama ranked second, while the relative importance index value of (190.98) ranked ninth. This difference in the rankings may be due to the different ecological characteristics between the two species [60]. The process of calculating an organism’s ecological niche width primarily focuses on the relationship inherent to the species and the specific stations within its habitat, while the calculation of the relative importance index ignores the differences between stations and uses the number of fish species and the biomass of the species, as well as the frequency of occurrence.
The ecological niche width of a species may vary depending on its habits and foraging behavior at different times relative to the lifespan of the species, in accordance with the seasonal changes that occur [61]. For example, L. brevirostris has a narrow niche in spring (0.928) and a medium niche in autumn (1.390), probably using a wider range of resources in autumn, when resources are abundant (increasing the niche width), and focusing on specific resources when resources are scarce (decreasing the niche width). The research area was characterized by a significant quantity of zooplankton [62], and the summer interlude afforded the site an adequate supply of food substrates and an environment conducive to microbial growth, thereby enabling juveniles to disperse extensively while reestablishing an equilibrium in the resource base. Regarding the 15 fish species in the maritime zone adjacent to the coastal region of Xiamen, Han et al. [63] reached the conclusion that the ecological niche width is an inadequate indicator of an organism’s biomass.

4.2. Niche Overlap

The ecological niche overlap is a measurement of the similarity in the ways in which species use resources [64], which can occur when two species share a common need for certain habitat resources [65]. It is a necessary but not exhaustive condition for interspecific competition [66]. Specifically, when shared resources are scarce, species with overlapping ecological niches are prone to interspecific competition; when shared resources are abundant, it is a fallacy to assume that ecological niche overlap inevitably results in species being in competition with one another [67]. The ecological niche overlap of the dominant fish species in Xiamen’s coastal waters amounted to between 0 and 0.915. The ecological niche overlap values varied widely in this study, among which the highest overlap value (0.809) was found in spring for the daggertooth pike conger and C. macrolepidotus, both of which are demersal fishes that often inhabit muddy and sandy substrates and have the same feeding habits as carnivorous fishes, with small fish and small crustaceans as the main species. In autumn, the highest overlap value (0.915) was found for J. belengerii and C. mystus, which belong to the same taxonomic family and are both warm temperate bottom-dwellers inhabiting muddy and sandy substrates; they are omnivorous fishes feeding mainly on small fishes and benthic animals. The competition between species appears to be intense when resources in their habitats are scarce. Therefore, the presence of shared habitats influences the degree of ecological niche overlap amongst species within the same ecosystem and with similarities in their prey composition and predation relationships. Li [68] reached similar conclusions. In addition, Pratchett et al. [69] revealed that variations in feeding habits and habitats among fish of comparable ecological status can mitigate competition for food resources.

4.3. Overall Association and Interspecific Association

Interspecific associations reflect the interactions between different species, the community dynamics, and the status of each species in the community [70]. Based on the VR and W, the overall non-significant associations between the dominant fish species in Xiamen’s inshore seas in spring indicate that the species are more independent of each other. The total non-significant association amongst the dominant fish species in autumn indicates that the dominant fish species are loosely related to each other. The biological and ecological attributes of the species are the primary factors contributing to this phenomenon [70,71]. This is also potentially attributable to the prevailing phase of community succession. According to the findings from the χ2 test (Table 4), of the 105 pairs of 15 dominant fish species in spring and autumn, 91 pairs and 85 pairs had no significant association, and the pairs were more independent of each other, accounting for 86.7% and 81.0% of the total pairs. This suggests that a significant positive association does not exist among the dominant fishes in this sea area, indicating a low level of interdependence between the species present in this marine region. To some extent, this can be attributed to the influence of the intricate topography of the continental shelf in the vicinity of the Xiamen coastline, which is characterized by geomorphological types such as accretionary shelf plains, erosion–accretionary shelf plains, and grooves [72]. As a result, it is possible that the wide sea area in the bay, with its low winds and slow waves, makes it easier for these species to find a favorable environment for survival and be less dependent on each other [66]. As a result, there is less communication between fishes, and the low interdependence of individual species in the area allows each species to occupy more suitable living conditions, leading to a decrease in interspecific relationships. In addition to internal disturbances, the Xiamen–Jinshan waterway sea area and the Xiamen–West Sea area, as important navigation passages, also hinder fish interspecific associations to a certain extent [73]. It is evident that external disturbances, such as the construction of cross-sea bridges and coastal engineering projects, exert a considerable influence on the formation and maintenance of interspecific associations [74].
The AC in spring and autumn showed that up to 34 and 31 of the 105 species pairs, respectively, tended to be independent, which may have been due to the fact that only the AC values of the prominent fish species that exerted the greatest influence on the ecosystem are discussed in this work, and the entirety of marine swimming fauna was not considered. It is also possible that the community is characterized by a high level of complexity and diversity in species, which may have reduced the likelihood of spatial congruence between pairs of species, resulting in relatively independent interspecific associations. The overall connectivity of the dominant fishes in this area was found to be low, which is in line not only with the results of the χ2 test but also with the Spearman’s rank correlation coefficient and the Pearson’s correlation coefficient, both of which were less than 1. This suggests that the dominant fishes in the offshore waters of Xiamen are in a relatively independent state.
The χ2 analysis, Pearson’s correlation test, and Spearman’s non-parametric correction test indicated that the dominant species in the community showed minimally significant correlations, the degree of linkage between pairs of species was low, and most of them had independent spatial distributions [60,75]. The findings of the three tests indicated that the proportion of species pairs exhibiting significant positive linkages was less than that of species pairs exhibiting significant negative linkages. Moreover, the significance rate of the species pairs was low, indicating that the competition and interspecific linkages of the dominant fishes in the coastal waters of Xiamen were weak.
In the coastal waters of Xiamen, the interspecific competition between the dominant fish species was weak, probably because they were differentiated in the ecological niche, reducing the likelihood of direct competition for food and habitats [76]. At the same time, the more dispersed interspecific associations mean that their temporal and spatial distribution patterns reduce their interactions with each other, probably because they do not biologically form close symbiotic relationships. This weak competition and dispersed association alleviate some of the pressure of interspecific competition for resources and space and favor the coexistence of species in the early stages of ecological succession [77]. This balance is essential in maintaining ecosystem function and stability, as it allows different species to use the available resources more efficiently while maintaining high species diversity [16].
The present study revealed that negatively correlated species pairs constituted a specific proportion, indicating that the inshore marine ecosystems in Xiamen are heterogeneous in certain respects. Furthermore, the number of negatively correlated species increases because certain species may choose to associate with species that have different functions, habitats, or habits. This leads to the formation of relatively weak relationships and associations between certain species. Additionally, these species have been observed to exhibit higher levels of competitiveness and survivorship than other fish species.

5. Conclusions

In this study, we conducted an inaugural analysis of both the ecological niches and interspecific relationships of the dominant fish communities inhabiting the marine environment of Xiamen. Our findings indicate that medium-ecological-niche species represent the dominant species in such marine ecosystems. The niche width and niche overlap values were 0.765–2.231 and 0.00–0.809 in spring and 1.246–2.192 and 0.00–0.915 in autumn, respectively. The interspecific linkage test showed that the two species types were more independent of each other and had a generally negative relationship.
Future research should adopt an integrated approach to explore the dynamic changes in Xiamen’s offshore marine ecosystem, which is essential in assessing and protecting the health of the marine ecosystem. In promoting the sustainable development of China’s modern fisheries, it is recommended that local governments leverage their resource advantages, including traditional knowledge of local fisheries, experience in the management of marine resources, and the participation of local communities. At the same time, the introduction and development of new technologies are also key. Finally, the formulation and optimization of relevant policies are essential to support the healthy development of fisheries. This includes formulating reasonable fishery resource quota management policies, promoting the transformation and upgrading of the fishery industry, protecting the marine ecosystem, and promoting the sustainable development of fishing communities. Through these measures, the long-term sustainable use of fishery resources can be ensured, while maintaining the integrity and function of the marine ecosystem.

Author Contributions

Conceptualization, L.-M.H., H.-Q.X. and T.-J.C.; methodology, L.-M.H. and H.-Q.X.; software, T.-J.C. and H.-Q.X.; validation, L.-M.H., H.-Q.X. and T.-J.C.; formal analysis, L.-M.H. and H.-Q.X.; investigations, L.-M.H. and H.-Q.X.; resources, L.-M.H. and H.-Q.X.; data management, L.-M.H., H.-Q.X. and T.-J.C.; writing—original draft preparation. H.-Q.X.; writing—revision and editing, H.-Q.X., L.-M.H. and T.-J.C.; visualization, J.-Y.Y., Y.-H.C. and J.-Q.W.; oversight, F.-F.J.; project management, J.L.; funding acquisition. J.-D.C. All authors have read and agreed to the published version of the manuscript.

Funding

This research was funded by the Special Survey on Fishery Resources of Special Economic Species in Key Marine Areas of Fujian Province, grant number B2024030, and Evaluation of the Effect of Sparus latus release in Xiamen Bay (S20166). The funders had no role in the study design, data collection, and analysis, the decision to publish, or the preparation of the manuscript.

Institutional Review Board Statement

Our study was based on text analysis; it did not involve research on human subjects, animals, or cell lines, so it did not require ethical approval and permission.

Informed Consent Statement

Not applicable.

Data Availability Statement

Data are contained within the article.

Acknowledgments

We thank Kuo, Huang, and Shi for their contributions to the suggested revisions of the manuscript. Helpful suggestions from anonymous reviewers have been incorporated into the manuscript.

Conflicts of Interest

The authors declare no conflicts of interest.

References

  1. Pocheville, A. The ecological niche: History and recent controversies. In Handbook of Evolutionary Thinking in the Sciences; Springer: New York, NY, USA, 2015; pp. 547–586. [Google Scholar]
  2. Parrish, J.; Bazzaz, F. Competitive interactions in plant communities of different successional ages. Ecology 1982, 63, 314–320. [Google Scholar] [CrossRef]
  3. Xue, W.X.; Li, C.H.; Ai, X.R.; Yao, L.; Guo, Q.J.; Zhu, J. Niche and interspecific association of dominant tree species in Liriodendron chinense natural forest. J. Agrofor. Environ. 2023, 43, 26–34. (In Chinese) [Google Scholar]
  4. Albert, J.S.; Tagliacollo, V.A.; Dagosta, F. Diversification of Neotropical freshwater fishes. Annu. Rev. Ecol. Evol. Syst. 2020, 51, 27–53. [Google Scholar] [CrossRef]
  5. Rota, E.; Caruso, T.; Bargagli, R. Community structure, diversity and spatial organization of enchytraeids in Mediterranean urban holm oak stands. Eur. J. Soil Biol. 2014, 62, 83–91. [Google Scholar] [CrossRef]
  6. Ma, Y.M.; Li, Q.H.; Pan, S.P.; Kuang, P.; Jin, S. Dynamic analysis of niche and interspecific association of dominant phytoplankton species in Huaxi Reservoir of Guizhou Plateau. J. Lake Sci. 2021, 33, 785–796. (In Chinese) [Google Scholar]
  7. Wang, Z.L.; Chen, Y.; Chen, X.M.; Wang, S.Y.; Zhao, J.J. Temporal-spatial niches of Chinese White Wax Scale insect (Ericerus pela) and its three dominant parasitoid wasps. Acta Ecol. Sin. 2011, 31, 914–922. (In Chinese) [Google Scholar]
  8. Grinnell, J. The niche-relationships of the California Thrasher. Auk 1917, 34, 427–433. [Google Scholar] [CrossRef]
  9. Elton, C.S. The Animal Community. In Animal Ecology; Macmillan Co.: New York, NY, USA, 1927; pp. 50–55. [Google Scholar]
  10. Hutchinson, G.E. Population studies: Animal ecology and demography. Bull. Math. Biol. 1991, 53, 193–213. [Google Scholar] [CrossRef]
  11. Pan, G. Study on the Biodiversity and Niche of Three Forest Communities Inhilly Red Soil Region of Southern China; Central South University of Forestry and Technology: Changsha, China, 2016. (In Chinese) [Google Scholar]
  12. Duan, Y.; Wang, A.Y.; Wang, X.L.; Liu, X.Z.; Chai, Y.; Lu, Y.; Wang, B.; Dong, J. Seasonal Variation and Community Structure of Zooplankton in Northern Yellow Sea in Liaoning in Spring and Summer. Fish. Sci. China 2017, 36, 456–461. [Google Scholar]
  13. Li, P.; Li, Y.L.; Fu, J.; Yu, X.G.; Zou, C.J. Niche characteristics of macrobenthic community in the intertidal zone on the west coast of Liaodong Bay. Adv. Mar. Sci. 2019, 43, 32–39. (In Chinese) [Google Scholar]
  14. Vannette, R.L.; Fukami, T. Historical contingency in species interactions: Towards niche-based predictions. Ecol. Lett. 2014, 17, 115–124. [Google Scholar] [CrossRef] [PubMed]
  15. Zhang, T.; Zhang, J.L.; Zhang, C.; Yang, T.; Pu, L.H.; Zhao, W.Q.; Chen, P.L. The niche of dominant plant species in the karst soil nutrient resource axis around FAST. China J. Ecol. 2023, 42, 1820–1828. (In Chinese) [Google Scholar]
  16. Liu, L.G.; Zhu, Z.Q.; Chen, X.; Liu, S.J. Ecological Niche and Interspecific Association of Dominant Species in the Initial Stage of Vegetation Restoration in Zhongba Village of Xide County. J. West China For. Sci. 2022, 51, 110–117. (In Chinese) [Google Scholar]
  17. Liu, R.H.; Chen, L.; Tu, H.R.; Liang, S.C.; Jiang, Y.; Li, Y.J.; Huang, D.L.; Nong, J.L. Niche and interspecific association of main species in shrub layer of Cyclobalanopsis glauca community in karst hills of Guilin, southwest China. Acta Ecol. Sin. 2020, 40, 2057–2071. (In Chinese) [Google Scholar]
  18. Xu, M.H.; Liu, M.; Zhai, D.T.; Liu, T. A review of contents and methods used to analyze various aspects of plant interspecific associations. Acta Ecol. Sin. 2016, 36, 8224–8233. (In Chinese) [Google Scholar]
  19. Liu, Y.; Zheng, Y.Y.; Ao, Y.Y. Niche and interspecific association of dominant bryophytes on different substrates. Acta Ecol. Sin. 2019, 39, 286–293. (In Chinese) [Google Scholar]
  20. Colwell, R.K.; Futuyma, D.J. On the measurement of niche breadth and overlap. Ecology 1971, 52, 567–576. [Google Scholar] [CrossRef]
  21. Mueller, L.D.; Altenberg, L. Statistical inference on measures of niche overlap. Ecology 1985, 66, 1204–1210. [Google Scholar] [CrossRef]
  22. Leibold, M.A. The niche concept revisited: Mechanistic models and community context. Ecology 1995, 76, 1371–1382. [Google Scholar] [CrossRef]
  23. Vandermeer, J. The niche construction paradigm in ecological time. Ecol. Modell. 2008, 214, 385–390. [Google Scholar] [CrossRef]
  24. Yu, S.X.; Ao, L.X. Meaning and measurement of foundational and realization ecological niches and their centroids. Acta Sci. Nat. Univ. Sunyatseni 1993, 34, 69–80. (In Chinese) [Google Scholar]
  25. Zhang, T.; Jia, R.L.; Gao, Y.H.; Sun, J.Y.; Zhao, Y.; Liu, L.C. Niche characteristics and interspecific associations of main biocrust- forming organisms during the succession of artificially sand-binding vegetation in Shapotou, Ningxia, China. J. Desert. Res. 2021, 41, 100–108. (In Chinese) [Google Scholar]
  26. Hao, J.F.; Li, Y.; Qi, J.Q.; Pei, Z.L.; Huang, Y.J.; Jiang, Q.; Chen, Y. Effects of anthropogenic disturbances on the species diversity and niche of the dominant populations in a Castanopsis fargesii secondary forest community in Bifengxia, Sichuan. Acta Ecol. Sin. 2016, 36, 7678–7688. [Google Scholar]
  27. Liang, Y.L.; Guo, Q.X. Determining niches of the major tree species based on a flow accumulation technique in a natural secondary forest in Northeastern China. Acta Ecol. Sin. 2010, 30, 2874–2882. (In Chinese) [Google Scholar]
  28. Allen, R.M.; Metaxas, A.; Snelgrove, P.V. Applying movement ecology to marine animals with complex life cycles. Annu. Rev. Mar. Sci. 2018, 10, 19–42. [Google Scholar] [CrossRef]
  29. Gelviz-Gelvez, S.M.; Pavón, N.P.; Illoldi-Rangel, P.; Ballesteros-Barrera, C. Ecological niche modeling under climate change to select shrubs for ecological restoration in Central Mexico. Ecol. Eng. 2015, 74, 302–309. [Google Scholar] [CrossRef]
  30. Nosil, P.; Sandoval, C.P. Ecological niche dimensionality and the evolutionary diversification of stick insects. PLoS ONE 2008, 3, 1907. [Google Scholar] [CrossRef]
  31. Tsuchiya, C.; Sakata, T.; Sugita, H. Novel ecological niche of Cetobacterium somerae, an anaerobic bacterium in the intestinal tracts of freshwater fish. Lett. Appl. Microbiol. 2008, 46, 43–48. [Google Scholar] [CrossRef] [PubMed]
  32. Valladares, F.; Sánchez-Gómez, D. Ecophysiological traits associated with drought in Mediterranean tree seedlings: Individual responses versus interspecific trends in eleven species. Plant Biol. 2006, 8, 688–697. [Google Scholar] [CrossRef]
  33. Belshe, E.F.; Hoeijmakers, D.; Herran, N.; Mtolera, M.; Teichberg, M. Seagrass community-level controls over organic carbon storage are constrained by geophysical attributes within meadows of Zanzibar, Tanzania. Biogeosciences 2018, 15, 4609–4626. [Google Scholar] [CrossRef]
  34. Mouton, J.C.; Martin, T.E. Fitness consequences of interspecific nesting associations among cavity-nesting birds. Am. Nat. 2018, 192, 389–396. [Google Scholar] [CrossRef] [PubMed]
  35. Luo, B.C. Ecological Characteristics and Fishery Resources of Estuaries and Offshore Areas. In Life Below Water. Encyclopedia of the UN Sustainable Development Goals; Springer: Cham, Switzerland, 1992; pp. 24–30. (In Chinese) [Google Scholar]
  36. Huang, L.M.; Zhang, H.J.; Zhang, Y.Z.; Lin, T.; Li, J.; Wang, J.Q.; Chang, G.F. Current status and progress of research on the relationship between fish organisms and the aquatic environment in coastal estuaries. Chin. J. Oceanol. Limnol. 2013, 8, 61–68. (In Chinese) [Google Scholar]
  37. Lin, N.; Shen, C.C.; Zhong, J.S. Species composition and seasonal variation of fish larvae and juveniles in Jiulong River estuary. South China Fish. Sci. 2009, 5, 1–8. (In Chinese) [Google Scholar]
  38. Lin, N.; Shen, C.C.; Zhong, J.S. Study on the diversity and migration mechanism of fish larvae and juveniles in Jiulong River estuary. Mar. Fish. 2010, 32, 66–72. (In Chinese) [Google Scholar]
  39. Wang, J.Q.; Shih, Y.J.; Huang, L.M.; Li, J.; Li, W.W.; Shih, C.H.; Chu, T.J. Evaluating the effects related to restocking and stock replenishment of Penaeus penicillatus in the Xiamen Bay, China. J. Mar. Sci. Eng. 2021, 9, 1122. [Google Scholar] [CrossRef]
  40. Xu, C.Y.; Shen, C.C.; Liu, Y.; Ma, C. Species composition and quantitative distribution of spring fisheggs and juveniles in thesouthern sea of Xiamen, China. J. Fujian Fish. 2013, 6, 448–454. (In Chinese) [Google Scholar]
  41. Zhang, H.J.; Huang, L.M.; Li, J.; Wang, J.Q.; Zhang, Y.Z.; Lin, T.; Chang, G.F. Variations of fish community structure in the waters adjacent to Fugong in Jiulongjiang Estuary. J. Appl. Oceanogr. 2013, 32, 7. (In Chinese) [Google Scholar]
  42. Liu, Y.; Xu, C.Y.; Shen, C.C.; Ma, C. Characteristic of nekton community structure in spring and autumn in Jiulongjiang Estuary. J. Fish. Res. 2015, 37, 194–201. (In Chinese) [Google Scholar]
  43. Zhong, Z.H.; Lin, X.Z.; Yang, S.J.; Wang, Z.K.; Chen, S.B. Temporal and spatial distribution of nekton in the Xiamen Sea. J. Oceanogr. Taiwan Strait. 2010, 29, 241–249. (In Chinese) [Google Scholar]
  44. Du, J.G.; Liu, Z.H.; Yu, X.G.; Xu, Z.C.; Hu, W.J.; Chen, B.; Ma, Z.Y.; Lin, J.L. Fish species diversity and trophic level in the Jiulong Estuary. J. Trop. Oceanogr. 2012, 31, 76–82. (In Chinese) [Google Scholar]
  45. Ye, S.Z.; Ke, S.T.; Ma, C.; Luo, D.L.; Liu, Y.; Yang, F.; Guo, S.Y.; Shen, C.C.; Cai, J.D.; Xu, C.Y.; et al. Diversity and Distributional Characteristics of Fishery Biomes in the Jiulong River Estuary. Fish. Sci. 2020, 39, 359–368. (In Chinese) [Google Scholar]
  46. Huang, L.M.; Zhang, Y.Z.; Du, C.X.; Wei, Y.L. Analysis of the species composition and diversity of fish caught by drift gillnets in Xiamen East China Sea. J. Oceanogr. Taiwan Strait. 2007, 26, 261–269. (In Chinese) [Google Scholar]
  47. Huang, L.M.; Xie, Y.J.; Li, J.; Zhang, Y.Z.; Wang, J.Q. The taxonomic diversity of fish community in the coastal waters of Xiamen. Acta Oceanol. Sin. 2013, 35, 126–132. (In Chinese) [Google Scholar]
  48. Pinkas, L.; Oliphant, M.S.; Iverson, I.L.K. Food Habits of Albacore, Bluefin Tuna, and Bonito in California Waters; California Department of Fish and Game: Sacramento, CA, USA, 1971; Volume 152, pp. 1–105.
  49. Cheng, J.S. The Structure and Diversity of Demersal Fish Communities in Winter in the East China Sea and the Yellow Sea. Mar. Fish. Res. 2000, 28, 1–8. (In Chinese) [Google Scholar]
  50. Shannon, C.E. A mathematical theory of communication. Bell Syst. Tech. J. 1948, 27, 379–423. [Google Scholar] [CrossRef]
  51. Pianka, R.E. The Structure of Lizard Communities. Annu. Rev. Ecol. Syst. 1973, 4, 53–74. [Google Scholar] [CrossRef]
  52. Schluter, D. A variance test for detecting species associations, with some example applications. Ecology 1984, 65, 998–1005. [Google Scholar] [CrossRef]
  53. Zhang, J.T. A Quantitative Ecological Approach to Vegetation; China Science and Technology Press: Beijing, China, 1995; pp. 1–380. ISBN 7-5046-1313-4. [Google Scholar]
  54. Li, Y.D.; Xu, H.; Chen, D.X.; Luo, T.S.; Mo, J.H.; Mo, M.; Chen, H.Q.; Jiang, Z.L. Discussing on the Ecological Species Groups and Functional Groups Division Based on the Interspecific Association—A Case Study on the Arbor Layer Data in Tropical Lowland Rain Forest of Jianfenling, Hainan Island, China. Sci. Silvae Sin. 2007, 4, 9–16. (In Chinese) [Google Scholar]
  55. Xiao, Y.M.; Xie, J.Y.; Yao, Y.P.; Liang, S.C.; Gao, L.N.; Zhang, H.; Mo, S.Z. Niche of dominant species in arbor layer of evergreen deciduous broad-leaved mixed forest in karst hills of Guilin, southwestern China. Acta Ecol. Sin. 2021, 41, 8159–8170. [Google Scholar]
  56. Wei, Y.Q.; Song, X.Q.; Zhao, Y.; Shi, Y.H. Interspecific Association of Woody Plants in Michelia shiluensis Community, Diaoluoshan Nature Reserve, Hainan Province. Chin. J. Trop. Crops 2022, 43, 2606–2613. [Google Scholar]
  57. Peng, S.Y.; Li, X.Z.; Wang, H.F.; Zhang, B.L. Niche analysis of dominant species of macrozoobenthic community in the southern Yellow Sea in spring. Acta Ecol. Sin. 2015, 35, 1917–1928. (In Chinese) [Google Scholar]
  58. Hu, C.Y.; Shui, Y.Y.; Du, X.; Shui, B.N. Niche and interspecific association of nekton in the south coastal waters of Cangnan, Zhejiang, China. Chin. J. Appl. Ecol. 2015, 26, 3195–3201. (In Chinese) [Google Scholar]
  59. Ge, B.M.; Zheng, X.; Cheng, H.Y.; Bao, Y.X.; Chen, L. The Macrobenthic Community and Niche Analysis of Creeks in Diked Tidal Flat at Lingkun Island, Wenzhou Bay. Acta Hydrobiol. Sin. 2007, 31, 675–681. (In Chinese) [Google Scholar] [CrossRef]
  60. Li, S.F.; Liu, W.D.; Su, J.R.; Lang, X.D.; Zhang, Z.J. Niche and Interspecific Association of Species of Taxus yunnanensis Communities in Northwest Yunnan Province. Plant Sci. J. 2012, 30, 568–576. (In Chinese) [Google Scholar] [CrossRef]
  61. Carscadden, K.A.; Emery, N.C.; Arnillas, C.A.; Cadotte, M.W.; Afkhami, M.E.; Gravel, D.; Livingstone, S.W.; Wiens, J.J. Niche breadth: Causes and consequences for ecology, evolution, and conservation. Q. Rev. Biol. 2020, 95, 179–214. [Google Scholar] [CrossRef]
  62. Xie, F.; Liang, J.; Xing, K. Distribution characteristics of zooplankton in summer and autumn in the coastal waters of Hainan Island. Coast. Eng. J. 2019, 38, 280–292. (In Chinese) [Google Scholar]
  63. Han, D.; Xue, Y.; Ji, Y.; Xu, B.; Liu, H.; Ma, Q. Trophic and spatial niche of five gobiid fishes in Jiaozhou Bay. J. Fish. Sci. China. 2013, 20, 148–156. (In Chinese) [Google Scholar] [CrossRef]
  64. Xu, C.Y.; Yu, Q.J.; Xu, F.J.; Hu, X.Q.; You, W.H. Niche analysis of phytoplankton’s dominant species in Dianshan Lake of East China. Chin. J. Appl. Ecol. 2012, 23, 2550–2558. (In Chinese) [Google Scholar]
  65. Liu, S.Y.; Yu, X.X.; Chen, L.H. Interspecific association and niche research of natural forest in Beijing mountainous area. J. Northeast For. Univ. 2009, 24, 26–30. (In Chinese) [Google Scholar]
  66. Deng, X.Y.; Liu, J.G.; Guo, P.J.; Yu, C.G.; Zhang, P.; Zheng, J.; Xie, X.; Miao, L. Niche and interspecific association of major nekton in Xiao Yangshan adjacent waters. Acta Oceanol. Sin. 2018, 40, 96–105. (In Chinese) [Google Scholar]
  67. Liao, B.W.; Li, M.; Zheng, S.F.; Chen, Y.J.; Zhong, C.R.; Huang, Z.Q. Niches of several mangrove species in Dongzhai harbor of Hainan island. Chin. J. Appl. Ecol. 2005, 16, 403–407. (In Chinese) [Google Scholar]
  68. Li, X.S.; Yu, Z.H.; Sun, S.; Jin, X.S. Ecological niche breadth and niche overlap of dominant species of fish assemblage in Yangtze River estuary and its adjacent waters. Chin. J. Appl. Ecol. 2013, 24, 2353–2359. (In Chinese) [Google Scholar]
  69. Pratchett, M.; Berumen, M. Interspecific variation in distributions and diets of coral reef butterflyfishes (Teleostei: Chaetodontidae). J. Fish Biol. 2008, 73, 1730–1747. [Google Scholar] [CrossRef]
  70. Yu, X.B.; Yu, R.; Huang, J.; Yuan, Z.Y.; Yang, F.; Han, G.D. Analysis on interspecific associations among dominant populations in each layer of Loropetalum subcordatum community in Maolan National Nature Reserve of Guizhou. J. Plant Resour. Environ. 2018, 27, 24–32. (In Chinese) [Google Scholar]
  71. Su, S.J.; Liu, J.F.; He, Z.S.; Zheng, S.Q.; Hong, W.; Xu, D.W. Ecological species groups and interspecific association of dominant tree species in Daiyun Mountain National Nature Reserve. J. MT Sci.-Engl. 2015, 12, 637–646. (In Chinese) [Google Scholar] [CrossRef]
  72. Bao, J.J. Study on Topography and Geomorphologyof Xiamen Bay and its Adjacent Regions. Master’s Thesis, Third Institute of Oceangraphy, Ministry of Natutural Resources, Xiamen, China, 2021. (In Chinese). [Google Scholar]
  73. Zhu, X.J. The community structure and biodiversity of nekton in Xiamen sea area, Fujian Province. J. Fish. Res. 2024, 46, 69–84. (In Chinese) [Google Scholar]
  74. Sattler, T.; Bontadina, F.; Hirzel, A.H.; Arlettaz, R. Ecological niche modelling of two cryptic bat species calls for a reassessment of their conservation status. J. Appl. Ecol. 2007, 44, 1188–1199. [Google Scholar] [CrossRef]
  75. Zhang, L.N.; Zhu, G.Q.; Yang, K.; Liu, X.Y.; Gong, H.D.; Zheng, L. Niche and interspecific association of main woody plants in Myrica nana shrubland in central Yunnan, China. Chin. J. Plant Ecol. 2022, 46, 1400. (In Chinese) [Google Scholar] [CrossRef]
  76. Wang, J.Q.; Li, J.; Shih, Y.J.; Huang, L.M.; Wang, X.R.; Chu, T.J. Sustainability perspective of Minjiang Estuary coastal fisheries management—Estimation of fish richness. Water 2023, 15, 2648. [Google Scholar] [CrossRef]
  77. Huang, L.M.; Wang, J.Q.; Shih, Y.J.; Li, J.; Chu, T.J. Revealing the effectiveness of fisheries policy: A biological observation of species Johnius belengerii in Xiamen Bay. J. Mar. Sci. Eng. 2022, 10, 732. [Google Scholar] [CrossRef]
Figure 1. Survey stations in the Xiamen Seas area.
Fishes 09 00354 g001
Figure 2. Variation in width values of major fish ecological niches in spring (a) and in autumn (b). Upper case ABC stands for different ecological niche widths in spring and lower case ab stands for different ecological niche widths in autumn, respectively.
Fishes 09 00354 g002
Figure 3. Semi-matrix of the association coefficients (AC) for major fishes in the inshore waters of Xiamen. (a) For spring; (b) for autumn.
Fishes 09 00354 g003
Figure 4. Semi-matrix of Pearson’s coefficients for major fishes in the inshore waters of Xiamen. (a) For spring; (b) for autumn.
Fishes 09 00354 g004
Figure 5. Semi-matrix of Spearman’s values for major fishes in the inshore waters of Xiamen. (a) For spring; (b) for autumn.
Fishes 09 00354 g005
Table 1. Relative importance indices (IRI) of major fishes and their ecological niche widths (Bi).
SpeciesDominant SpeciesSpringAutumn
IRIBiIRIBi
S1 *Johnius belengerii2763.2682.3213807.4842.192
S2 *Chiloscyllium plagiosum2094.4891.789129.2941.550
S3 *Trypauchen vagina1185.7172.097319.5961.480
S5 *Leiognathus brevirostris350.2570.9281613.3931.390
S7 *Dasyatis zugei252.1401.034129.8941.386
S8 *Argyrosomus argentatus193.9251.518298.6961.227
S13 *Daggertooth pike conger128.7451.475204.3051.494
S14Cynoglossus macrolepidotus118.3641.165
S15Pleuronichthys cornutus104.3761.336
S4Platyrhina limboonkengi761.2241.750
S6Sebastiscus marmoratus304.4130.765
S9Dasyatis akajei172.8811.277
S10Cynoglossus abbreviatus163.1441.611
S11Cociella crocodilla141.1591.717
S12Platyrhina sinensis134.6110.796
S16Coilia mystus 119.2711.691
S17Harpodon nehereus 703.3511.676
S18Plotosus anguillaris 538.7701.146
S19Dendrophysa russelii 192.6231.954
S20Sillago sihama 190.9762.091
S21Ostorhinchus quadrifasciatus 185.9362.045
S22Larimichthys crocea 179.1871.716
S23Siganus canaliculatus 131.6501.246
* represents species shared in spring and autumn.
Table 2. The values of the ecological niche overlap for major fishes in spring.
S1S2S3S4S5S6S7S8S9S10S11S12S13S14
S20.467
S30.5160.364
S40.6100.3570.313
S50.0980.0450.2340.004
S60.5260.1520.0190.0030.119
S70.3090.4180.3160.5240.0030.003
S80.2260.0580.4610.1770.0020.0010.055
S90.3600.5160.1510.2510.0600.4760.0000.030
S100.3510.3650.4260.4640.0060.0000.3010.7500.064
S110.4730.1720.2090.3020.0700.6270.0550.4590.4570.236
S120.4710.2330.3060.5600.0050.0050.2850.3240.0000.7160.157
S130.3290.3280.3560.1920.0500.0130.0370.3870.1430.0690.5660.053
S140.1570.0070.3280.1430.0840.0000.0000.6430.0220.2020.6070.0330.809
S150.4440.0000.1480.0600.0520.3050.0000.5440.0000.3010.3070.0830.3850.506
Table 3. The values of the ecological niche overlap for major fishes in autumn.
S1S4S17S18S3S6S7S19S20S21S22S23S5S2
S40.028
S170.5610.000
S180.0240.9080.000
S30.1280.0150.1990.001
S60.8300.0000.0740.0000.021
S70.2950.1800.3810.3940.1690.018
S190.1490.5610.1630.5630.4870.0100.532
S200.3440.6820.1240.6600.0370.2650.2450.601
S210.6520.1120.9060.1110.2440.1530.5510.2670.202
S220.6870.0000.8570.0000.1100.2810.2170.0740.1810.775
S230.0920.2950.0000.1140.0770.0010.1430.5910.6300.0340.000
S50.4410.0020.6270.0000.1690.0140.2500.0850.0980.6860.6510.029
S20.3010.4650.4150.5510.3580.0210.5280.3340.5030.5170.2620.0520.302
S160.9150.0000.3910.0000.0530.8150.2090.0240.3210.5420.5440.0000.3140.252
Table 4. Overall associations of major fishes in the inshore waters of Xiamen.
Season δ T 2 S T 2 VRWX2(x20.95(15), x20.05(15)) Inspection Result
Spring3.104.511.4521.79(7.26, 25.0)Non-significant
positive association
Autumn3.301.660.507.56(7.26, 25.0)Non-significant
negative association
Table 5. Chi-square test of the main fish species in spring in Xiamen’s waters.
S1S2S3S4S5S6S7S8S9S10S11S12S13S14
S211.25 **
S30.029.40 **
S43.360.0211.25 **
S50.10.161.8911.12 **
S60.181.040.185.13 *10.32
S72.560.193.650.010.3310.32 **
S80.10.850.550.940.010.0111.12 **
S92.560.190.180.010.330.560.0110.32 **
S100.10.160.10.941.721.150.010.0111.12 **
S110.060.020.061.890.180.183.230.180.5511.25 **
S120.020.030.020.160.191.042.930.190.160.029.40 **
S130.030.470.030.310.040.040.310.040.310.030.4710.84 **
S141.640.470.030.311.071.072.810.040.311.640.470.0410.84 **
S155.66 *0.470.840.310.041.070.311.070.310.030.470.040.9410.84
* represents highly significant associations, ** represents significant associations.
Table 6. Chi-square test of the main fish species in autumn in Xiamen’s waters.
S1S5S17S18S3S8S13S19S20S21S22S23S7S2
S511.25 **
S1711.2511.25
S185.66 *5.66 *10.84
S30.060.061.6411.25 **
S81.891.892.810.111.12 **
S130.030.030.040.030.3110.84 **
S193.363.360.840.060.550.8411.25 **
S200.180.181.072.561.150.040.1810.32 **
S211.641.640.040.030.310.040.840.0410.84 **
S225.90 *5.90 *2.810.10.010.313.230.010.3111.12
S238.14 **8.14 **2.810.10.940.311.890.012.814.18 *11.12
S70.180.181.072.560.010.040.550.330.041.150.0110.32 **
S20.030.030.040.030.310.940.840.040.040.310.310.0410.84 **
S165.90 *5.90 *2.810.11.40.313.230.010.315.10 *4.18 *0.010.3111.12
* represents highly significant associations, ** represents significant associations.
Disclaimer/Publisher’s Note: The statements, opinions and data contained in all publications are solely those of the individual author(s) and contributor(s) and not of MDPI and/or the editor(s). MDPI and/or the editor(s) disclaim responsibility for any injury to people or property resulting from any ideas, methods, instructions or products referred to in the content.

