1. Introduction
The blind Mexican tetra (
Astyanax mexicanus), known for its unique evolutionary adaptations and genetic distinctiveness, is one of the most extensively studied cave organisms in the world [
1]. Originally found in the limestone caves of northeastern Mexico, this species exhibits diverse phenotypic variations ranging from surface-dwelling forms to multiple cave-dwelling morphs that have adapted to complete darkness over millennia [
2]. Advancements in genomic technologies have enabled the comprehensive sequencing of its genome, providing invaluable insights into its evolutionary history and genetic adaptations [
3]. As a result,
Astyanax has become a key model organism in evolutionary developmental biology (evo-devo), offering a unique opportunity to study the genetic mechanisms underlying morphological and behavioral evolution [
4].
Despite its status as a model organism [
5], considerable gaps remain in our understanding of its field ecology [
6]. There is a scarcity of studies on fundamental ecological parameters such as population size, density, and distribution within the cave habitat, which are crucial for understanding the species’ population dynamics and conservation status. To our knowledge, only a few capture–mark–recapture studies have estimated the population size of
Astyanax cavefish [
7,
8].
In 1971, Elliott captured, marked, and recaptured fish in Sótano de Yerbaniz and Cueva de El Pachón using caudal fin clips, estimating populations of 8671 (95% confidence interval (CI) 1810–15534) and 9781 (95% CI of 1179–18283), respectively [
7,
8]. Later studies used less invasive methods, collecting DNA by swabbing each fish’s flank to obtain two independent sample replicates per individual. Genotyping was then performed with 26 microsatellite loci [
8]. Their study had the power of multiple repeats throughout the years 2016, 2019, and 2022. This allowed for population size estimates within a single pool isolated during the dry season versus a population where specimens had mixed within the available hydric system of the cave throughout multiple rainy seasons. For the Pachón main pool during the dry season of 2022, 29 fish were sampled twice three days apart, with three pairs of identical genotypes identified. The population was estimated at 218 cavefish (95% CI 40–395). For the entire hydric system of the cave, 35 individuals genotyped in 2019 were compared to 55 in 2022, with 3 recaptured after three years, and the population was estimated at 490 (95% CI 76–904).
Elliott’s 1971 estimate of about 10,000 individuals contrasts sharply with the 2022 estimate of a few hundred, raising concerns about the population’s long-term viability [
8]. The Pachón cave population, extensively used in
Astyanax research with over 500 cited articles, has thus seen a significant decline.
Given the scarcity of fundamental ecological data essential for conserving
Astyanax, we decided to test a method that could provide not only population size, but density and distribution within the cave habitat as well. If population size estimates are performed at sites where densities are abnormally high, this may give a false impression that the underground system has a higher abundance of fish than it truly does, impairing conservation efforts. Most of the
Astyanax localities studied are in pools of constrained size, typically perched, which are formed during the dry season when the water recedes and concentrates aquatic organisms within the confines of a small area. Examples are Pachon’s main and side pools, Tinaja’s pools #1–3, Rio Subterraneo’s pools #1–2, and Molino’s pools #1–2 [
9]. During the rainy season, caves flood, allowing for broader distributions of fish. For this study, we were interested in assessing the density and abundance of organisms in long, continuous water passages instead. We were also interested in studying areas beyond sumps that make them inaccessible to humans without scuba techniques. These passages would be more similar to passages under the phreatic level, where fish have easier dispersal potential. These underwater passages beyond sumps constitute the main hydric system at El Abra karstic area, and thus could potentially be where many of the
Astyanax fish live. Finally, we were also interested in a method that avoided the invasive procedures of capture–mark–recapture. Here, we report the results of using the line transect sampling method in Sabinos Cave. We also report on drone-based density observations in the underwater galleries beyond the sumps of Toro/Calera.
2. Materials and Methods
The first study site selected was Sabino’s pool #1, shown in maps as “Elliott’s swim”. A detailed description of this and all caves mentioned in this study can be found in [
7]. This pool is 310 m long. The first 10 m are under a high vault inhabited by a large bat colony. Then, there is a low ceiling that allows for just a few centimeters of air above the water. This low ceiling prevents the passage of most bats. In the next 300 m of the gallery, no bats were seen. Data collection took place in February 2023.
Due to the first 10 m having a high density of fish that would impede obtaining accurate visual counts of individuals, videos were taken from a high vantage point. In the laboratory, the clips were analyzed to count all individual adult fish. Fish were easily counted thanks to the high contrast of the fish’s white coloration against the black background of the floor, as well as to the pool not being too deep at this point, allowing for unambiguous visualization of all adults in the videoclips regardless of their position in the water column.
Starting at the low ceiling point, the line transect sampling method was used to quantify the number of fish. The line transect method is a technique used to estimate the abundance or density of organisms in an underwater environment, such as fish in this case [
10]. To define the transect line, one observer snorkeled along the gallery, pulling a 20 m rope. As the observer swam along the transect line, careful counts were made of all the fish that were within the defined width of 0.75 cm on both sides of the transect line (width of 1.5 m) and 2 m in front of the observer at a time as a snapshot view, repeated throughout the length of the 20 m transect. Swimming was performed at a constant speed of about 10 s per meter. This speed was used because already-counted fish would not gain on the observer and be recounted, but at the same time, it was slow enough to allow for detailed observations to count all individuals within the 1.5 m by 2 m snapshot counts. The procedure was repeated until the 300 m water passage ended.
After completing the survey, the data collected (number of fish counted within each 1.5 m × 20 m section) were used to calculate the fish density in that specific section of the gallery. The entire area of the gallery was measured using a map from [
7]. Then, the number of fish counted within the transect area (30 m
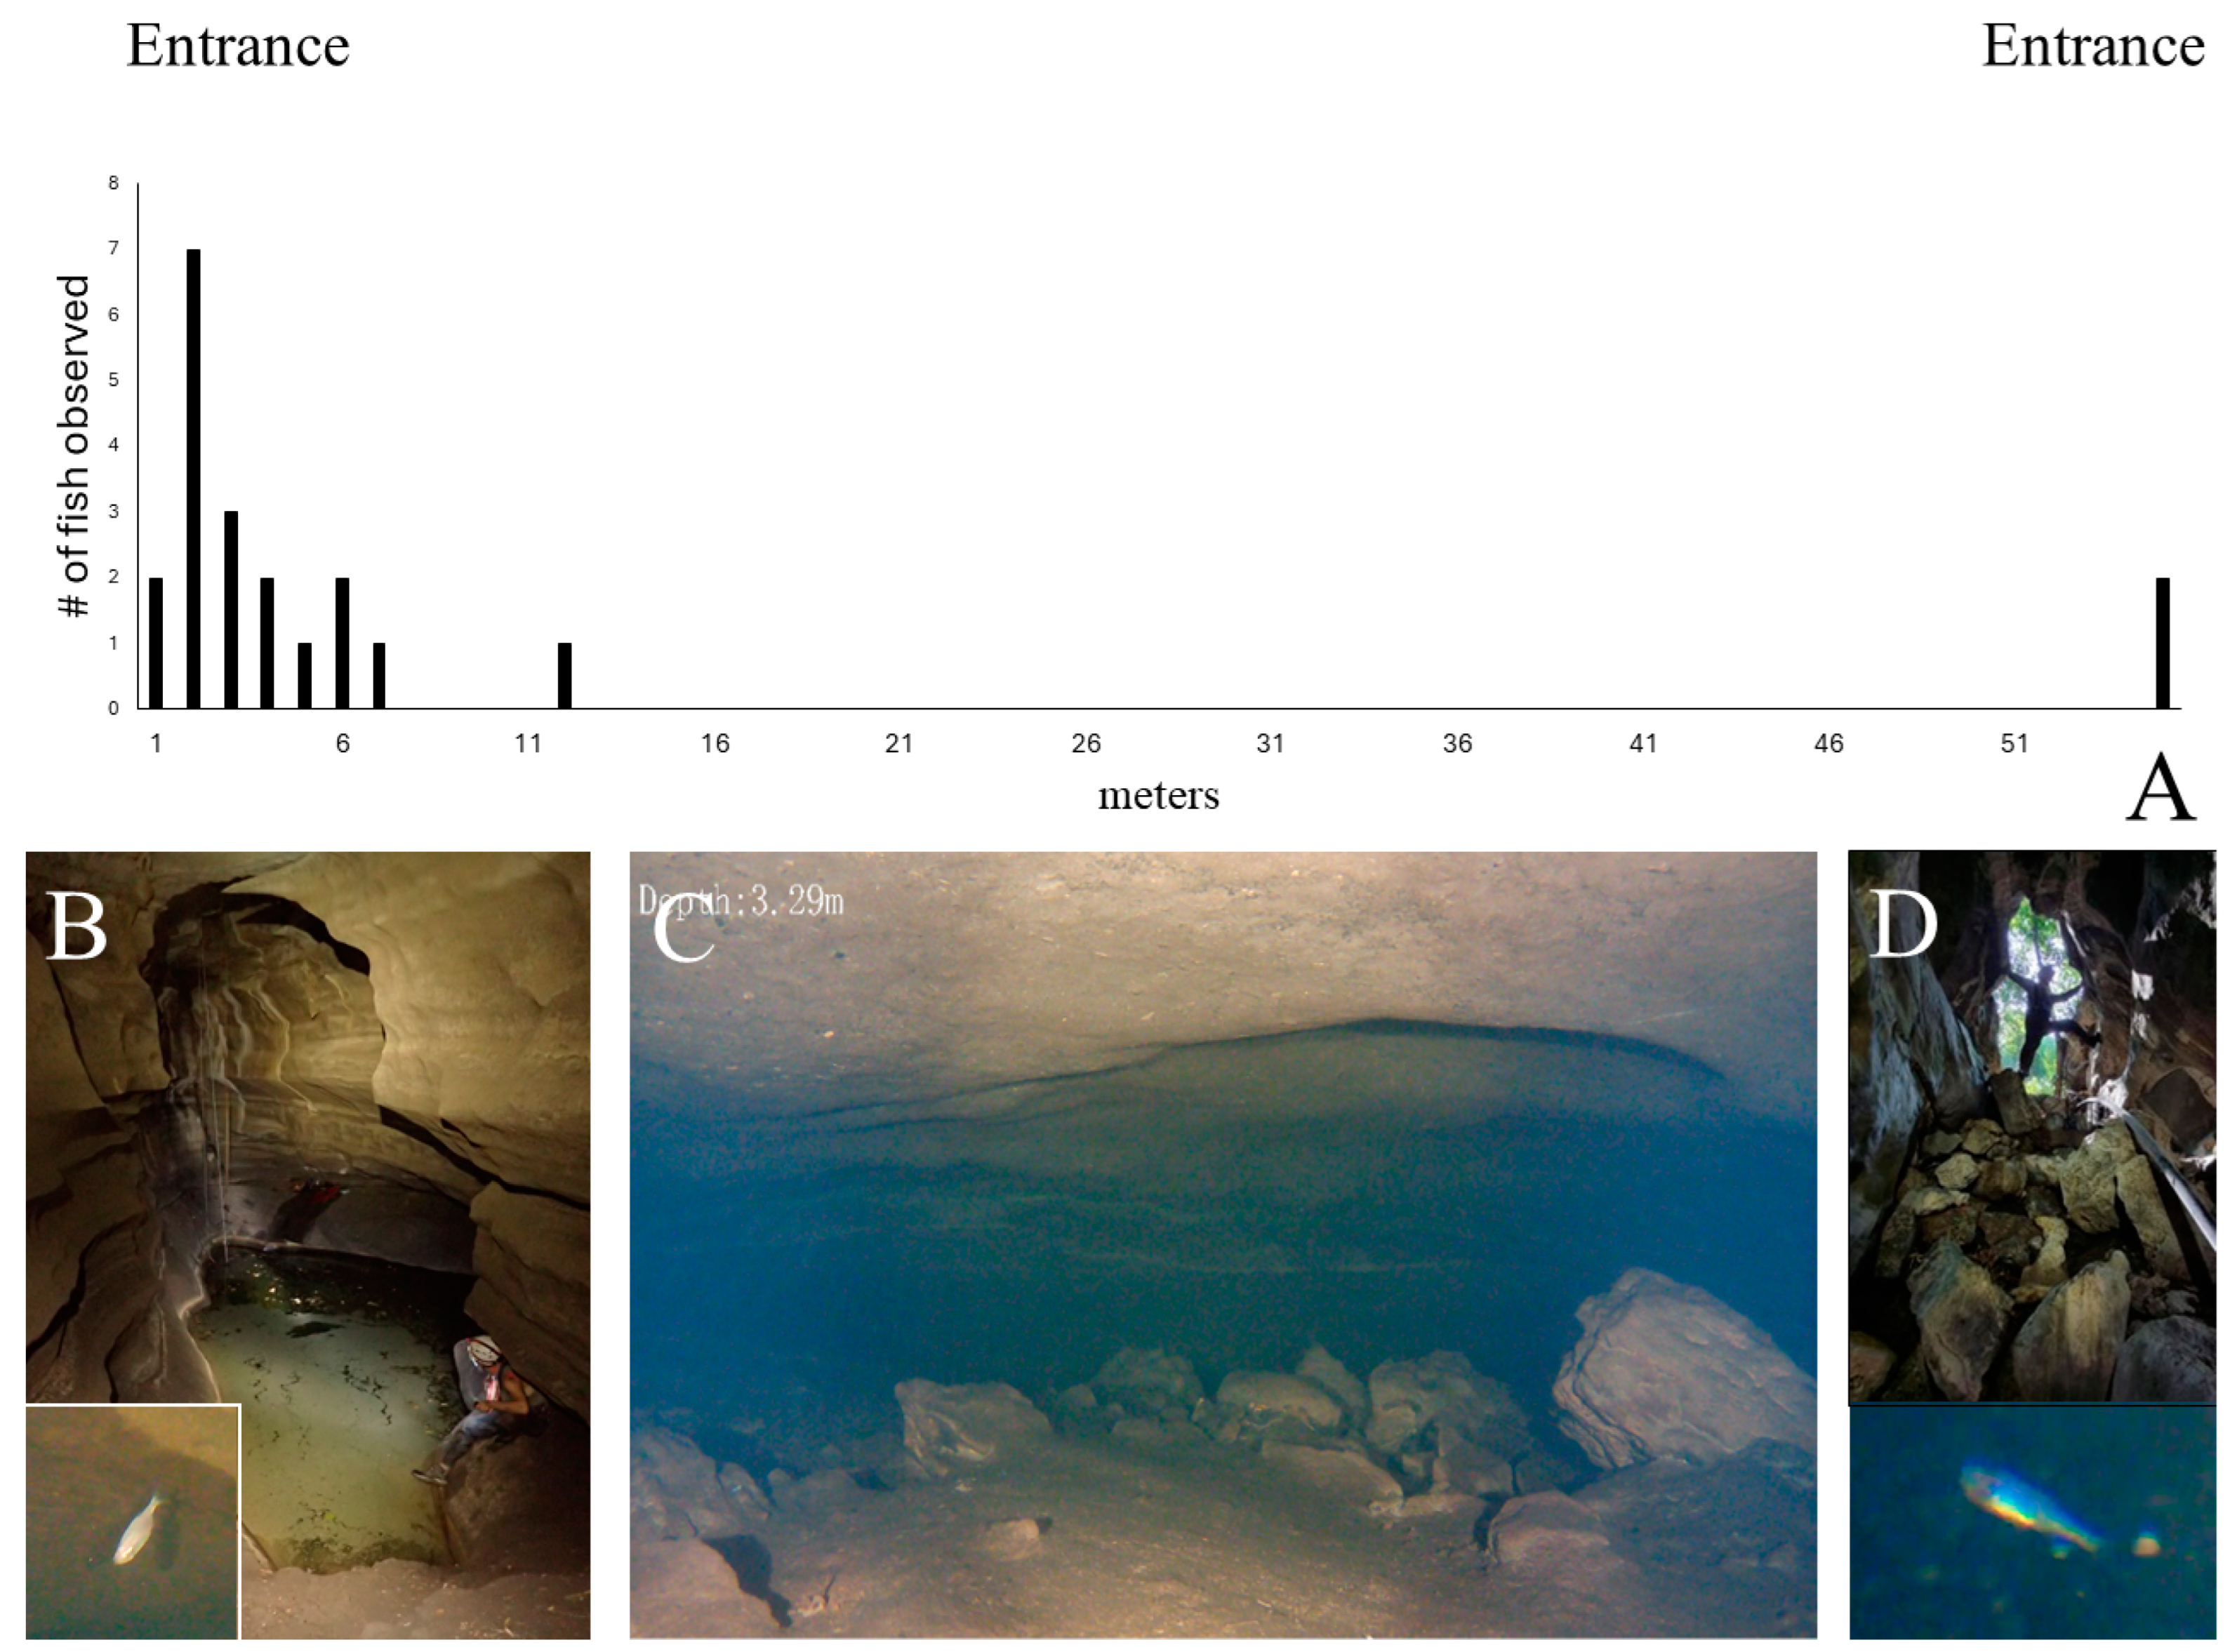
2) was multiplied by the proportion of the total habitat area that the transect area represented. Excluding the first 10 m of the gallery, where there is a clear density gradient centered under the bat colony, the areas with low densities did not show evident local gatherings. These sections had widths of about 5 m (
Figure 1) and were easily observed in their entirety while snorkeling, given the good visibility. Although not included in the transect, observers scanned the whole gallery to make sure there were not abnormal gatherings of fish and that the 1.5 m × 20 m transect represented a random density of that portion of the gallery.
There were several factors that enhanced the accuracy of the field estimates. Most relevant here are the excellent visibility in crystal-clear water illuminated with powerful scuba diving lights; fish behavior in which blind
Astyanax do not hide or become too startled by the swimming of the observer; and the type of habitat being surveyed (smooth, black floors), which did not conceal the highly contrasting white fish. Among the factors that could contribute to underestimating the number of fish counted, the main one would be fish size. While we estimate that we could confidently spot individuals over 2 cm long, smaller individuals may have gone uncounted. Fry of this size correspond to the post-larval stage of about 2.5 months old [
11,
12]. While high mortality of post-larval specimens reduces their long-term contribution to the population, and close and detailed observations at several parts of the gallery showed that post-larval individuals were infrequent at densities well below 1 m
2 on the date of the study, it is best to interpret our estimates of population size and densities as those of juveniles and adults whose caudal and anal fins had reached their definitive number of rays, which is approximately 20 rays [
11].
We selected the second site with the main goal of assessing the distribution of cavefish in underwater galleries beyond sumps. These underwater passages are inaccessible to bats or land animals, which are the main sources of nourishment for adult cavefish [
13,
14]. Two sumps of the Toro/Calera cave system [
15] were studied in November 2023; the 71 m long sump downstream of Sótano del Toro #2 connecting to Calera Cave and the 55 m long sump upstream of Sótano del Toro #2 leading to Sótano del Toro. The first sump is in the dark portion of the cave and has a small bat roost on the Calera side of the sump. The second sump starts directly under the entrance pit of Sótano del Toro #2, and a dome with air was reached near the entrance of Sótano del Toro. Thus, at both ends of the underwater galleries, there is input from falling surface debris.
For the underwater passages, remotely operated vehicles (ROV) were used to explore and capture videos. The underwater drone models used were the Fifish V6 and the Fifish V6s, from Qysea (Shenzhen, Guangdong, China) with the following characteristics: a camera sensor of 1/2.3” SONY CMOS; effective pixels: 12MP; ISO range: 100–6400 in auto/manual; lens field of view: 166°; aperture: f/2.5; and minimum focusing distance: 0.4 m. LED beams with a brightness of 4000 lumens were used. Drones had an attached tether marked every meter, allowing for the distance traversed to be measured. Galleries were explored in November 2023.
We did not attempt to collect data on population size or density in these sumps. Given the trying conditions of exploring virgin passages with drones, it was impossible to accurately follow the line transect method. The low ceilings and narrow passages required negotiating passageways in paths other than straight lines. Navigations of unexplored passages often reached dead ends, and the paths needed to be retraced. To complicate things, the propellers of the drone often created clouds of silt that minimized visibility. Due to these limitations, data gathering was restricted to counting the number of fish observed every meter of advancement in the gallery by the drone. The data were then graphed as the number of fish along the traversed distance. Sources of potential food, such as bat roosts, roots of trees, mysid shrimp, or access to the entrance’s falling debris, were noted. The data obtained with the drone should be considered only as a broad reflection of the abundance of fish in the different sections of the cave.
4. Discussion
The apparent reduction in the population at Pachón cave may have been caused by a multitude of factors, such as global climate change, water being pumped out of the cave, and over-collecting by scientists and non-scientists, to name a few. Independently of the reasons, a collapse in a cave population is concerning and may trigger conservation efforts. Proper estimates of population size and distribution are essential. For this study, we tested a non-invasive method of estimating Astyanax population size in two caves other than Pachón: the transect sampling method.
We estimated a population size for pool #1 at Sabinos of about 1142 individuals. This pool has a length of 310 m. Our estimate of a density of 10.0 fish/m
2 at Sabinos when directly under a bat roost was consistent with the density calculated by [
9] under this same bat roost (8.0 fish/m
2). These authors estimated the density of fish using a different technique (counting the number of fish inside a 6.25 cm radius circle according to videos). The results support that the techniques used for this study were accurate.
In ecology, the spatial distribution of organisms within a population can be categorized into three main patterns [
16]: uniform, random, and clumped distributions. Our results from the Sabinos and Toro/Calera cave systems strongly support that
Astyanax cavefish exhibit a clumped distribution when not constrained within a perched pool formed during the dry season, when the water recedes and aquatic organisms are concentrated within the confines of a small area. A clumped distribution is characterized by individuals occurring in patches or clusters within an environment. This pattern is often driven by localized availability of resources, such as food, shelter, or favorable environmental conditions. Many animals, like lions (
Panthera leo), exhibit clumped distribution due to the formation of prides centered around water sources and prey availability [
17]. Likewise, food availability and quality have been identified as key determinants of herbivore hotspots in savannas [
18]. Similar patterns have also been found in fish [
19]. Our results show that
Astyanax is found to cluster in areas with higher availability of food resources, such as bat guano droppings and concentrations of organic matter in the form of surface-brought debris or tree roots.
Cave ecosystems lack light for photosynthesis and thus tend to be nutrient-limited. Given that biomass and the production of macrotroglobites are positively correlated with detritus and prey biomass [
20], and that these nutrient sources are heterogeneously distributed within the
Astyanax caves’ aquatic environments [
9], our finding that
Astyanax populations have a clumped distribution around sources of food was predictable.
Astyanax cavefish have also evolved an enhanced olfactory sensitivity that allows them to detect even 10
−9 M alanine amino-acid odors [
21,
22,
23]. It is thus not surprising that, in long underwater galleries where there are no obstacles to fish movement,
Astyanax could potentially locate, swim towards, and gather around the scarce and heterogeneously distributed sources of nutrients. Future studies may focus on the ecological significance of El abra caves being a non-homogenous environment, where one of the top species in the food web has a non-uniform or random distribution.
It is the authors’ opinion that the main significance of our results is for conservation. The five main pools from which researchers collect and study
Astyanax in the field are Pachón’s main and lateral pool, Sabinos Pool #1, Tinaja Pool #2, and Chica Pool #2. These five pools happen to be located under bat roosts. Some are also perched pools formed during the dry season, which, when the water recedes, contain concentrations of
Astyanax fish. Both conditions may generate clustered aggregations of fish at a density several orders of magnitude higher than those at other portions of the hydric system. All pools routinely visited by researchers have concentrations of fish around 10 individuals/m
2 [
9]. When researchers visit these sites, they typically witness large gatherings of fish that may exceed a hundred individuals. This may give a false impression that the underground system has a higher abundance of fish than it truly has. Thus, it creates a misplaced sense of security when collecting. As our results show, assuming that, beyond the sump, there is a vast quantity of fish to replace those collected seems inaccurate. As was seen at Sabinos Pool #1, researchers collect fish from a site where about two-thirds (68%) of the population is concentrated, despite the hundreds of meters of water passages available beyond the low ceiling.
5. Conclusions
The line transect sampling method was used as a non-invasive alternative to the capture–mark–recapture method for estimating population size.
The population size at Sabinos Pool #1 was estimated to be close to one thousand individuals.
Populations of Astyanax in large aquatic galleries do not appear to have uniform or random distributions. Instead, they appear to have clumped distributions concentrated around nutrient sources such as bat colonies or detritus sources.
When considering the cave system as a whole, most of the submerged galleries are beyond sumps and thus inaccessible to bats, deep into the karst system far away from debris sources. Thus, future studies should consider that the apparent high density at visited sites (Pachón, Sabinos, Tinaja, and Chica caves) overrepresents the total population size when calculating the number of fish specimens to be captured.


 ,
, 