Article

Spatiotemporal Variations in Trophic Diversity of Fish Communities in a Marine Bay Ecosystem Based on Stable Isotope Analysis

by
Pengcheng Li
1,2,
Wan Chen
3,
Kun Wang
1,
Binduo Xu
1,2,
Chongliang Zhang
1,2,
Yupeng Ji
1,2,
Yiping Ren
1,2,4 and
Ying Xue
1,2,*
1
College of Fisheries, Ocean University of China, Qingdao 266003, China
2
Laboratory for Marine Fisheries Science and Food Production Processes, Qingdao Marine Science and Technology Center, Qingdao 266237, China
3
Donghai Laboratory, Zhoushan 316021, China
4
Field Observation and Research Station of Haizhou Bay Fishery Ecosystem, Ministry of Education, Qingdao 266003, China
*
Author to whom correspondence should be addressed.
Fishes 2024, 9(7), 262; https://doi.org/10.3390/fishes9070262
Submission received: 18 May 2024 / Revised: 1 July 2024 / Accepted: 1 July 2024 / Published: 4 July 2024
(This article belongs to the Section Biology and Ecology)

Abstract

:
Climate change has led to significant fluctuations in marine ecosystems. As a component of the food web, the trophic diversity and spatiotemporal changes of fish communities are crucial for understanding ecosystems. In recent years, stable isotope analysis has been increasingly used as a comprehensive tool for quantitative assessment of trophic diversity to explore spatiotemporal variations in fish community diversity. This study is based on carbon ( δ 13C) and nitrogen ( δ 15N) stable isotope analysis using different biomass-weighted isotope diversity indices, including isotopic divergence index (IDiv), isotopic dispersion index (IDis), isotopic evenness index (IEve), and isotopic uniqueness index (IUni). The overall results indicate that IDis, IEve, and IUni values of fish communities were relatively low, while IDiv was relatively high in the Haizhou Bay ecosystem. IDiv, IDis, IEve, and IUni were lower in autumn than in spring; IDiv and IDis were relatively higher in offshore waters, while IEve and IUni were relatively higher in inshore waters. The changes in species composition and intensive pelagic–benthic coupling in Haizhou Bay may lead to significant spatiotemporal variations in the trophic diversity of fish communities in the area. These findings highlight the importance of incorporating trophic relationships into ecosystem models, which will help to enhance our understanding of the complexity of the trophic structure of fish communities.
Key Contribution: The changes in species composition and intensive pelagic–benthic coupling in Haizhou Bay lead to significant spatiotemporal variations in the trophic diversity of fish communities in the area.

1. Introduction

Trophic interactions between species in the food web reveal energy flow and matter conversion in ecosystems [1], which play a crucial role in maintaining the trophic structure and function of marine ecosystems [2]. As an important part of marine ecosystems, fish communities have attracted much attention through trophic cascades in the energy flow and material circulation of food webs [3,4,5]. However, factors such as human activities, climate change and environmental pollution have significant impacts on ecosystem processes, community structure and stability [1,6,7]. Analysis of the trophic diversity of fish communities can not only provide important information for management and protection of marine fishery resources [8], but also help to mitigate the adverse effects of environmental degradation and human activities on marine ecosystems and improve the resilience and stability of ecosystems [9,10,11].
Trophic diversity has been used to reflect the differences and diversity of trophic sources and trophic niches of species within a community [12]. The application of trophic diversity can be realized through the use of diversity indices, which can provide important information for monitoring the impact of human disturbance, environmental change or trophic downgrading on fishery resources [13,14]. Although methods developed by functional ecologists to quantify functional diversity could be adapted for stable isotope ecology, assessment of multiple aspects of trophic diversity is lacking [8,15]. Therefore, the proposal of a complementary set of diversity indicators, taking into account different aspects of isotopic diversity, is widely accepted [8,12,16,17,18].
Stable isotope analysis is powerful for quantifying the interactions between organisms and the fluxes of energy in marine ecosystems [19]. It can reflect the ecological information of organisms’ feeding over a relatively long period of time [20], which effectively makes up for the shortcomings of traditional stomach content analysis [21,22]. The similarity of the carbon stable isotope ratio ( δ  13C) in the consumer’s body to that of the food organism can provide long-term feeding information and is often used to study the feeding ecology of fish [23]. The nitrogen stable isotope ratio ( δ  15N) has a 3.00–4.00‰ enrichment effect between consumers and food organisms, which can be used to estimate the trophic position of consumers [24]. In this process, the selection of appropriate baseline organisms is crucial [25]. Post [26] suggested that primary consumers with stable diets should be selected as baseline organisms. Long-lived stationary consumers integrate spatial and temporal variation in stable isotope ratios to reflect a time-averaged isotopic signal, which can provide a good isotopic baseline for estimating the trophic position of higher trophic level consumers in aquatic ecosystems [26]. Filter-feeders, as sedentary consumers, are generally used to track stable isotope baseline variations. This method has been widely used by ecologists as an integrative tool in food web ecology [27,28] to quantify the trophic implications of ecological processes [19,29]. In recent years, it has been used in the analysis of trophic diversity of fish communities [30,31].
Haizhou Bay is an open bay ecosystem in the southern Yellow Sea, which is one of the important fishing grounds and spawning habitats in China Seas [32]. Since the 1980s, the ecological environment of Haizhou Bay has undergone large changes due to the impacts of fishing pressure, habitat degradation, and climate change [33], with fish diversity and fishery resources declining precipitously in this ecosystem [34,35]. In order to quantify the trophic relationships among species, the isotopic diversity of fish communities in Haizhou Bay was evaluated through the analysis of carbon and nitrogen stable isotopes. Four biomass-weighted isotope diversity indices were used to quantify different aspects of isotopic diversity in fish communities, including isotopic divergence index (IDiv), isotopic dispersion index (IDis), isotopic evenness index (IEve), and isotopic uniqueness index (IUni). Based on this, the spatiotemporal variations of trophic structure and trophic diversity of fish communities in Haizhou Bay were analyzed. This study will help to enhance the understanding of the spatiotemporal variations in the trophic diversity of fish communities and advance the understanding of the complexity of the trophic structure of this sea area, which will provide essential information for Ecosystem-based Fisheries Management (EBFM).

2. Materials and Methods

2.1. Study Area

The survey area was in Haizhou Bay in China, which ranges from 34.4° to 35.6° N and 119.4° to 121.1° E (Figure 1). The bottom trawl surveys were conducted in 2018, with stratified random sampling surveying of 18 stations in spring (April) and autumn (September). A 220 kW otter trawler, with a sampling net of 12 m open width and mesh size of the codend at 17 mm, was used in bottom trawl surveys, which towed for about 1 h at a speed of 2–3 knots at each station. The surveys were only conducted diurnally. Catch data were standardized at a tow speed of 2 knots and trawl of 1 h. A detailed description of the survey design is available in Xu et al. [36]. In addition, according to the K-means clustering analysis results of Li et al. [35] on the fishery communities in this area, the stations were roughly divided into inshore (<20 m) and offshore (>20 m) areas according to the 20 m isobath.

2.2. Sample Treatment

The biomass of fish species analyzed in this study accounts for more than 90% of the estimated total biomass of the fish community, providing a representative sample of their trophic diversity in Haizhou Bay. The white muscle near the first dorsal fin of fish samples was used for stable isotope analysis [37,38]. Tissue samples were rinsed with distilled water to remove exogenous materials (e.g., remaining scales or bones), and dried in an oven at 60 °C for 48 h. The tissue sample was ground into a fine powder (with an agate mortar and pestle) and packed into a clean glass scintillation vial. The lipids and inorganic carbon in the sample were extracted by methanol–chloroform–water (volume ratio 10:5:4) and hydrochloride (1 mol L−1), respectively [39,40,41]. Eventually, the samples were frozen and stored in glass vials for further processing. Samples were sent to the Institute of Hydrobiology of the Chinese Academy of Sciences for stable isotope analysis. The ratio of stable isotopes of carbon and nitrogen of species were analyzed by isotope ratio mass spectrometers (Isoprime100 IRMS).

2.3. Stable Isotope Analysis

Stable isotopic values were reported in international standard δ notation using the following equations:
δ     13 C   or   δ     15 N = 1000 ( R sample     R standard ) / R standard
Results for carbon and nitrogen are reported as δ 13C and δ  15N values, respectively, and are derived from the relation between the isotopic value for the sample and a known standard of δ  13C or δ  15N, where R corresponds to ratio 13 C 12 C or ratio 15 N 14 N . Standards used for δ  13C and δ  15N included Vienna Pee Dee Belemnite (VPDB) and atmospheric nitrogen with international standard R values of 11.24‰ and 3.68‰, respectively. In the process of analysis, one working standard is added after five samples to ensure the stability of the instrument and accuracy of the results. The accuracy of δ  13C and δ  15N is the ±0.15 and ±0.18, respectively.
In this study, scallops (Azumapecten farreri) collected in Haizhou Bay during the same period were chosen as a realistic trophic baseline in this study, which is widely distributed in the sea area and effectively reflects the stable isotope characteristics of primary producers [42,43]. Based on the baseline organism, the formula for calculating the trophic level using stable isotope data is as follows [44]:
T L c o n s u m e r s = ( δ     15 N c o n s u m e r s δ     15 N b a s e l i n e ) T E F + 2
where T L c o n s u m e r s and δ     15 N c o n s u m e r s represent the trophic level and stable nitrogen isotope ratios of fish, respectively. δ     15 N b a s e l i n e represents the stable nitrogen isotope ratio of the baseline organisms. In this study, scallop (A. farreri) was selected as the baseline organism, with a mean δ  15N of 4.50‰ [45]. This study used a trophic enrichment factor ( T E F ) of 3.40‰ [45,46,47]. The trophic level of the baseline organism is 2.

2.4. Trophic Diversity Indices

Ecologists have developed metrics to quantify the multiple aspects of functional diversity in an n-dimensional space based on functional traits [12]. Methods developed to quantify functional diversity could be adapted for stable isotope ecology [8,15]. In this study, we repurposed some functional diversity metrics based on functional traits into a set of isotopic diversity metrics based on stable isotope values [12]. Four trophic diversity indices were selected to quantify different aspects of isotope diversity in the fish community of Haizhou Bay [8,17,18], including isotopic divergence (IDiv), isotopic dispersion (IDis), isotopic evenness (IEve), and isotopic uniqueness (IUni). These indices are mathematically independent of the number of organisms. In this study, four trophic diversity indices were used to describe the trophic diversity of fish communities in Haizhou Bay by constructing the weights of coordinate points relative to biomass assigned by two-dimensional isotope space [12]. The four trophic diversity indices analyzed in this study include:
(1) Isotopic divergence (IDiv) is derived from the functional divergence index indicating the degree to which a species’ distribution in isotopic space maximizes trophic divergence within the food web [8]. The formula for IDiv index is as follows:
I D i v = Δ d + d G ¯ Δ d + d G ¯
where Δ d is the dispersion weighted by species richness. d G ¯ is the average distance between species and the center of gravity. IDiv is maximal (i.e., tends to 1) if all the species (or most of their weight) are located on the edges of the convex hull.
(2) Isotopic dispersion (IDis) is calculated by dividing the weighted deviation to the average position of points in the stable isotope space by the maximal distance to the center of gravity [17]. The formula for IDis index is as follows:
d O i = k = 1 S I ( δ k i 1 N i = 1 N δ k i ) 2
I D i s = i = 1 N w i × d O i / max ( d O 1 , , d O i , , d O N )
where δ k i is the value for stable isotope k [1, SI] of each species i [1, N] and w i is the weight of each species i [1, N]. IDis is maximal when most of the points (or their weight) are far from the center of gravity of the group of points.
(3) Isotopic evenness (IEve) is derived from FEve, indicating the evenness of abundance distribution in a multi-dimensional stable isotope space [8]. The formula for IEve index is as follows:
I E v e = l = 1 N 1 min ( E W l l = 1 S 1 E W l , 1 N 1 ) 1 N 1 1 1 N 1
where EW is weighted evenness, l is a branch of the minimum spanning tree linking species in the stable isotopic space. IEve increases when abundance is more evenly distributed among species or species are evenly distributed in the stable isotope space.
(4) Isotopic uniqueness (IUni) is defined as the inverse of the average isotopic redundancy which appears in the average closeness of species in the stable isotope space. The formula for IUni index is as follows:
N N D i = min i j ( k = 1 S I ( δ k i δ k j ) 2 )
I U n i = i = 1 N w i × N N D i / max ( N N D 1 , , N N D i , , N N D N )
where N N D i is the minimal distance of a species to its nearest neighbors. IUni tends to 1 when most of the species (or species with the highest abundance) are isolated in the stable isotope space.
These trophic diversity indices were calculated using the R package’s geometry version 0.4.5 [48], rcdd version 1.5 [49] and ape version 5.6 [50]. In addition, the relative biomass was assigned to a coordinate point by constructing the isotope space, and the structure and trophic diversity of fish communities in Haizhou Bay were analyzed by combining four trophic diversity indices (IDiv, IDis, IEve, and IUni). The t-test was used to determine whether there was significant difference in trophic diversity of the community in different seasons and areas.

3. Results

3.1. Temporal Variation in Trophic Diversity of Fish Communities

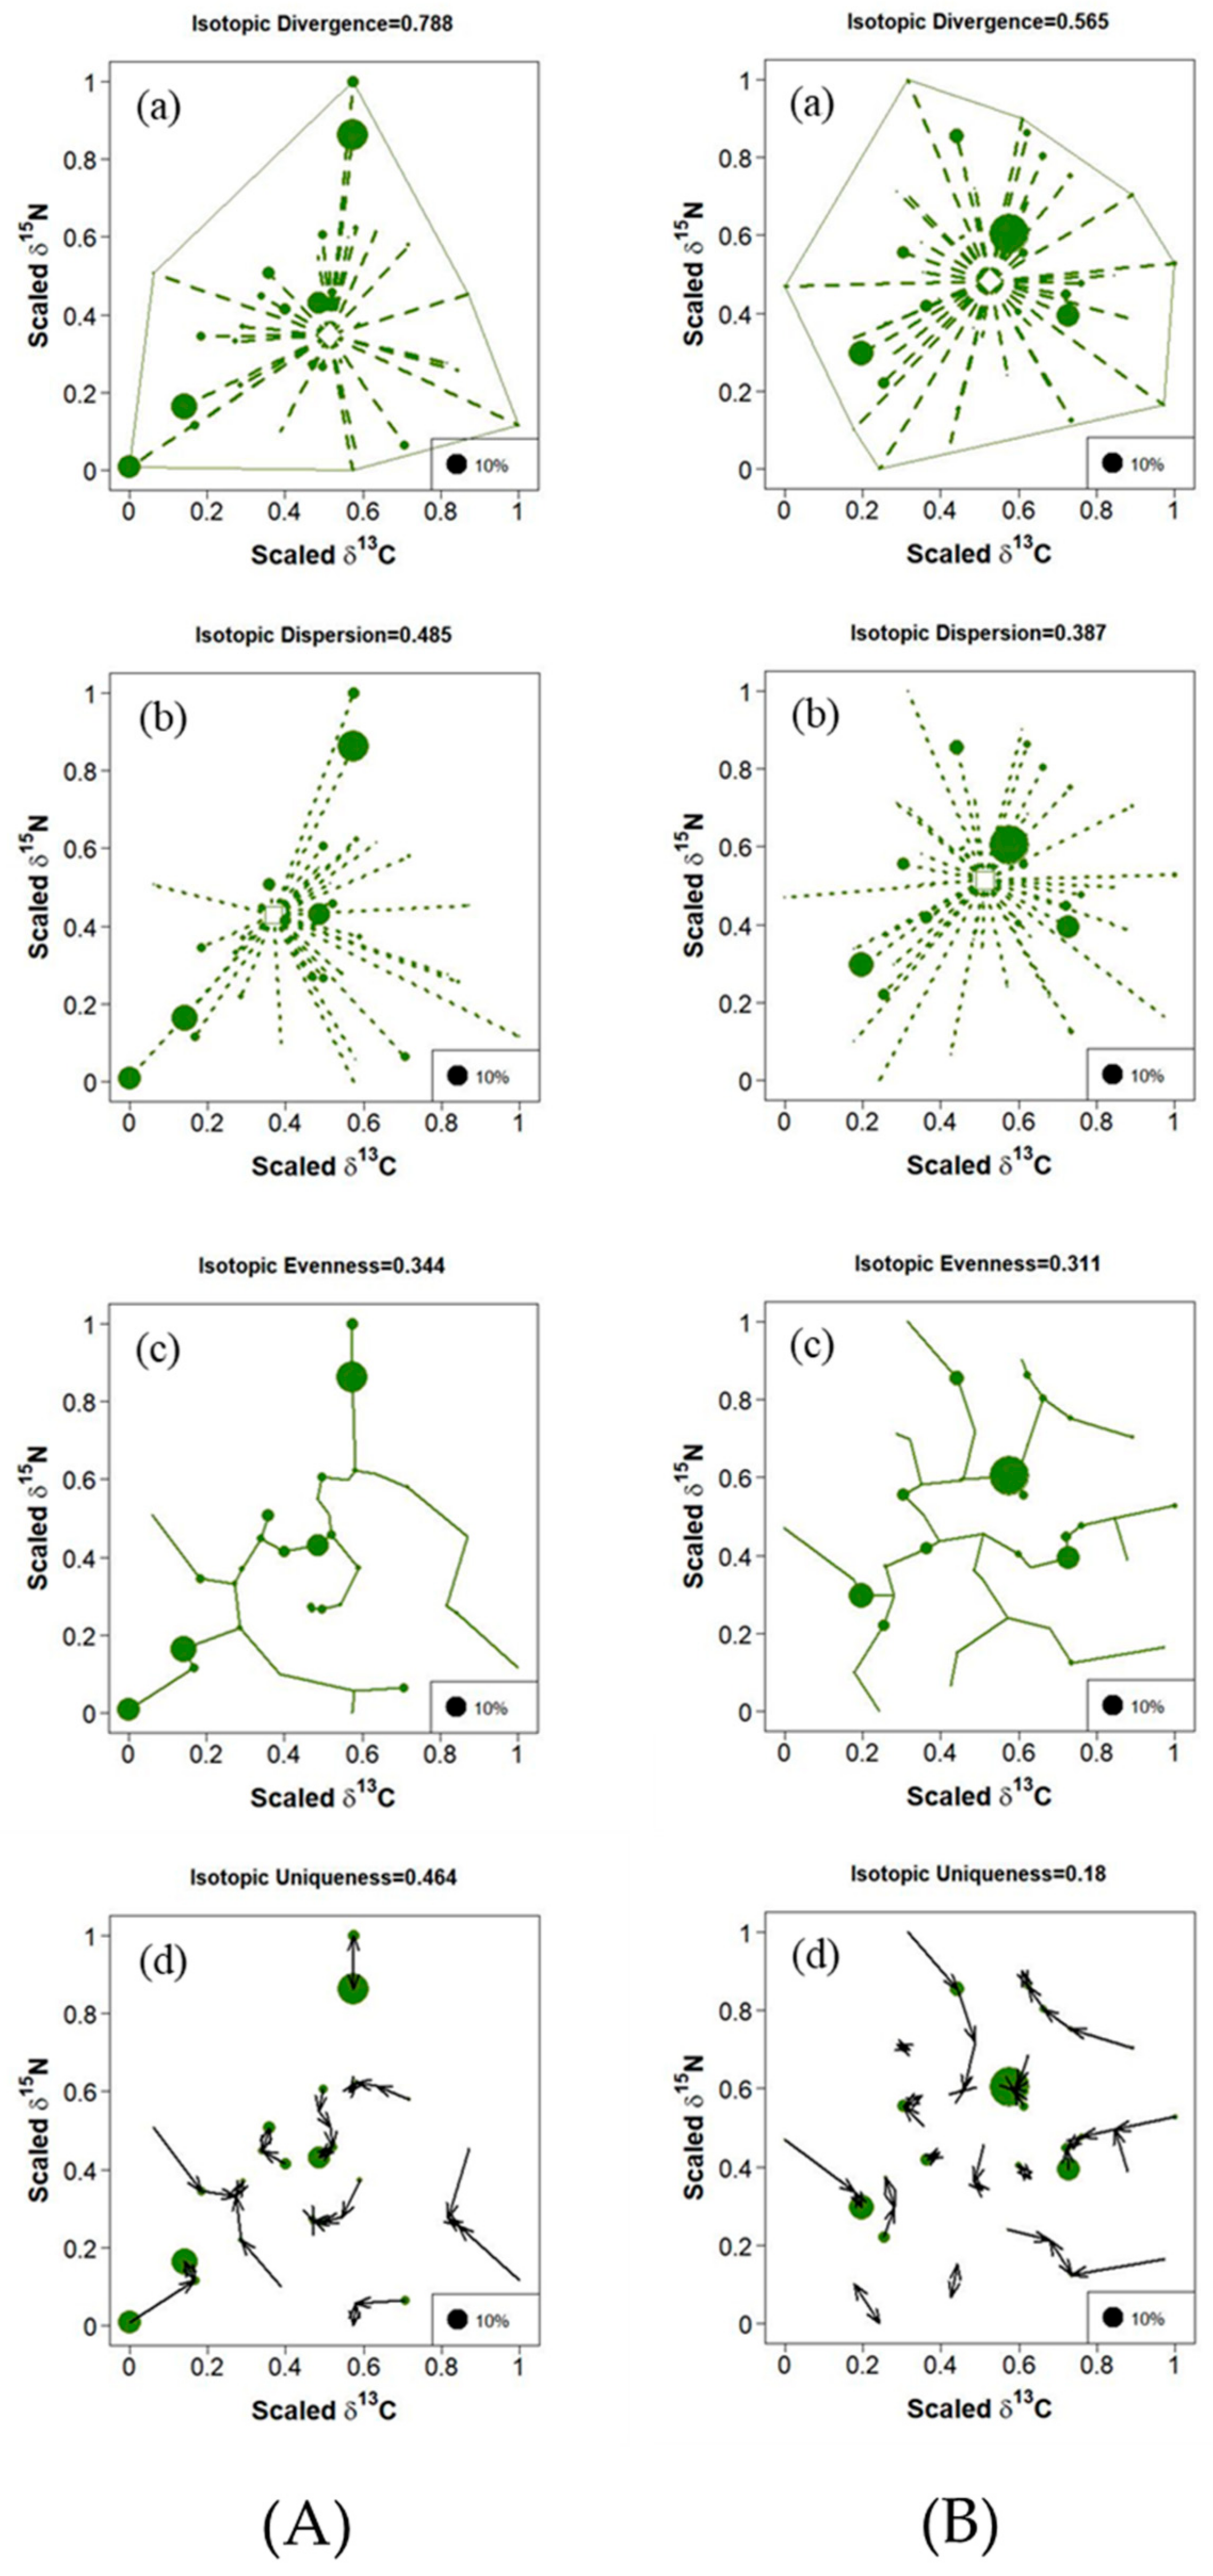
The trophic diversity of fish communities in Haizhou Bay was significantly different between seasons (p < 0.05), with the four isotopic diversity indices being higher in spring than those in autumn (Figure 2). In spring, the fish with large biomass mostly concentrated at points near the boundary of the convex hull (irregular polygon), while in autumn they were close to the center of gravity of the convex hull. In addition, the mean range of δ  13C and δ  15N values in spring was (−21.4‰, −16.8‰) and (8.5‰, 13.8‰), respectively, while the mean range of δ  13C and δ  15N values in autumn was (−21.7‰, −15.6‰) and (8.9‰, 12.3‰), respectively (Table S1). Notably, the fish with the maximum and minimum mean δ 15N values were Gadus macrocephalus and Coilia mystus in spring, and Thryssa kammalensis and Syngnathus acus in autumn. The fish with the maximum and minimum mean δ 13C values were Hippocampus trimaculatus and Ammodytes personatus in spring, and M. cinereus and Enedrias nebulosus in autumn.

3.2. Spatial Variation in Trophic Diversity of Fish Communities

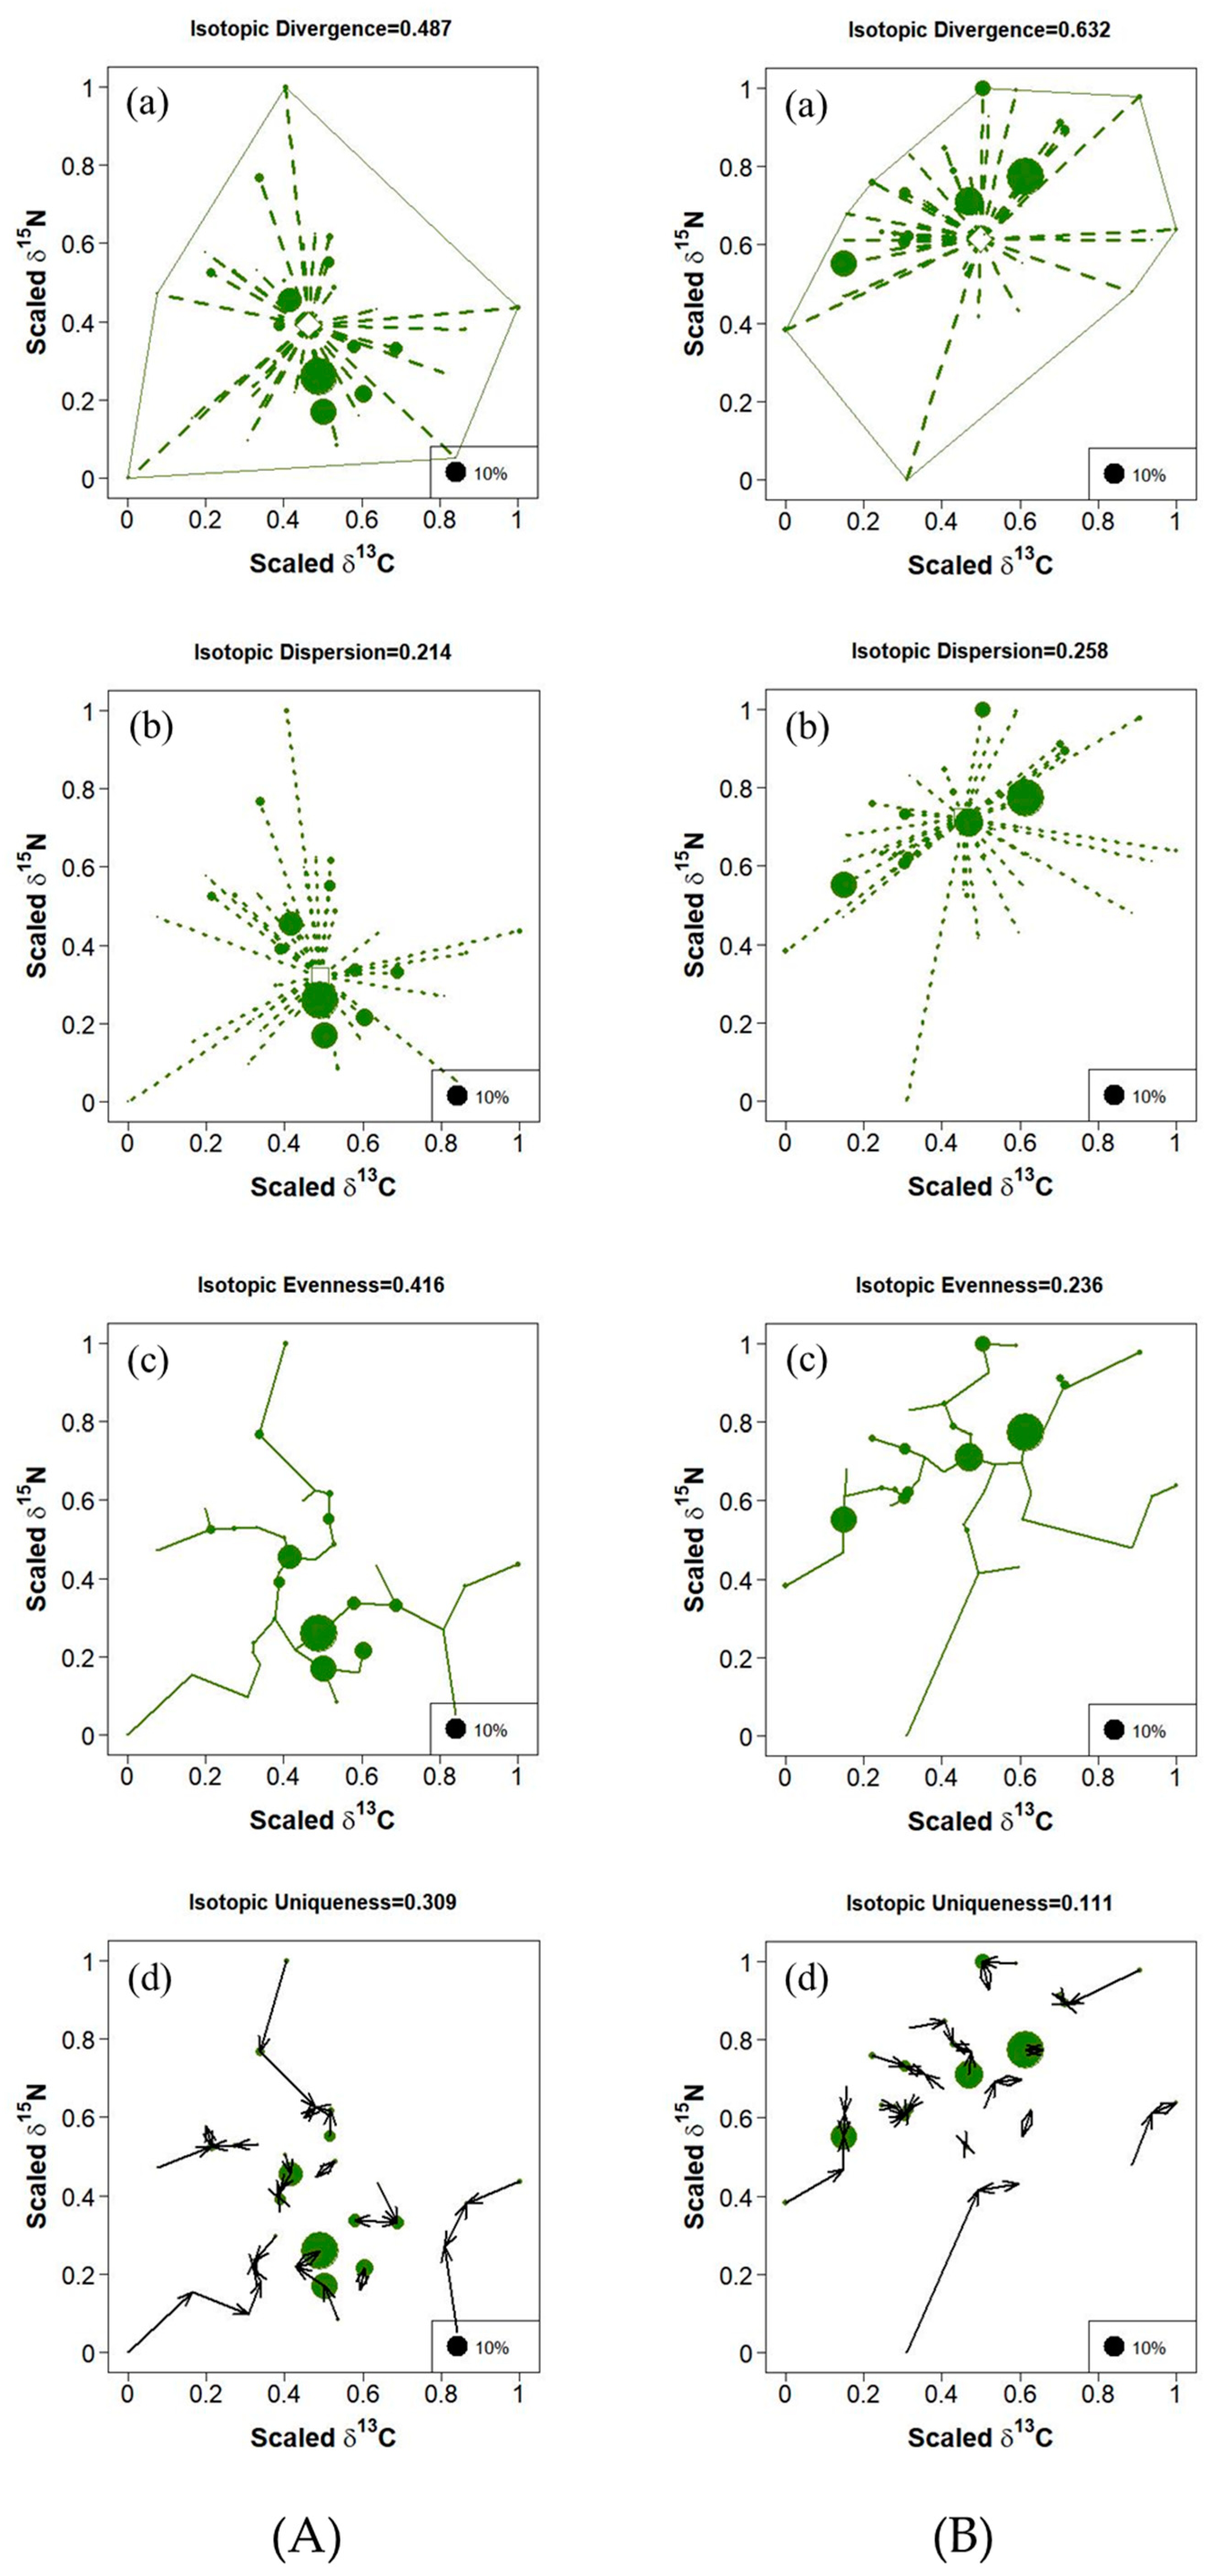
The trophic diversity of fish communities in Haizhou Bay was different between inshore and offshore waters (p < 0.05). The results of the four isotope diversity indices showed that IDiv and IDis were higher in offshore waters (>20 m), while IEve and IUni were higher in inshore waters (<20 m). Meanwhile, the four isotope diversity indices showed that inshore waters’ (<20 m) fish communities had higher δ  13C, while offshore waters’ (>20 m) fish communities had higher δ  15N (Figure 3).

3.3. Composition and Trophic Diversity of Fish Communities

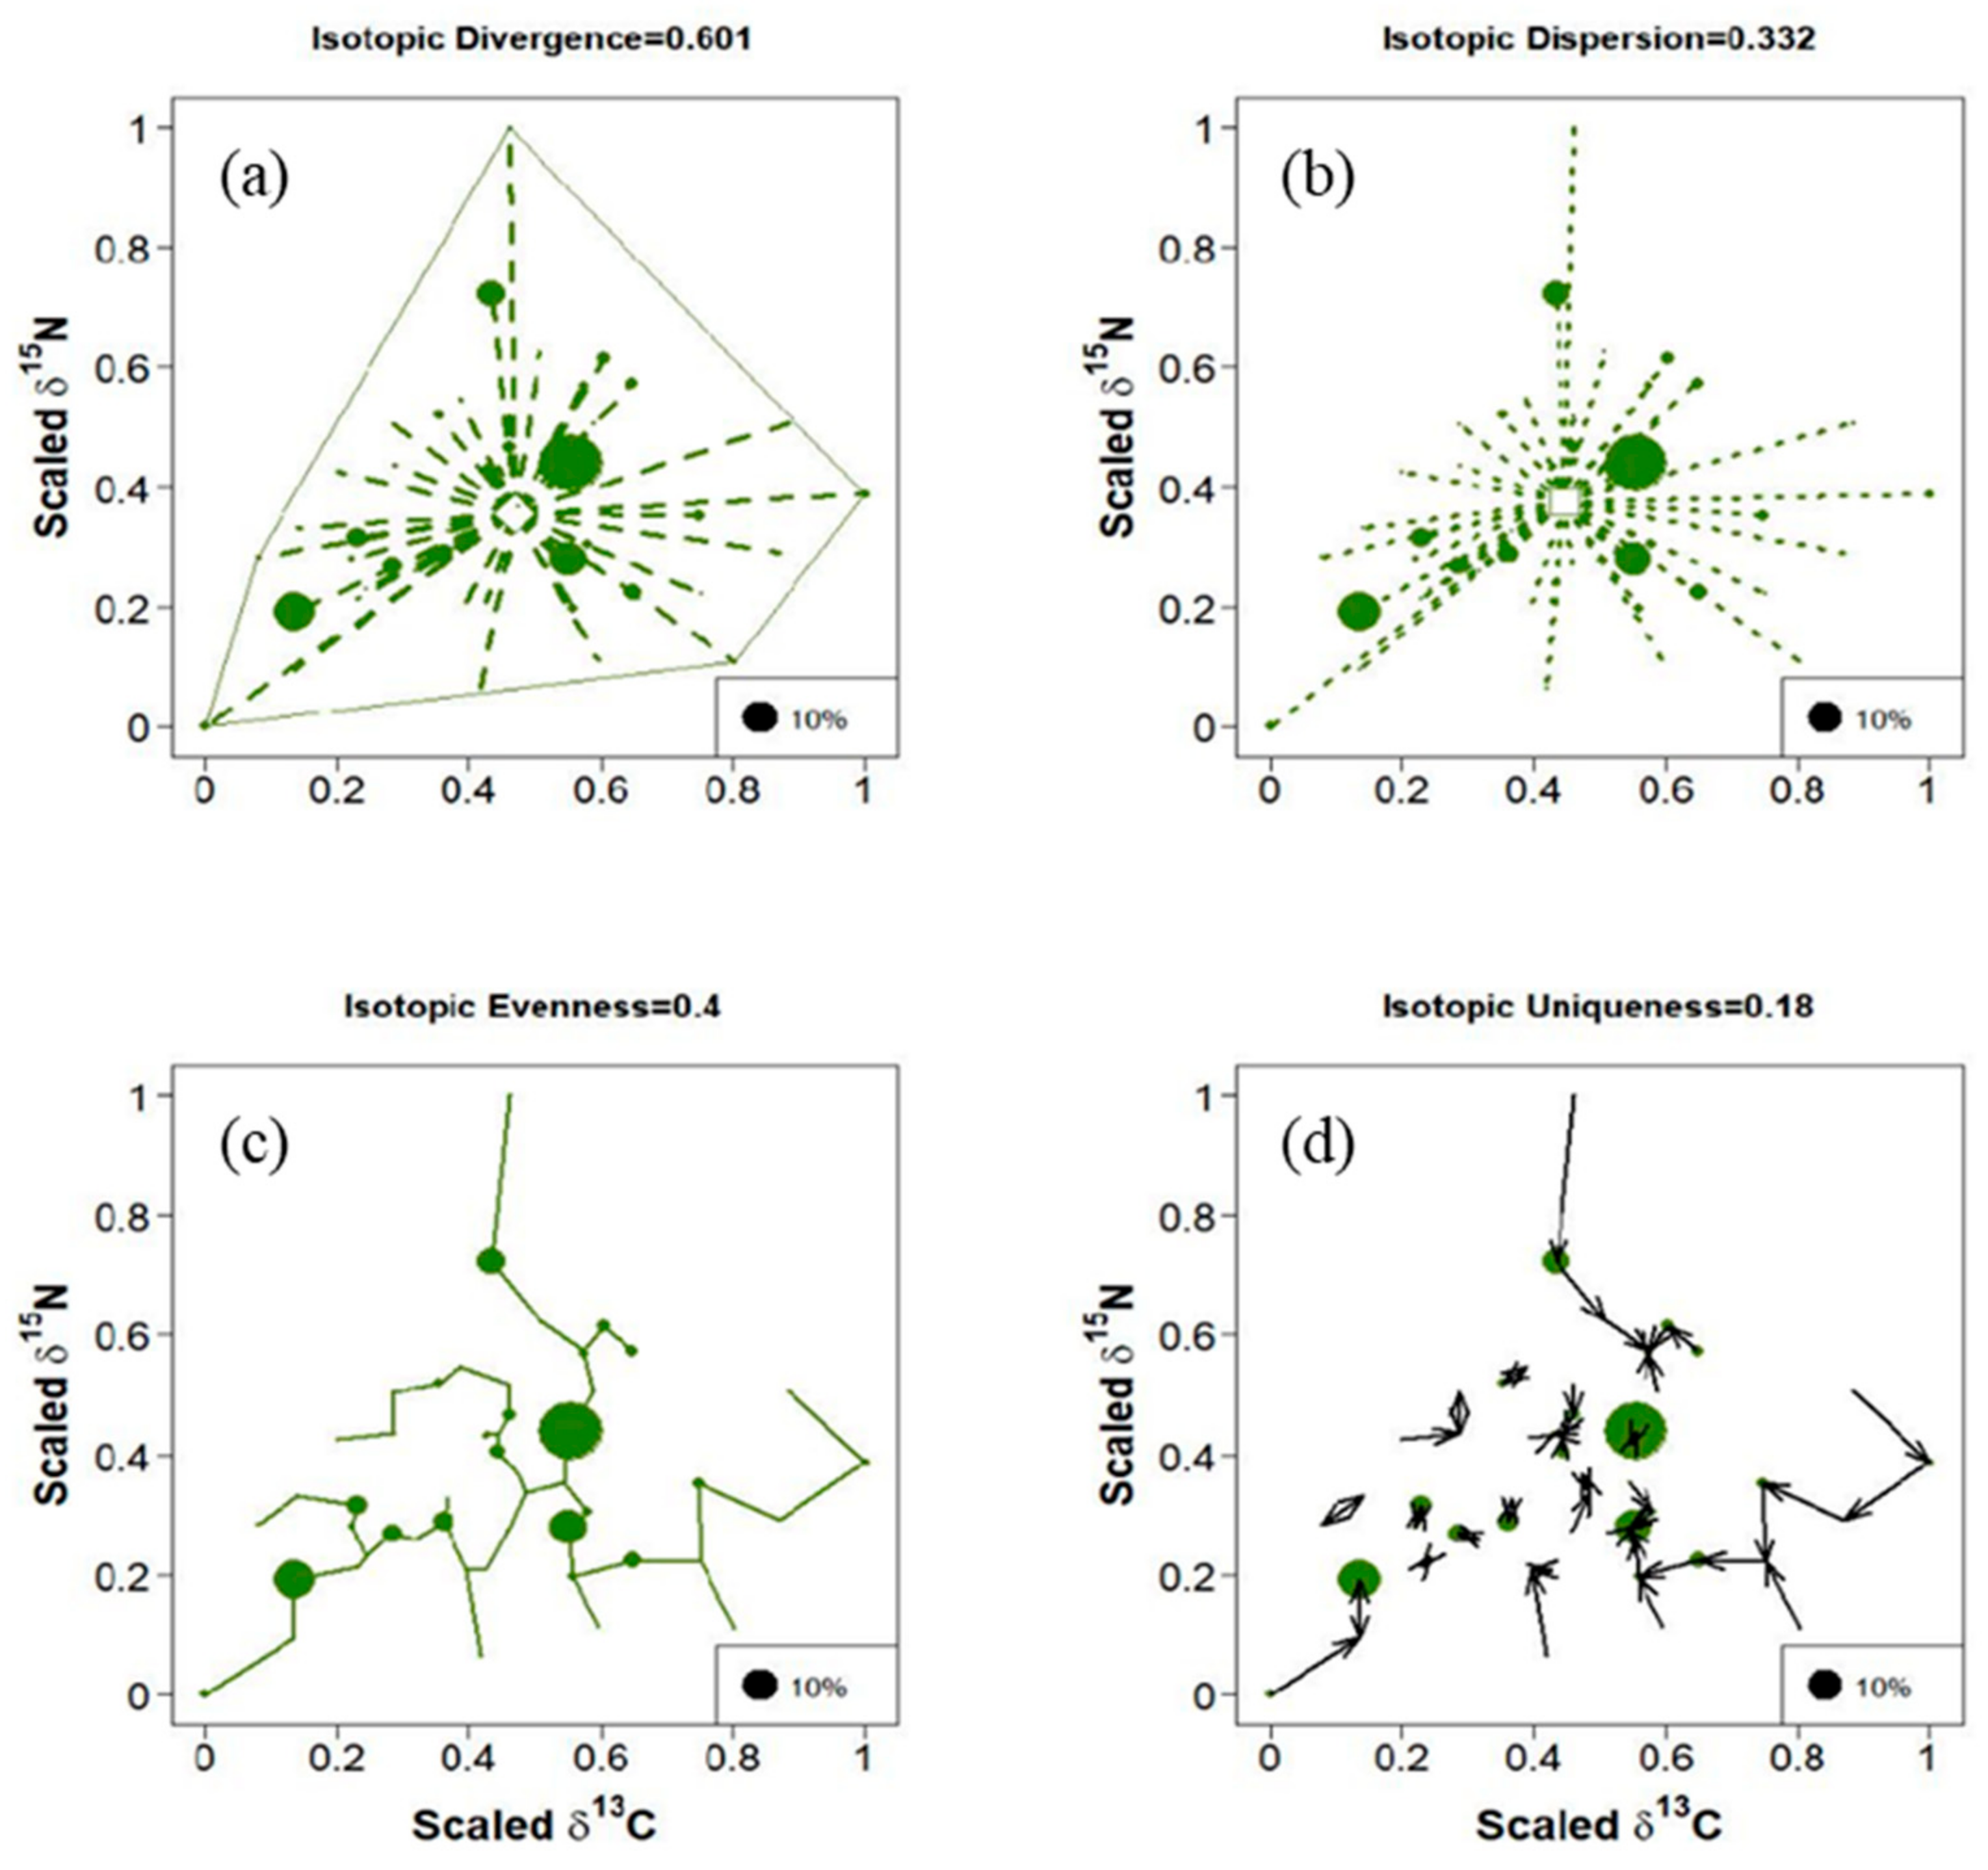
A total of 54 fish species in Haizhou Bay were captured in 2018 and analyzed for their stable isotope values. The δ  13C values vary more widely than the δ  15N values, with the mean δ  13C value range being (−21.7‰, −15.6‰) and the mean δ  15N value range being (8.5‰, 13.8‰) (Table S2). The maximum and minimum δ  13C vales were found in Enedrias nebulosus and Muraenesox cinereus, respectively. The maximum and minimum δ  15N values were found in Gadus macrocephalus and Coilia mystus, respectively. Detailed δ  13C and δ  15N values for other fish species are shown in Table S2. Trophic levels of these fish ranged from 3.19 to 4.73 (Table S2). In addition, the values of four trophic diversity indices of fish communities in Haizhou Bay were IDiv 0.60, IDis 0.33, IEve 0.40, and IUni 0.18, respectively (Figure 4).

4. Discussion

Trophic diversity and trophic redundancy are often linked to stability and resilience to perturbations, because of their roles in promoting the retention of functional roles in ecosystems [51,52]. The trophic structure of fish communities in Haizhou Bay has multiple trophic levels, with trophic positions ranging from 3.19 to 4.73. Both IEve and IUni of fish communities in Haizhou Bay were low, indicating high dietary overlap and trophic redundancy among these fish species. The plasticity in resource use among the dominant species makes it possible for species with extensive overlap in resource use to coexist with other species [53]. Therefore, in the Haizhou Bay ecosystem, fish species with different feeding habits may increase productivity by maximizing resource utilization (e.g., through niche complementarity). Liu [54] suggested that fish with high overlapped trophic niches could reduce food competition through habitat differentiation and prey selection. A previous study found that species could reduce their interspecific competition by changing their food composition and spatial distributions [55]. However, low IDis indicates a low overall average level of trophic diversity in the food web of Haizhou Bay, which may be due to a significant decrease in the abundance of top predator fish and an increase in the abundance of small-sized pelagic and demersal fish due to intense fishing pressure in Haizhou Bay [56,57]. Although isotope diversity is an important reference for studying ecosystem function, IDiv, IEve, and IUni provide more valuable information about the degree of habitat coupling affected by predators in complex food webs [57].
Variation in species’ compositions are usually the main reason for the seasonal variation in trophic diversity of fish communities [38]. The discrepancy can be attributed to the fact that offshore migratory fish (such as Eupleurogrammus muticus, M. cinereus, Conger myriaster, Chelidonichthys kumu, and Saurida elongata) in autumn have higher trophic levels and wider trophic diversity, which may replace some fish with similar isotopes in spring and expand the trophic niche of fish communities. The IDiv, IDis and IEve indices of fish communities in Haizhou Bay were higher in spring than those in autumn, indicating that dominant fish species (such as C. kumu and Collichthys lucidus) in Haizhou Bay were closer to the center of isotopic gravity in autumn, with high overlap of trophic niches and intense competition for resources among species. The study on feeding habits of C. kumu and C. lucidus in Haizhou Bay suggested that Leptochela gracilis were the main prey organisms for the two species, and they will compete for food resources in this area [55,58]. Meanwhile, dominant species (such as Lophius litulon, Enedrias fangi, and T. kammalensis) in spring were at the edge of the polygonal convex hull in isotopic space, indicating a high degree of niche differentiation and extensive resource utilization.
This study also showed that there were obvious spatial variations in isotopic trophic diversity of fish communities in Haizhou Bay. The IDiv and IDis of fish communities in inshore waters (<20 m) were lower, indicating that the interspecific competition between fish was higher in inshore waters than that in offshore waters. This is consistent with the findings of Zhang et al. [56], who found greater functional divergence in offshore waters (>20 m), revealing weak interspecific competition in this area. In contrast, lower IEve and IUni indices in offshore waters (>20 m) suggested most fishes in this area had similar isotope ratios, and greater trophic redundancy can buffer external disturbances. In inshore waters (<20 m), fish communities can obtain different carbon sources through both the pelagic and benthic pathways, and with the decrease in water depth, the vertical migration of zooplankton, benthic organisms and pelagic fishes will promote the pelagic–benthic coupling [59]. The pelagic–benthic coupling intensity of different water depths may be one of the main reasons for the spatial variation of isotopic diversity indices of fish communities. Compared with inshore waters, the effects of pelagic–benthic coupling were weaker in offshore waters, and the carbon source of fish communities in this area may be mainly obtained from pelagic waters [59]. Therefore, low food resource diversity in this area contributes greatly to the low IEve value of fish communities.
As one of the important components of ecosystem structure and function, trophic relationships between species are the main aspects of interspecific relationships in fish communities, which are intricately linked to fluctuations in population dynamics and community structure. This study showed that the trophic structure of fish communities in the Haizhou Bay ecosystem had a high degree of trophic redundancy, especially at intermediate trophic levels, which will increase the resilience of this ecosystem to disturbances. The spatial and seasonal variation shown here in the trophic diversity of a fish community highlights the importance of including trophic patterns into ecosystem models, which will provide essential information for ecosystem-based fishery management. In the future, detailed and long-term monitoring of trophic diversity, biological and abiotic factors of fish in the ecosystem is needed to combine biological characteristics with environmental factors, which will contribute to a comprehensive understanding of the mechanism affecting the change in trophic diversity of fish communities and its relationship with ecosystem functions.
Different fish species may react variously to environmental variability at the community level because they have high diversity of life-history traits, feeding strategies and associated morphologies. However, few studies have analyzed the feedback of trophic diversity of fish communities to ecosystem function and changes in food web structure. In the future, a more comprehensive understanding of mechanisms influencing changes in the trophic diversity of fish communities and their relationship to ecosystem function should be considered. In addition, further studies on the variations in trophic diversity of fish communities at larger temporal and spatial scales should also be carried out to assess the stability and vulnerability of food webs under global changes, which will help guide Ecosystem-based Fisheries Management (EBFM).

Supplementary Materials

The following supporting information can be downloaded at: https://www.mdpi.com/article/10.3390/fishes9070262/s1, Table S1: Average δ  13C and δ  15N values of fish species in Haizhou Bay during spring and autumn; Table S2: Average δ  13C and δ  15N values (±SD, in ‰), biomass and trophic position of fish species in Haizhou Bay.

Author Contributions

P.L.: Conceptualization, formal analysis, writing—original draft. W.C.: Writing—review and editing. K.W.: Writing—review and editing. B.X.: Investigation, data curation, resources. C.Z.: Methodology, software. Y.J.: Writing—review and editing. Y.R.: Writing—review and editing. Y.X.: Supervision, project administration, funding acquisition. All authors have read and agreed to the published version of the manuscript.

Funding

This study was financially supported by the Shandong Provincial Natural Science Foundation (ZR2023MD096), and the National Natural Science Foundation of China (31772852).

Institutional Review Board Statement

The conduction of all experiments followed Chinese national guidelines and regulations for appropriate research ethics (GB/T 35892-2018: Laboratory animal-Guideline for ethical review of animal welfare). Ethical review and approval were waived for this study. The fish samples were frozen and taken back to the laboratory. No live fish were used in this study.

Informed Consent Statement

Not applicable.

Data Availability Statement

The data that support the findings of this study are available from the corresponding author upon reasonable request.

Acknowledgments

We are thankful to the faculties and graduate students in the laboratory of Fisheries Ecosystem Monitoring and Assessment in Ocean University of China for their assistance in sampling and analysis. This study was financially supported by the Laoshan Laboratory (Qingdao). All procedures in this study were carried out in accordance with the regulations of the Animal Ethics Committee.

Conflicts of Interest

The authors declare no conflicts of interest.

References

  1. Leclerc, C.; Reynaud, N.; Danis, P.A.; Moatar, F.; Daufresne, M.; Argillier, C.; Usseglio-Polatera, P.; Verneaux, V.; Dedieu, N.; Frossard, V.; et al. Temperature, productivity and habitat characteristics collectively drive lake food web structure. Glob. Chang. Biol. 2023, 29, 2450–2465. [Google Scholar] [CrossRef] [PubMed]
  2. Cury, P.; Shannon, L.; Shin, Y.J. The functioning of marine ecosystems: A fisheries perspective. Responsible Fish. Mar. Ecosyst. 2003, 103–123. [Google Scholar] [CrossRef]
  3. Luo, B.; Wei, H.; Dou, S. Study on food web and trophic structure of fish in the changjiang river estuary. Stud. Mar. Sin. 1997, 38, 143–153. [Google Scholar]
  4. Casini, M.; Lövgren, J.; Hjelm, J.; Cardinale, M.; Molinero, J.C.; Kornilovs, G. Multi-level trophic cascades in a heavily exploited open marine ecosystem. Proc. R. Soc. B Biol. Sci. 2008, 275, 1793–1801. [Google Scholar] [CrossRef] [PubMed]
  5. Delong, J.; Gilbert, B.; Shurin, J.; Barton, B.; Clements, C.; Dell, A.; Greig, H.; Harley, C.; Kratina, P.; McCann, K.; et al. The body size dependence of trophic cascades. Am. Nat. 2015, 185, 354–366. [Google Scholar] [CrossRef]
  6. Halpern, B.S.; Walbridge, S.; Selkoe, K.A.; Kappel, C.V.; Micheli, F.; D’agrosa, C.; Bruno, J.F.; Casey, K.S.; Ebert, C.; Fox, H.E.; et al. A global map of human impact on marine ecosystems. Science 2008, 319, 948–952. [Google Scholar] [CrossRef] [PubMed]
  7. Yurkowski, D.J.; Hussey, N.E.; Ferguson, S.H.; Fisk, A.T. A temporal shift in trophic diversity among a predator assemblage in a warming Arctic. R. Soc. Open Sci. 2018, 5, 180259. [Google Scholar] [CrossRef] [PubMed]
  8. Villéger, S.; Mason, N.W.H.; Mouillot, D. New multidimensional functional diversity indices for a multifaceted framework in functional ecology. Ecology 2008, 89, 2290–2301. [Google Scholar] [CrossRef] [PubMed]
  9. Dukes, J.S. Biodiversity and invasibility in grassland microcosms. Oecologia 2001, 126, 563–568. [Google Scholar] [CrossRef]
  10. Bellwood, D.R.; Hughes, T.P.; Folke, C.; Nyström, M. Confronting the coral reef crisis. Nature 2004, 429, 827–833. [Google Scholar] [CrossRef]
  11. Villasante, S.; Lopes, P.F.M.; Coll, M. The role of marine ecosystem services for human well-being: Disentangling synergies and trade-offs at multiple scales. Ecosyst. Serv. 2016, 17, 1–4. [Google Scholar] [CrossRef]
  12. Cucherousset, J.; Villéger, S. Quantifying the multiple facets of isotopic diversity: New metrics for stable isotope ecology. Ecol. Indic. 2015, 56, 152–160. [Google Scholar] [CrossRef]
  13. Cowley, P. Marine Fisheries Ecology by Simon Jennings, Michael J. Kaiser & John D. Reynolds: Book review. Afr. Zool. 2001, 36, 275–276. [Google Scholar]
  14. Yemane, D.; Field, J.G.; Leslie, R.W. Spatio-temporal patterns in the diversity of demersal fish communities off the south coast of South Africa. Mar. Biol. 2010, 157, 269–281. [Google Scholar] [CrossRef]
  15. Mouchet, M.A.; Villéger, S.; Mason, N.W.H.; Mouillot, D. Functional diversity measures: An overview of their redundancy and their ability to discriminate community assembly rules. Funct. Ecol. 2010, 24, 867–876. [Google Scholar] [CrossRef]
  16. Layman, C.A.; Arrington, D.A.; Montaña, C.G.; Post, D.M. Can stable isotope ratios provide for community-wide measures of trophic structure? Ecology 2007, 88, 42–48. [Google Scholar] [CrossRef]
  17. Zanden, M.J.V.; Rasmussen, J.B. Variation in δ15N and δ13C Trophic Fractionation: Implications for Aquatic Food Web Studies. Limnol. Oceanogr. 2001, 46, 2061–2066. [Google Scholar] [CrossRef]
  18. Laliberté, E.; Legendre, P. A distance-based framework for measuring functional diversity from multiple traits. Ecology 2010, 91, 299–305. [Google Scholar] [CrossRef]
  19. Fry, B. Stable Isotope Ecology; Springer: New York, NY, USA, 2006; pp. 21–39. [Google Scholar] [CrossRef]
  20. Reñones, O.; Polunin, N.V.C.; Goni, R. Size related dietary shifts of Epinephelus marginatus in a western Mediterranean littoral ecosystem: An isotope and stomach content analysis. J. Fish Biol. 2002, 61, 122–137. [Google Scholar] [CrossRef]
  21. Bootsma, H.A.; Hecky, R.E.; Hessslein, R.H.; Turner, G.F. Food partitioning among Lake Malawi nearshore fishes as revealed by stable isotope analyses. Ecology 1996, 77, 1286–1290. [Google Scholar] [CrossRef]
  22. Beaudoin, C.P.; Tonn, W.M.; Prepas, E.E.; Wassenaar, L.I. Individual specialization and trophic adaptability of northern pike (Esox lucius): An isotope and dietary analysis. Oecologia 1999, 120, 386–396. [Google Scholar] [CrossRef]
  23. Wan, H.; Hu, J.Y.; An, L.H.; An, W.; Yang, M.; Yi-Teng, G.M.; Fu-Bu, D.Y.; Tao, S. Analysis of trophic levels of major species in the food web of Bohai Bay using stable nitrogen and carbon isotopes. Chin. Sci. Bull. 2005, 50, 708–712. [Google Scholar] [CrossRef]
  24. Li, Z.Y.; Zuo, T.; Dai, F.Q.; Jin, X.S. Trophic level analysis of organisms from Changjiang estuary and adjacent waters of southern Yellow Sea in spring with stable isotope technology. J. Fish. Sci. China 2010, 17, 105–111. [Google Scholar]
  25. Xu, J.; Zhang, M.; Xie, P. Variability of stable nitrogen isotopic baselines and its consequence for trophic modeling. J. Lake Sci. 2010, 22, 8–20. [Google Scholar] [CrossRef]
  26. Post, D.M. Using stable isotopes to estimate trophic position: Models, methods, and assumptions. Ecology 2002, 83, 703–718. [Google Scholar] [CrossRef]
  27. Phillips, D.L.; Gregg, J.W. Source partitioning using stable isotopes: Coping with too many sources. Oecologia 2003, 136, 261–269. [Google Scholar] [CrossRef]
  28. Parnell, A.C.; Inger, R.; Bearhop, S.; Jackson, A.L. Source partitioning using stable isotopes: Coping with too much variation. PLoS ONE 2010, 5, e9672. [Google Scholar] [CrossRef]
  29. Layman, C.A.; Araujo, M.S.; Boucek, R.; Hammerschlag-Peyer, C.M.; Harrison, E.; Jud, Z.R.; Matich, P.; Rosenblatt, A.E.; Vaudo, J.J.; Yeager, L.A.; et al. Applying stable isotopes to examine food-web structure: An overview of analytical tools. Biol. Rev. 2012, 87, 545–562. [Google Scholar] [CrossRef] [PubMed]
  30. Montecinos, S.; Castro, L.R.; Neira, S. Stable isotope (δ13C and δ15N) and trophic position of Patagonian sprat (Sprattus fuegensis) from the Northern Chilean Patagonia. Fish. Res. 2016, 179, 139–147. [Google Scholar] [CrossRef]
  31. Litz, M.N.C.; Miller, J.A.; Copeman, L.A.; Copeman, L.A.; Teel, D.J.; Weitkamp, L.A.; Daly, E.A.; Claiborne, A.M. Ontogenetic shifts in the diets of juvenile Chinook Salmon: New insight from stable isotopes and fatty acid. Environ. Biol. Fishes 2017, 100, 337–360. [Google Scholar] [CrossRef]
  32. Zhang, C.L.; Chen, Y.; Ren, Y.P. Assessing uncertainty of a multispecies size-spectrum model resulting from process and observation errors. ICES J. Mar. Sci. 2015, 72, 2223–2233. [Google Scholar] [CrossRef]
  33. Wang, Z.F. Research on Ecological Recovery Suitability Assessment for Haizhou Bay Special Marine Reserves. Ph.D. Thesis, Nanjing Normal University, Nanjing, China, 2011. [Google Scholar]
  34. Wu, X.T.; Ding, X.X.; Jiang, X.; Xu, B.D.; Zhang, C.L.; Ren, Y.P.; Xue, Y. Variations in the mean trophic level and large fish index of fish community in Haizhou Bay, China. Chin. J. Appl. Ecol. 2019, 30, 2829–2836. [Google Scholar] [CrossRef]
  35. Li, X.T.; Xu, B.D.; Xue, Y.; Ren, Y.P.; Zhang, C.L. Variation in β diversity of fish species in Haizhou Bay. J. Fish. Sci. China 2021, 28, 451–459. [Google Scholar] [CrossRef]
  36. Xu, B.D.; Zhang, C.L.; Xue, Y.; Ren, Y.P.; Chen, Y. Optimization of sampling effort for a fishery-independent survey with multiple goals. Environ. Monit. Assess. 2015, 187, 252. [Google Scholar] [CrossRef] [PubMed]
  37. Pinnegar, J.K.; Polunin, N.V.C. Differential Fractionation of δ13C and δ15N among Fish Tissues: Implications for the Study of Trophic Interactions. Funct. Ecol. 1999, 13, 225–231. [Google Scholar] [CrossRef]
  38. Sui, H.Z.; Han, D.Y.; Xue, Y.; Ma, Q.Y.; Xu, B.D.; Ren, Y.P. Feeding habits of Hinogobius pflaumi in Jiaozhou Bay, China based on carbon and nitrogen stable isotope analysis. Chin. J. Appl. Ecol. 2017, 28, 3789–3796. [Google Scholar] [CrossRef]
  39. Kaehler, S.; Pakhomov, E.A.; McQuaid, C.D. Trophic structure of the marine food web at the Prince Edward Islands (Southern Ocean) determined by δ13C and δ15N analysis. Mar. Ecol. Prog. Ser. 2000, 208, 13–20. [Google Scholar] [CrossRef]
  40. Hoffman, J.C.; Sutton, T.T. Lipid correction for carbon stable isotope analysis of deep-sea fishes. Deep Sea Res. Part I Oceanogr. Res. Pap. 2010, 57, 956–964. [Google Scholar] [CrossRef]
  41. Boyle, M.D.; Ebert, D.A.; Cailliet, G.M. Stable-isotope analysis of a deep-sea benthic-fish assemblage: Evidence of an enriched benthic food web. J. Fish Biol. 2012, 80, 1485–1507. [Google Scholar] [CrossRef]
  42. Jennings, S.; van der Molen, J. Trophic levels of marine consumers from nitrogen stable isotope analysis: Estimation and uncertainty. ICES J. Mar. Sci. 2015, 72, 2289–2300. [Google Scholar] [CrossRef]
  43. Jennings, S.; Warr, K.J. Environmental correlates of large-scale spatial variation in the d15N of marine animals. Mar. Biol. 2003, 142, 1131–1140. [Google Scholar] [CrossRef]
  44. Cabana, G.; Rasmussen, J.B. Comparison of aquatic food chains using nitrogen isotopes. Proc. Natl. Acad. Sci. USA 1996, 93, 10844–10847. [Google Scholar] [CrossRef] [PubMed]
  45. Gao, Y.X.; Sui, H.Z.; Ren, X.M.; Xu, B.D.; Zhang, C.L.; Ren, Y.P.; Xue, Y. Feeding habits of Saurida elongta in Haizhou Bay, Shandong, China, based on stomach contents and stable isotope. Chin. J. Appl. Ecol. 2020, 31, 4277–4283. [Google Scholar] [CrossRef]
  46. Matthews, B.; Mazumder, A. Compositional and interlake variability of zooplankton affect baseline stable isotope signatures. Limnol. Oceanogr. 2003, 48, 1977–1987. [Google Scholar] [CrossRef]
  47. Minagawa, M.; Wada, E. Stepwise enrichment of along δ15N food chains: Further evidence and the relation between δ15N and animal age. Geochim. Et Cosmochim. Acta 1984, 48, 1135–1140. [Google Scholar] [CrossRef]
  48. Roussel, J.R.; Barber, C.B.; Habel, K.; Grasman, R.; Gramacy, R.B.; Mozharovskyi, P.; Sterratt, D.C. Geometry: Mesh Generation and Surface Tessellation. R Package Version 0.4.5. 2019. Available online: http://www.qhull.org (accessed on 3 February 2023).
  49. Geyer, C.J.; Meeden, G.D.; Fukuda, K. R Package rcdd: Computational Geometry, Version 1.4. 2021. Available online: https://github.com/cddlib/cddlib (accessed on 24 April 2023).
  50. Paradis, E.; Schliep, K. ape 5.0: An environment for modern phylogenetics and evolutionary analyses in R. Bioinformatics 2019, 35, 526–528. [Google Scholar] [CrossRef]
  51. Matich, P.; Kiszka, J.J.; Gastrich, K.R.; Heithaus, M.R. Trophic redundancy among fishes in an East African nearshore seagrass community inferred from stable-isotope analysis. J. Fish Biol. 2017, 91, 490–509. [Google Scholar] [CrossRef]
  52. Sanders, D.; Thébault, E.; Kehoe, R.; van Veen, F.J.F. Trophic redundancy reduces vulnerability to extinction cascades. Proc. Natl. Acad. Sci. USA 2018, 115, 2419–2424. [Google Scholar] [CrossRef]
  53. Ashton, I.W.; Miller, A.E.; Bowman, W.D.; Suding, K.N. Niche complementarity due to plasticity in resource use: Plant partitioning of chemical N forms. Ecology 2010, 91, 3252–3260. [Google Scholar] [CrossRef]
  54. Liu, X.F. Study on Feeding Ecology and Food Relations of Two High Trophic Level Fishes in Haizhou Bay. Ph.D. Thesis, Ocean University of China, Qingdao, China, 2015. [Google Scholar]
  55. Song, Y.H.; Xue, Y.; Xu, B.D.; Zhang, C.L.; Ren, Y.P. Composition of food and niche overlap of three Sciaenidae species in Haizhou Bay. J. Fish. China 2020, 44, 2017–2027. [Google Scholar] [CrossRef]
  56. Zhang, X.Z.; Wang, J.; Xu, B.D.; Zhang, C.L.; Xue, Y.; Ren, Y.P. Spatio-temporal variations of functional diversity of fish communities in Haizhou Bay. Chin. J. Appl. Ecol. 2019, 30, 3233–3244. [Google Scholar] [CrossRef]
  57. Walters, A.; Robert, M.; Cresson, P.; Bris, H.L.; Kopp, D. Food web structure in relation to environmental drivers across a continental shelf ecosystem. Limnol. Oceanogr. 2021, 66, 2563–2582. [Google Scholar] [CrossRef]
  58. Wang, R.F.; Liu, S.D.; Ren, Y.P.; Zhang, C.L.; Xu, B.D.; Xue, Y. Study on spatial heterogeneity in feeding habitat of Chelidonichthys spinousus in Haizhou Bay during autumn. Acta Ecol. Sin. 2019, 39, 6433–6442. [Google Scholar] [CrossRef]
  59. Kopp, D.; Lefebvre, S.; Cachera, M.; Villanueva, M.C.; Ernande, B. Reorganization of a marine trophic network along an inshore-offshore gradient due to stronger pelagic-benthic coupling in coastal areas. Prog. Oceanogr. 2015, 130, 157–171. [Google Scholar] [CrossRef]
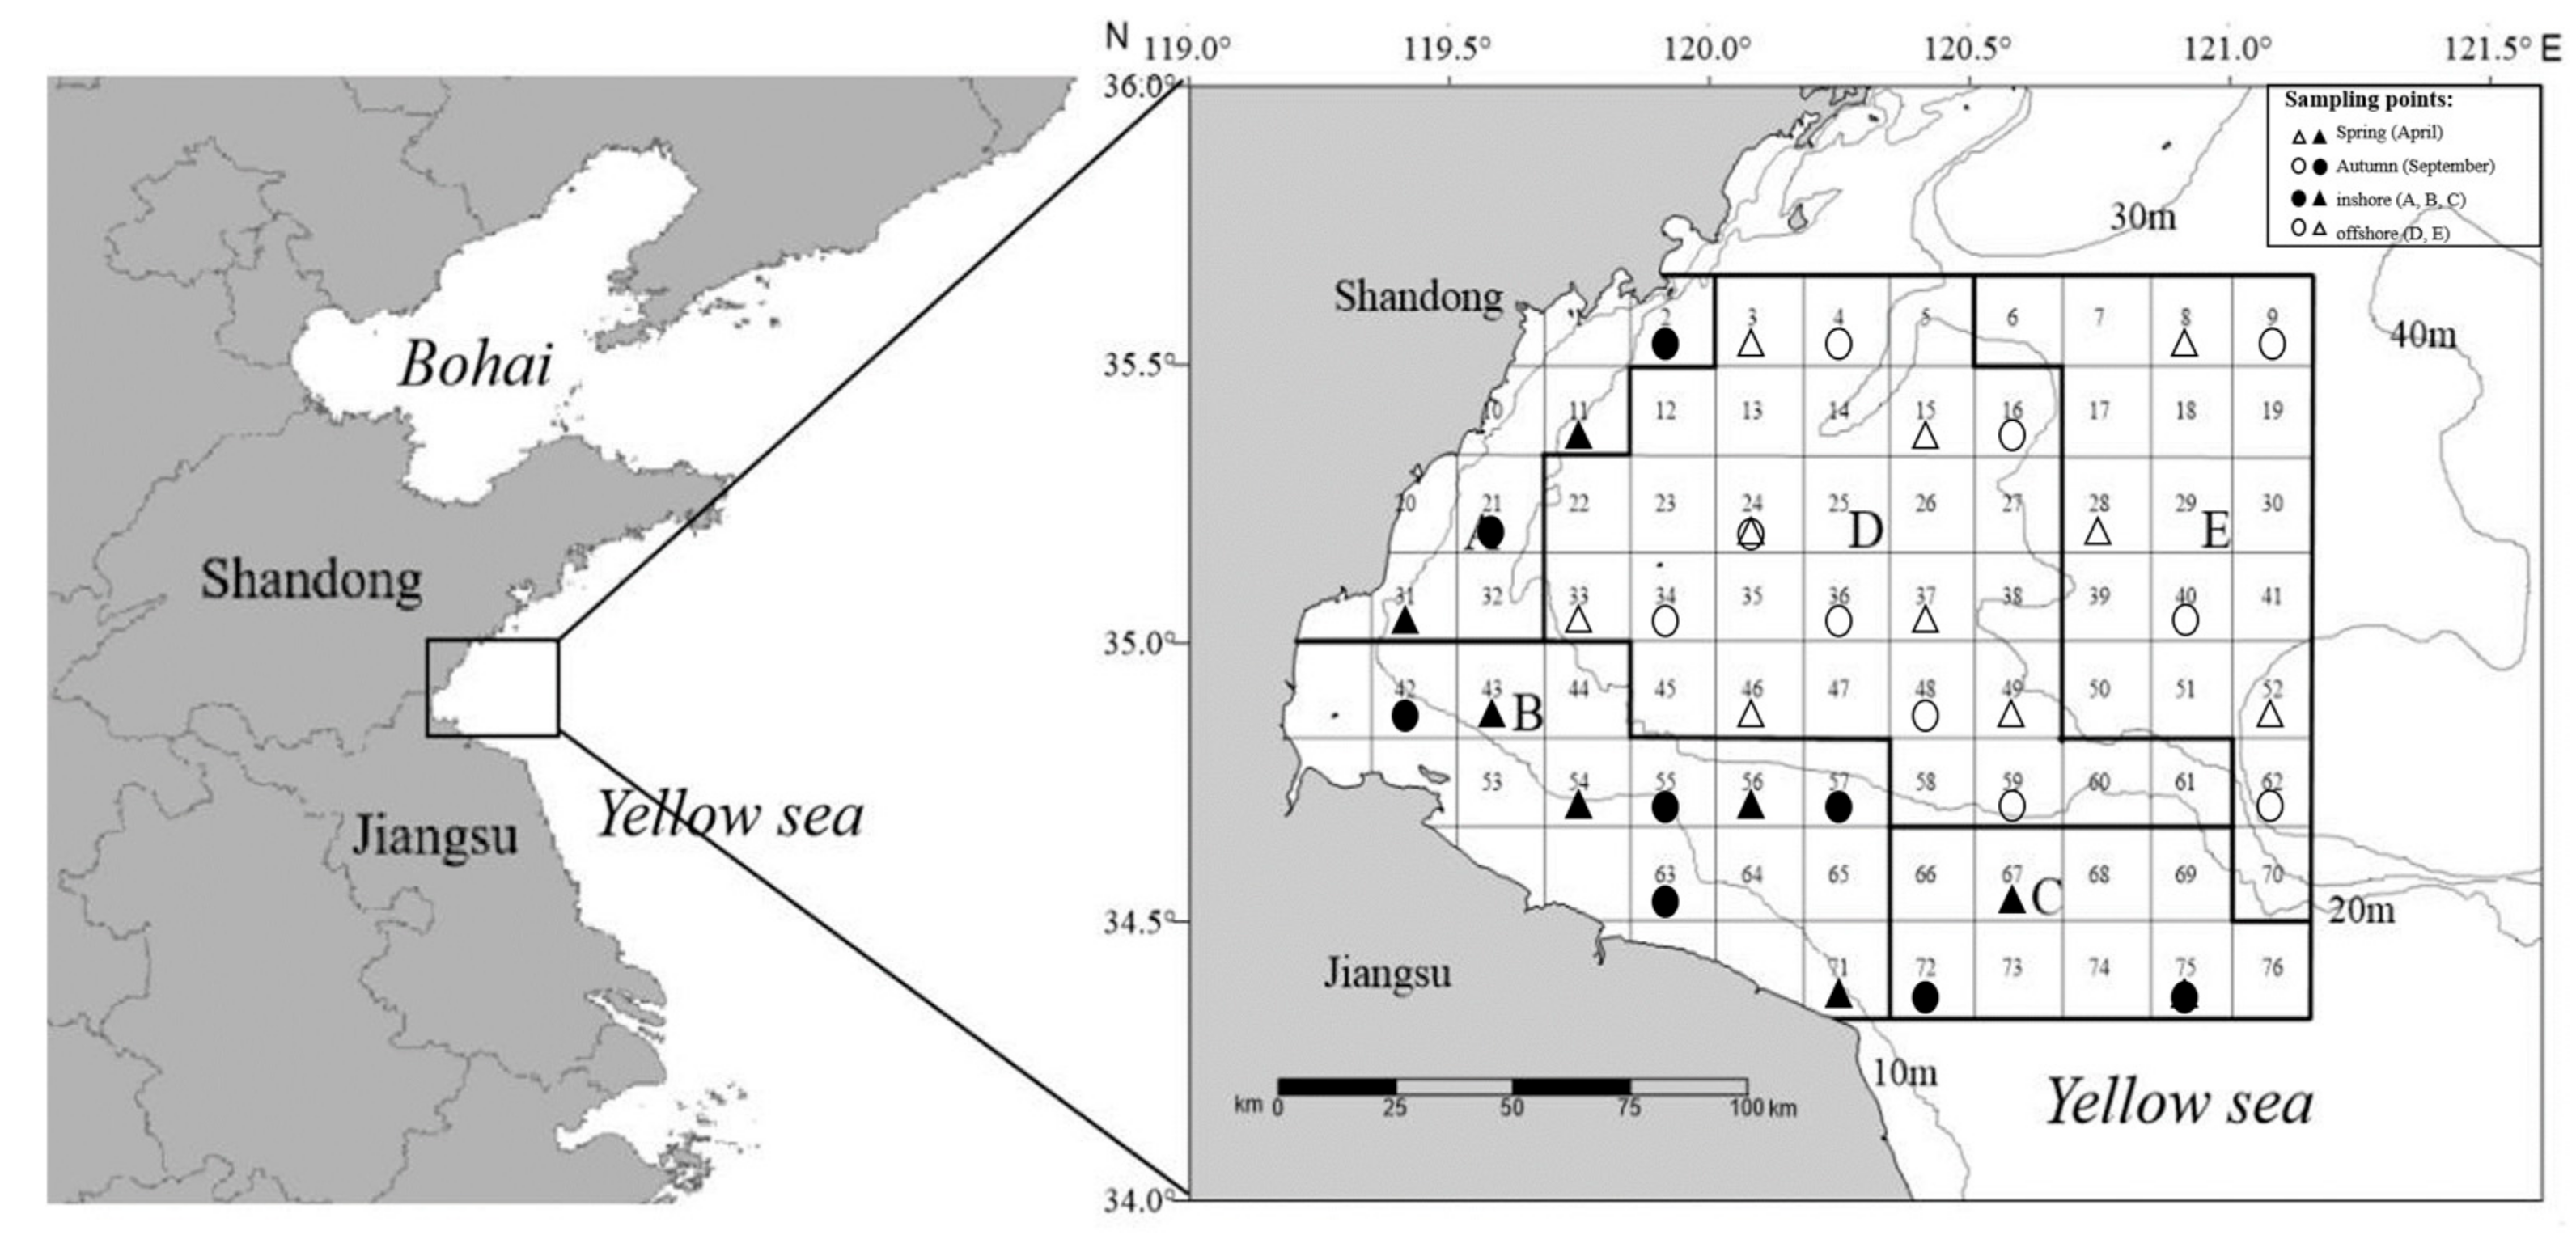
Figure 1. Sampling areas in Haizhou Bay, China. Notes: A, B, C, D and E represent the different partitions with reference to Xu et al. [36], respectively. The inshore and offshore areas are divided by a 20 m isobath.
Fishes 09 00262 g001
Figure 2. Isotopic trophic diversity indices of fish communities during (A) spring and (B) autumn in Haizhou Bay. Notes: (a) Isotopic divergence (IDiv) which is estimated using the distances between the points and the center of gravity of the vertices (dashed lines) measuring the distribution of fish species importance within the border of the convex hull (irregular polygon); (b) isotopic dispersion (IDis) represents the weight mean distance to the center of gravity of all points; (c) isotopic evenness (IEve) denotes the regularity of distribution of points (position and significance) along the shortest tree (green dendrogram) connecting all the points; (d) isotopic uniqueness (IUni) is calculated as the weighted mean of distances between points to the nearest neighbor (black arrows).
Fishes 09 00262 g002
Figure 3. Four isotopic diversity indices of fish communities in (A) inshore and (B) offshore waters in Haizhou Bay. Notes: (a) Isotopic divergence (IDiv) which is estimated using the distances between the points and the center of gravity of the vertices (dashed lines) measuring the distribution of fish species importance within the border of the convex hull (irregular polygon); (b) isotopic dispersion (IDis) represents the weight mean distance to the center of gravity of all points; (c) isotopic evenness (IEve) denotes the regularity of distribution of points (position and significance) along the shortest tree (green dendrogram) connecting all the points; (d) isotopic uniqueness (IUni) is calculated as the weighted mean of distances between points to the nearest neighbor (black arrows).
Fishes 09 00262 g003
Figure 4. Isotopic trophic diversity indices of fish communities in Haizhou Bay, 2018. Notes: (a) Isotopic divergence (IDiv) which is estimated using the distances between the points and the center of gravity of the vertices (dashed lines) measuring the distribution of fish species importance within the border of the convex hull (irregular polygon); (b) isotopic dispersion (IDis) represents the weight mean distance to the center of gravity of all points; (c) isotopic evenness (IEve) denotes the regularity of distribution of points (position and significance) along the shortest tree (green dendrogram) connecting all the points; (d) isotopic uniqueness (IUni) is calculated as the weighted mean of distances between points to the nearest neighbor (black arrows).
Fishes 09 00262 g004
Disclaimer/Publisher’s Note: The statements, opinions and data contained in all publications are solely those of the individual author(s) and contributor(s) and not of MDPI and/or the editor(s). MDPI and/or the editor(s) disclaim responsibility for any injury to people or property resulting from any ideas, methods, instructions or products referred to in the content.