Article

Effect of CRISPR/Cas9 Targets Associated with Iron Metabolism and Its Variation on Transcriptional Regulation of SHK-1 Cell Line as a Model for Iron Metabolism

1
Escuela de Medicina Veterinaria, Facultad de Agronomía y Sistemas Naturales, Facultad de Ciencias Biológicas y Facultad de Medicina, Pontificia Universidad Católica de Chile, Santiago 8320165, Chile
2
The Center for Aquaculture Technologies, San Diego, CA 92121, USA
3
Benchmark Genetics, Roslin Innovation Centre, The University of Edinburgh, Easter Bush Campus, Midlothian EH25 9RG, Edinburgh, UK
4
Laboratorio de Genómica y Genética de Interacciones Biológicas (LG2IB), Instituto de Nutrición y Tecnología de los Alimento, Universidad de Chile, Santiago 7810000, Chile
5
Laboratorio Biotecnología Molecular Marina, Facultad de Agronomía y Sistemas Naturales, Pontificia Universidad Católica de Chile, Santiago 8320165, Chile
6
The Roslin Institute and Royal (Dick) School of Veterinary Studies, The University of Edinburgh, Edinburgh EH8 9YL, UK
7
Department of Genetics, Universidad de Santiago de Compostela, 15705 Santiago de Compostela, Spain
*
Author to whom correspondence should be addressed.
Fishes 2024, 9(6), 198; https://doi.org/10.3390/fishes9060198
Submission received: 17 April 2024 / Revised: 21 May 2024 / Accepted: 24 May 2024 / Published: 26 May 2024
(This article belongs to the Special Issue Aquatic Animal Transgene and Gene Editing Technology)

Abstract

:
In this study, we investigated the function of a gene associated with iron metabolism using CRISPR-Cas9 and RNA sequencing in SHK-1 salmon cells. Our objective was to understand how different guide RNA (gRNA) sequences against the transferrin gene tf could influence gene expression and cellular processes related to iron uptake. RNA-Seq analysis was performed to evaluate the transcriptomic effects of two distinct gRNA targets with high knock-out (KO) efficiencies for the targeted tf gene in the SHK-1 genome. Our results showed no significant differential expression in transferrin-related transcripts between wild-type and CRISPR-edited cells; however, there were major differences between their transcriptomes, indicating complex transcriptional regulation changes. Enrichment analysis highlighted specific processes and molecular functions, including those related to the nucleus, cytoplasm, and protein binding. Notably, different sgRNAs targeting tf might result in different mutations at DNA levels in SHK-1 salmon cells.
Key Contribution: Significant changes in gene expression at the transcriptional level in transferrin gene-edited cells depend on the choice of gRNA targets in the CRISPR-Cas9 methodology.

1. Introduction

The application of CRISPR-Cas9 technology for genome editing has the potential to enhance aquaculture by facilitating the development of improved cell lines, genetically edited cells, and living organisms, which can contribute to the understanding of the molecular mechanisms of cell-based aquaculture [1,2]. For example, genome editing has been successfully used to better understand the functionality of genes associated with sterility, reproduction, growth, and immunity in aquaculture species [1,2]. In this sense, the use of cell lines derived from fish is a promising tool for studying many key issues of aquaculture. Easier maintenance in flexible temperature regimes and hypoxic conditions makes them preferable in vitro tools over mammalian cell lines [3,4]. Cell lines represent a simplified and more straightforward model to study the potential impact of gene knockouts prior to in vivo trials. Also, in vitro gene editing in cell lines not only refines methods before in vivo testing but also contributes to advancing animal welfare by reducing the need for live animal experimentation, thereby cutting time and costs.
Genome editing has been performed in fish cells, e.g., in GFP chinook salmon Oncorhynchus tshawytscha CHSE cells CRISPR-Cas9 demonstrated eGFP disruption (34.6% efficiency) [5]. In our previous work, we demonstrated successful genome editing in CHSE cells using a bicistronic plasmid customized from mammalian to fish cell lines [6]. Despite our demonstrated knock-out effect in cells and the use of a lipofectamine reagent as a delivery method, editing efficiency was quite low (1–10%) [6]. However, recent studies have improved genome editing efficiency by over 60% in fish cells using the ribonucleoprotein (RNP) CRISPR-Cas9 strategy [4,7]. This strategy uses electroporation by applying an external electric field. Therefore, the implementation and protocol for genome editing in fish cells have become more accessible through the use of an RNP. However, in addition to the chosen delivery method there are several other important technical hurdles to be addressed to maximize the possibilities of applying genome-editing approaches in aquaculture species. With all the above, we should emphasize that the design and selection of single guide RNA (sgRNA) sequences are crucial for the success of CRISPR-Cas9 genome editing. Factors such as the sgRNA’s targeting sequence, its GC content, and the presence of a protospacer adjacent motif (PAM) are essential for effective target recognition and cleavage by Cas9 [8,9]. The choice of exon for sgRNA targeting is also important because different exons may have different roles in the resulting protein or RNA molecule. Optimizing these factors can enhance on-target activity while minimizing off-target effects, which is vital for the safety and efficacy of CRISPR-Cas9 applications. Recent advancements have led to the development of computational tools that predict sgRNA efficiency and specificity, aiding in the design of sgRNAs with optimal performance [9].
In this study, we focused on evaluating the impact of CRISPR-Cas9 editing of the transferrin (tf) gene at the transcriptomic level [10] using two target guides on the transcriptional regulation of the immune salmon cell line SHK-1. Specifically, the present study aimed to evaluate the effects of two different sequences or sgRNAs against the transferrin gene at the transcriptomic level by RNA-Seq analysis in SHK-1 cells. This study on the tf gene in salmonids and other fish species is important for several reasons, particularly in the context of understanding evolutionary biology and iron metabolism, and contributing to our understanding of welfare, health, and disease in fish.

2. Materials and Methods

2.1. CRISPR-Cas9 Target Selection and Guide Design

In our study, we targeted specific loci within the Atlantic salmon genome, with two different guide RNAs against transferrin-a (tfa) (GenBank accession 100136560 ssa03; 18924571-18932338). To design the guide sequences (crRNAs) for tfa, we employed bioinformatic tools such as CRISPOR (http://crispor.tefor.net/ (accessed on 20 May 2024)) and the CRISPR Design Tool by Synthego Inc., Menlo Park, USA. Overall, 8 gRNAs were tested in this study, and based on the editing efficiency, we chose number 3 (TIII) and number 8 (TVIII). The crRNA sequence targeting tfa was designed specifically for exon 4 (TIII: ACGGAGGGTTTTGAACCCAA) and exon 3 (TVIII: CCTGCAGCCCATCATTGCAG), according to the best-ranked score obtained through the bioinformatic tools (Figure 1). It is noteworthy that the crRNA designed for tfa (TVIII: CCTGCAGCCCATCATTGCAG) also matched with transferrin-2 (tf2) (GenBank accession 106599563 ssa03; 18857195-18866421) given the high sequence identity (97%), meaning that TVIII targeted both tfa and tf2. All crRNAs, tracrRNAs, and Cas9 components were procured from IDT (California, USA) for our experimental procedures.

2.2. Cell Culture and Electroporation Protocol

In this study, we implemented a Cas9 RNP-based protocol for electroporation in the SHK-1 cell line obtained from the European Collection of Authenticated Cell Cultures (ECACC) (Sigma Aldrich n°97111106) (1 µM RNP; 1600 V, 10 ms, and 3 pulses) as described by Gratacap et al., 2020 [7]. The experimental design comprised two replicates of the wild-type SHK-1 cell line, serving as the control group (C). Additionally, we included two replicates of each SHK-1 cell line mutated via CRISPR-Cas9 targeting the tfa locus, denoted as the CRISPR group (TIII), and those targeted simultaneously at tfa and tf2, denoted as the CRISPR group (TVIII).

2.3. DNA Editing Efficiency and KO Determination

The editing efficiency of each of the two targets (TIII and TVIII) was determined by the online tool Inference of CRISPR Edits (ICE) (Synthego, CA, USA) using Sanger sequencing of PCR amplicons at 10 and 33 days post-transfection (dpt). Genomic DNA was extracted with Dynabeads DNA DIRECT Universal kit (Invitrogen), and PCR was performed according to the manufacturer’s instructions (Q5® Hot Start High-Fidelity 2X Master Mix (NEB). The primers used for amplification and sequencing are listed in Table 1.

2.4. RNA Sequencing, Raw Data Filtering, Mapping, and Differential Expression Analysis

Total RNA was extracted using the Tri-reagent protocol, and RNA was quantified with the Qubit® RNA quantification assay fluorometry, determining integrity by RIN with the Agilent 2100 bioanalyzer. Total RNA paired-end (150 bp) sequencing was performed by Novogene UK (Cambridge, UK) on a NovaSeq 6000 (Illumina).
The raw reads of two experimental groups were evaluated with FastQC [11] for quality and then filtered with Trimmomatic v 0.22 [12] to remove low-quality reads and bases, as well as remanent Illumina adapters sequences, low-quality sequences, and short sequences (min length 50, sliding window 4:20, seed mismatches 2, palindrome clip threshold 30, simple clip threshold 10). Filtered reads were mapped to transcripts obtained from the Salmo Salar reference genome (NCBI accession number GCF_905237065.1) using the Kallisto pseudo-aligner v 0.46.1 [13]. Normalized expression values and differential expression analysis were performed with the DESeq2 package (version 1.2.10) [14], determining differentially expressed transcripts between the C, TIII, and TVIII groups. Transcripts with an adjusted p-value < 0.05 and absolute log2 fold change >1 were considered differentially expressed between the groups. The expression values were used for clustering and heatmap chart generation with R.

2.5. GO Enrichment Analysis

To determine the differentially regulated process due to the CRISPR target effect, we performed an enrichment analysis with the list of differentially expressed transcripts between each experimental group comparison (C vs TIII, C vs TVIII, and TIII vs TVIII). For this, gene ID annotation was recovered from the reference genomes and used as input for the DAVID platform to perform Gene Ontology (GO) enrichment analysis, according to [15], and to determine overrepresented processes due to the CRISPR target and its effect in general transcription of the cell line. Additionally, the Kyoto Encyclopedia of Genes and Genomes (KEGG) metabolic pathway database was used to identify enriched KEGG pathways (p-value < 0.05) in the differentially expressed genes using the KEGG Orthology (KO).

3. Results

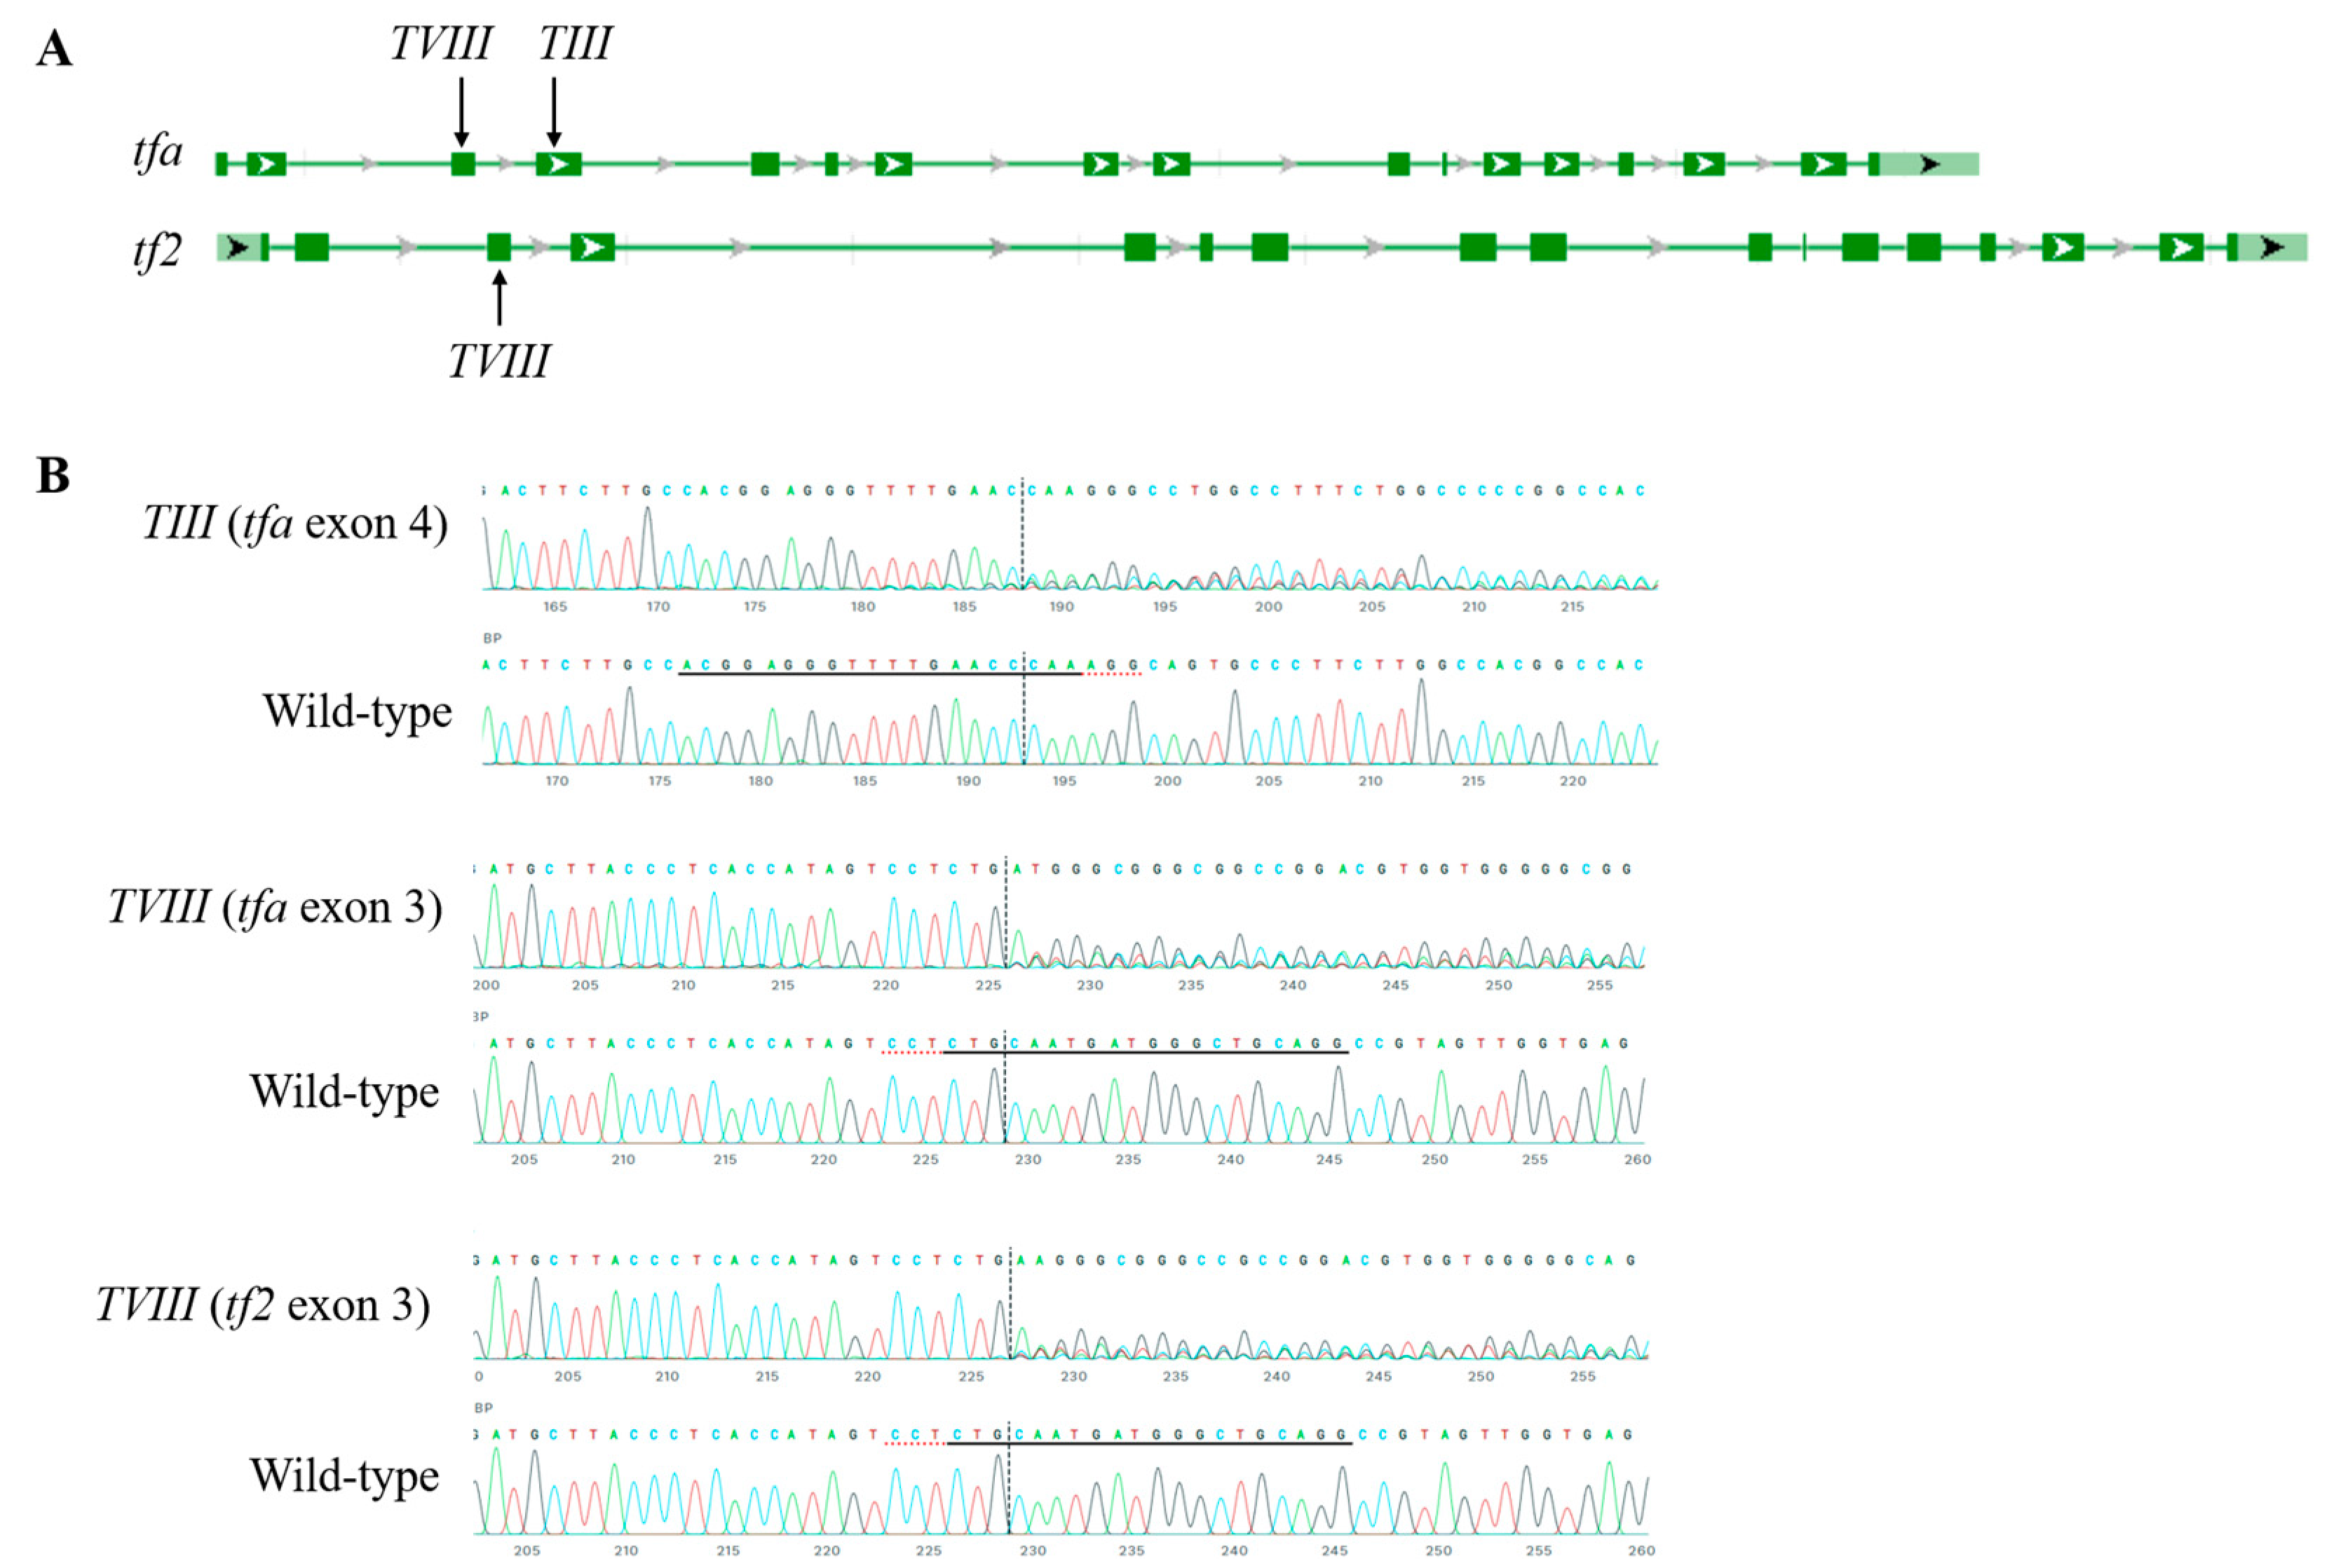
3.1. CRISPR-Cas9 Editing System for TIII and TVIII in SHK-1 Cells

To estimate the editing efficiency of SHK-1 cells transfected with Cas9 RNP by electroporation, a portion of mixed cells was analyzed at 10 and 33 dpt from the TIII (tfa exon 4) and TVIII (tfa exon 3 and tf2 exon 3) groups (Figure 1). At 10 dpt, the proportions of edited (insertion or deletion, indel) cells for tfa exon 4, tfa exon 3, and tf2 exon 3 were 96, 98, and 86%, respectively. The KO (frame-shifted indel) efficiencies were 92, 95, and 74%, respectively. These editing and KO efficiencies remained high at 33 dpt, showing 96–97% indel and 94–95% KO for tfa exon 3, 96–97% indel and 92–96% KO for tfa exon 4, and 83–87% indel, 78–83% KO for tf2 exon 4. Based on their constantly high editing and KO efficiency, these mixed cell populations were used for RNA-seq without cloning the single-cell population.

3.2. Gene Expression of Transferrin-Related Transcripts

RNA sequencing generated a total of 180,390,811 paired-end reads, with an average of 30,065,135 raw reads per library. After trimming, we obtained an average of 28,981,182 filtered reads per library. These reads were mapped to the Salmo salar reference genome, resulting in an average of 24,446,430 mapped reads per library (Table 2).
To understand the impact of editing on the targeted transferrin genes and their receptors, we used RNA-seq data to determine the expression level in Transcripts Per Million (TPM) of transferrin (tfa), transferrin receptor 1b (tfr1b), transferrin receptor 2 (tfr2), and transferrin receptor 1a (tfr1a) in C, TIII, and TVIII groups. Interestingly, no significant differential expression was observed in these transcripts between these groups. No significant differences in expression were observed for these transcripts between the groups. Specifically, tfa showed no expression in any group, consistent with its knock-out in TIII and TVIII (Figure 2). Additionally, tfr2 showed a lower expression in the TIII and TVIII groups, while tfr1b had a higher expression in the C group compared to TIII and TVIII.

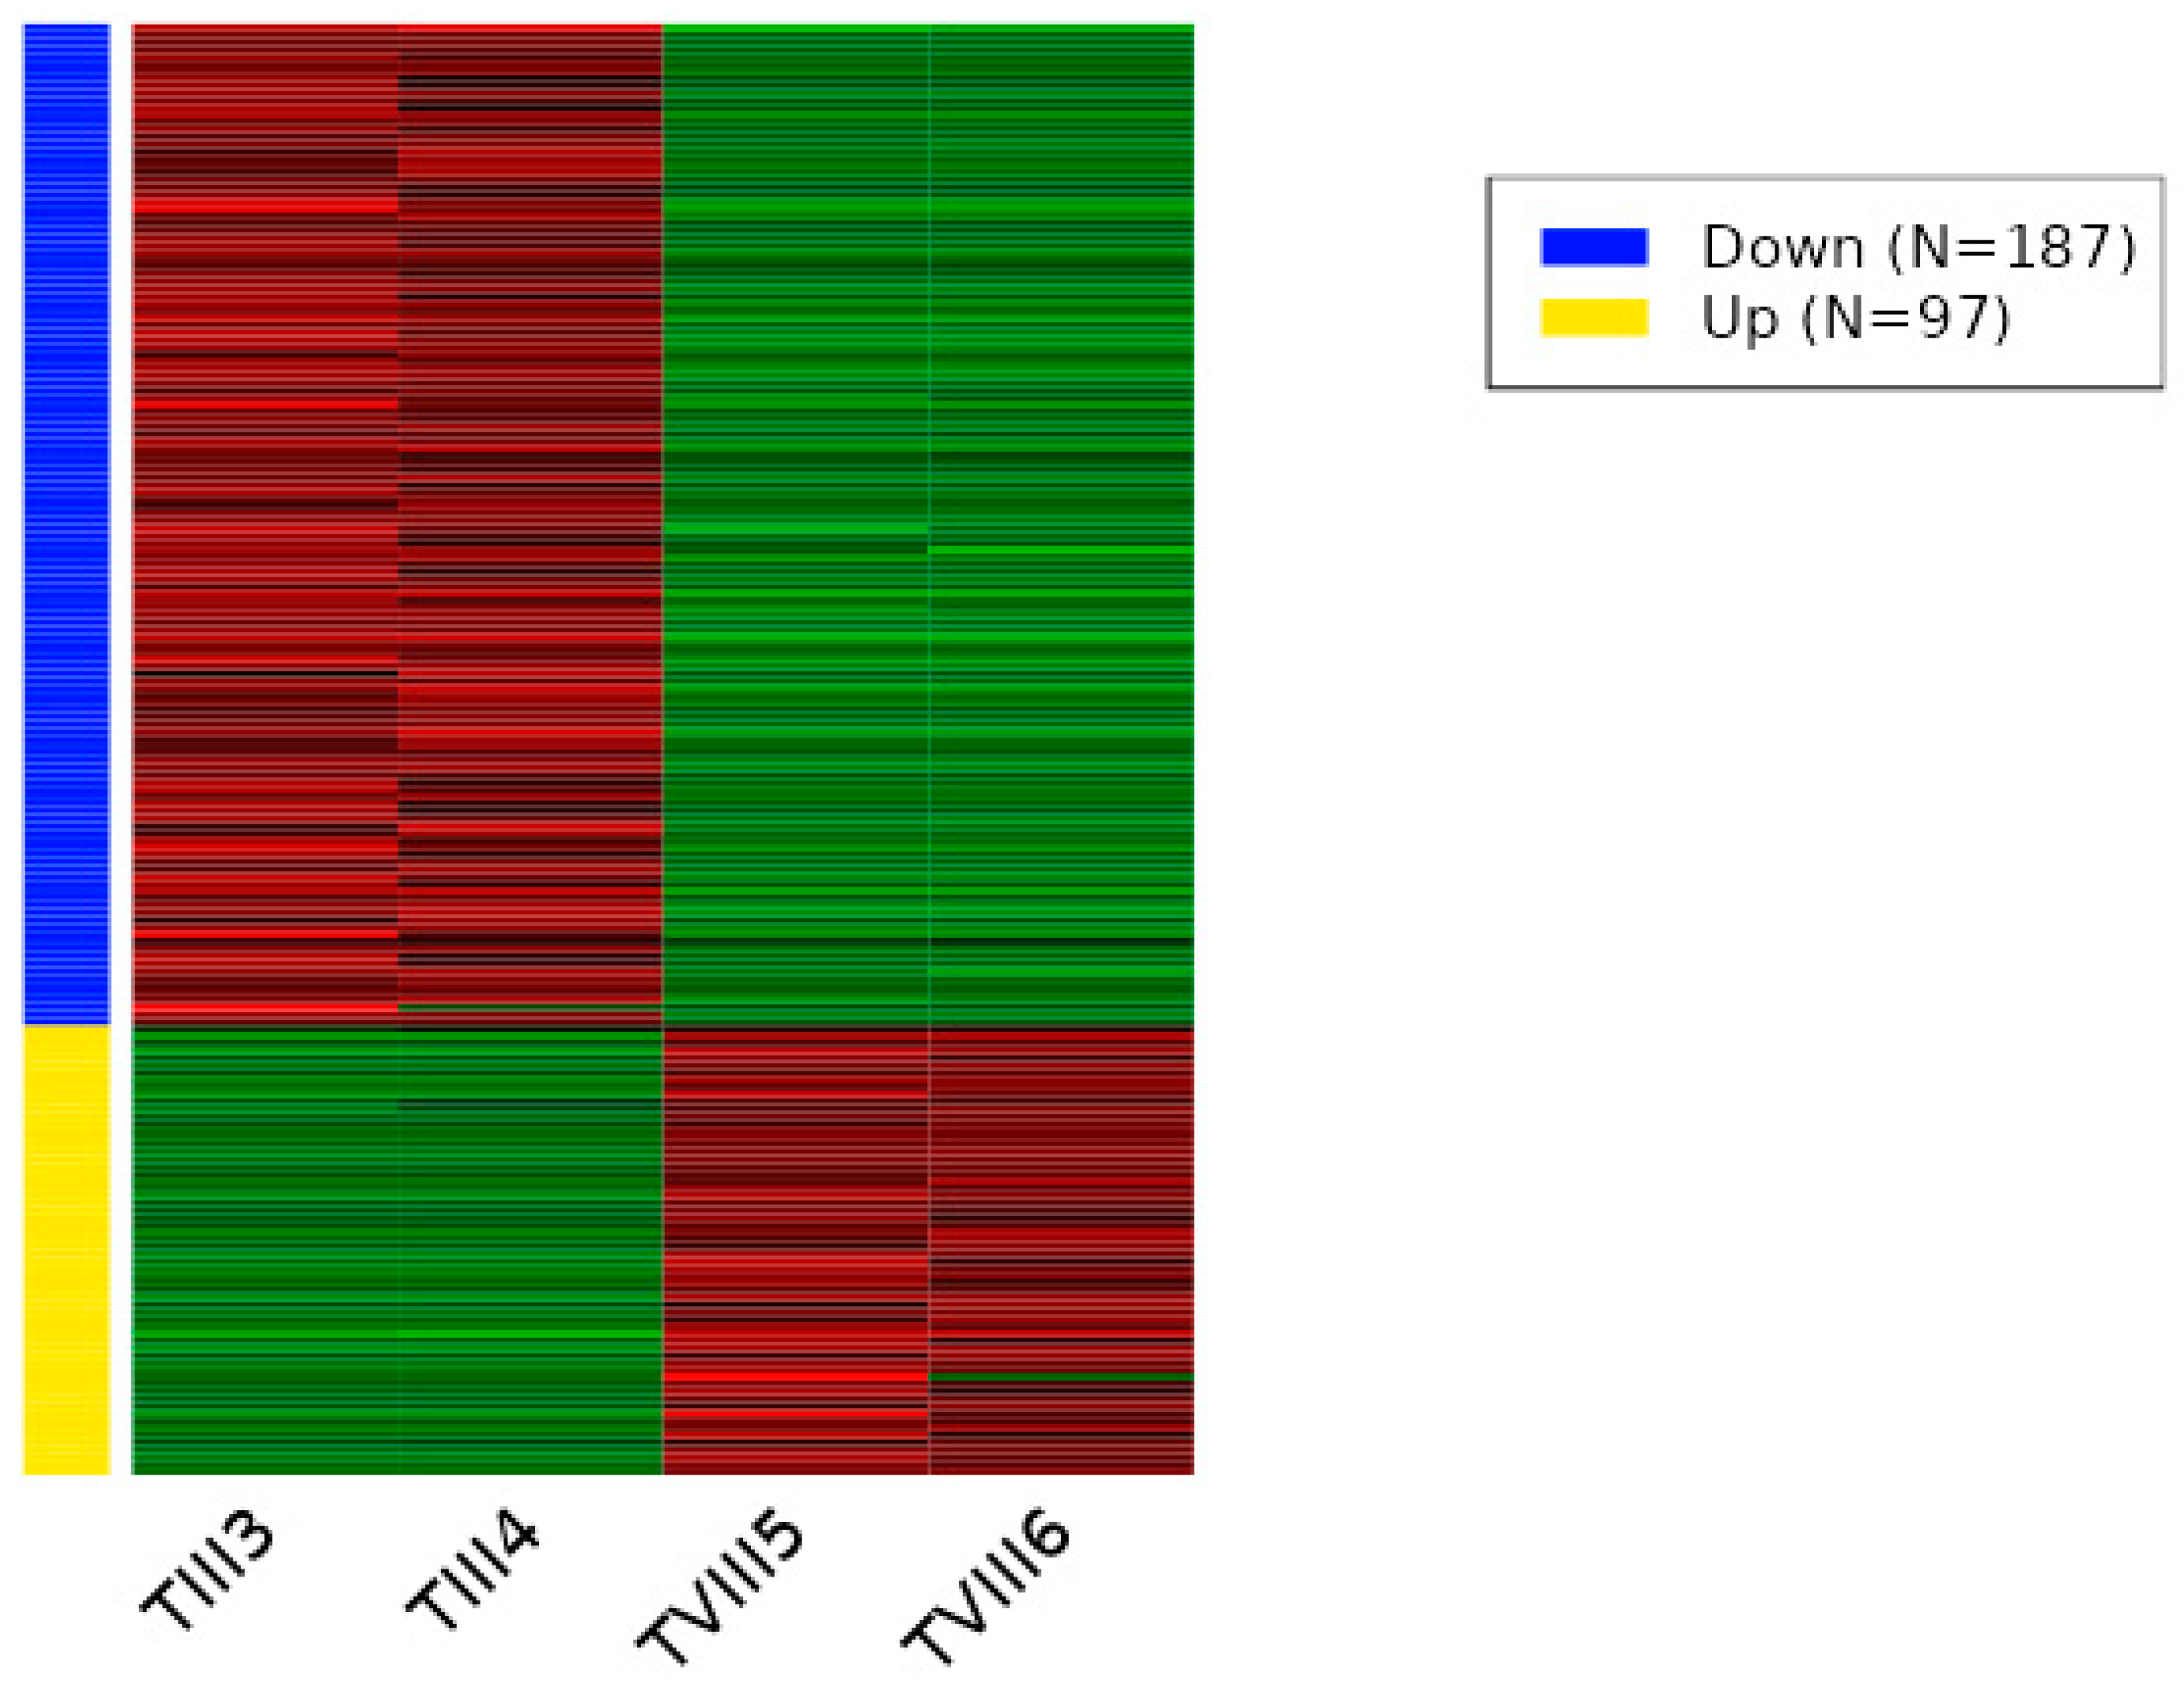
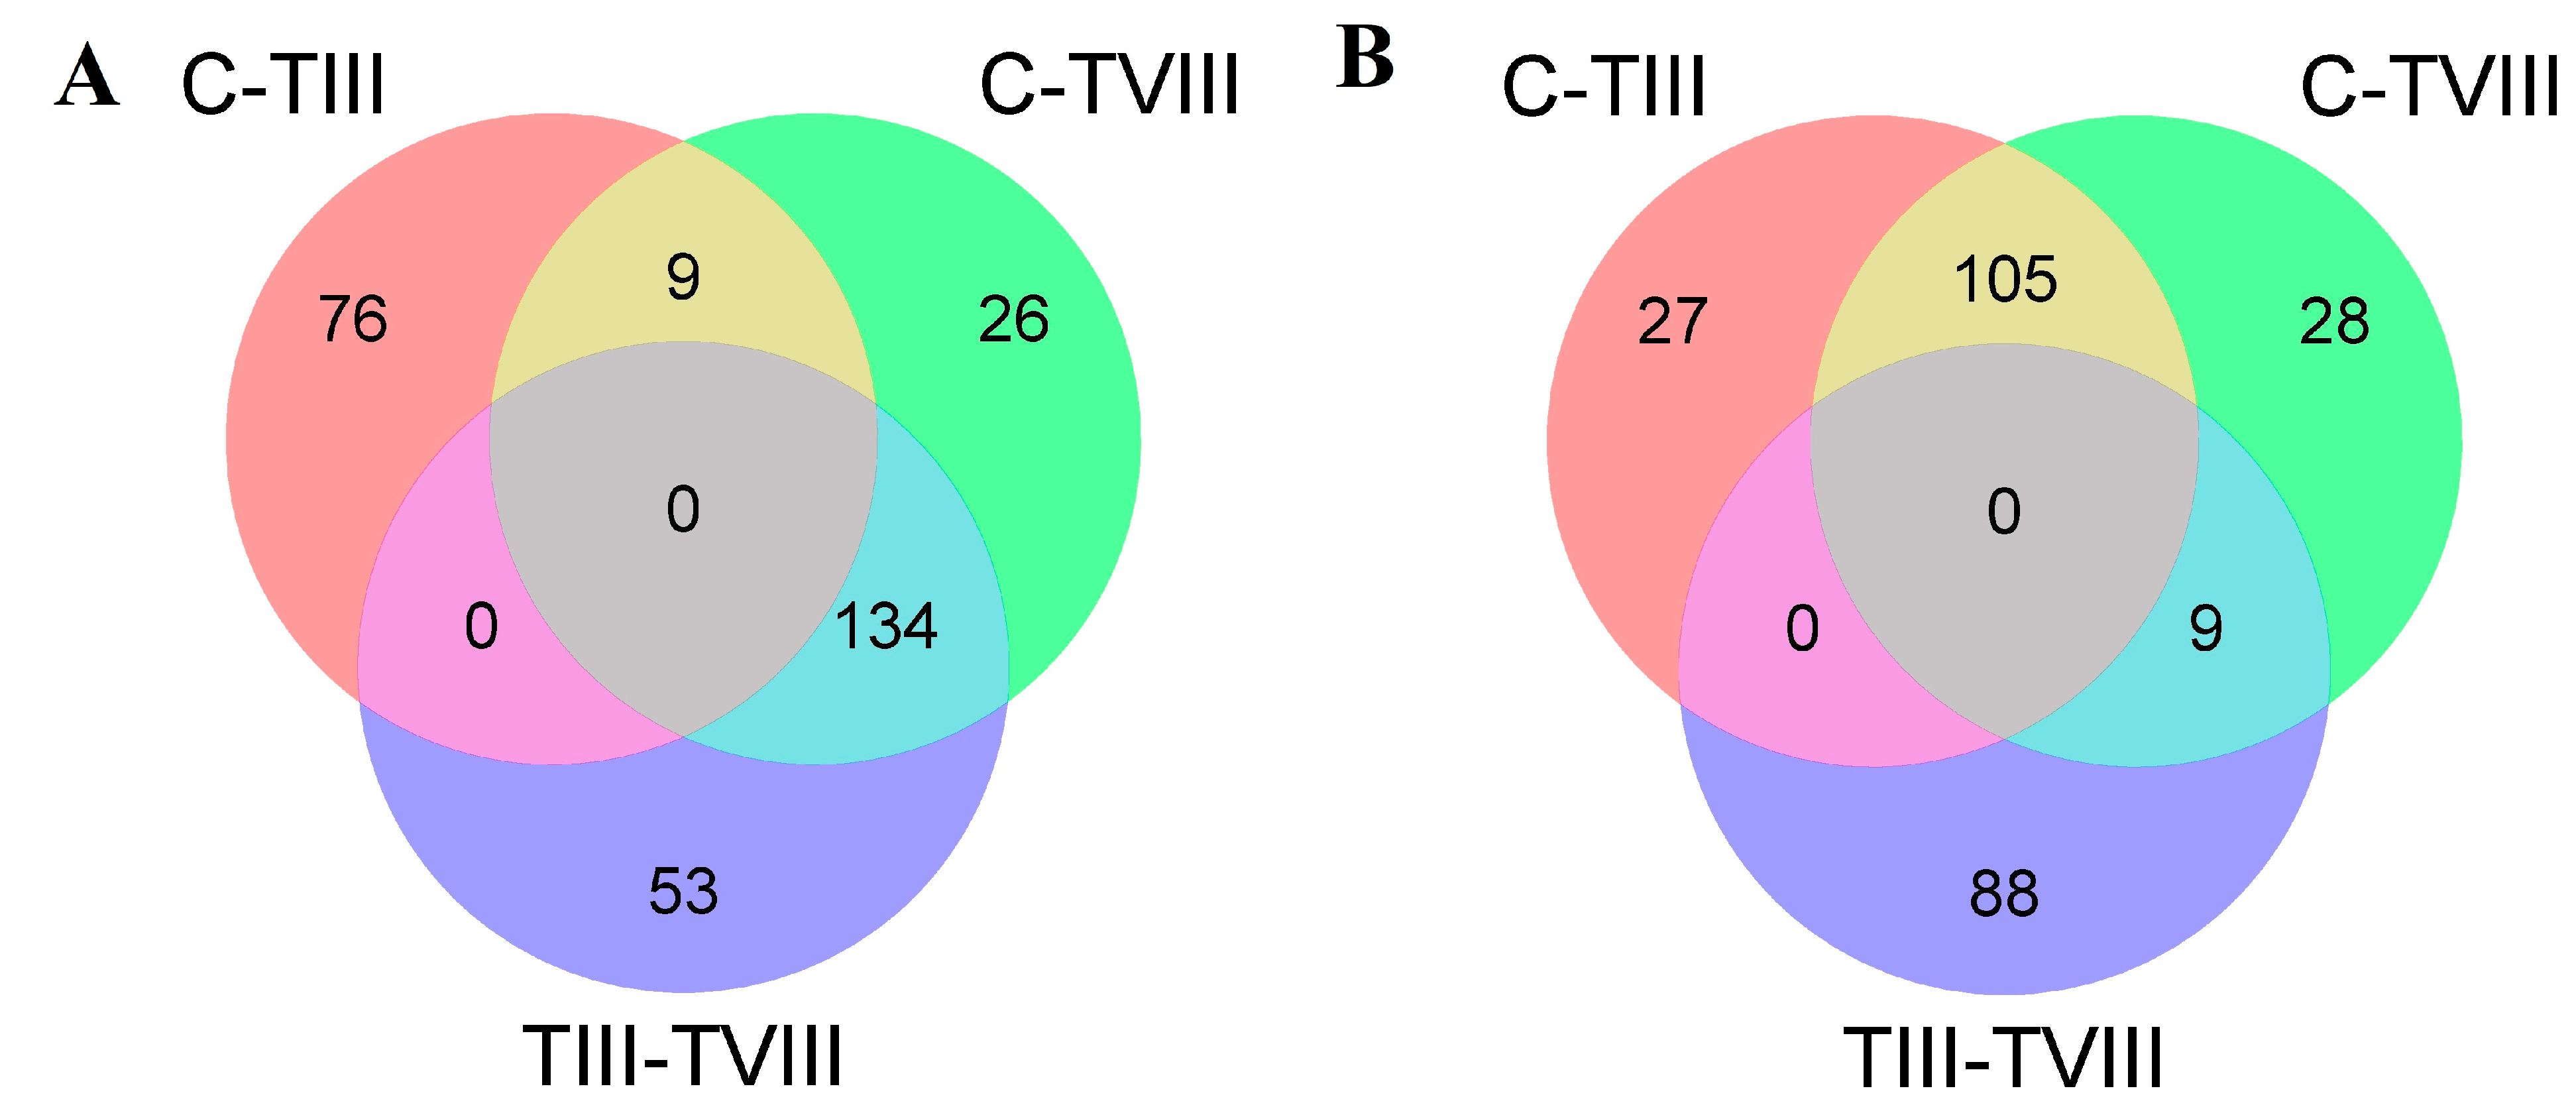
3.3. Differentially Expression in SHK-1 Cell Line in Response to CRISPR-Cas9 Target Guide

To understand the impact of CRISPR-Cas9 genome editing on the regulation of transcription in cells, we performed RNA-seq analysis on wild-type and CRISPR-Cas9-edited SHK-1 cell lines. A total of 217 differentially expressed transcripts between C and TIII groups was observed. Of these transcripts, 85 were down-regulated (Table S1), and 132 were up-regulated (Table S2) in the TIII group (Figure 3 and Figure S1). Between the C and TVIII groups, a total of 311 differentially expressed transcripts was observed, with 169 down-regulated (Table S3) and 142 up-regulated (Table S4) in the TVIII group (Figure 4 and Figure S2). Finally, 284 differentially expressed transcripts between TIII and TVIII groups were observed. Of these transcripts, 187 were down-regulated (Table S5), and 97 were up-regulated (Table S6) in the TVIII group (Figure 5 and Figure S3).
In terms of differentially expressed transcripts, there were 114 common differentially expressed transcripts between C vs TIII and C vs TVIII comparisons, 83 common transcripts between C vs TIII and TIII vs TVIII comparisons, and 143 common transcripts between C vs TVIII and TIII vs TVIII comparisons (Figure 6A,B).

3.4. GO Enrichment and KEGG Pathway Analysis in SHK-1 Wild-Type and CRISPR Lines

The differentially expressed transcripts were used for an enrichment analysis using GO terms to determine the over-represented processes in response to CRISPR-Cas9-edited cell lines. The enrichment analysis between C and TIII groups showed eight enriched processes (Table 3), including three biological processes (BP), three cellular components (CC), and four molecular functions (MF). No KEGG-enriched pathways were observed for this comparison. For C and TVIII comparisons, eight enriched processes were observed (Table 4), including one BP, four CC, and three MF-enriched processes for GO terms. Additionally, KEGG pathways were enriched, including fatty acid metabolism (fold-enrichment 8.5) and adherent junctions (fold-enrichment 4.7). Finally, for TIII and TVIII comparisons, five enriched processes were observed (Table 5): one BP, two CC, and two MF-enriched GO terms. The mTOR signaling was the only KEGG pathway enriched in this comparison (fold-enrichment 4).

4. Discussion

The CRISPR-Cas9 system is a useful genome-editing tool with a high efficiency, low cost, and relatively straightforward application in research settings [16]. CRISPR-Cas9 has played a relevant role in recent years in the study of host–pathogen interactions, allowing a better understanding of key host factors for successful infection by pathogens [17], and it has also been used to study iron metabolism in mammal cells [18]. However, the implementation of a novel CRISPR-Cas9 protocol in non-model organisms has been given less attention [19]. Therefore, the tf gene editing present in this study, from a macrophage-enriched cell culture (SHK-1), is a useful platform for better understanding host–pathogen interactions and iron metabolism in fishes. In this study, we evaluated the effect of the CRISPR-Cas9 edition of transferrin using different target guides on the general transcriptional regulation of the immune salmon cell line SHK-1 [7] to understand how different target guides could impact the gene expression of the cell.

4.1. Fish Cell Lines and CRISPR-Cas9 System as Genome-Editing Tool for the Study on Iron-Related Gene

Fish cell lines have been widely used for the study of biology and disease in salmon [20]. One of the most useful cell lines used in salmon for immunological studies is SHK-1, which has contributed to the study of viruses [21], bacteria [22], parasites [23], and iron metabolism [24], among others. This cell line has proven to be useful to better understand the host–pathogen interaction between salmon and the infectious salmon anemia virus (ISAv) [25]. In our study, this cell line also has proven to be an excellent model for performing genome editing based on the CRISPR-Cas9 system, showing high levels of efficiency for a salmon cell line and relatively high KO efficiency compared to other fish cell lines (23–76%) [26], or in vivo induced mutations in embryos of S. salar by the CRISPR-Cas9 system (13–50%) [27,28], providing a useful initial step for research in salmonid species to better understand the specific role of gene regulation on infectious diseases and immune responses.
A study on the CHSE-214 cell line used the CRISPR-Cas9 system to evaluate the effect of a knock-out of the genes mavs, irf3, irf7-1, and irf3/7-1 (double KO) on PRR signaling [26]. The evaluation of Interferons (IFNs) and IFN-stimulated genes by qPCR after Poly I:C stimulation showed an inhibition of the expression in the mavs and irf3 edited groups, showing the advantages of using CRISPR edited cell lines in fish for understanding the immune response and the host–pathogen interaction. While the CRISPR-Cas system has been successfully used in different fish species, including S. salar, Oreochromis niloticus, Danio rerio, and Oryzias latipes [29], most studies using the CRISPR-Cas system in fish have focused on evaluating the effects of the edition in the target genes and/or its directly related genes (i.e., receptors and transcription factors) [30,31], without considering the global impact on gene expression inside the cell, thereby missing information that could be relevant in the interpretation of experimental results. As observed in our results, RNA-seq data showed relevant significant differences in general transcriptional regulation between TIII and TVIII targets, even when no relevant differences were observed in the expression of transferrin and transferrin-related genes.
In previous studies, SHK-1 cell lines have been used to determine the relevance of iron in the host–pathogen interaction with the bacteria Piscirickettsia salmonis, showing that iron plays a key role in the capacity of infection by the bacteria and the immune capacity of the host cells [24]. This result is also consistent with previous studies that showed that disease resistance to P. salmonis could be related to genes involved in iron metabolism and catchment [32,33]. Our results highlight the usefulness of the CRISPR-Cas9 system in studying iron-related genes in the SHK-1 cell line and how they could impact the general transcriptional response of the cell, providing an excellent model to evaluate host-pathogen interaction. This will allow us to better understand the role of iron-related genes in the infection capacity in fish, the host response, and disease resistance mediated by iron metabolism, and how they could affect the global transcriptional regulation of the cell.

4.2. Considerations in Biological Variability in Response to CRISPR-Cas9 Edited Organism

It has been observed that the edition of the genetic material of an organism could lead to alterations in gene expression regulation, including on genes closer to the edition point or genes distant from the target location [34]. The magnitude of this effect also depends on the technology and category by which the editing is made, as with the site-directed nucleases (SDN), which presents three categories according to the type of modification, generating a higher impact for categories that lead to major modifications (i.e., SDN-3) [35]. To understand the effect of edition by CRISPR, the evaluation of the response could be relevant, with different strategies ranging from considering only target genes to genome-wide transcription through omics technologies [30].
In our study, we used RNA-seq to understand the whole variability in transcriptional regulation in SHK-1 edited cells. The variability observed between C and the different CRISPR-Cas9 edited cells showed important differences in the process associated with the nucleus, with processes oriented more to DNA access and transcription in the TIII group (DNA binding, histone binding, and the positive regulation of transcription), and processes more related to the cytoskeleton in TVIII (microtubule organizing center, gamma-tubulin binding, and cilium assembly). The editing of one gene using CRISPR-Cas9 affecting the transcription of hundreds of transcripts has been previously observed on human cell lines [36].
The difference in gene regulation in our study showed enriched KEGG pathways, including fatty acid metabolism and mTOR signaling pathways, among others. Recent studies have shown that iron interacts with fatty acid metabolism, where iron dysregulation could induce saturated fatty acid insulin resistance in mammals [37], and an iron-dependent form of regulated cell death (ferroptosis) acts through the accumulation of lipid peroxide in cells [38]. mTOR signaling acts as a sensor of the cellular energy state [39] and regulates iron homeostasis. The regulation of iron by mTOR occurs through the modulation of tfr1 [40], evidencing the relevance of transferring and being concordant with our results.
Additionally, several enriched processes were observed for both target guides, showing that different processes are regulated differentially between different target guides for CRISPR. The AP-1 complex participates in protein-mediated trafficking and has been previously associated with a role in inflammation and gut immune homeostasis [41]. Even more, the AP-1 complex is involved in transferrin receptor 1 trafficking, with direct involvement in the transferrin uptake into the cell [42]. This evidence suggests that different target guides for transferrin could generate not only a general variability on transcriptional regulation but also a specific regulation of processes directly involved in transferrin capture and recognition through affecting membrane trafficking. This factor could be relevant for generating cell models to better understand the pathogen interaction with the host in salmon cells through iron regulation, considering that increased iron could have a direct impact on the infection levels of pathogenic bacteria of salmon, such as P. salmonis [43], as well as resistance to this bacterium [32], providing a useful model to evaluate host–pathogen interactions in Atlantic salmon.
It is noteworthy to mention that despite the absence of changes in tf transcript abundance, it is important to remember that the regulation of genes linked to iron metabolism occurs at the post-transcriptional level through the IRE/IRP system [44]. Therefore, we speculate that CRISPR-Cas9 induces insertions or deletions (indels) at the target site (DNA), and these changes can create new splice sites or disrupt existing ones, resulting in altered splicing patterns [22]. Finally, frameshifting at the molecular level could be expected in these cells, which leads to a plausible explanation in this study.

5. Conclusions

Our study explored CRISPR-Cas9 editing in fish cell lines, revealing nuanced transcriptional responses. RNA-seq identified numerous differentially expressed transcripts post-editing, indicating complex regulatory dynamics. Enrichment analysis underlines altered pathways like fatty acid metabolism and mTOR signaling. These findings deepen our understanding of CRISPR-Cas9 effects, especially in host–pathogen interactions and iron metabolism in fish, meaning that the implications for disease resistance and aquaculture management are significant. RNA-seq analysis revealed a considerable number of differentially expressed transcripts between wild-type and CRISPR-edited cell lines, highlighting the complex regulatory dynamics induced by CRISPR-Cas9 editing. Notably, distinct sets of transcripts were differentially expressed in pairwise comparisons between wild-type and two different sgRNAs against the same target gene, underscoring the specificity of transcriptional responses to CRISPR-Cas9 targeting.

Supplementary Materials

The following supporting information can be downloaded at: https://www.mdpi.com/article/10.3390/fishes9060198/s1, Figure S1: Volcano plot of differentially expressed transcripts between C and TIII groups; Figure S2: Volcano plot of differentially expressed transcripts between C and TVIII groups; Figure S3: Volcano plot of differentially expressed transcripts between TIII and TVIII groups; Table S1: Up-regulated genes between TIII and TVIII groups. Table S2: Table S2. Up-regulated genes between C and TIII groups. Table S3: Down-regulated genes between C and TVIII groups. Table S4: Up-regulated genes between C and TVIII groups. Table S5: Down-regulated genes between TIII and TVIII groups. Table S6: Up-regulated genes between TIII and TVIII groups.

Author Contributions

Conceptualization, S.E.-A., D.R. and C.P.; methodology, S.E.-A. and Y.J.; software, A.S.; formal analysis, S.E.-A., Y.J. and P.D.; investigation, S.E.-A. and Y.J.; resources, S.E.-A., R.P. and D.R.; data curation, P.D., C.P. and R.P.; writing—original draft preparation, S.E.-A. and P.D.; writing—review and editing, P.D., C.P., R.P., Y.J. and S.E.-A.; visualization, A.S.; project administration, S.E.-A.; funding acquisition, S.E.-A. and D.R. All authors have read and agreed to the published version of the manuscript.

Funding

This study was supported by FONDECYT ANID Chile 11190649 to S.E.A. D.R. was supported by the Axencia Galega the Innovación (GAIN, Xunta de Galicia) as part of the Oportunius programme, and by BBSRC Institute Strategic Grants to the Roslin Institute (BBS/E/20002172, BBS/E/D/30002275, BBS/E/D/10002070 and BBS/E/RL/230002A).

Institutional Review Board Statement

Not applicable.

Data Availability Statement

Data are contained within the article and Supplementary Materials.

Acknowledgments

This project would not have been possible without the generous financial support of the “Magister en Sistemas Animales Sustentables”, Pontificia Universidad Católica de Chile, FASN.

Conflicts of Interest

The author, Yehwa Jin, was employed by the company the Center for Aquaculture Technologies. The remaining authors declare that the research was conducted in the absence of any commercial or financial relationships that could be construed as a potential conflict of interest.

References

  1. Gratacap, R.L.; Wargelius, A.; Edvardsen, R.B.; Houston, R.D. Potential of Genome Editing to Improve Aquaculture Breeding and Production. Trends Genet. 2019, 35, 672–684. [Google Scholar] [CrossRef]
  2. Roy, S.; Kumar, V.; Behera, B.K.; Parhi, J.; Mohapatra, S.; Chakraborty, T.; Das, B.K. CRISPR/Cas Genome Editing—Can It Become a Game Changer in Future Fisheries Sector? Front. Mar. Sci. 2022, 9, 924475. [Google Scholar] [CrossRef]
  3. Goswami, M.; Yashwanth, B.S.; Trudeau, V.; Lakra, W.S. Role and Relevance of Fish Cell Lines in Advanced In Vitro Research. Mol. Biol. Rep. 2022, 49, 2393–2411. [Google Scholar] [CrossRef] [PubMed]
  4. Strømsnes, T.A.H.; Schmidke, S.E. CRISPR/Cas9-Mediated Gene Editing in Salmonids Cells and Efficient Establishment of Edited Clonal Cell Lines. Int. J. Mol. Sci. 2022, 23, 16218. [Google Scholar] [CrossRef] [PubMed]
  5. Dehler, C.E.; Boudinot, P.; Martin, S.A.M.; Collet, B. Development of an Efficient Genome Editing Method by CRISPR/Cas9 in a Fish Cell Line. Mar. Biotechnol. 2016, 18, 449–452. [Google Scholar] [CrossRef] [PubMed]
  6. Escobar-Aguirre, S.; Arancibia, D.; Escorza, A.; Bravo, C.; Andrés, M.E.; Zamorano, P.; Martínez, V. Development of a Bicistronic Vector for the Expression of a CRISPR/Cas9-mCherry System in Fish Cell Lines. Cells 2019, 8, 75. [Google Scholar] [CrossRef] [PubMed]
  7. Gratacap, R.L.; Jin, Y.H.; Mantsopoulou, M.; Houston, R.D. Efficient Genome Editing in Multiple Salmonid Cell Lines Using Ribonucleoprotein Complexes. Mar. Biotechnol. 2020, 22, 717–724. [Google Scholar] [CrossRef] [PubMed]
  8. Ferdous, M.A.; Islam, S.I.; Habib, N.; Almehmadi, M.; Allahyani, M.; Alsaiari, A.A.; Shafie, A. CRISPR-Cas Genome Editing Technique for Fish Disease Management: Current Study and Future Perspective. Microorganisms 2022, 10, 2012. [Google Scholar] [CrossRef] [PubMed]
  9. Brazelton, V.A., Jr.; Zarecor, S.; Wright, D.A.; Wang, Y.; Liu, J.; Chen, K.; Yang, B.; Lawrence-Dill, C.J. A Quick Guide to CRISPR sgRNA Design Tools. GM Crops Food 2015, 6, 266–276. [Google Scholar] [CrossRef]
  10. Qian, X.; Ba, Y.; Zhuang, Q.; Zhong, G. RNA-Seq Technology and Its Application in Fish Transcriptomics. OMICS J. Integr. Biol. 2014, 18, 98–110. [Google Scholar] [CrossRef]
  11. Andrews, S. FastQC: A Quality Control Tool for High Throughput Sequence Data. 2010. Available online: http://www.bioinformatics.babraham.ac.uk/projects/fastqc (accessed on 16 April 2024).
  12. Bolger, A.M.; Lohse, M.; Usadel, B. Trimmomatic: A flexible trimmer for Illumina sequence data. Bioinformatics 2014, 30, 2114–2120. [Google Scholar] [CrossRef] [PubMed]
  13. Bray, N.L.; Pimentel, H.; Melsted, P.; Pachter, L. Near-optimal probabilistic RNA-seq quantification. Nat. Biotechnol. 2016, 34, 525–527. [Google Scholar] [CrossRef] [PubMed]
  14. Love, M.I.; Huber, W.; Anders, S. Moderated estimation of fold change and dispersion for RNA-seq data with DESeq2. Genome Biol. 2014, 15, 550. [Google Scholar] [CrossRef] [PubMed]
  15. Molina, A.; Dettleff, P.; Valenzuela-Muñoz, V.; Gallardo-Escarate, C.; Valdés, J.A. High-Temperature Stress Induces Autophagy in Rainbow Trout Skeletal Muscle. Fishes 2023, 8, 303. [Google Scholar] [CrossRef]
  16. Wang, H.; La Russa, M.; Qi, L.S. CRISPR/Cas9 in Genome Editing and Beyond. Annu. Rev. Biochem. 2016, 85, 227–264. [Google Scholar] [CrossRef] [PubMed]
  17. Gebre, M.; Nomburg, J.L.; Gewurz, B.E. CRISPR-Cas9 Genetic Analysis of Virus-Host Interactions. Viruses 2018, 10, 55. [Google Scholar] [CrossRef] [PubMed]
  18. Huang, S.; Zhang, Q.M.; Zhao, M.Y.; Wang, X.; Zhang, Y.L.; Gan, B.Y.; Zhang, P.J. The deubiquitinase ZRANB1 is an E3 ubiquitin ligase for SLC7A11 and regulates ferroptotic resistance. J. Cell Biol. 2023, 222, e202212072. [Google Scholar] [CrossRef] [PubMed]
  19. Burgess, D.J. Genetic screens: Combining CRISPR perturbations and RNA-seq. Nat. Rev. Genet. 2017, 18, 67. [Google Scholar] [CrossRef] [PubMed]
  20. Lee, L.E.; Dayeh, V.R.; Schirmer, K.; Bols, N.C. Applications and potential uses of fish gill cell lines: Examples with RTgill-W1. In vitro cellular & developmental biology. Animal 2009, 45, 127–134. [Google Scholar] [CrossRef]
  21. Levican-Asenjo, J.; Soto-Rifo, R.; Aguayo, F.; Gaggero, A.; Leon, O. Salmon cells SHK-1 internalize infectious pancreatic necrosis virus by macropinocytosis. J. Fish Dis. 2019, 42, 1035–1046. [Google Scholar] [CrossRef]
  22. Leal, Y.; Valenzuela-Muñoz, V.; Gallardo-Escárate, C. Alternative splicing in Atlantic salmon head kidney and SHK-1 cell line during the Piscirickettsia salmonis infection: A comparative transcriptome survey. Fish Shellfish Immunol. 2023, 142, 109127. [Google Scholar] [CrossRef] [PubMed]
  23. Leal, Y.; Valenzuela-Munoz, V.; Casuso, A.; Benavente, B.P.; Gallardo-Escarate, C. Comparative Transcriptomics in Atlantic Salmon Head Kidney and SHK-1 Cell Line Exposed to the Sea Louse Cr-Cathepsin. Genes 2023, 14, 905. [Google Scholar] [CrossRef] [PubMed]
  24. Diaz, R.; Troncoso, J.; Jakob, E.; Skugor, S. Limiting access to iron decreases infection of Atlantic salmon SHK-1 cells with bacterium Piscirickettsia salmonis. BMC Vet. Res. 2021, 17, 155. [Google Scholar] [CrossRef] [PubMed]
  25. Gervais, O.; Penaloza, C.; Gratacap, R.; Papadopoulou, A.; Beltran, M.; Henderson, N.C.; Houston, R.D.; Hassan, M.A.; Robledo, D. Understanding host response to infectious salmon anaemia virus in an Atlantic salmon cell line using single-cell RNA sequencing. BMC Genom. 2023, 24, 161. [Google Scholar] [CrossRef] [PubMed]
  26. van der Wal, Y.A.; Nordli, H.; Akandwanaho, A.; Greiner-Tollersrud, L.; Kool, J.; Jorgensen, J.B. CRISPR-Cas- induced IRF3 and MAVS knockouts in a salmonid cell line disrupt PRR signaling and affect viral replication. Front. Immunol. 2023, 14, 1214912. [Google Scholar] [CrossRef] [PubMed]
  27. Edvardsen, R.B.; Leininger, S.; Kleppe, L.; Skaftnesmo, K.O.; Wargelius, A. Targeted mutagenesis in Atlantic salmon (Salmo salar L.) using the CRISPR/Cas9 system induces complete knockout individuals in the F0 generation. PLoS ONE 2014, 9, e108622. [Google Scholar] [CrossRef] [PubMed]
  28. Datsomor, A.K.; Zic, N.; Li, K.; Olsen, R.E.; Jin, Y.; Vik, J.O.; Edvardsen, R.B.; Grammes, F.; Wargelius, A.; Winge, P. CRISPR/Cas9-mediated ablation of elovl2 in Atlantic salmon (Salmo salar L.) inhibits elongation of polyunsaturated fatty acids and induces Srebp-1 and target genes. Sci. Rep. 2019, 9, 7533. [Google Scholar] [CrossRef] [PubMed]
  29. Gutasi, A.; Hammer, S.E.; El-Matbouli, M.; Saleh, M. Review: Recent Applications of Gene Editing in Fish Species and Aquatic Medicine. Animals 2023, 13, 1250. [Google Scholar] [CrossRef] [PubMed]
  30. Puthumana, J.; Chandrababu, A.; Sarasan, M.; Joseph, V.; Singh, I.S.B. Genetic improvement in edible fish: Status, constraints, and prospects on CRISPR-based genome engineering. 3 Biotech 2024, 14, 44. [Google Scholar] [CrossRef]
  31. Gotesman, M.; Menanteau-Ledouble, S.; Saleh, M.; Bergmann, S.M.; El-Matbouli, M. A new age in AquaMedicine: Unconventional approach in studying aquatic diseases. BMC Vet. Res. 2018, 14, 178. [Google Scholar] [CrossRef]
  32. Pulgar, R.; Hodar, C.; Travisany, D.; Zuniga, A.; Dominguez, C.; Maass, A.; Gonzalez, M.; Cambiazo, V. Transcriptional response of Atlantic salmon families to Piscirickettsia salmonis infection highlights the relevance of the iron-deprivation defence system. BMC Genom. 2015, 16, 495. [Google Scholar] [CrossRef] [PubMed]
  33. Dettleff, P.; Bravo, C.; Patel, A.; Martinez, V. Patterns of Piscirickettsia salmonis load in susceptible and resistant families of Salmo salar. Fish Shellfish Immunol. 2015, 45, 67–71. [Google Scholar] [CrossRef] [PubMed]
  34. Agapito-Tenfen, S.Z.; Okoli, A.S.; Bernstein, M.J.; Wikmark, O.G.; Myhr, A.I. Revisiting Risk Governance of GM Plants: The Need to Consider New and Emerging Gene-Editing Techniques. Front. Plant Sci. 2018, 9, 1874. [Google Scholar] [CrossRef] [PubMed]
  35. Okoli, A.S.; Blix, T.; Myhr, A.I.; Xu, W.; Xu, X. Sustainable use of CRISPR/Cas in fish aquaculture: The biosafety perspective. Transgenic Res. 2022, 31, 1–21. [Google Scholar] [CrossRef] [PubMed]
  36. Al-Khayyat, W.; Pirkkanen, J.; Dougherty, J.; Laframboise, T.; Dickinson, N.; Khaper, N.; Lees, S.J.; Mendonca, M.S.; Boreham, D.R.; Tai, T.C.; et al. Overexpression of FRA1 (FOSL1) Leads to Global Transcriptional Perturbations, Reduced Cellular Adhesion and Altered Cell Cycle Progression. Cells 2023, 12, 2344. [Google Scholar] [CrossRef]
  37. Cui, R.; Choi, S.E.; Kim, T.H.; Lee, H.J.; Lee, S.J.; Kang, Y.; Jeon, J.Y.; Kim, H.J.; Lee, K.W. Iron overload by transferrin receptor protein 1 regulation plays an important role in palmitate-induced insulin resistance in human skeletal muscle cells. FASEB J. 2019, 33, 1771–1786. [Google Scholar] [CrossRef] [PubMed]
  38. Pan, Q.; Luo, Y.; Xia, Q.; He, K. Ferroptosis and Liver Fibrosis. Int. J. Med. Sci. 2021, 18, 3361–3366. [Google Scholar] [CrossRef] [PubMed] [PubMed Central]
  39. Howell, J.; Manning, B. mTOR couples cellular nutrient sensing to organismal metabolic homeostasis. Trends Endocrinol. Metab. 2011, 22, 94–102. [Google Scholar] [CrossRef]
  40. Bayeva, M.; Khechaduri, A.; Puig, S.; Chang, H.C.; Patial, S.; Blackshear, P.J.; Ardehali, H. mTOR regulates cellular iron homeostasis through tristetraprolin. Cell Metab. 2012, 16, 645–657. [Google Scholar] [CrossRef] [PubMed] [PubMed Central]
  41. Nakatsu, F.; Hase, K.; Ohno, H. The Role of the Clathrin Adaptor AP-1: Polarized Sorting and Beyond. Membranes 2014, 4, 747–763. [Google Scholar] [CrossRef]
  42. Promchan, K.; Natarajan, V. Leucine zipper transcription factor-like 1 binds adaptor protein complex-1 and 2 and participates in trafficking of transferrin receptor 1. PLoS ONE 2020, 15, e0226298. [Google Scholar] [CrossRef] [PubMed]
  43. Valenzuela-Muñoz, V.; Valenzuela-Miranda, D.; Gonçalves, A.T.; Novoa, B.; Figueras, A.; Gallardo-Escárate, C. Induced iron overdose modulate the immune response in Atlantic salmon increasing the susceptibility to Piscirickettsia salmonis infection. Aquaculture 2020, 521, 735058. [Google Scholar] [CrossRef]
  44. Pantopoulos, K. Iron metabolism and the IRE/IRP regulatory system: An update. Ann. N. Y. Acad. Sci. 2004, 1012, 1–13. [Google Scholar] [CrossRef] [PubMed]
Figure 1. Efficient editing of tfa and tf2 genes in SHK-1 cells using TIII and TVIII gRNA-Cas9 RNP electroporation. (A) Schematic diagram of CRISPR-Cas9 target sites in tfa and tf2 genes. (B) Representative chromatogram of the Sanger sequencing for the target region of the tfa and tf2 genes in SHK-1 cells. The black underlined region indicates the guide sequence, and the red dotted line indicates the PAM site. The vertical black dotted line represents the cut site.
Fishes 09 00198 g001
Figure 2. Expression level of transferrin-related transcripts in SHK-1 cell lines of Salmo salar. The heatmap plot presents the expression level of transferrin (tfa), transferrin receptor 1b (tfr1b), transferrin receptor 2 (tfr2), and transferrin receptor 1a (tfr1a) in C, TIII, and TVIII groups. The numbers 1 to 6 indicate the sample library of each group.
Fishes 09 00198 g002
Figure 3. Heat map of differentially expressed transcripts between C and TIII groups of SHK-1 cell lines of Salmo salar. The heatmap plot presents the differentially expressed transcripts between C and TIII groups by Deseq2 analysis (adjusted p-value < 0.05 and absolute log2 fold change > 1). Lateral colored bars represent a cluster of transcripts according to the expression pattern.
Fishes 09 00198 g003
Figure 4. Heat map of differentially expressed transcripts between C and TVIII groups of SHK-1 cell lines of Salmo salar. The heatmap plot presents the differentially expressed transcripts between C and TVIII groups by Deseq2 analysis (adjusted p-value < 0.05 and absolute log2 fold change > 1). Lateral colored bars represent a cluster of transcripts according to the expression pattern.
Fishes 09 00198 g004
Figure 5. Heat map of differentially expressed transcripts between TIII and TVIII groups of SHK-1 cell lines of Salmo salar. The heatmap plot presents the differentially expressed transcripts between TIII and TVIII groups by Deseq2 analysis (adjusted p-value < 0.05 and absolute log2 fold change > 1). Lateral colored bars represent a cluster of transcripts according to the expression pattern.
Fishes 09 00198 g005
Figure 6. Venn diagram of differentially expressed transcripts by Deseq2 analysis in SHK-1 cell lines of Salmo salar. The Venn diagram presents the number of differentially expressed transcripts down-regulated (A) and up-regulated (B) between the comparison of C-TIII, C-TVIII, and TIII-TVIII groups.
Fishes 09 00198 g006
Table 1. Guide RNA sequences (TIII and TVIII), genomic region, and primers used for PCR amplification and sequencing of tfa and tf2.
TargetcrRNA Sequences
(5′−3′)
Primers (5′−3′)Size (bp)Tm (°C)Exon
tfa TIIIACGGAGGGTTTTGAACCCAATGAATCTGGTTTCTGAACTC
GGTTTGAGATGTTGATTATTACGC
329604
tfa TVIIICCTGCAGCCCATCATTGCAGGACTTGTCACTTCTGACTTGTGC
GAGTTCAGAAACCAGATTCA
1009603
tf2 TVIIICCTGCAGCCCATCATTGCAGGTGACTTTTGTCATTTCTGACGTG
GCGTTCAGAAACCAGATTCA
938643
Table 2. Statistics of pair-end sequencing, filtering, and mapping of libraries of SHK-1 cell lines against Salmo salar reference genome.
SampleRaw ReadsFiltered ReadsBoth Surviving (%)Mapped ReadsMapping (%)
C123,439,29822,614,43696.519,223,08385.0
C239,584,46338,460,04197.232,153,76883.6
TIII326,389,30625,592,50097.021,340,47083.4
TIII430,249,72728,892,10895.524,562,93485.0
TVIII531,496,92730,214,48095.925,884,88185.7
TVIII629,231,09028,113,52896.223,513,44983.6
Average30,065,135289,81,18296.4244,46,43084.4
Total180,390,811173,887,093 146,678,585
Table 3. Enriched GO terms in differentially expressed transcripts between C and TIII groups in the SHK-1 cell line.
CategoryTermp-ValueFold Enrichment
BPL-lysine catabolic process to acetyl-CoA via saccharopine0.013148.2
BPPositive regulation of transcription. DNA-templated0.01913.7
BPUbiquitin-dependent protein catabolic process0.0236.4
CCNucleus0.00212
CCKinesin complex0.03850.5
CCCytoplasm0.0441.8
MFDNA binding0.0372.2
MFHistone binding0.0448.8
Table 4. Enriched GO terms in differentially expressed transcripts between C and TVIII groups in the SHK-1 cell line.
CategoryTermp-ValueFold Enrichment
BPCilium assembly0.0369.9
CCNucleus0.00351.8
CCCytoplasm0.00412
CCAP-1 adaptor complex0.04147.7
CCMicrotubule organizing center0.0439
MFProtein serine/threonine/tyrosine kinase activity0.0353.3
MFGamma-tubulin binding0.03752.1
MFRNA binding0.0482.4
Table 5. Enriched GO terms in differentially expressed transcripts between TIII and TVIII groups in the SHK-1 cell line.
CategoryTermp-ValueFold Enrichment
BPPositive regulation of GTPase activity0.058.3
CCCytoplasm0.00861.9
CCAP-1 adaptor complex0.03851.7
MFRNA binding0.00193.3
MFGamma-tubulin binding0.03851.6
Disclaimer/Publisher’s Note: The statements, opinions and data contained in all publications are solely those of the individual author(s) and contributor(s) and not of MDPI and/or the editor(s). MDPI and/or the editor(s) disclaim responsibility for any injury to people or property resulting from any ideas, methods, instructions or products referred to in the content.

