Abstract
As the largest lake in South China, Wanlv Lake is also an important drinking water source for Guangdong and Hong Kong and is responsible for water supplying of more than 40 million people in the Guangdong-Hong Kong-Macao Greater Bay Area. The study of fish diversity in Wanlv Lake can help us to effectively understand the changes and states of its aquatic ecosystem and provide scientific basis for natural ecological protection, biodiversity, sustainable use and scientific management of fishery resources. However, research on the lake’s fish is scarce. The high throughput environmental DNA metabarcoding technology (eDNA technology) of the mitochondrial 12S rRNA gene sequence was herein used to conduct a preliminary exploration of Wanlv Lake fish diversity. A total of 10 sampling sites were set up to monitor fish diversity and analyze the composition and richness of the species. The results revealed a total of 83 genera in 42 families and 17 orders of fish in the lake, with the highest proportion found in Cypriniformes (38 species), accounting for 45.24% of the total. Five alien species and eight rare and endangered species were also detected. The proportion of invasive species was 5.95%, and the combined proportion of rare and endangered species was 9.52%. The results indicated that Wanlv Lake serves as an important drinking water source, and overall, the condition of fish is satisfactory. However, proactive measures should be implemented to control the overpopulation of invasive species, as their unchecked proliferation may lead to a decline in species abundance, particularly among endangered species. This was the first overall assessment report on fish of the Wanlv Lake via 12S rRNA; the results herein lay a foundation for water quality assessment of Wanlv Lake as a drinking water source.
Key Contribution:
Wanlv Lake is an important source of drinking water for Guangdong, Hong Kong and Macao, and there are few studies on the status of water quality resources and the status of fish organisms. We herein firstly reported 83 genera of fish detected in the Lake via eDNA technology. Among which, five invasive species and eight endangered animals, including some national-level protected animals, were reported. The analysis of fish diversity and community composition lays a foundation for the assessment of water quality resources and the protection and management of the lake.
1. Introduction
Wanlv Lake belongs to the Dongjiang River system and is the largest lake in South China, with more than 360 green islands, a water area as 370 square kilometers, a storage capacity of about 13.9 billion cubic meters and an average depth of 30 m. It also serves as a crucial source of drinking water for the Guangdong-Hong Kong-Macao Greater Bay Area, supporting more than 40 million people across Guangdong, Hong Kong and Macao. Therefore, the ecological and environmental protection, water quality maintenance and sustainable utilization of fishery resources of Wanlv Lake are of great significance. China has implemented the policy of banning the cultivation of reservoirs in recent years, and the water quality and ecological environment of reservoirs around the country have been greatly improved. But studies on the status of water quality resources and the biological condition of fish in Wanlv Lake are scarce. Aquatic biological resources are not only an important part of the aquatic ecosystem but are also the material basis for fisheries development. Fish are an important embodiment and undertaker of the ecological environment of water bodies, and fish diversity is a key indicator for monitoring the health of aquatic ecosystems [1]. Fish communities have been widely used as biological indicators to quantify and assess the degree of degradation and health status of rivers and streams [2]. Accurate assessment of fish species diversity and community composition is essential for understanding fish ecology and conservation management [3].
Traditional fisheries resource assessment methods, such as netting, cage fishing and electric fishing, have been used for routine fisheries monitoring [4], but frequently necessitate the use of invasive sampling techniques, which can be disruptive when studying biomes [5] and contrary to the original purpose of biodiversity conservation [3]. Moreover, these methods are often time-consuming, costly, limited in access and environmentally unfriendly. On the other hand, appearance-based species classification not only requires professional taxonomic knowledge but is also prone to misclassification. More importantly, traditional fishery assessment methods may miss essential data needed for fisheries management in some cases. eDNA has been shown to be a fast and effective tool in fish monitoring and management for species detection abundance estimation and biodiversity assessment [6]. The technique can simultaneously identify multiple fish species from a single water sample and estimate the relative abundance of fish species based on sequence counts [7]. Moreover, it is more sensitive than traditional survey methods [8]. Therefore, eDNA metabarcoding has a high application value in the monitoring of lakes, rivers, reservoirs and other water areas. Non-invasive, accurate, effective and environmentally friendly eDNA metabarcoding methods have been increasingly used to investigate environmental resources in recent years [4].
An increasing number of studies have shown that the amount of eDNA is not only related to the presence of a species but also to its abundance [9,10]. Previous studies have confirmed a positive correlation between eDNA and biomass in various aquatic environments [11], including ponds, lakes, rivers, streams and oceans [10,12,13]. eDNA metabarcoding can rapidly and accurately detect the range and quantity distribution of certain endangered species. In some instance, eDNA detection may be more sensitive than traditional methods for assessing the range and quantity distribution of these species. For sensitive ecological environments such as nature reserves and wetlands, eDNA can also realize non-destructive monitoring, reduce the interference of sample collection on the ecological environment and provide reliable data support for subsequent field investigation and protection. The eDNA approach has been employed in studying the reproductive migration of fish [14,15], monitoring spatiotemporal changes in fish communities in both freshwater and marine systems [16,17,18,19,20,21] and conducting lake fish surveys. These applications provide crucial information for local biodiversity conservation and invasive species management [22,23,24].
The 12S genetic markers have higher species coverage and detection than Cyt b and COI [25]. For example, Zhang et al. compared 22 pairs of universal primers of bony fish with the Silico PCR method and used them in the PCR amplification of river water samples in Beijing, and found that primers in the 12S rRNA segment could monitor fish diversity better than primers in other gene segments [3]. In addition, Shu et al. also confirmed the above views [26]. Therefore, we herein used the short sequence of 12S rRNA gene as a marker for fish species in Wanlv Lake, and the high throughput metabarcoding technology was used to conduct a preliminary exploration of fish diversity composition. The study represents the first comprehensive assessment report on the fish of Wanlv Lake using 12S rRNA, providing essential data support for biodiversity conservation in the lake. Additionally, it offers a valuable reference for the resource survey of other aquatic species.
2. Materials and Methods
2.1. Sampling Locations and Environmental DNA Sample Collection
A total of 10 sites were surveyed across the Wanlv Lake in October 2022 (Figure 1). A total of 1 L of near-surface water samples was collected at each site using a sterile water collector. Three replicate samples were collected, stored in sterile plastic bottles and transported back to the laboratory. The water sample was vacuum-filtered using a nitrate fiber filter membrane with a diameter of 47 mm and an aperture of 0.45 μm [27]. Each filter membrane filters the water sample from one sampling point (three replicates of one sampling point were used for filtration using three membranes) and filters the corresponding negative control at the same time. After filtration, they are respectively loaded into sterile frozen storage tubes. The filter membrane was stored in a 2 mL sterilized centrifuge tube and frozen at −80 °C until DNA extraction.
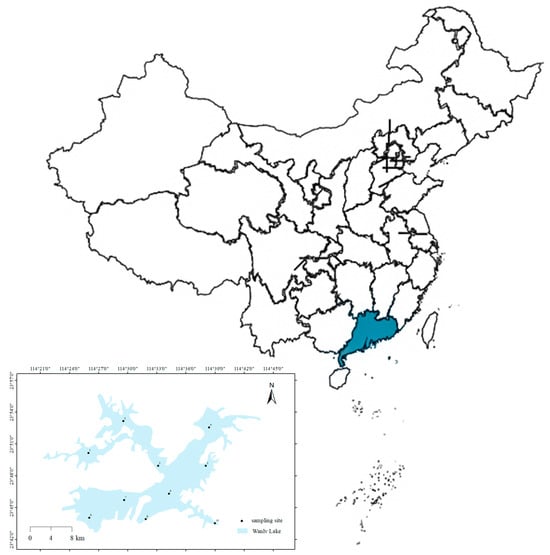
Figure 1.
Distribution of Wanlv Lake sampling points.
2.2. DNA Extraction and PCR Amplification
To control contamination during DNA extraction, a blank filter was included in each set of extracts and all eDNA extracts were stored at −20 °C. The DNeasy Blood and Tissue kit from QIAGEN was utilized for eDNA preparation [27], and the “Teleo02” primer pair was employed for PCR amplification. The forward primer sequence was 5′-AAACTCGTGCCAGCCACC-3′, and the reverse primer sequence was 5′-GGGTATCTAATCCCAGTTTG-3′ [28], targeting fragments with a length ranging from 129 bp to 209 bp. The total amplification system was set as 25 μL including 5 × reaction buffer 5 μL, 5 × GC buffer 5 μL, dNTP (2.5 mM) 2 μL, 1 μL each of upstream and downstream primers, DNA template 2 μL, ddH2O 8.75 μL and Q5 DNA Polymerase 0.25 μL. The amplification conditions were set as follows: pre-denaturation at 98 °C for 2 min, denaturation at 98 °C for 15 s, annealing at 55 °C for 30 s, extension at 72 °C for 30 s and a final extension at 72 °C for 5 min; the total number of cycles was set at 30. The average length of the final amplification was 180 bp. Each PCR blank uses 1 µL ddH2O as a template to ensure that there is no contamination during the PCR process. PCR products were detected with 2% agarose gel electrophoresis and purified using a DNA purification kit (magnetic Vazyme VAHTSTM DNA Clean Beads). Since no target DNA was amplified from the negative control, no further analysis of the negative control was performed.
The PCR products were quantified with fluorescence using the Quant-I T Pico Green dsDNA Assay Kit and a Microplate reader (Bio-Tek Instruments, Inc., Winooski, VT, USA, FLx800). Sequencing library construction was performed using the NEB Next Fast DNA Library Prep Set for Ion Torrent 114 kit (E6270) [1]. The quality of the constructed libraries was assessed by gel electrophoresis and quantified using the Quant-I T Pico Green dsDNA Assay Kit on a Promega Quant I Fluor fluorescence quantification system.
2.3. High throughput Sequencing and Bioinformatics Analysis
The Illumina Mi Seq sequencer (Illumina Guangzhou Ruijie Biological Technology Co., LTD, Guangzhou, China) [29] for double-end (Paired-end) sequencing of community DNA fragments was used [30]. The raw data was saved in FASTQ format. The quality of the original reads was assessed using FastQC method [31] with the tails of low quality (Phred score < 20 by default) pruned. QIIME2 dada2 software was used to remove primers, splicing, quality filtering, de-weighting, de-chimerism, clustering and other steps of the original sequencing data [32,33]. The fastq_filter module was used to control the quality of the splicing sequence. The cluster_size module was used to cluster high-quality sequences at 97% similarity level [34]. The OTUs were then classified with NCBI GenBank database via BLAST [35]. Only the Operational Taxonomic Units (OTUs) with BLAST results showing ≥97% similarity were used for further analysis. To avoid sequencing errors, annotated sequences with less than 0.3% of read counts in each sample were discarded [18,36]. The bar histogram was plotted using the bar function in the basic package in Rv3.5.3 [37].
2.4. Fish Abundance and Biodiversity Analysis
The intra-community diversity (α diversity) and inter-community diversity (β diversity) were used for the evaluation of the community structure of fish in Wanlv Lake. The Shannon, Simpson and Chao1 indices [38,39,40] were calculated to determine the level of alpha diversity. QIIME2 software was used to conduct non-metric multidimensional scaling analysis (NMDS) to characterize the spatial and temporal distribution pattern of fish community structure. Stress coefficient was used to measure the reliability of NMDS results, and principal coordinates analysis (PcoA) was used to test the differences in fish community structure.
3. Results
3.1. High throughput Sequencing Results
After removing primer fragments and conducting OTU clustering, the quantity of clean sequence data for each sample was counted and the length distribution of high-quality sequences in all samples is analyzed, as shown in Table 1, Figure 2.

Table 1.
Statistical table of Wanlv Lake samples’ sequence data.
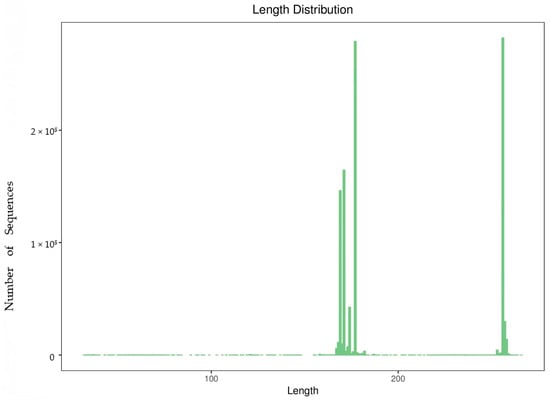
Figure 2.
Sequence length distribution diagram.
3.2. Wanlv Lake eDNA Species Annotation
The identified taxonomy results via BLAST to the NCBI GenBank database were statistically analyzed to show the annotation of species as shown in Table 2. It can intuitively compare the OTUs of different samples and the difference of classification status identification results.
Table 2.
Statistical table of the annotated results of species taxonomy in Wanlv Lake.
3.3. Fish Distribution in Wanlv Lake
The composition of the top twenty dominant species at each locality at the taxonomic level of order, family and genus were plotted as separate histograms (Figure 3a–c). At the genus level, the results showed that sampling sites 1, 2, 3, 7, 8, 9 and 10 had the largest proportion of the genus Ctenopharyngodon, with site 7 having the largest proportion; meanwhile, sampling sites 4, 5 and 6 had a large proportion of the genus Cirrhinus, with site 4 having the largest proportion (Figure 3a). At the family level, the results showed that sampling sites 1, 2, 3 and 4 had large proportions of the number of the family Lutjanidae, while the remaining sampling site had a large proportion of the family Cyprinidae (Figure 3b). At the genus level, the results showed that the Perciformes were the dominant species group at sampling sites 1, 2, 3 and 4, while the Cypriniformes were the dominant species group at the remaining sites (Figure 3c).
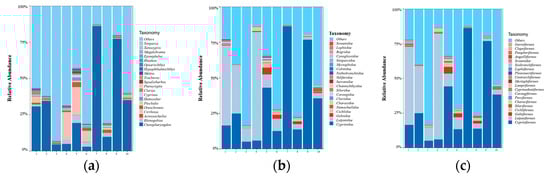
Figure 3.
Histogram of fish species composition at the order, family, and genus levels in Wanlv Lake ((a) genus level; (b) family level; (c) order level).
3.4. Analysis of Alpha Diversity of Fish in Wanlv Lake
3.4.1. Alpha Diversity Indexes
The Chaol index analysis for fish at each sampling site in Wanlv Lake showed that the lowest number of OTUs (1002.53) was observed at site 5 and the highest number of OTUs (1201.55) was observed at site 10; the Shannon index analysis showed that the highest community diversity was observed at site 10, while the lowest was found at site 6, which was consistent with the trend of Simpson’s index. Other community diversities of different sites were among the region of the highest and lowest distribution (Table 3). The results indicate that the diversity of fish communities varied among the different sampling sites.
Table 3.
Fish alpha diversity index for Lake Wanlv.
3.4.2. Species Accumulation Curve Analysis
The number of OTUs observed tends to stabilize as the sequencing depth increases, indicating that the number of eDNA samples is sufficient to reflect the fish diversity of Wanlv Lake. The species accumulation curves of the Wanlv Lake eDNA samples are shown in Figure 4.
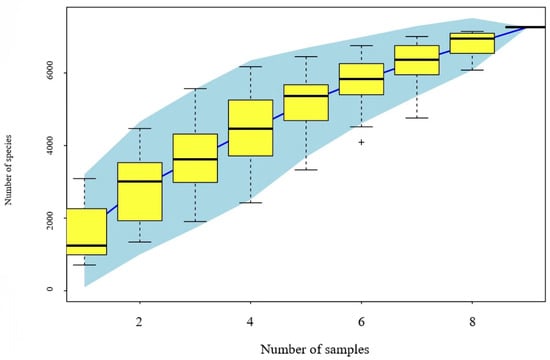
Figure 4.
Species accumulation curve of eDNA samples from Wanlv Lake. Note: The horizontal coordinate is the sample size, the vertical coordinate is the number of observed species (OTUs), and the blue shading reflects the confidence interval of the curve. The results reflect the rate of increase in new species observed when the sample size is continuously expanded over the course of sampling the sample population.
3.5. Analysis of Beta Diversity of Fish in Wanlv Lake
With the Bray–Curtis distance matrix, the similarity or difference in fish species composition between samples was compared based on sequence abundance at each sampling site. For this, six sampling sites with many dominant fish species were selected. Sampling sites 1, 3 and 6 had similar fish species diversity, while sampling sites 2, 4 and 5 had different fish composition from other sampling sites. PCoA (Figure 5a) and NMDS (Figure 5b) analyses showed that there were certain differences and similarity in the composition of fish community at different sampling sites.
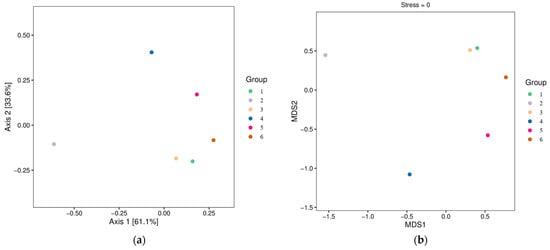
Figure 5.
PCoA (a) and NMDS (b) analyses.
3.6. Analysis of Fish Diversity in Wanlv Lake
A total of 36 species of fish were detected in Wanlv Lake based on eDNA, belonging to 6 orders, 15 families and 36 genera (Table 4, Table S1 Supplemental Material). In terms of the composition of the fish fauna, at the order level, the order of Cypriniformes had the highest number of species, with 20 species, accounting for 55.56% of the total number of fish species, which was followed by Perciformes order with 10 species, accounting for 27.78%, and Siluriformes order with 3 species, accounting for 8.33%. Other orders including Synbranchiformes, Clupeiformes and Myctophiformes, had the lowest number of species, each including only one species, accounting for 2.78%, respectively (Figure 6a). At the family level, Cyprinidae family had the highest number of species with 20 species, accounting for 55.56% of the total number of species, which was followed by Carangidae family and Siluridae family with 2 species each, accounting for 5.56%, and other families including Synbranchidae, Percichthyidae, Serranidae, etc., having only 1 species each, accounting for 2.78%, respectively (Figure 6b). A heatmap of species distribution between sampling sites provides a more direct view of the number and dominant fish distribution at each site (Figure 7).
Table 4.
List of fish species in Wanlv Lake.
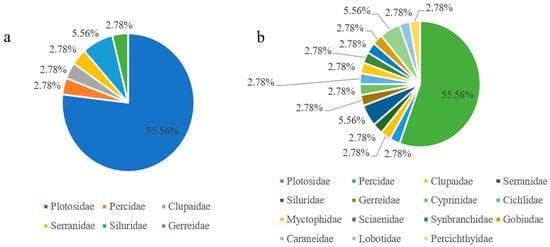
Figure 6.
Fish species composition at the order and family level in Wanlv Lake ((a) order level; (b) family level).
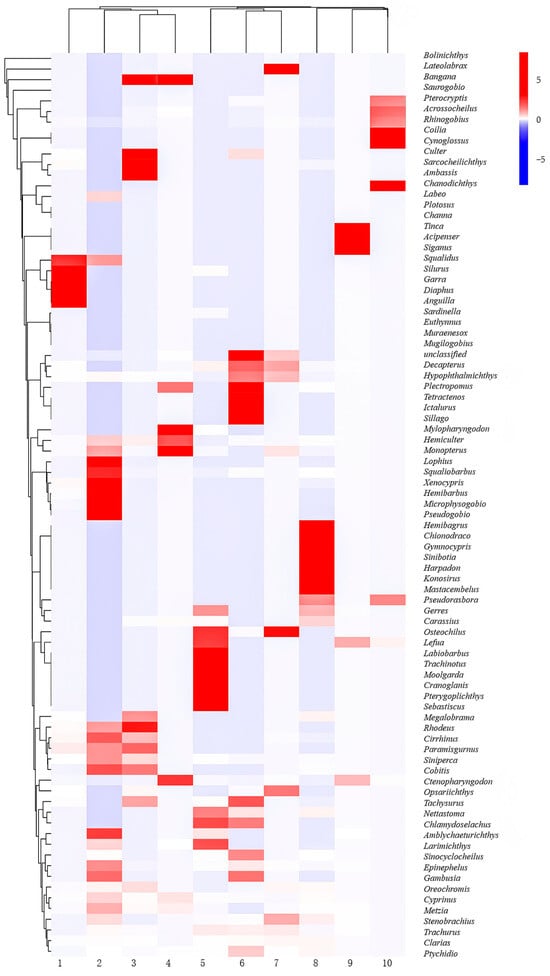
Figure 7.
Thermal map of fish distribution in Wanlv Lake.
4. Discussion
4.1. Status of Fish Diversity in Lake Wanlv
Aquatic biological resources can reflect the health of aquatic ecosystem, providing the material basis for fisheries development. Fish diversity serves as a biological indicator to quantify and assess the water’s ecological environment [1]. The Wanlv Lake is the largest lake in South China and serves as an important drinking water source for the Guangdong-Hong Kong-Macao Greater Bay Area, providing water to more than 40 million people. The assessment of water ecological quality is, therefore, of great significance. However, research on the lake is scarce. We herein firstly reported the fish diversity of the lake via 12S rRNA to quantify and assess water ecological environment and fisheries development.
In this study, a total of 17 orders, 42 families and 83 genera were detected by eDNA metabarcoding technology in Wanlv Lake. Due to sequence limitation (the Illumina Mi Seq sequencer we use has a short sequencing time and fast speed, but the disadvantage is that the length of the sequenced fragments is short, so some specific species and genera may not be identified in the sequencing process) [41,42] and the lack of accurate species information of GenBank database [43], as well as the limitation of the sequencing read length, some specific species and genera cannot be identified. Therefore, not all feature sequences can be annotated at the species and genus level during the actual analysis, which were then ranged to the unclassified database.
Dongjiang River is one of the three major rivers in the Pearl River system of South China, with the Wanlv Lake belonging to a tributary of the middle reaches. Relevant literature has mentioned that the Pterygoplichthys spp. has established a self-sustaining species group in the Pearl River, including Amazon Sailfin Catfish and Vermiculated Sailfin Catfish (P. disjunctivus), as well as the hybrids of these two species [44]. The detection of these three species can provide evidence that the fish have spread along the river system.
Most species monitored in Wanlv Lake were Cypriniformes, and the dominant species were Ctenopharyngodon and Cirrhinus. Five exotic species were monitored, including pterygoplichthys spp., Oreochromis mossambicus, Clarias gariepinus, Ictalurus punctatus and Gambusia affinis. Gratifyingly, eight rare and endangered species were detected, including Acipenser sinensis, Anguilla japonica, Cranoglanis bouderius, Ptychidio macrops, Pseudorasbora elongate, Squalidus minor, Gymnocypris potanini and Sinocyclocheilus. According to the Red List of Vertebrates classification of endangerment, there are three vulnerable species, including Acipenser sinensis, Cranoglanis bouderius and Pseudorasbora elongata. Among them, the Acipenser sinensis is a national Class I protected wild animal in China and assessed as critically endangered on the IUCN Red List of Threatened Species (IUCN) [45]. Furthermore, there were five endangered species, namely Sinocyclocheilus, Ptychidio macrops, Squalidus minor, Gymnocypris potanini and Anguilla japonica. while the Sinocyclocheilus and Anguilla japonica are Class II protected wild animals.
4.2. Analysis of Alpha and Beta Diversity of Fish in Wanlv Lake
Chao1 index is used to estimate the number of OTUs in a community, which can reflect the total number of species in an ecosystem [2]. In this study, the Chao1 index ranges from 1002.53 to 1201.55, respectively, with large differences among samples, especially in sites 5 and 6. The S6 station is close to the east Longfeng Island, near the Wanlv Lake Moon Bay tourist area, close to the shore, and the water depth is shallower than other stations. The chlorophyll concentration is higher than the far bank station and the composition of fish species is slightly different from other stations. It may be due to the differences in sampling sites. The Shannon and Simpson indices were used to estimate biodiversity in samples and commonly used to quantitatively describe biodiversity within an area [39,40]. In this study, the Shannon and Simpson indexes ranged from 5.78 to 7.03 and from 0.61 to 0.98, respectively, with similar distribution ranges and trends. The results showed that the number of species at each site was similar, with no significant differences observed.
PCoA and NMDS analysis showed that there were significant differences between sites 2 and 4, possibly because the river at site 2 came from the tributaries of Xinfengjiang Reservoir, while sampling point 4 was formed by the confluence of other tributaries; therefore, different geographical locations resulted in the local changes of plants and plankton, which further resulted in different distribution of fish.
4.3. Monitoring and Protection of Invasive Species in Wanv Lake
The invasion of non-native species is considered one of the major threats to global ecosystem functions and services [46], as these species are known for being highly competitive and often result in changes to habitat or resource use by local residents [47]. The abundance of exotic fish sequences from this survey suggests that Gambusia affinis were likely to have formed stable populations in Wanlv Lake. Meanwhile, others, including O. mossambicus, C. gariepinus and I. punctatus, were likely to be occasional species resulting from farm escapes or release activities [48]. Exotic fish will crowd out the living environment of indigenous fish, affecting the survival and reproduction of other species [29]. G. affinis prey on zooplankton in large numbers [46], causing phytoplankton to proliferate and leading to a decline in water quality. However, a review of the data revealed that the water quality of Wanlv Lake was at Class I standard year-round, indicating that the number of G. affinis was low. Nonetheless, due to their competitive impact on native species [49,50] and their high attack frequency and feeding rate [50], G. affinis may affect the survival and reproduction of other species, potentially leading to the extinction of native species. Therefore, continuous monitoring of G. affinis over time is advisable. The relevant departments should enhance the management of aquaculture to prevent and control the invasion of alien species, reduce the incidence of aquaculture escapes and actively promote awareness of the ecological harm caused by alien species to enhance the public’s understanding of ecological security.
4.4. eDNA Method Can Be Used as the First Choice for Long-Term Monitoring of Important Water Sources
In the context of global change, the decline of biodiversity is one of the major challenges facing humanity in the 21st century [51], and fish diversity as an important component of biodiversity is also in recession [52,53], as the decline of fish diversity is also threatening aquatic ecosystem functions, fisheries economies and human livelihoods [54]. Therefore, biodiversity monitoring is becoming more and more important [55]. In addition, protecting ecosystems from the degradation caused by invasive species can help protect species at risk and in critical habitats.
DNA metabarcoding is a suitable tool for the analysis and monitoring of large scale pooled samples, as it is capable of generating and detecting millions of DNA reads, thus allowing simultaneous species identification and analysis [34]. In addition, compared with traditional biological monitoring methods, uncaught fish can be found in traditional monitoring with high sensitivity, and can be used for rare and endangered species or invasive species research or early warning [56,57]. The fish we tested this time included some endangered and rare species, such as G. affinis. From the results of the investigation of Wanlv Lake, it is clear that environmental DNA metabarcoding has the potential to contribute to the study of biodiversity and ecosystem function. Therefore, environmental DNA metabarcoding technology can be used as the first choice for long-term monitoring of the ecosystem of Wanlv Lake.
5. Conclusions
In this study, the preliminary monitoring of Wanlv Lake using eDNA technology showed that there were 83 species of fish, including 5 exotic species and 8 endangered species. The fish, as the core of aquatic ecosystem, not only play an important role in the ecosystem but also reflect the environmental status of the aquatic ecosystem, which is crucial for the material cycle, energy flow, self-regulation and stability of the ecosystem. Therefore, the conservation and rational use of the aquatic biological resources of Wanlv Lake is of great significance in promoting the high-quality development of fisheries and maintaining ecological security.
Supplementary Materials
The following supporting information can be downloaded at: https://www.mdpi.com/article/10.3390/fishes9030086/s1, Table S1: Fish detection at each sampling point in Wanlv Lake based on eDNA metabarcoding technology.
Author Contributions
Conceptualization, M.X., J.F. and J.W.; methodology, M.X.; validation, J.H.; investigation, D.Z. and J.W.; writing—original draft preparation, J.W. and J.F.; writing—review and editing, M.X. and J.F. All authors have read and agreed to the published version of the manuscript.
Funding
This research was funded by the provincial science and technology special fund “big special project + task list” competition merit-based projects (No. 220112231603379).
Institutional Review Board Statement
Not applicable.
Informed Consent Statement
Not applicable.
Data Availability Statement
The original contributions presented in the study are included in the article/Supplementary Material, further inquiries can be directed to the corresponding author/s.
Acknowledgments
We would like to thank all those who helped to make this project possible. Specifically, we would like to recognize YuJie Wang and KeJie Chu help with field sampling and laboratory work.
Conflicts of Interest
The authors declare no conflicts of interest.
References
- Li, H.; Yang, F.; Zhang, R.; Liu, S.; Yang, Z.; Lin, L.; Ye, S. Environmental DNA metabarcoding of fish communities in a small hydropower dam reservoir: A comparison between the eDNA approach and established fishing methods. J. Freshw. Ecol. 2022, 37, 341–362. [Google Scholar] [CrossRef]
- Rahat, M.A.R.; Roy, N.; Manon, M.R.K.; Ullah, M.R.; Islam, M.M.; Rashid, M.T.; Hasan, K.R.; Chakma, S.; Rahman, M.A. Temporal distribution of fishery resources in Payra river: Relationship with climatological changes, ecological assessment, and threat assessment. Heliyon 2022, 8, e10584. [Google Scholar] [CrossRef]
- Zhang, S.; Zhao, J.; Yao, M. A comprehensive and comparative evaluation of primers for metabarcoding edna from fish. Methods Ecol. Evol. 2020, 11, 1609–1625. [Google Scholar] [CrossRef]
- Wang, X.; Lu, G.; Zhao, L.; Yang, Q.; Gao, T. Assessment of fishery resources using environmental DNA: Small yellow croaker (Larimichthys polyactis) in east China sea. PLoS ONE 2020, 15, e244495. [Google Scholar] [CrossRef]
- Miya, M.; Gotoh, R.O.; Sado, T. MiFish metabarcoding: A high-throughput approach for simultaneous detection of multiple fish species from environmental DNA and other samples. Fish. Sci. 2020, 86, 939–970. [Google Scholar] [CrossRef]
- Coble, A.A.; Flinders, C.A.; Homyack, J.A.; Penaluna, B.E.; Cronn, R.C.; Weitemier, K. eDNA as a tool for identifying freshwater species in sustainable forestry: A critical review and potential future applications. Sci. Total Environ. 2019, 649, 1157–1170. [Google Scholar] [CrossRef]
- Ruppert, K.M.; Kline, R.J.; Rahman, M.S. Past, present, and future perspectives of environmental DNA (eDNA) metabarcoding: A systematic review in methods, monitoring, and applications of global eDNA. Glob. Ecol. Conserv. 2019, 17, e00547. [Google Scholar] [CrossRef]
- Xie, Z.G.; Ruan, G. Assessment of sensitivity and effectiveness of environmental DNA macro barcoding for monitoring fish species diversity in streams and reservoirs. Chin. Agric. Sci. Bull. 2023, 39, 157–164. (In Chinese) [Google Scholar]
- Colmenares GM, G.; Montes AJ, G.; Harms-Tuohy, C.A.; Schizas, N.V. Using eDNA sampling for species—Specific fish detection in tropical oceanic samples: Limitations and recommendations for future use. PeerJ 2023, 11, e14810. [Google Scholar] [CrossRef]
- Tillotson, M.D.; Kelly, R.P.; Duda, J.J.; Hoy, M.; Kralj, J.; Quinn, T.P. Concentrations of environmental DNA (eDNA) reflect spawning salmon abundance at fine spatial and temporal scales. Biol. Conserv. 2018, 220, 1–11. [Google Scholar] [CrossRef]
- Doi, H.; Inui, R.; Akamatsu, Y.; Kanno, K.; Yamanaka, H.; Takahara, T.; Minamoto, T. Environmental DNA analysis for estimating the abundance and biomass of stream fish. Freshw. Biol. 2017, 62, 30–39. [Google Scholar] [CrossRef]
- Westhoff, J.T.; Berkman, L.K.; Klymus, K.E.; Thompson, N.L.; Richter, C.A. A comparison of eDNA and visual survey methods for detection of longnose darter Percina nasuta in Missouri. Fishes 2022, 7, 70. [Google Scholar] [CrossRef]
- Harper, L.R.; Handley, L.L.; Hahn, C.; Boonham, N.; Rees, H.C.; Gough, K.C.; Lewis, E.; Adams, I.P.; Brotherton, P.; Phillips, S.; et al. Needle in a haystack? A comparison of eDNA metabarcoding and targeted qPCR for detection of the great crested newt (Triturus cristatus). Ecol. Evol. 2018, 8, 6330–6341. [Google Scholar] [CrossRef] [PubMed]
- Lacoursière-Roussel, A.; Dubois, Y.; Normandeau, E.; Bernatchez, L. Improving herpetological surveys in eastern north America using the environmental DNA method. Genome 2016, 59, 991–1007. [Google Scholar] [CrossRef] [PubMed]
- Kuroki, M.; Miller, M.J.; Feunteun, E.; Sasal, P.; Pikering, T.; Han, Y.-S.; Faliex, E.; Acou, A.; Dessier, A.; Schabetsberger, R.; et al. Distribution of anguillid leptocephali and possible spawning are as in the south Pacific Ocean. Prog. Oceanogr. 2020, 180, 102234. [Google Scholar] [CrossRef] [PubMed]
- Takeuchi, A.; Watanabe, S.; Yamamoto, S.; Miller, M.; Fukuba, T.; Miwa, T.; Okino, T.; Minamoto, T.; Tsukamoto, K. First use of oceanic environmental DNA to study the spawning ecology of the Japanese eel Anguilla japonica. Mar. Ecol. Prog. Ser. 2019, 609, 187–196. [Google Scholar] [CrossRef]
- Valentini, A.; Taberlet, P.; Miaud, C.; Civade, R.; Herder, J.; Thomsen, P.F.; Bellemain, E.; Besnard, A.; Coissac, E.; Boyer, F.; et al. Next-generation monitoring of aquatic biodiversity using environmental DNA metabarcoding. Mol. Ecol. 2016, 25, 929–942. [Google Scholar] [CrossRef]
- Shu, L.; Chen, S.; Li, P.; Peng, Z. Environmental DNA metabarcoding reflects fish DNA dynamics in lentic ecosystems: A case study of freshwater ponds. Fishes 2022, 7, 257. [Google Scholar] [CrossRef]
- Milhau, T.; Valentini, A.; Poulet, N.; Roset, N.; Jean, P.; Gaboriaud, C.; Dejean, T. Seasonal dynamics of riverine fish communities using eDNA. J. Fish Biol. 2021, 98, 387–398. [Google Scholar] [CrossRef]
- Sigsgaard, E.E.; Nielsen, I.B.; Carl, H.; Krag, M.A.; Knudsen, S.W.; Xing, Y.; Holm-Hansen, T.H.; Møller, P.R.; Thomsen, P.F. Seawater environmental DNA reflects seasonality of a coastal fish community. Mar. Biol. 2017, 164, 128. [Google Scholar] [CrossRef]
- Stoeckle, M.Y.; Soboleva, L.; Charlop-Powers, Z. Aquatic environmental DNA detects seasonal fish abundance and habitat preference in an urban estuary. PLoS ONE 2017, 12, e0175186. [Google Scholar] [CrossRef]
- Zhang, H.; Yoshizawa, S.; Iwasaki, W.; Xian, W. Seasonal fish assemblage structure using environmental DNA in the Yangtze estuary and its adjacent waters. Front. Mar. Sci. 2019, 6, 515. [Google Scholar] [CrossRef]
- Stat, M.; Huggett, M.J.; Bernasconi, R.; DiBattista, J.D.; Berry, T.E.; Newman, S.J.; Harvey, E.S.; Bunce, M. Ecosystem biomonitoring with eDNA: Metabarcoding across the tree of life in a tropical marine environment. Sci. Rep. 2017, 7, 12240. [Google Scholar] [CrossRef]
- Jerde, C.L.; Chadderton, W.L.; Mahon, A.R.; Renshaw, M.A.; Corush, J.; Budny, M.L.; Mysorekar, S.; Lodge, D.M. Detection of Asian carp DNA as part of a great lakes basin-wide surveillance program. Can. J. Fish. Aquat. Sci. 2013, 70, 522–526. [Google Scholar] [CrossRef]
- Civade, R.; Dejean, T.; Valentini, A.; Roset, N.; Raymond, J.-C.; Bonin, A.; Taberlet, P.; Pont, D. Spatial representativeness of environmental DNA metabarcoding signal for fish biodiversity assessment in a natural freshwater system. PLoS ONE 2016, 11, e0157366. [Google Scholar] [CrossRef] [PubMed]
- Shu, L.; Ludwig, A.; Peng, Z. Environmental DNA metabarcoding primers for freshwater fish detection and quantification: In silico and in tanks. Ecol. Evol. 2021, 11, 8281–8294. [Google Scholar] [CrossRef] [PubMed]
- Shu, L.; Ludwig, A.; Peng, Z. Standards for Methods Utilizing Environmental DNA for Detection of Fish Species. Genes 2020, 11, 296. [Google Scholar] [CrossRef] [PubMed]
- Taberlet, P.; Bonin, A.; Coissac, E.; Zinger, L. Environmental DNA: For Biodiversity Research and Monitoring; Oxford University Press: Oxford, UK, 2018. [Google Scholar]
- Guillerault, N.; Bouletreau, S.; Iribar, A.; Valentini, A.; Santoul, F. Application of DNA metabarcoding on faeces to identify European cat fish Silurus glanis diet. J. Fish Biol. 2017, 90, 2214–2219. [Google Scholar] [CrossRef] [PubMed]
- Fujii, K.; Doi, H.; Matsuoka, S.; Nagano, M.; Sato, H.; Yamanaka, H. Environmental DNA metabarcoding for fish community analysis in backwater lakes: A comparison of capture methods. PLoS ONE 2019, 14, e0210357. [Google Scholar] [CrossRef] [PubMed]
- Brown, J.; Pirrung, M.; Mccue, L.A. FQC dashboard: Integrates fastQC results into a web-based, interactive, and extensible FASTQ quality control tool. Bioinformatics 2017, 33, 3137–3139. [Google Scholar] [CrossRef] [PubMed]
- Yu, E.; Mante, J.; Myers, C.J. Sequence-based searching for SynBioHub using VSEARCH. ACS Synth. Biol. 2022, 11, 990–995. [Google Scholar] [CrossRef]
- Chen, S.; Zhou, Y.; Chen, Y.; Gu, J. Fastp: An ultra-fast all-in-one FASTQ preprocessor. Bioinformatics 2018, 34, 884–890. [Google Scholar] [CrossRef] [PubMed]
- Rijin, J.; Leonard, L.J.; Yongjiu, C. High-throughput DNA metabarcoding as an approach for ichthyoplankton survey in Oujiang river estuary, China. Diversity 2022, 14, 1111. [Google Scholar]
- Camacho, C.; Coulouris, G.; Avagyan, V.; Ma, N.; Papadopoulos, J.; Bealer, K.; Madden, T.L. BLAST+: Architecture and applications. BMC Bioinform. 2009, 10, 421. [Google Scholar] [CrossRef] [PubMed]
- Schnell, I.B.; Bohmann, K.; Gilbert, M.T. Tag jumps illuminated—Reducing sequence-to-sample misidentifications in metabarcoding studies. Mol. Ecol. Resour. 2015, 15, 1289–1303. [Google Scholar] [CrossRef]
- R Core Team. R: A Language and Environment for Statistical Computing; R Foundation for Statistical Computing: Vienna, Austria, 2019. [Google Scholar]
- Shannon, C.E.; Weaver, W.J. The Mathematical Theory of Communication; University of Illinois Press: Urbana, IL, USA, 1949; p. 117. [Google Scholar]
- Simpson, E.H. Measurement of diversity. Nature 1949, 163, 688. [Google Scholar] [CrossRef]
- Supriadi, D.; Widayaka, R.; Saputra, A.; Hakim, M.L. Demersal fish diversity index in cirebon waters, west Java. Asian J. Fish. Aquat. Res. 2021, 12, 22–28. [Google Scholar] [CrossRef]
- Weigand, H.; Beermann, A.J.; Čiampor, F.; Costa, F.O.; Csabai, Z.; Duarte, S.; Geigerg, M.F.; Grabowski, M.; Rimet, F.; Rulik, B.; et al. DNA barcode reference libraries for the monitoring of aquatic biota in Europe: Gap-analysis and recommendations for future work. Sci. Total Environ. 2019, 678, 499–524. [Google Scholar] [CrossRef]
- Tzafesta, E.; Saccomanno, B.; Zangaro, F.; Vadrucci, M.R.; Specchia, V.; Pinna, M. DNA barcode gap analysis for multiple marker genes for phytoplankton species biodiversity in mediterranean aquatic ecosystems. Biology 2022, 11, 1277. [Google Scholar] [CrossRef]
- Miya, M. Environmental DNA metabarcoding: A novel method for biodiversity monitoring of marine fish communities. Annu. Rev. Mar. Sci. 2022, 14, 161–185. [Google Scholar] [CrossRef]
- Chan, F.T.; Beatty, S.J.; Gilles, A.S., Jr.; Hill, J.E.; Kozic, S.; Luo, D.; Morgan, D.L.; Pavia, R.T.B., Jr.; Therriault, T.W.; Verreycken, H.; et al. Leaving the fish bowl: The ornamental trade as a global vector for freshwater fish invasions. Aquat. Ecosyst. Health Manag. 2019, 22, 23. [Google Scholar] [CrossRef]
- Di, J.; Zhang, S.; Huang, J.; Du, H.; Zhou, Y.; Zhou, Q.; Wei, Q. Isolation and identification of pathogens causing Haemorrhagic septicaemia in cultured Chinese sturgeon (acipensersinensis). Aquac. Res. 2018, 49, 3624–3633. [Google Scholar] [CrossRef]
- Andolina, C.; Signa, G.; Cilluffo, G.; Iannucci, S.; Mazzola, A.; Vizzini, S. Coexisting with the alien: Evidence for environmental control on trophic interactions between a native (Atherina boyeri) and a non-indigenous fish species (Gambusia holbrooki) in a mediterranean coastal ecosystem. Front. Ecol. Evol. 2022, 10, 958467. [Google Scholar] [CrossRef]
- David, P.; Thebault, E.; Anneville, O.; Duyck, P.F.; Chapuis, E.; Loeuille, N. Impacts of invasive species on food webs: A review of empirical data. Netw. Invasion Synth. Concepts 2017, 56, 1. [Google Scholar]
- Bernery, C.; Bellard, C.; Courchamp, F.; Brosse, S.; Gozlan, R.E.; Jarić, I.; Teletchea, F.; Leroy, B. Freshwater fish invasions: A comprehensive review. Annu. Rev. Ecol. Evol. Syst. 2022, 53, 427–456. [Google Scholar] [CrossRef]
- Ruiz-Navarro, A.; Torralva, M.; Oliva-Paterna, F.J. Trophic overlap between cohabiting populations of invasive mosquitofish and an endangered toothcarp at changing salinity conditions. Aquat. Biol. 2013, 19, 1–11. [Google Scholar] [CrossRef]
- Carmona-Catot, G.; Magellan, K.; Garcia-Berthou, E. Temperature-specific competition between invasive mosquitofish and an endangered cyprinodontid fish. PLoS ONE 2013, 8, e54734. [Google Scholar] [CrossRef]
- Zhan, A.; Macisaac, H.J. Rare biosphere exploration using high-throughput sequencing: Research progress and perspectives. Conserv. Genet. 2015, 16, 513–522. [Google Scholar] [CrossRef]
- Zhang, S.; Lu, Q.; Wang, Y.; Wang, X.; Zhao, J.; Yao, M. Assessment of fish communities using environmental DNA: Effect of spatial sampling design in lentic systems of different sizes. Mol. Ecol. Resour. 2020, 20, 242–255. [Google Scholar] [CrossRef]
- Su, G.; Logez, M.; Xu, J.; Tao, S.; Villéger, S.; Brosse, S. Human impact son global freshwater fish biodiversity. Science 2021, 371, 835–838. [Google Scholar] [CrossRef]
- Yao, M.; Zhang, S.; Lu, Q.; Chen, X.; Zhang, S.Y.; Kong, Y.; Zhao, J. Fishing for fish environmental DNA: Ecological applications, methodological considerations, surveying designs, and ways forward. Mol. Ecol. 2022, 31, 5132–5164. [Google Scholar] [CrossRef]
- McCarthy, A.; Rajabi, H.; McClenaghan, B.; Fahner, N.A.; Porter, E.; Singer, G.A.C.; Hajibabaei, M. Comparative analysis of fish eDNA reveals higher sensitivity achieved through targeted sequence-based metabarcoding. Mol. Ecol. Resour. 2022, 23, 581–591. [Google Scholar] [CrossRef] [PubMed]
- Lin, Y.Y.; Zhao, Z. Application of environmental DNA technologies in monitoring aquatic invasive species. Asian J. Ecotoxicol. 2021, 16, 1–12. (In Chinese) [Google Scholar]
- Wu, Y.S.; Tang, Y.K.; Li, J.L.; Liu, K.; Li, H.X.; Wang, Q.; Yu, J.H.; Xu, P. The application of environmental DNA in the monitoring of the Yangtze finless porpoise, Neophocaena phocaenoides asaeorientalis. J. Fish. Sci. China 2019, 26, 124–132. (In Chinese) [Google Scholar] [CrossRef]
Disclaimer/Publisher’s Note: The statements, opinions and data contained in all publications are solely those of the individual author(s) and contributor(s) and not of MDPI and/or the editor(s). MDPI and/or the editor(s) disclaim responsibility for any injury to people or property resulting from any ideas, methods, instructions or products referred to in the content. |
© 2024 by the authors. Licensee MDPI, Basel, Switzerland. This article is an open access article distributed under the terms and conditions of the Creative Commons Attribution (CC BY) license (https://creativecommons.org/licenses/by/4.0/).