Article

Thiamine Deficiency M74 Developed in Salmon (Salmo salar) Stocks in Two Baltic Sea Areas after the Hatching of Large Year-Classes of Two Clupeid Species—Detected by Fatty Acid Signature Analysis

1
Natural Resources, Fisheries and Fish Resources, Natural Resources Institute Finland (Luke), P.O. Box 2, FI-00791 Helsinki, Finland
2
Faculty of Biological and Environmental Sciences, University of Helsinki, P.O. Box 65, FI-00014 Helsinki, Finland
3
Department of Biological and Environmental Science, University of Jyväskylä, P.O. Box 35, FI-40014 Jyväskylä, Finland
4
Helsinki University Lipidomics Unit (HiLIPID) and Biocenter Finland, Helsinki Institute of Life Science (HiLIFE), University of Helsinki, Viikinkaari 1, FI-00014 Helsinki, Finland
5
Molecular and Integrative Biosciences Research Programme, Faculty of Biological and Environmental Sciences, University of Helsinki, Viikinkaari 1, FI-00014 Helsinki, Finland
6
Natural Resources Institute Finland (Luke), Survontie 9, FI-40500 Jyväskylä, Finland
7
Chemistry Unit, Laboratory and Research Division, Finnish Food Authority, P.O. Box 200, FI-00027 Ruokavirasto, Finland
*
Author to whom correspondence should be addressed.
Fishes 2024, 9(2), 58; https://doi.org/10.3390/fishes9020058
Submission received: 10 November 2023 / Revised: 25 January 2024 / Accepted: 26 January 2024 / Published: 30 January 2024

Abstract

:
Lipid-related thiamine (vitamin B1) deficiency of Baltic salmon (Salmo salar), the M74 syndrome, is generally caused by feeding on abundant young sprat (Sprattus sprattus) in the Baltic Proper, the main foraging area of these salmon. In 2014, a strong year-class of sprat was hatched in the Baltic Proper, and a strong herring (Clupea harengus) year-class was hatched in the Gulf of Bothnia, where herring is the dominant salmon prey. The fatty acid (FA) signatures of prey fish in muscle or eggs of second sea-year spawners suggested that 27% of wild River Simojoki and 68% of reared River Dal salmon remained in the Gulf of Bothnia in 2014 instead of continuing to the Baltic Proper. In 2016, 23% of the M74 females of the River Simojoki and 58% of the River Dal originated from the Gulf of Bothnia, and 13% and 16%, respectively, originated from the Baltic Proper. Some salmon from the River Neris in the southern Baltic Proper had also been feeding in the Gulf of Bothnia. In general, low free thiamine (THIAM) concentration in eggs was associated with high lipid content and high docosahexaenoic acid (DHA, 22:6n−3) and n−3 polyunsaturated FA (n−3 PUFA) concentrations in muscle but not in eggs. A higher THIAM concentration and lower proportions of DHA and n−3 PUFAs in Arctic Ocean salmon eggs, despite higher egg lipid content, indicated that their diet contained fewer fatty fish than the Baltic salmon diet. Hence, M74 originated by foraging heavily on young fatty sprat in the Baltic Proper or herring in the Gulf of Bothnia.
Key Contribution: The fatty acid proportions of both muscle and eggs of spawning salmon can be used to determine the feeding area of salmon in the sea. The distribution of small, fatty prey fish affects the feeding migration of salmon and the development of thiamine deficiency.

1. Introduction

Thiamine (vitamin B1) deficiency in fatty predatory fish results from an unbalanced diet abundant in fatty marine prey fish and thereby an excessive dietary intake of n−3 polyunsaturated fatty acids (n−3 PUFAs) [1,2]. It has affected salmonine species and lamprey (Lampetra fluviatilis) [2,3,4,5] and is called the M74 syndrome in the Baltic region [1,2,3,6] and Thiamine Deficiency Complex (TDC) in North America [7]. M74 has impaired the reproduction of Atlantic salmon (Salmo salar) feeding in the Baltic Sea (hereafter Baltic salmon or salmon), especially in the 1990s, but also after [8].
The main function of lipid accumulated in adipose tissue as triacylglycerol (TAG) is to store energy, as the fatty acids (FAs) hydrolyzed from lipids are the primary source of metabolic energy for growth, swimming, and reproduction, particularly in marine fish [9]. The thiamine pyrophosphate derivative (TPP) of thiamine acts as the coenzyme for all the enzymatic reactions of oxidative metabolism that yield ATP [10,11]. Especially during pre-spawning fasting, FAs are released from fish lipids and catabolized via β-oxidation, providing energy in the form of ATP [9]. In addition, FAs, as well as thiamine and other micro- and macronutrients, are transferred to the growing oocytes [12].
Fatty fish that feed on fatty marine prey fish are prone to suffer from thiamine deficiency [1,13] because the requirement for thiamine increases with the increase in the diet’s energy content [14] and because thiamine is depleted as a consequence of lipid peroxidation [14,15,16]. n−3 PUFAs are abundant in marine fish lipids [9], and docosahexaenoic acid (DHA, 22:6n−3) is the most common PUFA in Baltic clupeids and salmon [13,17]. All PUFAs are susceptible to peroxidation initiated by the free radicals normally generated in metabolism [18], but DHA is most susceptible due to its large number of double bonds [19]. Peroxidation was manifested as an increase in the concentration of malondialdehyde (MDA), the main peroxidation product of n−3 PUFAs, as the concentration of DHA increased in the tissues of Baltic salmon [13,20]. The unphosphorylated form of thiamine, i.e., free thiamine (THIAM), serves as an antioxidant for lipid peroxidation in tissues and is destroyed in such reactions [10,16,21], as described in salmon by Keinänen et al. [1,13] and Vuorinen et al. [8,22]. Therefore, the higher the amount of n−3 PUFAs, especially DHA, accumulated and metabolized, the more thiamine is consumed [13,22].
In fish with a high tissue concentration of n−3 PUFAs, thiamine can be depleted during the pre-spawning fast so that the eggs do not provide enough thiamine for the yolk-sac fry (free embryos or eleutheroembryos [23]) to develop. Thiamine deficiency, therefore, primarily affects yolk-sac fry [8,24,25], which must survive on yolk nutrients from hatching to the alevin stage, i.e., the stage when the hatched fry start external feeding [23]. As THIAM is a reserve form of thiamine, its concentration of the different thiamine components in eggs varies most, depending on the female’s thiamine status [8]. The thiamine deficiency of the offspring of fish can, therefore, be predicted from the THIAM concentration of the eggs [8,26]. At worst, thiamine deficiency can be seen as weakness and loss of equilibrium in brood fish before spawning, and they may die before spawning [8,27,28,29].
Most Baltic salmon come from the rivers of the northern Gulf of Bothnia, and the majority of them and salmon from other Baltic Sea rivers feed in the southern Baltic Sea, the Baltic Proper, which is by far the largest and deepest of the Baltic Sea basins [30,31,32]. However, according to mark–recapture studies, some salmon individuals from the rivers of the Gulf of Bothnia do not migrate to the Baltic Proper but remain to feed in the Gulf of Bothnia, where the main feeding area is the Bothnian Sea (Figure 1) [30,33,34,35,36]. Sprat (Sprattus sprattus) is the principal prey fish of salmon in the Baltic Proper, whereas herring (Clupea harengus) is the dominant prey fish in the Gulf of Bothnia [37,38].
The M74 syndrome of salmon has principally resulted from foraging heavily on sprat, especially on young sprat in the Baltic Proper [1,2,39]. The lipid content of sprat is almost double the average of herring of a size appropriate as prey for salmon (length < 19 cm) and is at its highest in the youngest sprat [1,13,17,39,40]. Therefore, the concentration of n−3 PUFAs of sprat in the Baltic Proper is also higher than in herring, even though the proportion of n−3 PUFAs in herring is somewhat higher than in sprat [13,17,41]. However, the lipid and n−3 PUFA content of the prey fish have differed between Baltic Sea areas, and, e.g., in 2003–2004, the prey was fattiest in the Gulf of Bothnia and leanest in the Gulf of Finland [13,17].
In the fall of 2004, one of the thirty-two salmon females of the second sea-year included in the Finnish M74 monitoring [8] proved to be an M74 female with 100% yolk-sac fry mortality (YSFM), and this female had been feeding on herring in the Gulf of Bothnia [13,22]. In contrast, in the same year, none of the salmon that had mainly been feeding on sprat in the Baltic Proper were regarded as M74 females. The 2002 year-class of Gulf of Bothnia herring was the largest on record, and herring there were also fattier on average, with a higher n−3 PUFA concentration than Baltic Proper herring [13]. As in sprat, the concentration of n−3 PUFAs is also higher in younger than older herring [13,17]. The n−3 PUFA concentration in Gulf of Bothnia salmon was, therefore, higher than in Baltic Proper salmon, which already led to a higher degree of lipid peroxidation during the feeding migration at sea, indicated by a high hepatic MDA concentration [13]. The thiamine status in Gulf of Bothnia salmon, seen as a low hepatic total thiamine concentration, was, therefore, poorer than in Baltic Proper salmon [13]. Hence, a strong year-class of herring in the Gulf of Bothnia, when the herring were fatty there, could cause thiamine deficiency [13,22].
In 2014, both the sprat year-class in the Baltic Proper and the herring year-class in the Gulf of Bothnia were exceptionally large [42,43,44], and the Gulf of Bothnia herring were also fatty [45]. Their CF was also higher in 2014 than in the preceding or next year, although the herring were not lean in those years either [45]. The salmon M74 females of the falls between 2015 and 2017 may, therefore, have eaten either sprat in the Baltic Proper or herring in the Gulf of Bothnia. This was possible to determine with fatty acid signature analysis (FASA), which is an established method used to study the feeding history of both predatory and prey fish [7,46,47,48,49]. Despite small intraspecific differences between feeding areas and seasons, the FA composition of the Baltic sprat and herring differed significantly [17]. The FA patterns characteristic of sprat and herring were detected by FASA in the muscle of salmon caught in different Baltic Sea areas, and the feeding area and dominant prey fish species of salmon could be determined in the muscle of salmon even after several months of pre-spawning fasting [2,13,22].
The eggs of Baltic salmon returning to spawn are routinely sampled for annual M74 monitoring, so we first investigated whether the feeding area of salmon can be estimated by applying FASA on eggs, as well as on muscle in the non-M74 year, 2014 (hereafter also non-M74 year), and in the severe M74 year, 2016 (hereafter also M74 year). Our second aim was to compare how the FA composition of eggs differed between salmon that after feeding in the Baltic Sea ascended different Baltic Sea rivers and the salmon that after feeding in the Arctic Ocean ascended the River Tenojoki for spawning. Third, we investigated whether the FASA of the eggs distinguished the feeding area of salmon from three rivers (Rivers Simojoki, Dal, and Neris) flowing to different areas in the Baltic Sea. Knowing the feeding area enabled the potential association between the strong 2014 year-classes of sprat in the Baltic Proper and herring in the Gulf of Bothnia and the incidence of M74 in salmon to be studied. Fourth, to study the association between the dietary FAs and M74 in spawning salmon, we compared the egg THIAM concentration and FA composition in the muscle and eggs of the River Simojoki salmon between 2014 and 2016, as well as between the salmon that had mainly been feeding on sprat in the Baltic Proper or herring in the Gulf of Bothnia. Fifth, we demonstrated how the different feeding areas of the salmon resulted in differences in their size and lipid and n−3 PUFA content of muscle and eggs and affected the concentrations of egg THIAM.

2. Materials and Methods

2.1. Salmon and Sample Preparation

Salmon (Salmo salar L.) females from the rivers of the Baltic Sea were collected from June to July, when they ascended the spawning rivers, and were sampled during the spawning season in September–October, when they were stripped of their eggs to produce offspring for stockings and the annual M74 monitoring [8]. In addition, the Finnish M74 monitoring data of the Natural Resources Institute Finland (Luke) were available.
Salmon from the River Simojoki were sampled in 2014, 2016, and 2017. The River Simojoki flows into the Bothnian Bay in the northeastern Gulf of Bothnia (Figure 1). The River Simojoki salmon stock currently reproduces naturally. Salmon from the River Dal were sampled in 2016 and 2017. The River Dal flows into the southwestern Bothnian Sea of the Gulf of Bothnia and is dammed. Its salmon stock is maintained by hatchery rearing and smolt releases. Salmon from the River Neris were sampled in 2017. The River Neris is a tributary of the River Nemunas, which flows into the southeastern Baltic Proper. In addition, salmon from the Arctic River Tenojoki (hereafter also Arctic Ocean salmon), which flows into the Barents Sea in the Arctic Ocean (Figure 1), were sampled in 1997 for comparison with Baltic salmon.
Table 1 shows the biological data of salmon collected from the different rivers of the Baltic Sea and of the Arctic River Tenojoki, as well as the performed analyses. The eggs were sampled by stripping ovulated eggs from fish on a sieve to filter off the ovarian fluid, and ca. 1 dL of unfertilized eggs was sealed in a zip-lock polyethylene bag as a single layer [8,50]. Approximately 200 g of white epaxial muscle from below the dorsal fin was taken from the fish that were killed after the stripping of eggs and put in a zip-lock polyethylene bag [8,50]. After collection, the samples were immediately frozen at −20 °C and sent in dry ice to the laboratory, where they were preserved in a freezer at −80 °C [8] until being analyzed within 3–6 weeks. However, the eggs of the River Tenojoki salmon were preserved in liquid nitrogen until they were analyzed in 2017.
The age of the River Simo, Dal, and Neris salmon was determined from scales removed from above the lateral line below the dorsal fin [51]. The salmon were selected randomly for the study and were 2nd sea-year old, but the ages of the 2014 River Simojoki salmon and River Tenojoki salmon were unavailable. However, approximately 75% of the Baltic salmon included during 1985–2018 in the Finnish M74 monitoring were of 2nd sea-year females [8]. The 2014 River Simojoki salmon were selected based on the length and mass data of the Baltic salmon database [8]. The majority of the River Tenojoki salmon were 2nd sea-year females because their body mass did not differ significantly from that of the Baltic salmon of the same age in the non-M74 year 2014 (Table 1). Fulton’s CF was calculated as CF = 100 × (total mass, g)/(total length, cm)3. The total mass of spawning salmon was weighed before they were stripped of eggs.

2.2. Chemical Analyses

The concentration of THIAM was analyzed in all egg samples as described in Vuorinen et al. [8]. The gravimetric analysis of lipids is described in Vuorinen et al. [8], and the gas chromatographic analysis of FAs is described in Keinänen et al. [17]. The FAs were grouped into their structural categories (FA classes): saturated FAs (SFAs), monounsaturated FAs (MUFAs), and PUFAs, and the latter were further divided into n−3 PUFAs and n−6 PUFAs, similarly to Keinänen et al. [2,17]. The FA results are presented both as proportions of total FAs and as lipid-weighted proportions, which correspond to the concentrations (mg g−1). The 16 FAs (Supplementary Table S1), for which the mean proportions were >0.4% (area%, which is close to wt%), were included in the calculations.

2.3. Classification of Salmon into M74 and Non-M74 Females

Using historical data and the model developed by Vuorinen et al. [8], salmon were classified as M74 female if the egg THIAM concentration was ≤0.71 nmol g−1 and non-M74 female if the egg THIAM concentration was >0.71 nmol g−1 [8].

2.4. Classification of the Salmon in Two Feeding Groups

Previously reported fatty acid signatures allowed us to use FASA to classify salmon as having been fed either on sprat in the Baltic Proper or herring in the Gulf of Bothnia. According to Keinänen et al. [17], the major MUFA oleic acid (18:1n−9) and a minor MUFA, heptadecenoic acid (17:1n−8), are characteristic of sprat, while a high proportion of myristic acid (14:0), the proportion of which increases in fish from the northern to southern Baltic Sea [52], indicates feeding in the southern Baltic Sea. Thus, higher proportions of these three FAs indicate salmon feeding in the Baltic Proper. On the other hand, MUFAs palmitoleic acid (16:1n−7) and vaccenic acid (18:1n−7), typically high in herring feeding on benthic invertebrates [53], and n−6 PUFAs linoleic acid (18:2n−6) and eicosadienoic acid (20:2n−6) of freshwater origin [46,52], indicate salmon feeding in the Gulf of Bothnia. The proportion of arachidonic acid (ARA, 20:4n−6), which is the elongation and desaturation product of 18:2n−6, is also higher in herring and salmon from the Gulf of Bothnia than in the Baltic Proper [13,52].

2.5. Statistical Analyses

Variables were tested for normality (Kolmogorov–Smirnov test), and Levene’s test was used to test homogeneity among variances. Principal component analysis (PCA, [54]) was carried out for multivariate statistical comparisons of FA proportions to indicate potential common FA patterns of the sprat of the Baltic Proper or herring of the Gulf of Bothnia [17] with the FAs of salmon eggs and muscle grouped by salmon spawning year, feeding area, and M74 status. As a result, biplot graphs with principal components PC1 and PC2 were created to demonstrate (dis)similarities among the salmon groups driven by the FA variables. Soft independent modeling of class analogy (SIMCA, [55]) was used to quantify the differences at the level of p < 0.05 or 0.01 between the pairs of salmon groups. As PCA classified all salmon stocks into two groups, the following statistical analyses were based on this separation. However, groups with N < 3 were not included in the statistical comparisons.
A one-way ANOVA with a Student–Newman–Keuls (SNK) post hoc test was used to reveal significant (p < 0.05) differences in the FA proportions and concentrations between the eggs and muscle of salmon and between the sampling years. ANOVA was also applied to test the differences in the annual mean values of salmon body mass, total length, CF, and egg THIAM concentration between the groups of salmon representing the FASA-determined feeding areas of the Baltic Sea, the Baltic Proper and the Gulf of Bothnia, and the Arctic Ocean. A t-test was used for a comparison of the means of size indices, lipid content, FA concentrations of muscle and eggs, and the mean concentration of egg THIAM between the two feeding areas. A Pearson correlation was applied to analyze the relationships between the muscle and egg lipid content and the concentration of egg THIAM and mass and length of the River Simojoki salmon in 2014 and 2016 classified in the Baltic Proper feeding group. Linear regressions were fitted for the relationships between the egg lipid content and the mass and length of all the salmon.
The statistical analyses were performed with the Statistical Analysis System (ver. 9.4) software, apart from PCA and SIMCA, which were carried out using Sirius software (ver. 8.5, Pattern Recognition Systems (PRS), Bergen, Norway). The figures were drawn with OriginPro 2023 (OriginLab Co., Northampton, MA, USA).

3. Results

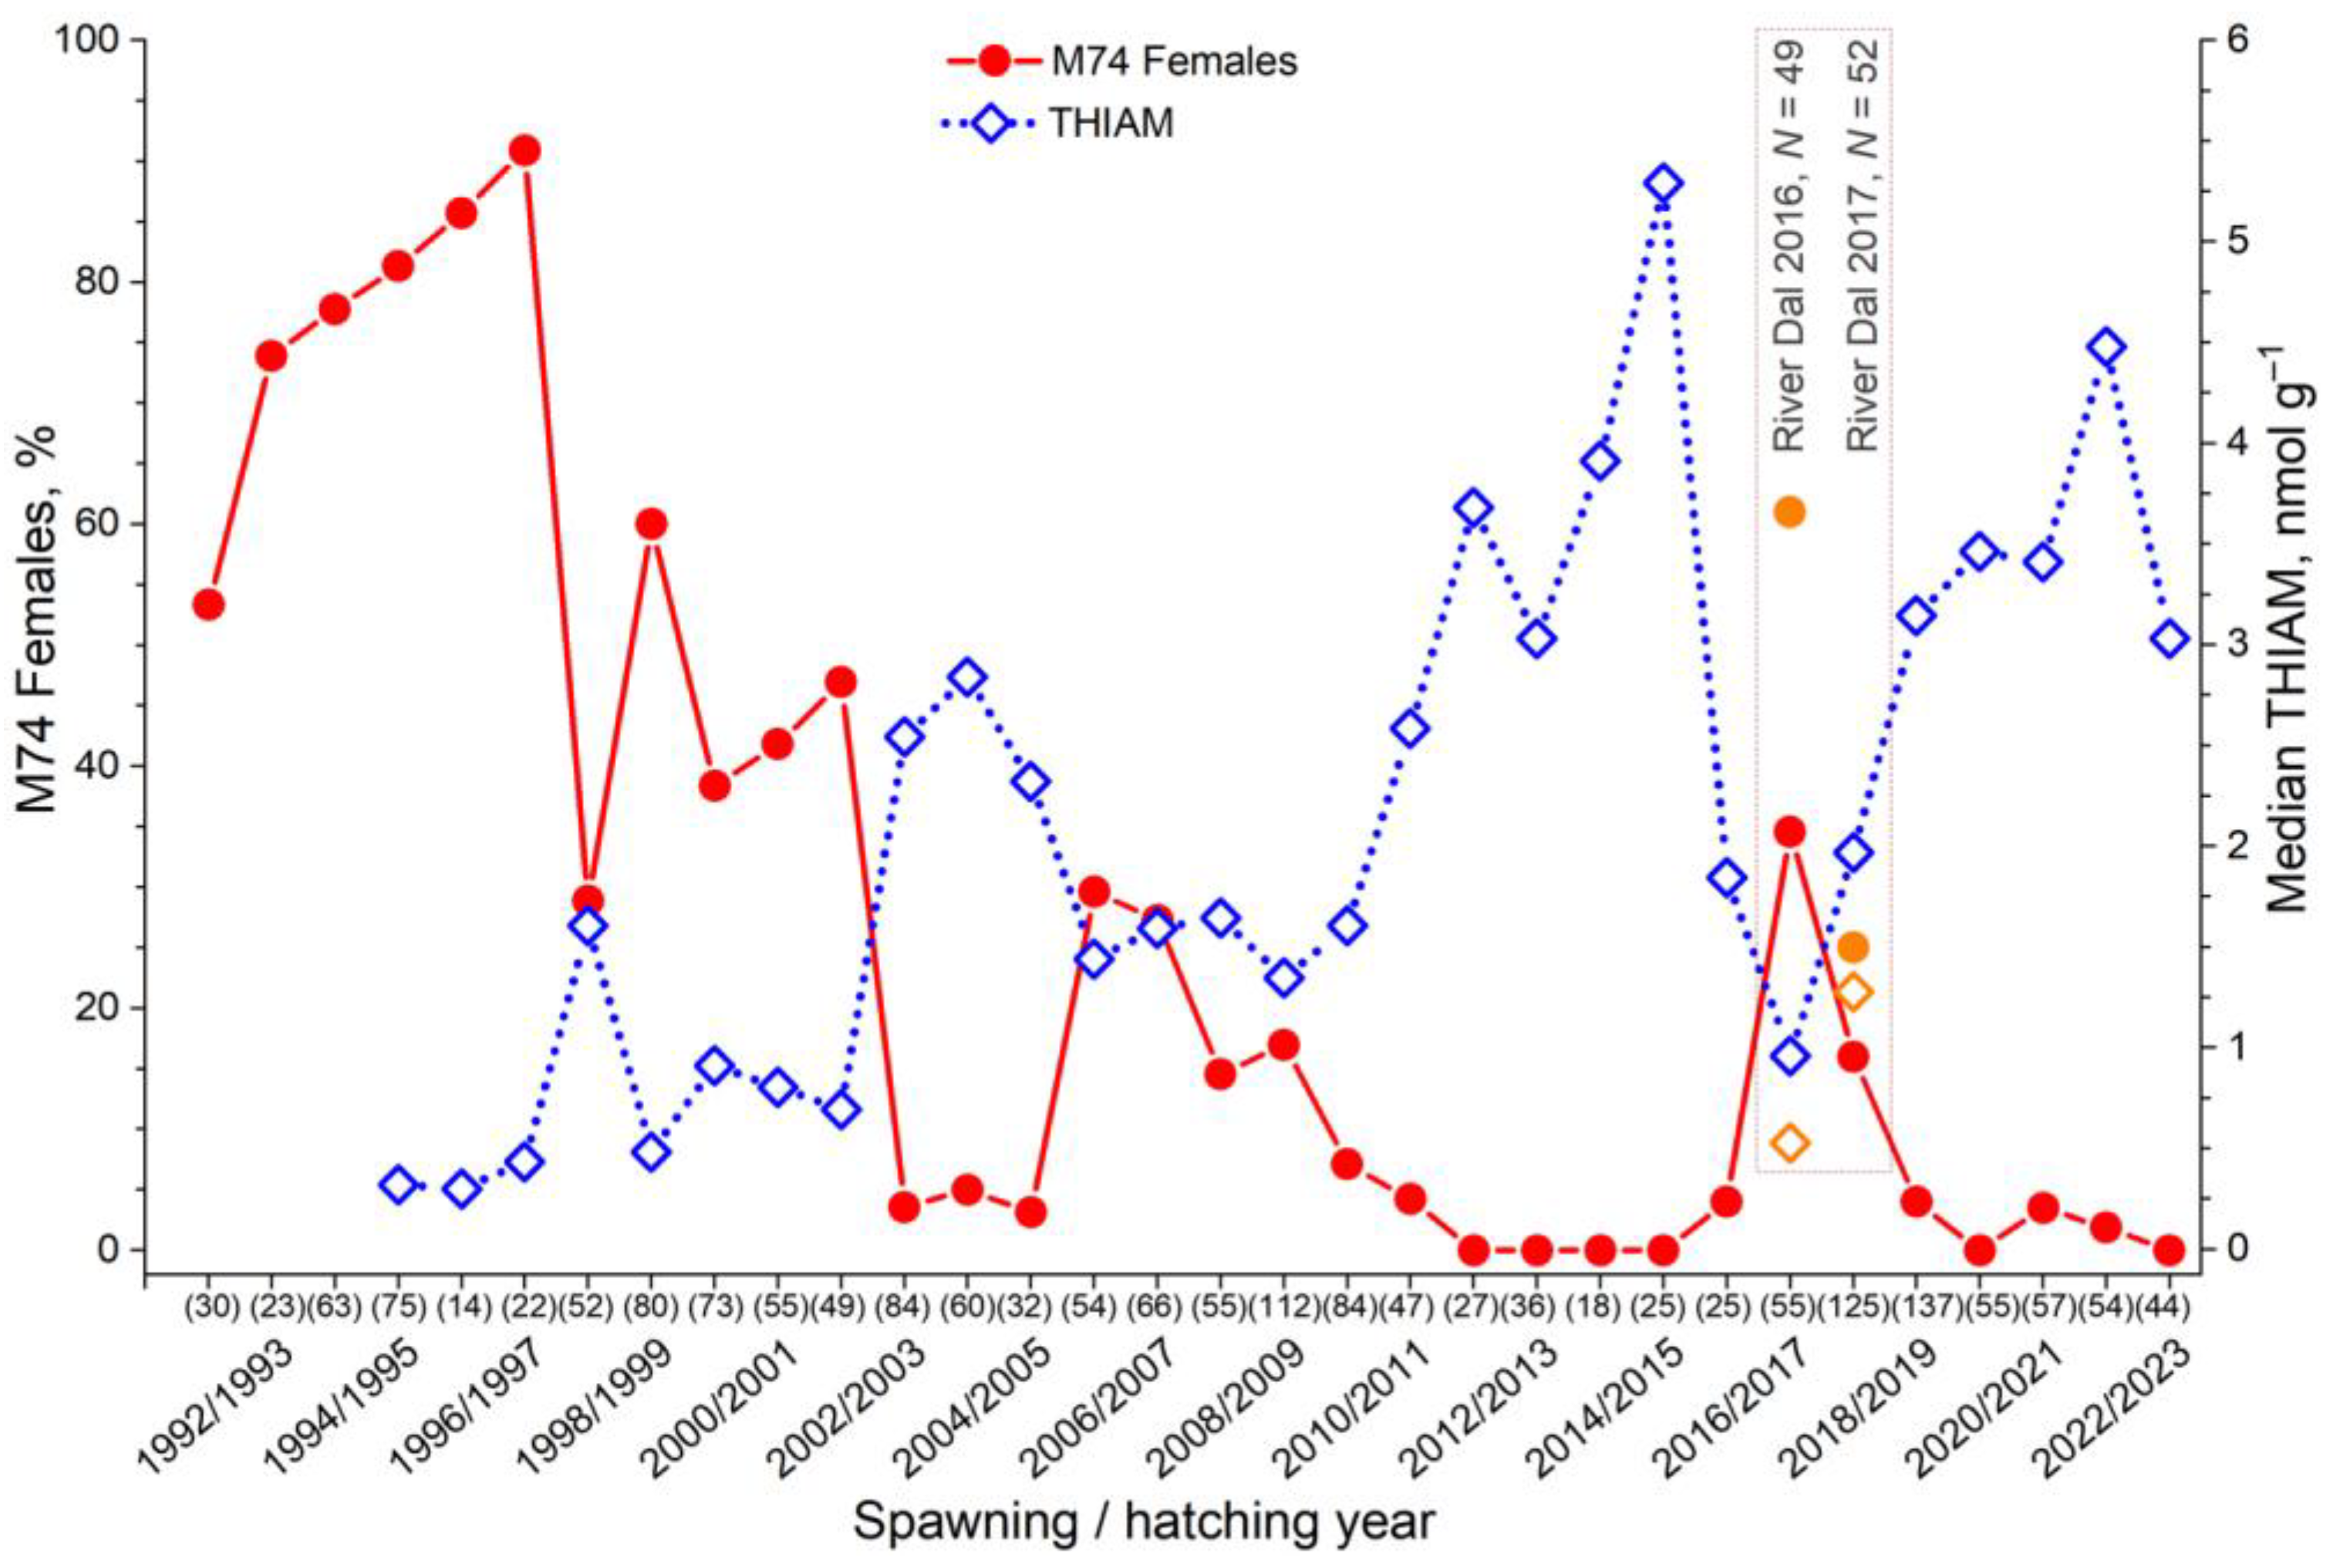
3.1. Variation in the Incidence of M74

Between 1994 and 2014, the median THIAM concentrations in the eggs of the female salmon ascendants of the Gulf of Bothnia rivers (the Rivers Simojoki, Tornionjoki, and Kemijoki; Figure 1) were highest in 2011–2014, according to Finnish M74 monitoring (Figure 2). In these falls, there were no M74 females for the first time since the turn of the 1980s and 1990s. In the fall of 2015, the egg THIAM concentrations began to decrease again and were lowest in 2016 (Figure 2). The median THIAM concentrations increased in 2017 and further in 2018. The annual changes in the egg THIAM concentrations for the River Dal salmon were similar to those of the River Simojoki salmon, but the THIAM concentrations of the eggs of the River Dal salmon were lower in 2016 and 2017. The median THIAM concentration in the eggs of the River Neris salmon was higher than in the River Simojoki and Dal salmon in 2017 (Figure 2).

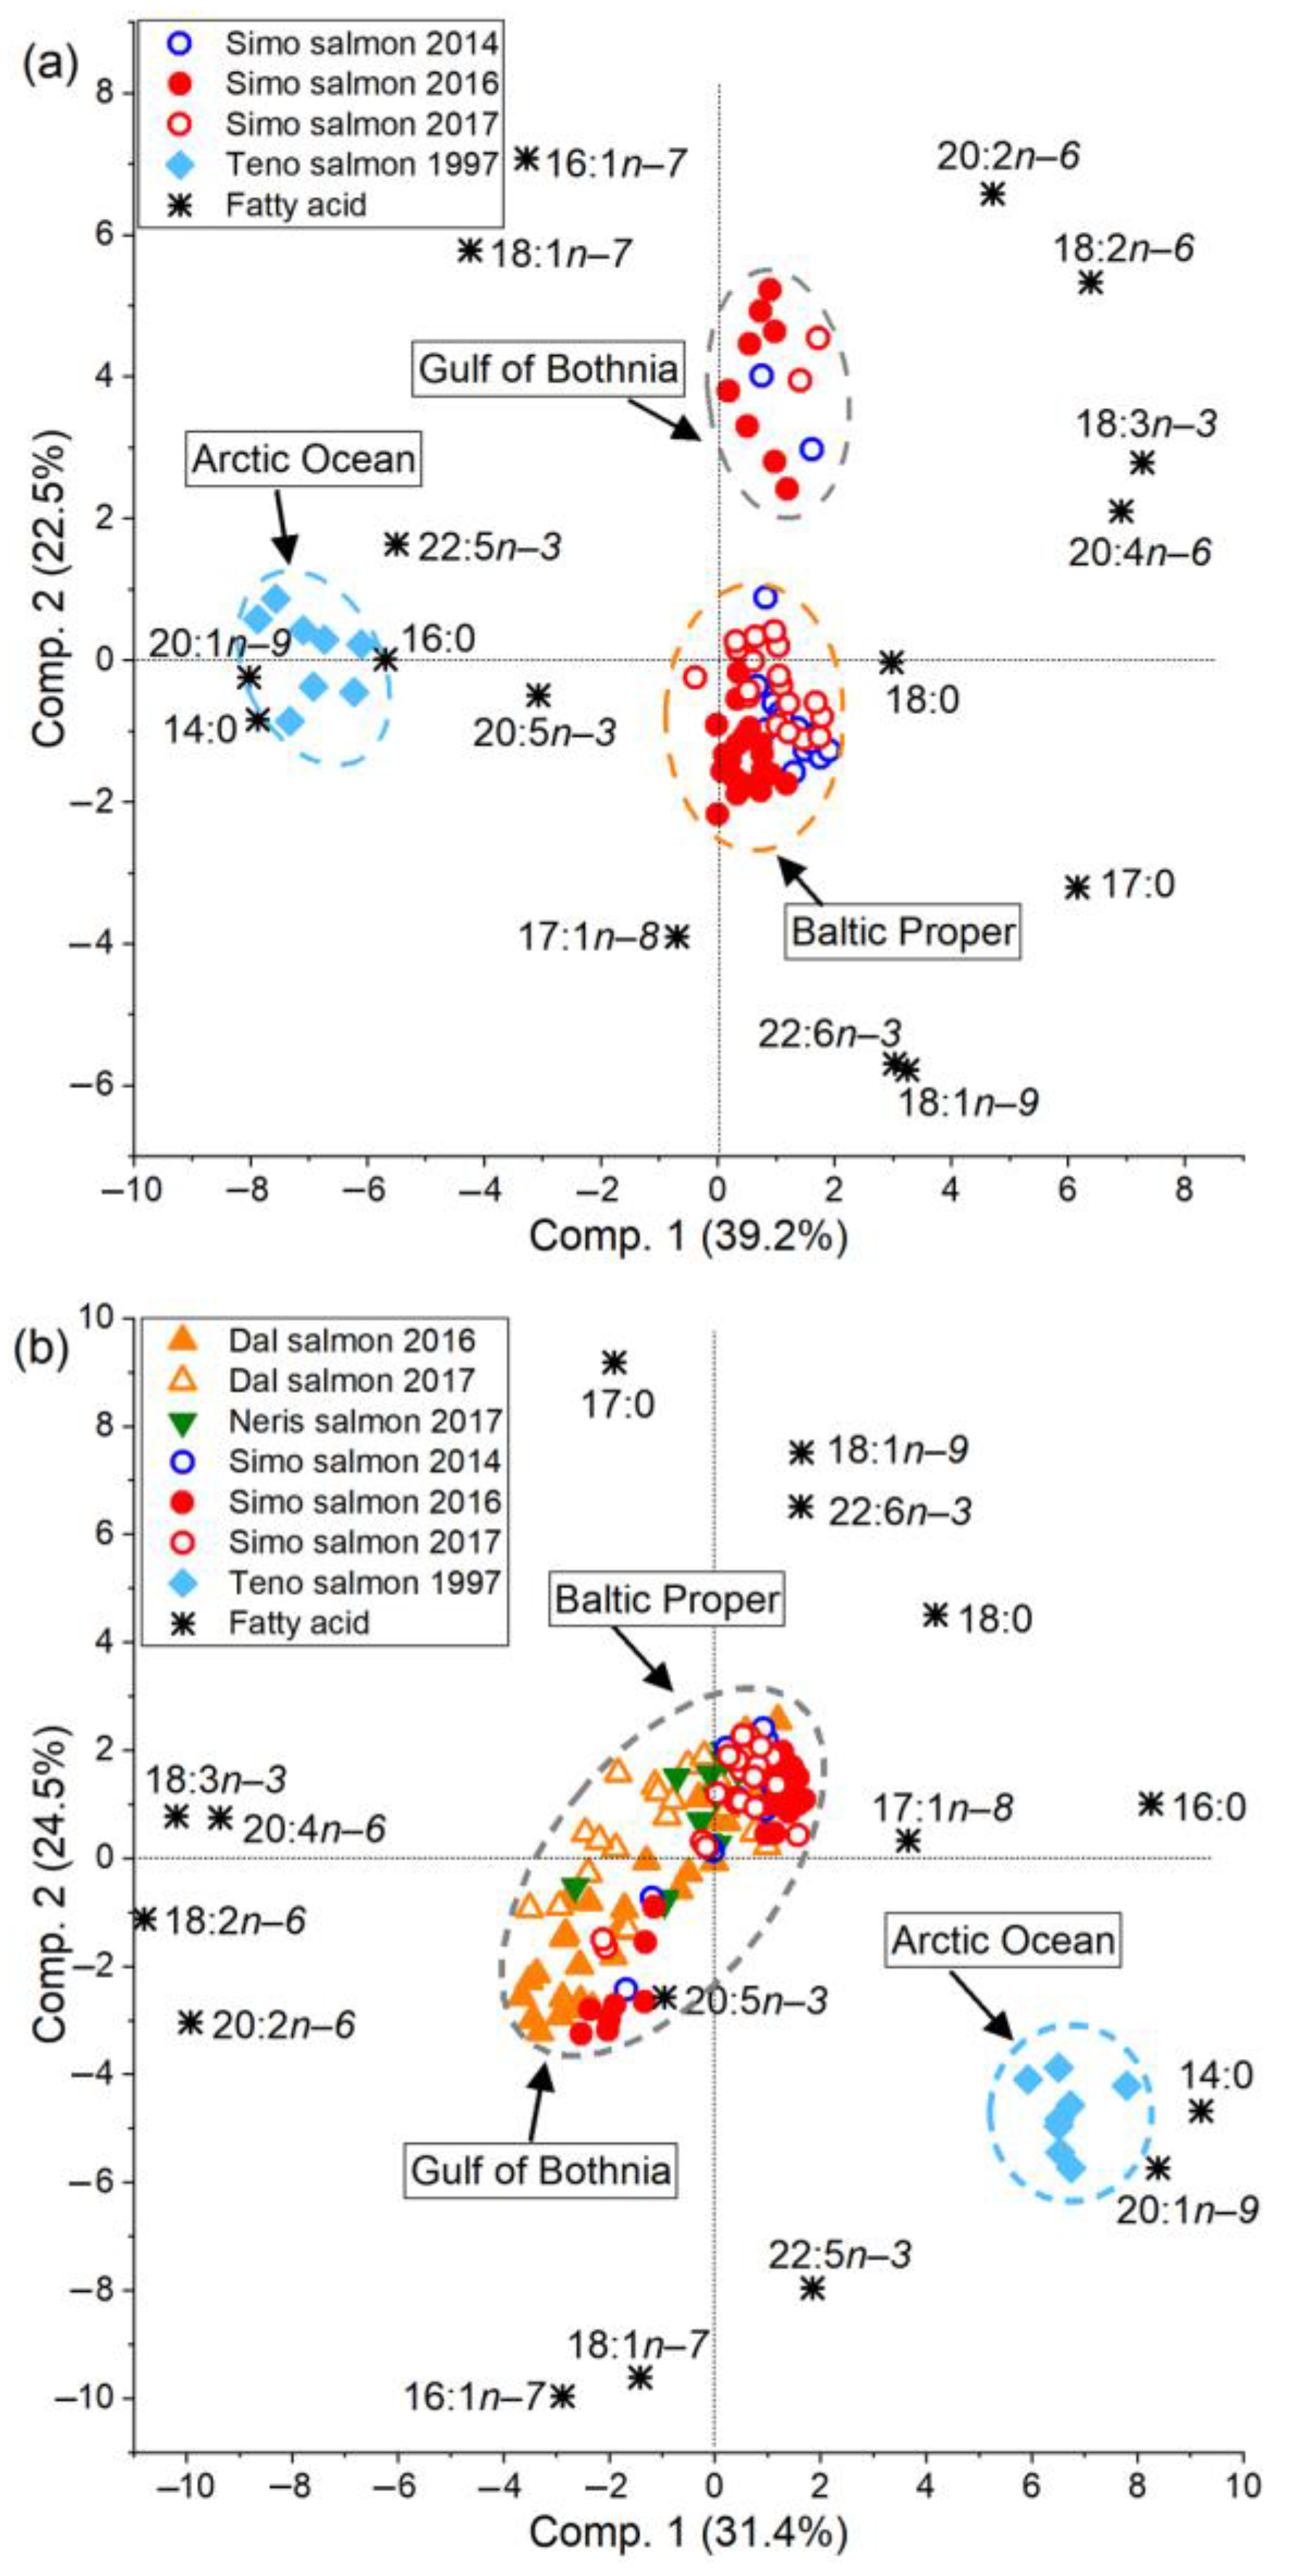
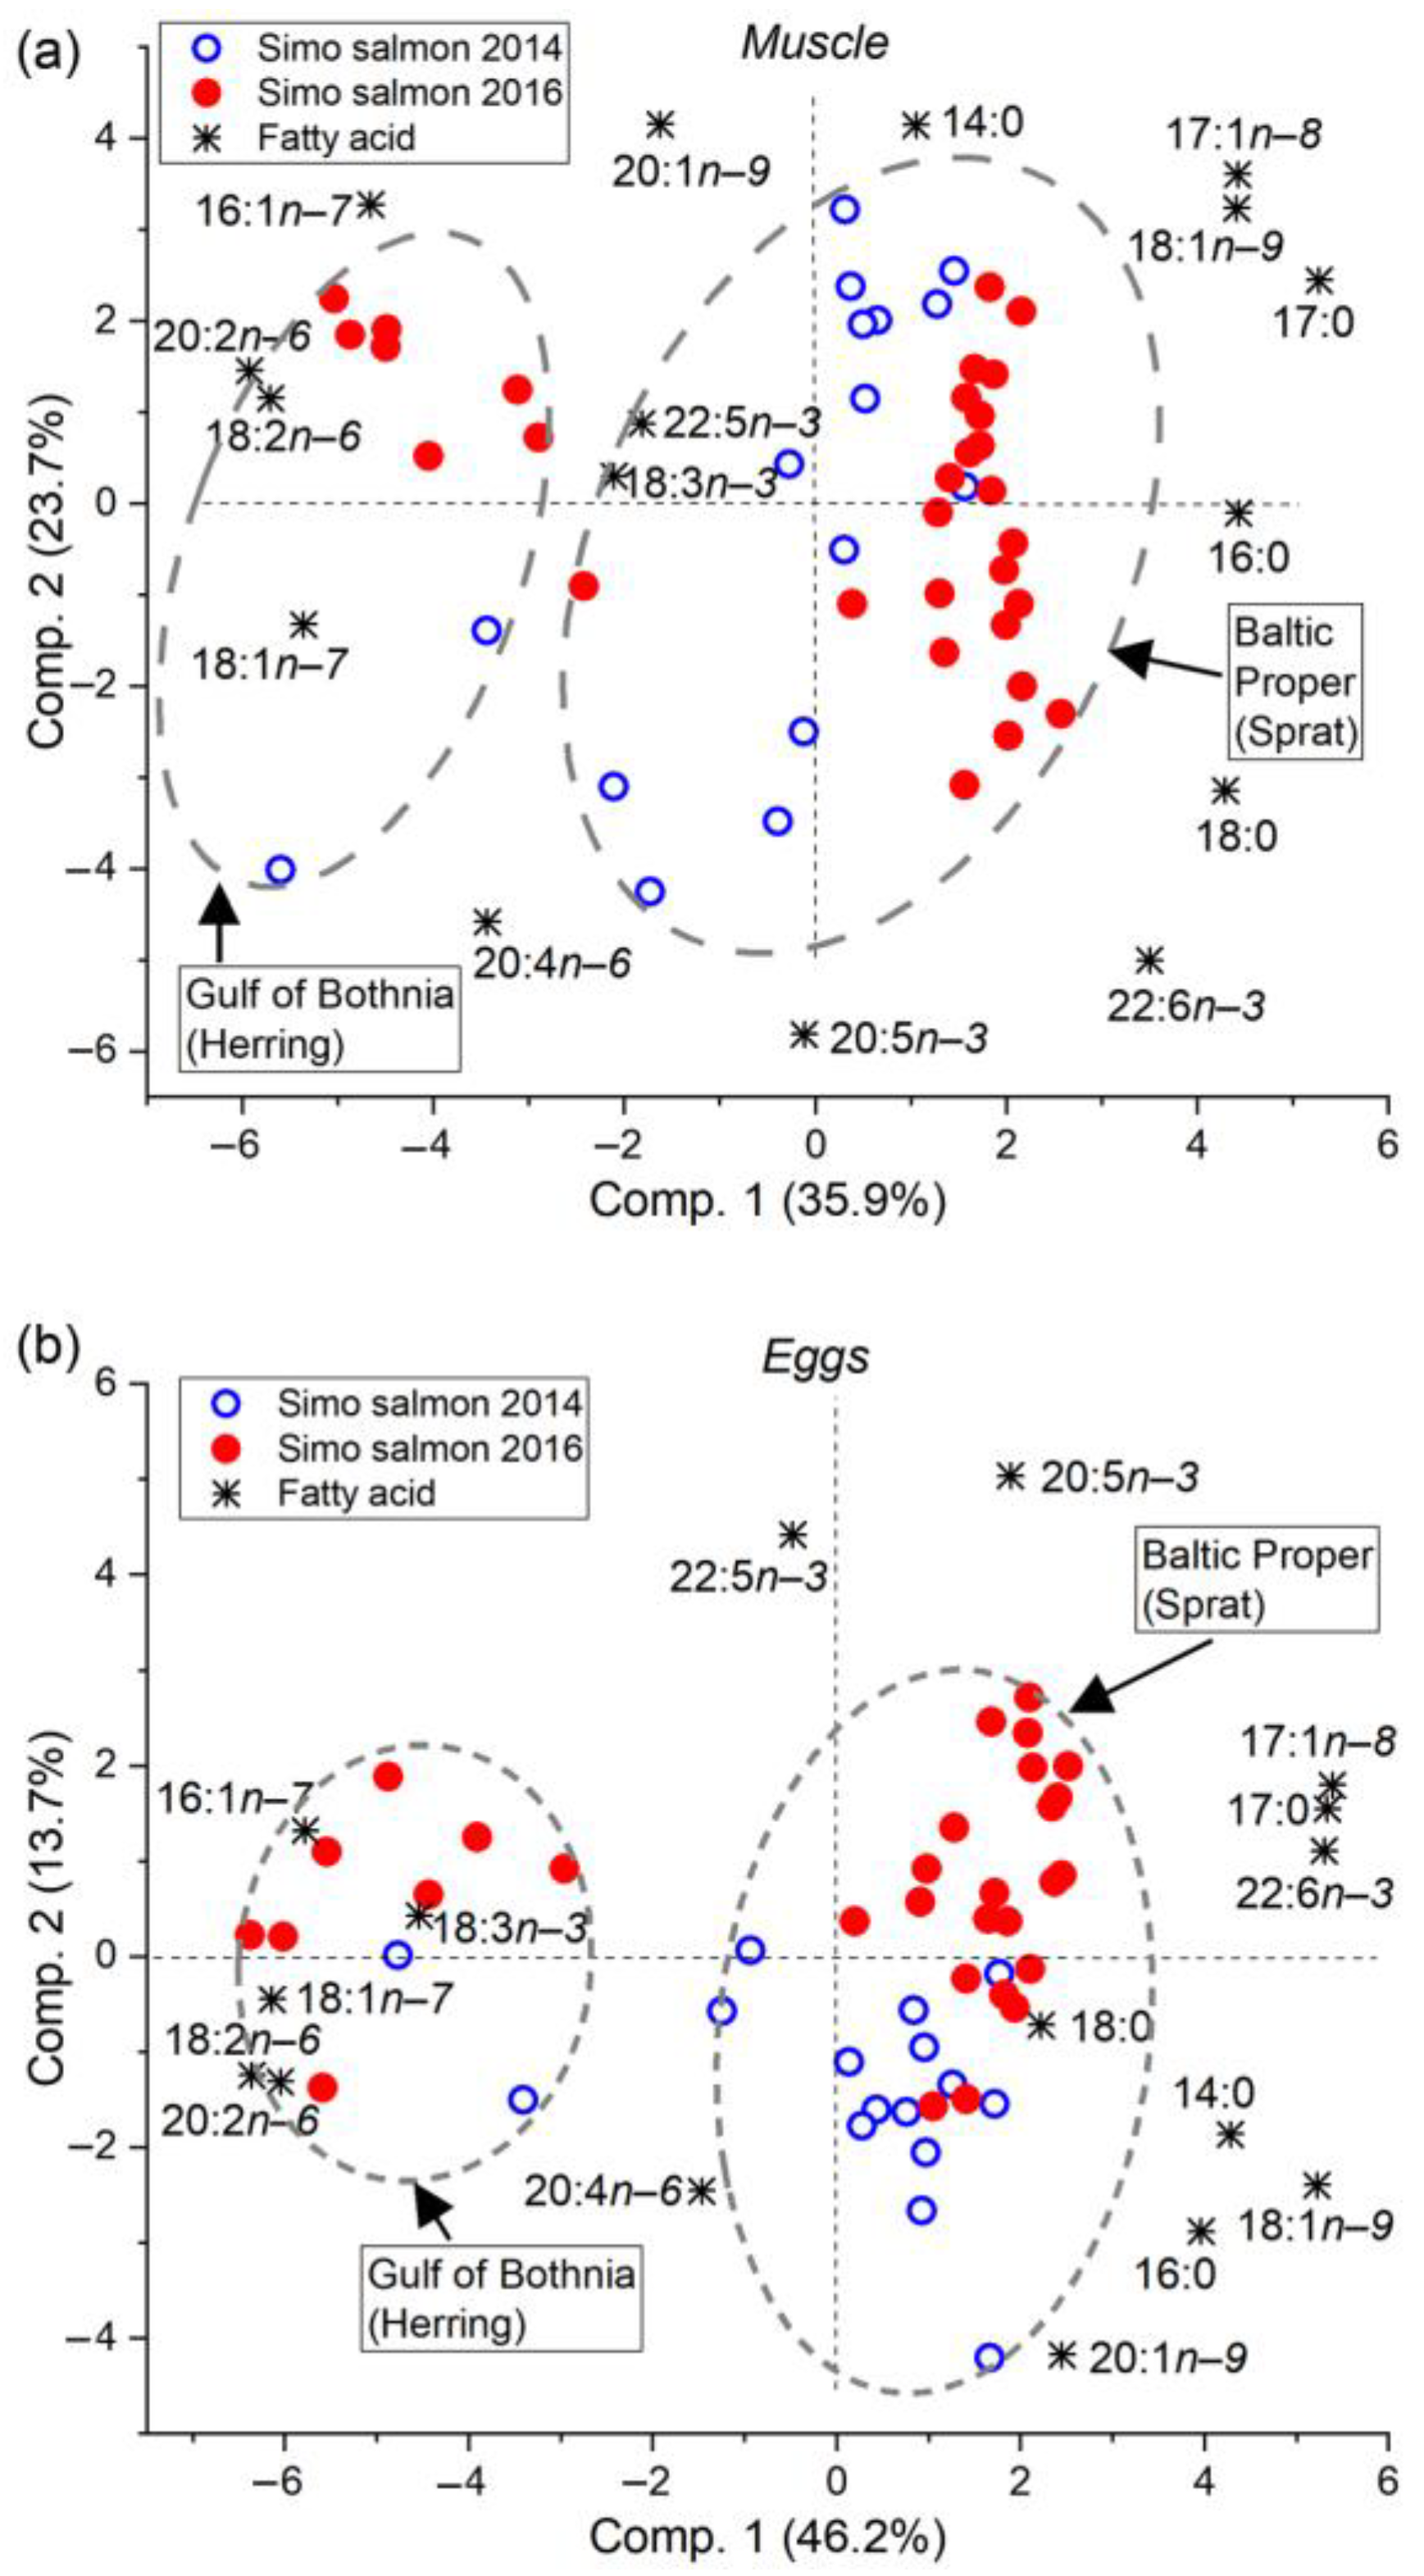
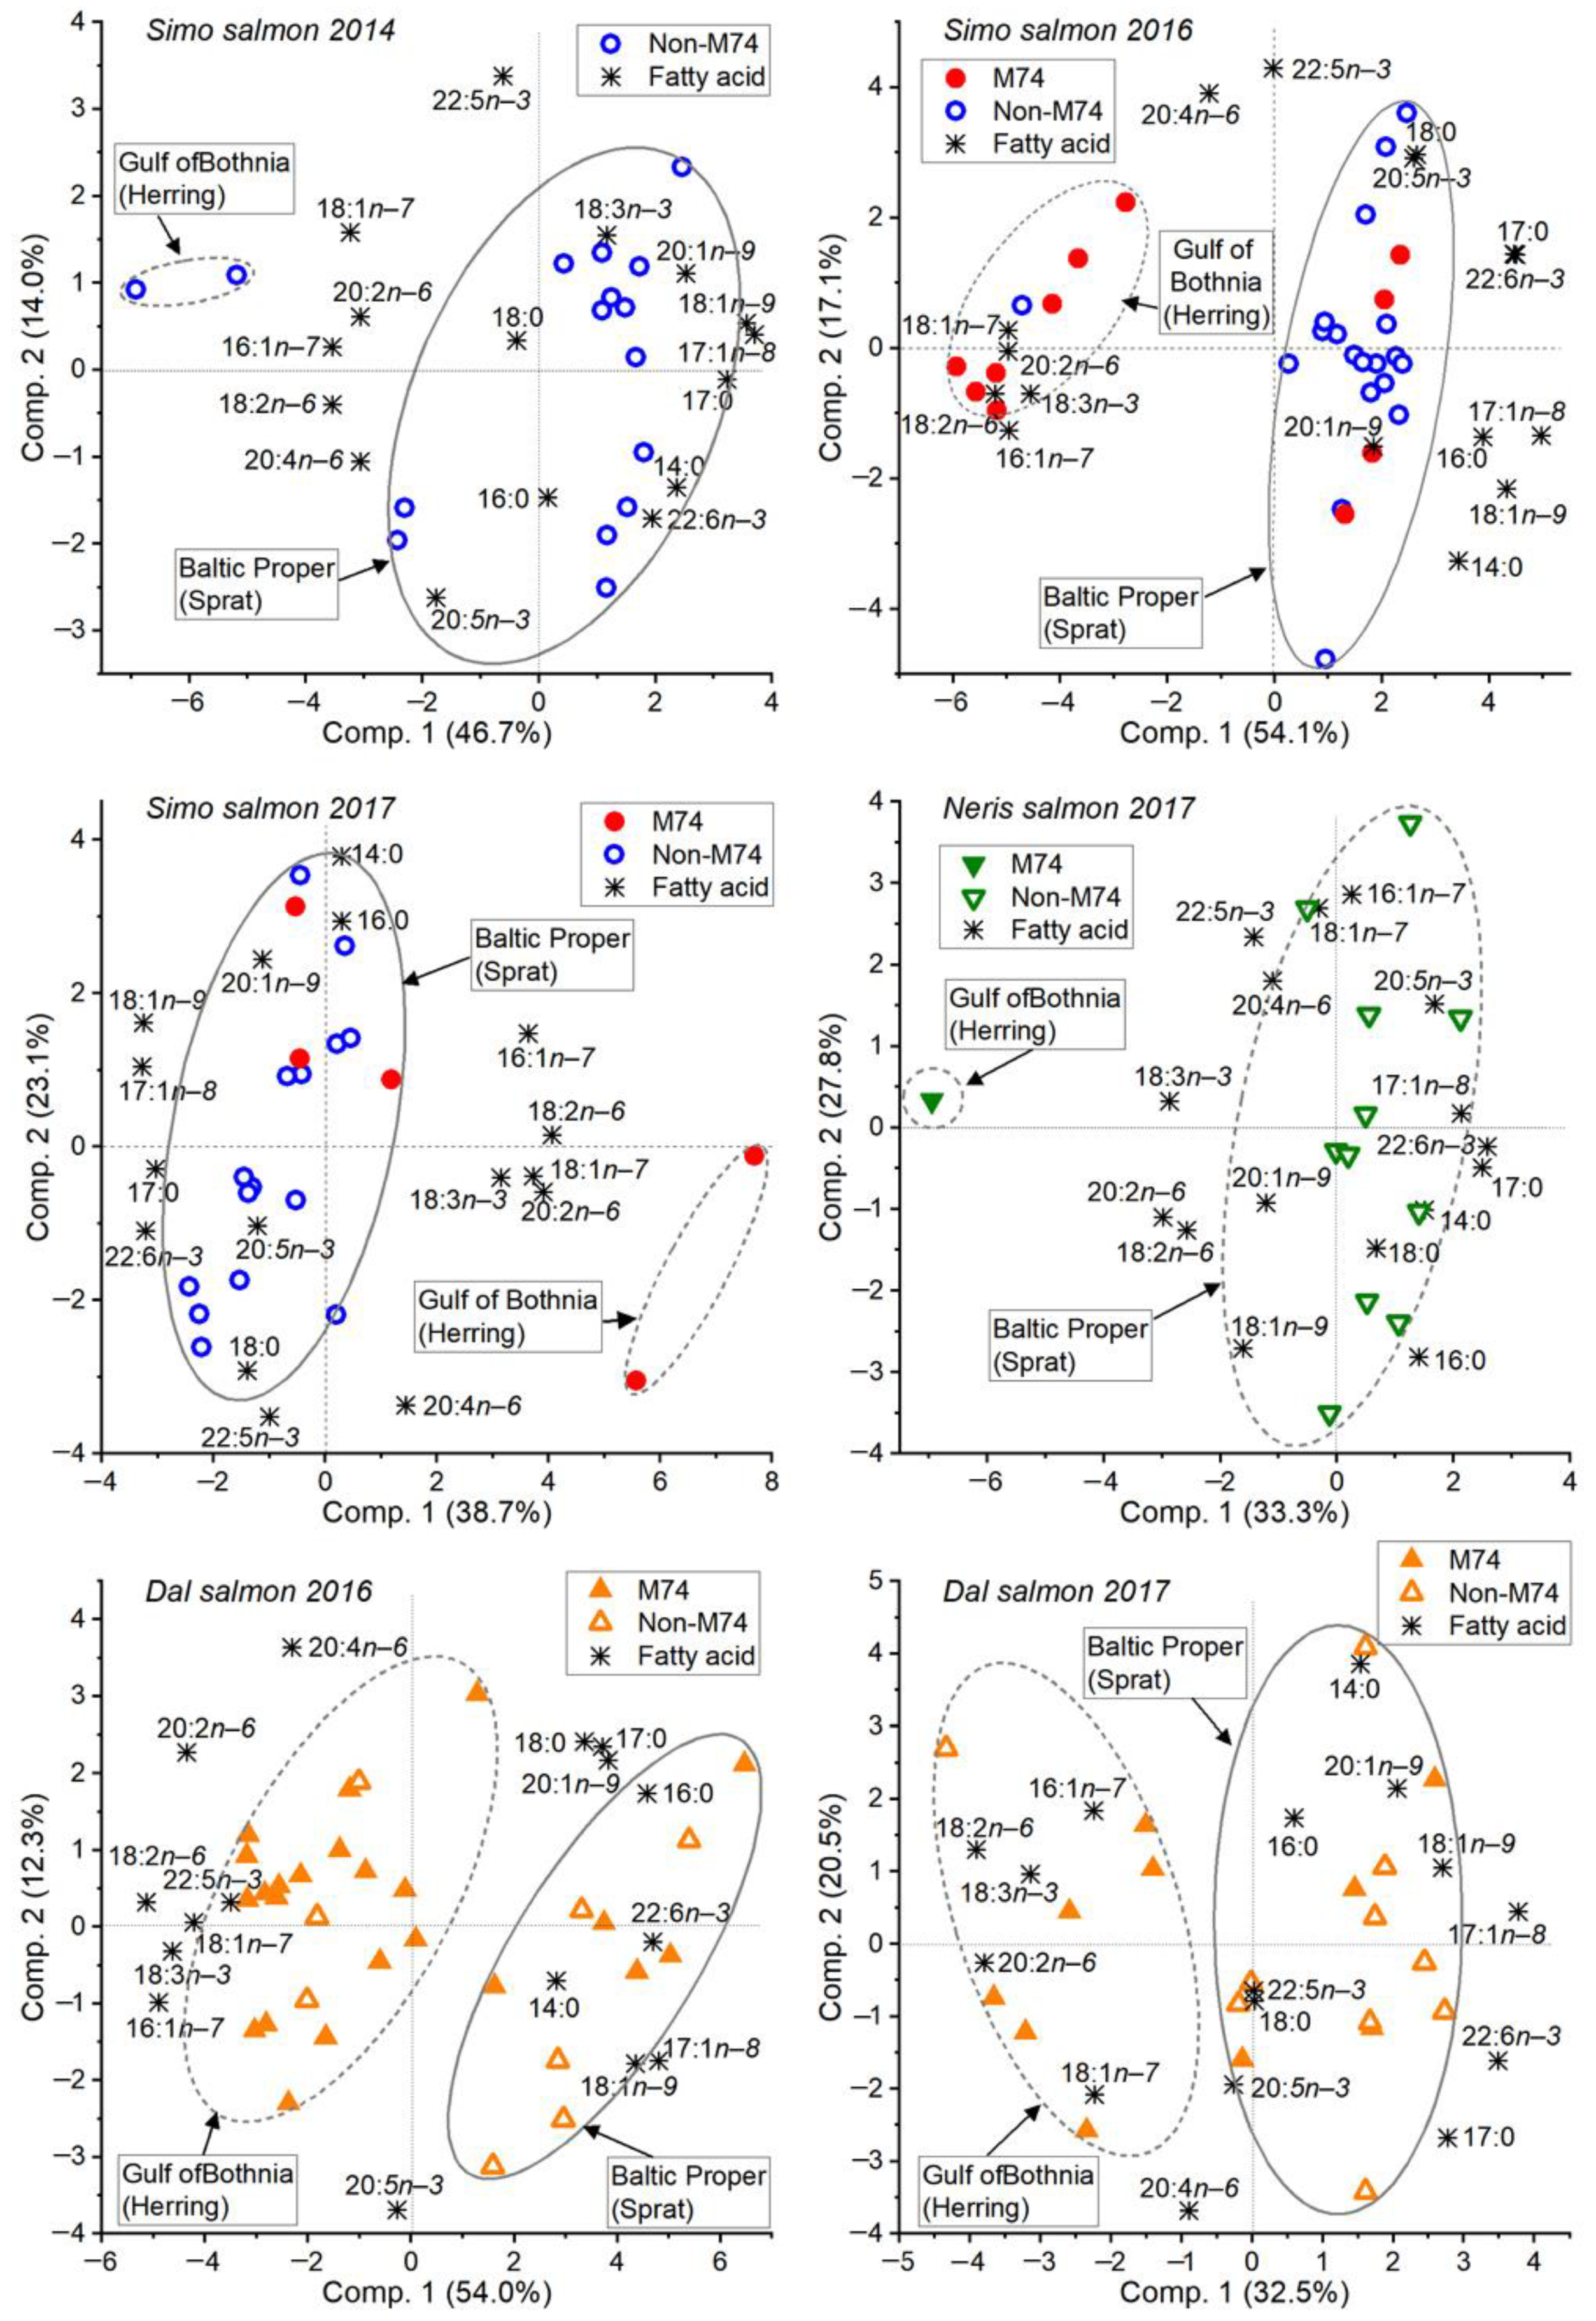
3.2. Feeding History Could Be Determined from the Fatty Acid Composition of Both Eggs and Muscle

The River Simojoki salmon that returned to spawn in 2014 and 2016 were classified into two feeding areas (the Baltic Proper or the Gulf of Bothnia) of the Baltic Sea by determining their main prey fish (sprat or herring) by FASA using the FA proportions of muscle or eggs (Figure 3). Principal components PC1 and PC2 explained 59.6% of the variation for muscle and 59.9% of the variation for eggs, with PC1 depicting feeding spatial distribution and PC2 depicting prey fish consumption. The FASA of both muscle and eggs classified the same individuals into each sea area. In 2014, only two out of sixteen (13%) of the River Simojoki salmon had been feeding in the Gulf of Bothnia, but in 2016, as many as eight out of thirty (27%) had remained to feed there (Figure 3 and Figure 4). Females that ascended in 2014 had a high median THIAM concentration (5.29 nmol g−1, Figure 2) in the eggs and no M74 females. The females in 2016 had a low egg median THIAM concentration (0.96 nmol g−1, Figure 2), resulting in a high proportion of M74 females (35%, Figure 2).
When comparing the muscle FA proportions of the River Simojoki salmon of the M74 year 2016 between the feeding areas, both DHA and total n−3 PUFAs were found in higher proportions in salmon from the Baltic Proper than in salmon from the Gulf of Bothnia. This was the case even though docosapentaenoic acid (DPA, 22:5n−3) and alpha-linolenic acid (18:3n−3) were present in higher proportions in salmon from the Gulf of Bothnia (Supplementary Table S1). The proportions of sprat-specific FAs 18:1n−9 and 17:1n−8 were significantly higher in females from the Baltic Proper, whereas the proportions of 16:1n−7 and 18:1n−7, typical for herring, were higher in salmon from the Gulf of Bothnia. All individual n−6 PUFAs and total n−6 PUFAs, characteristic of freshwater, were found in higher proportions in the muscle of Gulf of Bothnia salmon than Baltic Proper salmon (Supplementary Table S1).
Likewise, in salmon eggs of the M74 year 2016, the proportions of DHA, 18:1n−9, and 17:1n−8 were higher in females from the Baltic Proper than from the Gulf of Bothnia (Supplementary Table S1). On the other hand, all individual n−6 PUFAs and total n−6 PUFAs, as well as 18:3n−3, 16:1n−7, and 18:1n−7, were present in significantly higher proportions in the eggs of females from the Gulf of Bothnia. In addition, the proportions of the major SFA palmitic acid (16:0) and total SFAs in eggs were significantly higher in salmon from the Baltic Proper, whereas the proportion of total PUFAs was significantly higher in salmon from the Gulf of Bothnia (Supplementary Table S1).
Figure 4. Proportions of salmon from the Rivers Simojoki, Dal, and Neris in 2014, 2016, and 2017 that, based on the fatty acid signatures of eggs, (a) had been on their feeding migration in the Baltic Proper or Gulf of Bothnia, and (b) the proportions of M74 females (egg THIAM ≤ 0.71 nmol g−1 [8]) from the Baltic Proper and Gulf of Bothnia. The total numbers of salmon females for each river in each year are given in parentheses.
Fishes 09 00058 g004

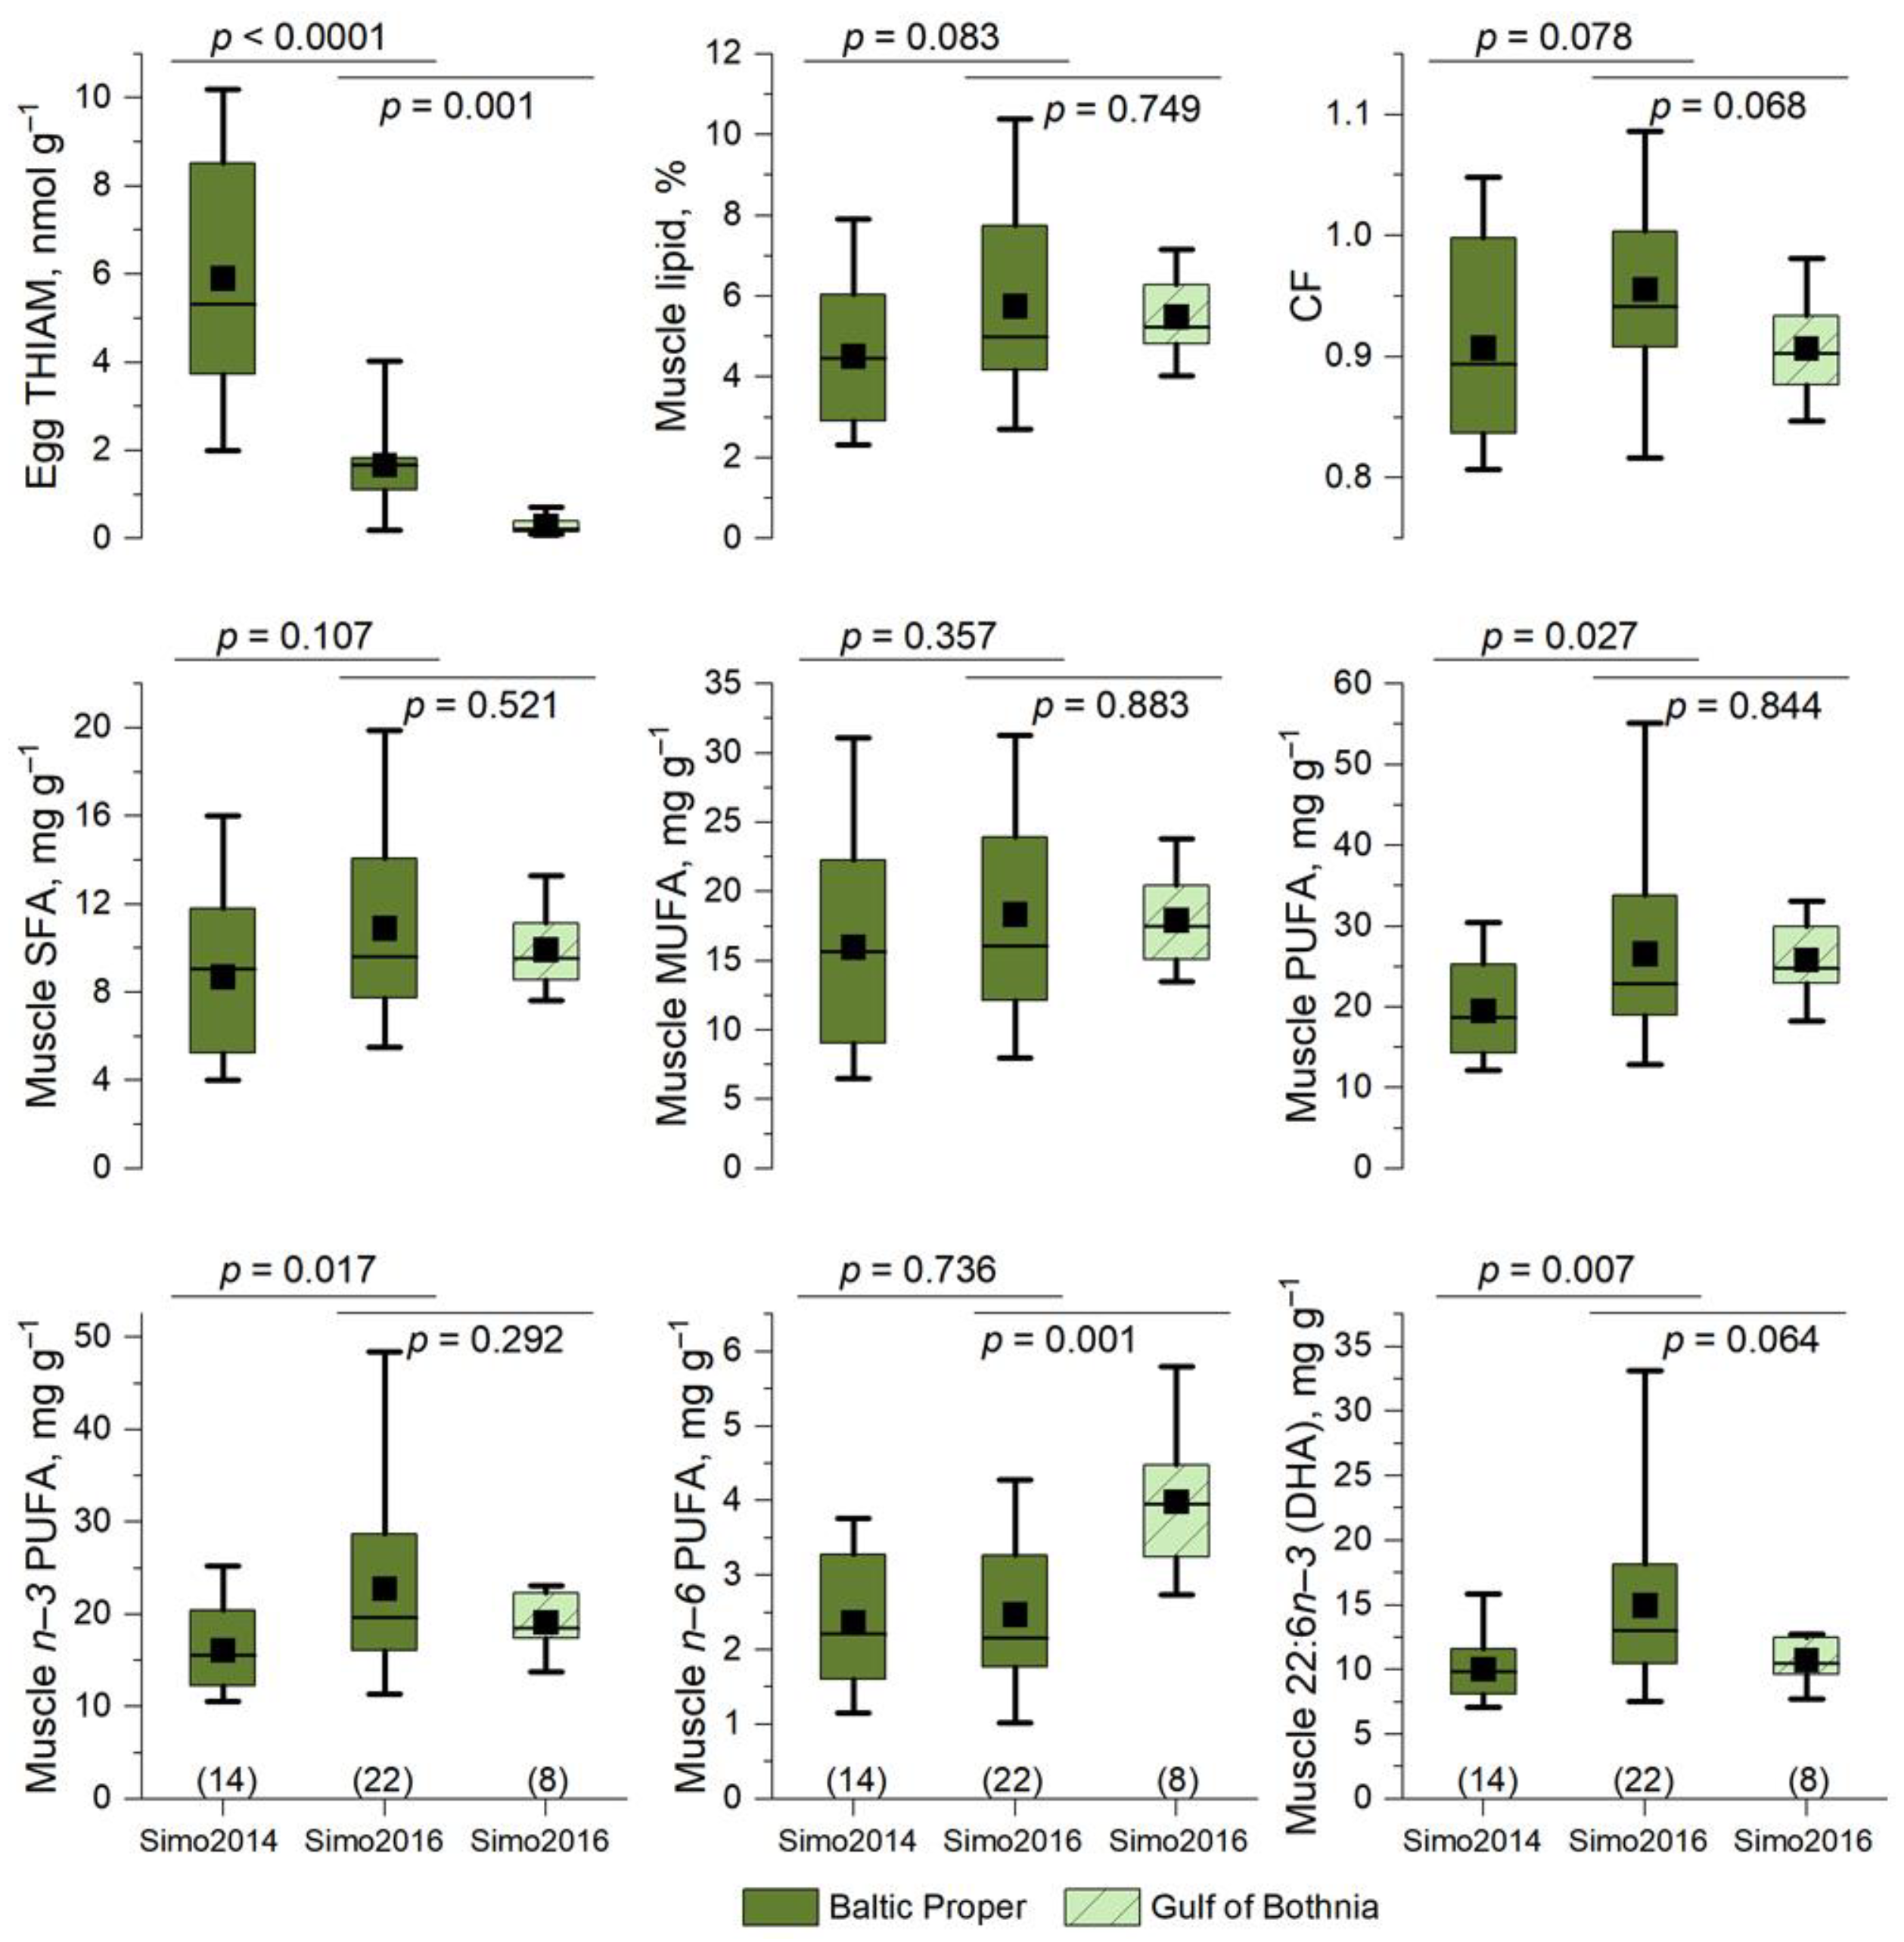
3.3. Differences in Lipid Content and Fatty Acid Composition between Muscle and Eggs of the River Simojoki Salmon

Lipid content was significantly higher in eggs than in muscle in 2014 and 2016 for salmon females that had been feeding in the Baltic Proper (Figure 5). In 2014, the lipid percentage of the eggs was 2.1 times that of muscle, whereas in 2016, the difference was smaller (1.5 times). Similarly, for the 2016 salmon from the Gulf of Bothnia, the lipid percentage was 1.5 times and significantly (p < 0.001) higher in eggs (8.2 ± 0.5%) than in muscle (5.5 ± 0.4%) (Supplementary Table S1).
When the FA proportions and concentrations in the muscle and eggs of salmon that had been feeding in the Baltic Proper were compared, PUFAs were the most common FA class in 2014 and 2016 in both sample types (Figure 5 and Figure S1). The second most common was MUFAs, and the proportion and concentration of SFAs were much lower. Among the individual FAs, DHA was the major FA in muscle in 2016, but the proportions of DHA and 18:1n−9 were similar in 2014. Unlike in muscle, the most common FA in eggs was 18:1n−9 and then DHA, and the third, as in muscle, was 16:0 in both years (Figure 5 and Figure S1).
In 2016, the proportions of DHA, as well as n−3 PUFAs and total PUFAs, were higher in muscle than in eggs for the salmon from the Baltic Proper, despite the fact that the proportions of minor n−3 PUFAs eicosapentaenoic acid (EPA, 20:5n−3), DPA, and 18:3n−3, as well as the proportion of a n−6 PUFA ARA, were higher in eggs (Figure 5). The proportions of 18:1n−9 and total MUFAs were higher in eggs than in muscle in 2016. In 2014, the proportions of DHA and total n−3 PUFAs were also higher in muscle than in eggs, and the proportions of EPA, 18:3n−3, and ARA were higher in eggs. There was no significant difference between eggs and muscle in the proportion of 16:0 or total SFAs in either year in salmon from the Baltic Proper (Figure 5), but their concentrations were significantly higher in eggs than in muscle (Supplementary Figure S1).
Figure 5. Lipid content (per fresh mass of muscle or eggs) and fatty acid (FA) profiles (percentage per total FAs) with sums of structural classes of FAs in muscle and unfertilized eggs of salmon ascending the River Simojoki in the non-M74 year 2014 and in the M74 year 2016 that had been feeding in the Baltic Proper. A different lower-case letter indicates a significant (p < 0.05) difference in the FA proportion between muscle and eggs in either year (vertical comparison), and an upper-case letter indicates a significant (p < 0.05) difference between 2014 and 2016 in either muscle or eggs (horizontal comparison). The number of observations (N) is indicated.
Fishes 09 00058 g005
Considering differences in the muscle of salmon from the Baltic Proper between the years, the proportion and concentration of DHA were significantly higher in the M74 year 2016. In contrast, the proportion, but not concentration, of 18:1n−9 and total MUFAs with some minor FAs, e.g., 18:3n−3, were higher in the non-M74 year 2014 than in 2016 (Figure 5 and Figure S1).
Despite the fact that lipid content in the muscle of salmon from the Baltic Proper tended to be higher in 2016 than in 2014 (Figure 5), the lipid content of the eggs was significantly lower in 2016 than in 2014. The differences in the FA proportions between 2014 and 2016 were not as high in eggs as in muscle. However, the proportions of EPA and DPA were higher in eggs in the M74 year 2016 than in 2014, and the proportion of 18:1n−9, as in muscle, was higher in the non-M74 year than in 2016 (Figure 5).

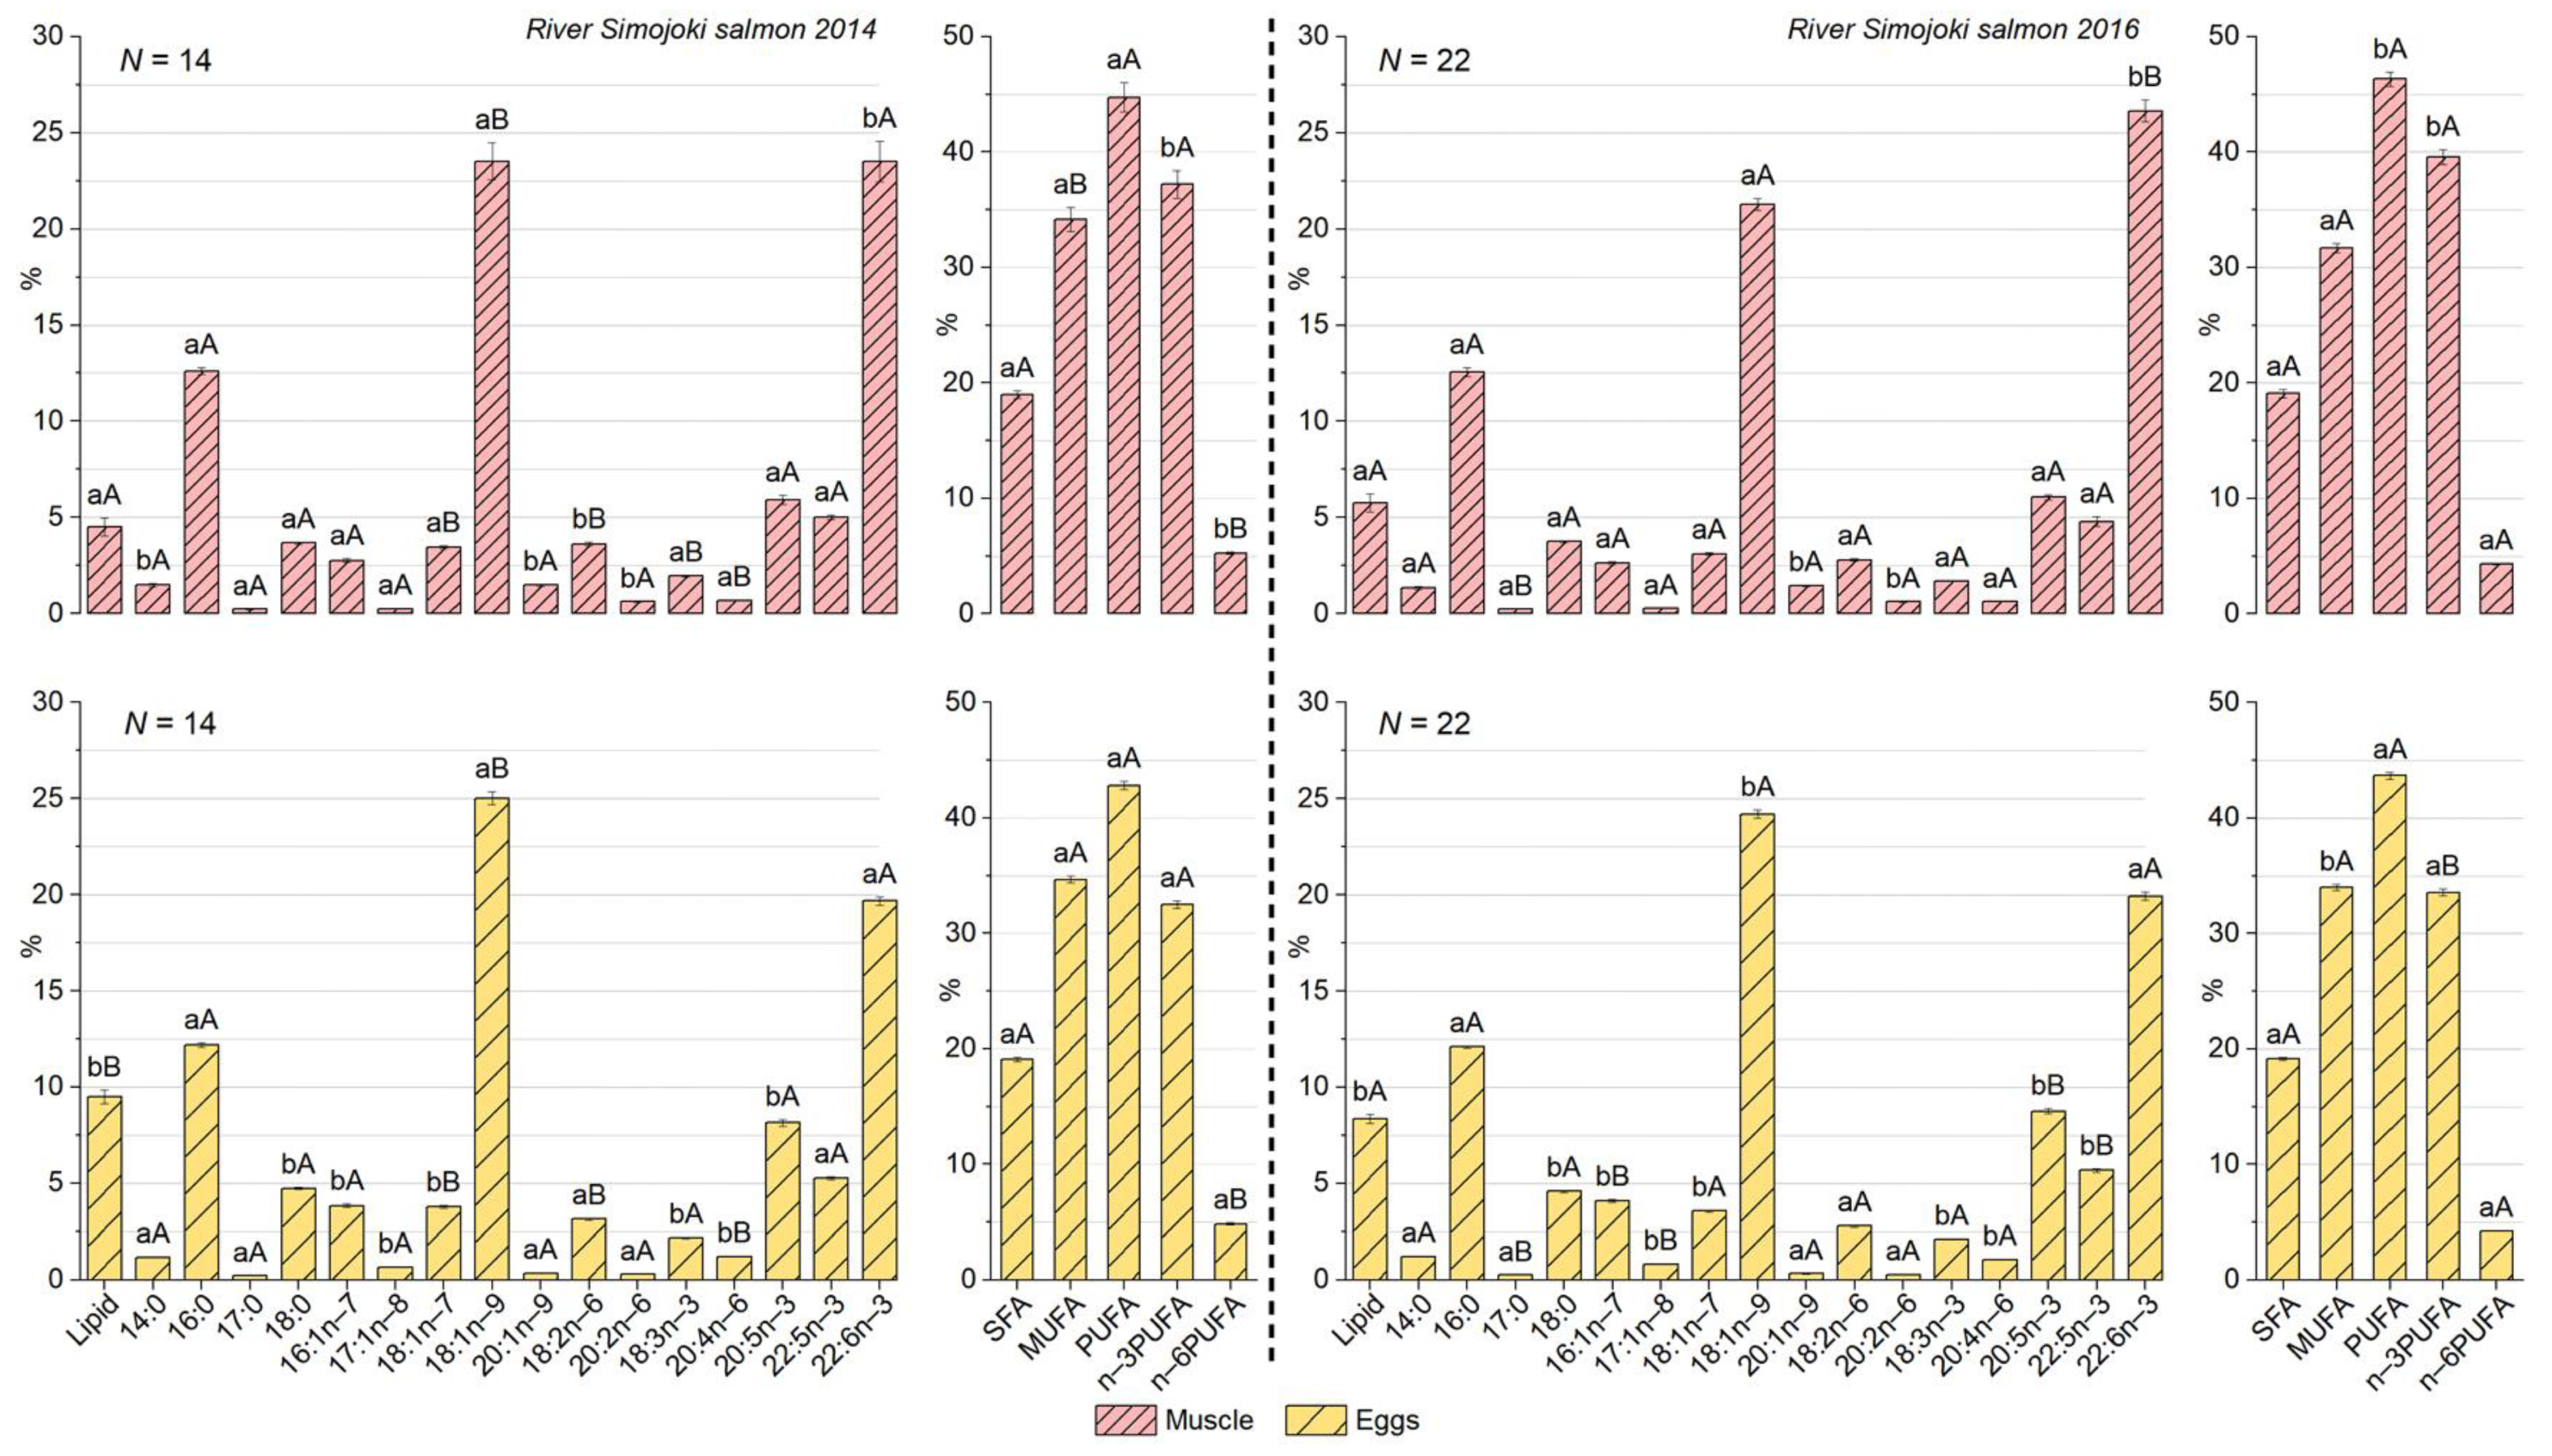
3.4. The Proportion of PUFAs in Eggs Was Higher for Baltic Salmon Than for Arctic Ocean Salmon

The River Tenojoki salmon that had been feeding in the Barents Sea in the Arctic Ocean had a significantly (p < 0.01, PCA followed by SIMCA) different egg FA composition than the River Simojoki salmon in 2014, 2016, and 2017 (Figure 6a). The River Simojoki salmon were grouped as two feeding groups, and the Arctic Ocean salmon were in one group. PC1 and PC2 explained 61.7% of the FA profile variation, of which PC1 depicted spatial differences, while PC2 reflected the feeding habits. According to the PCA biplot, the proportions of gondoic acid (20:1n−9) and 14:0 were strongly and positively correlated with each other and strongly associated with Arctic Ocean salmon (Figure 6a). In contrast, 18:3n−3, ARA, 18:2n−6, and 20:2n−6 were strongly and positively correlated with each other in the PCA biplot and associated with the Gulf of Bothnia feeding group of the River Simojoki salmon (Figure 6a). According to PCA, 18:1n−9 and DHA were enriched in the Baltic Proper feeding group. Arctic Ocean salmon and the Gulf of Bothnia feeding group were characterized by FAs 16:1n−7 and 18:1n−7 (Figure 6a), which were linked to Baltic herring feeding on benthic invertebrates.
The proportions of DHA and total n−3 PUFAs were lower in the eggs of Arctic Ocean salmon than in the eggs of the River Simojoki and River Dal salmon, as were n−6 PUFAs and total PUFAs, with the exception of DPA, which had a higher proportion in Arctic Ocean salmon (Supplementary Table S2). In contrast, the proportions of 14:0 and total SFAs, and a minor MUFA 20:1n−9, were significantly higher in the eggs of Arctic Ocean salmon (Supplementary Table S2).
Overall, Arctic Ocean salmon were separated (p < 0.01, SIMCA) from the Baltic salmon ascending the Rivers Simojoki, Dal, and Neris based on the FA proportion of the eggs in the PCA biplot (Figure 6b). PC1 and PC2 together explained 55.9% of the FA profile variation, with PC1 depicting the feeding area and PC2 depicting prey species. Baltic salmon were clustered around the origin so that the positive end of the cluster was positioned toward the FAs indicating feeding in the Baltic Proper, and the negative end of the culster was positioned toward the FAs indicating feeding in the Gulf of Bothnia (Figure 6b).
The FAs characteristic of Arctic Ocean salmon differed from the FA signatures of all Baltic salmon (Figure 6b) in much the same way as from those of the River Simojoki salmon alone (Figure 6a). Arctic Ocean salmon contained only little n−6 PUFAs and low proportions of n−3 PUFAs, DHA, and 18:3n−3 but were enriched with DPA (Supplementary Table S2). The difference in the FA composition between Arctic Ocean and Baltic salmon is also seen in the proportions of DHA and total n−3 PUFAs in the eggs, which were significantly lower for Arctic Ocean salmon than for the River Simojoki salmon (in 2014, 2016, and 2017) or the River Dal salmon (in 2016 and 2017) and the River Neris salmon (in 2017) (Supplementary Table S2). The PCA biplot associated Arctic Ocean salmon with a low proportion of the most common MUFA 18:1n−9, as expected based on its lower proportion in the eggs of Arctic Ocean salmon than in the eggs of Baltic salmon (Supplementary Table S2). Instead, Arctic Ocean salmon were rich in the major SFA 16:0, which was also enriched in the Baltic salmon feeding in the Baltic Proper. The MUFAs 18:1n−7 and 16:1n−7 and DPA were typical of salmon feeding on herring in the Gulf of Bothnia (Figure 6).

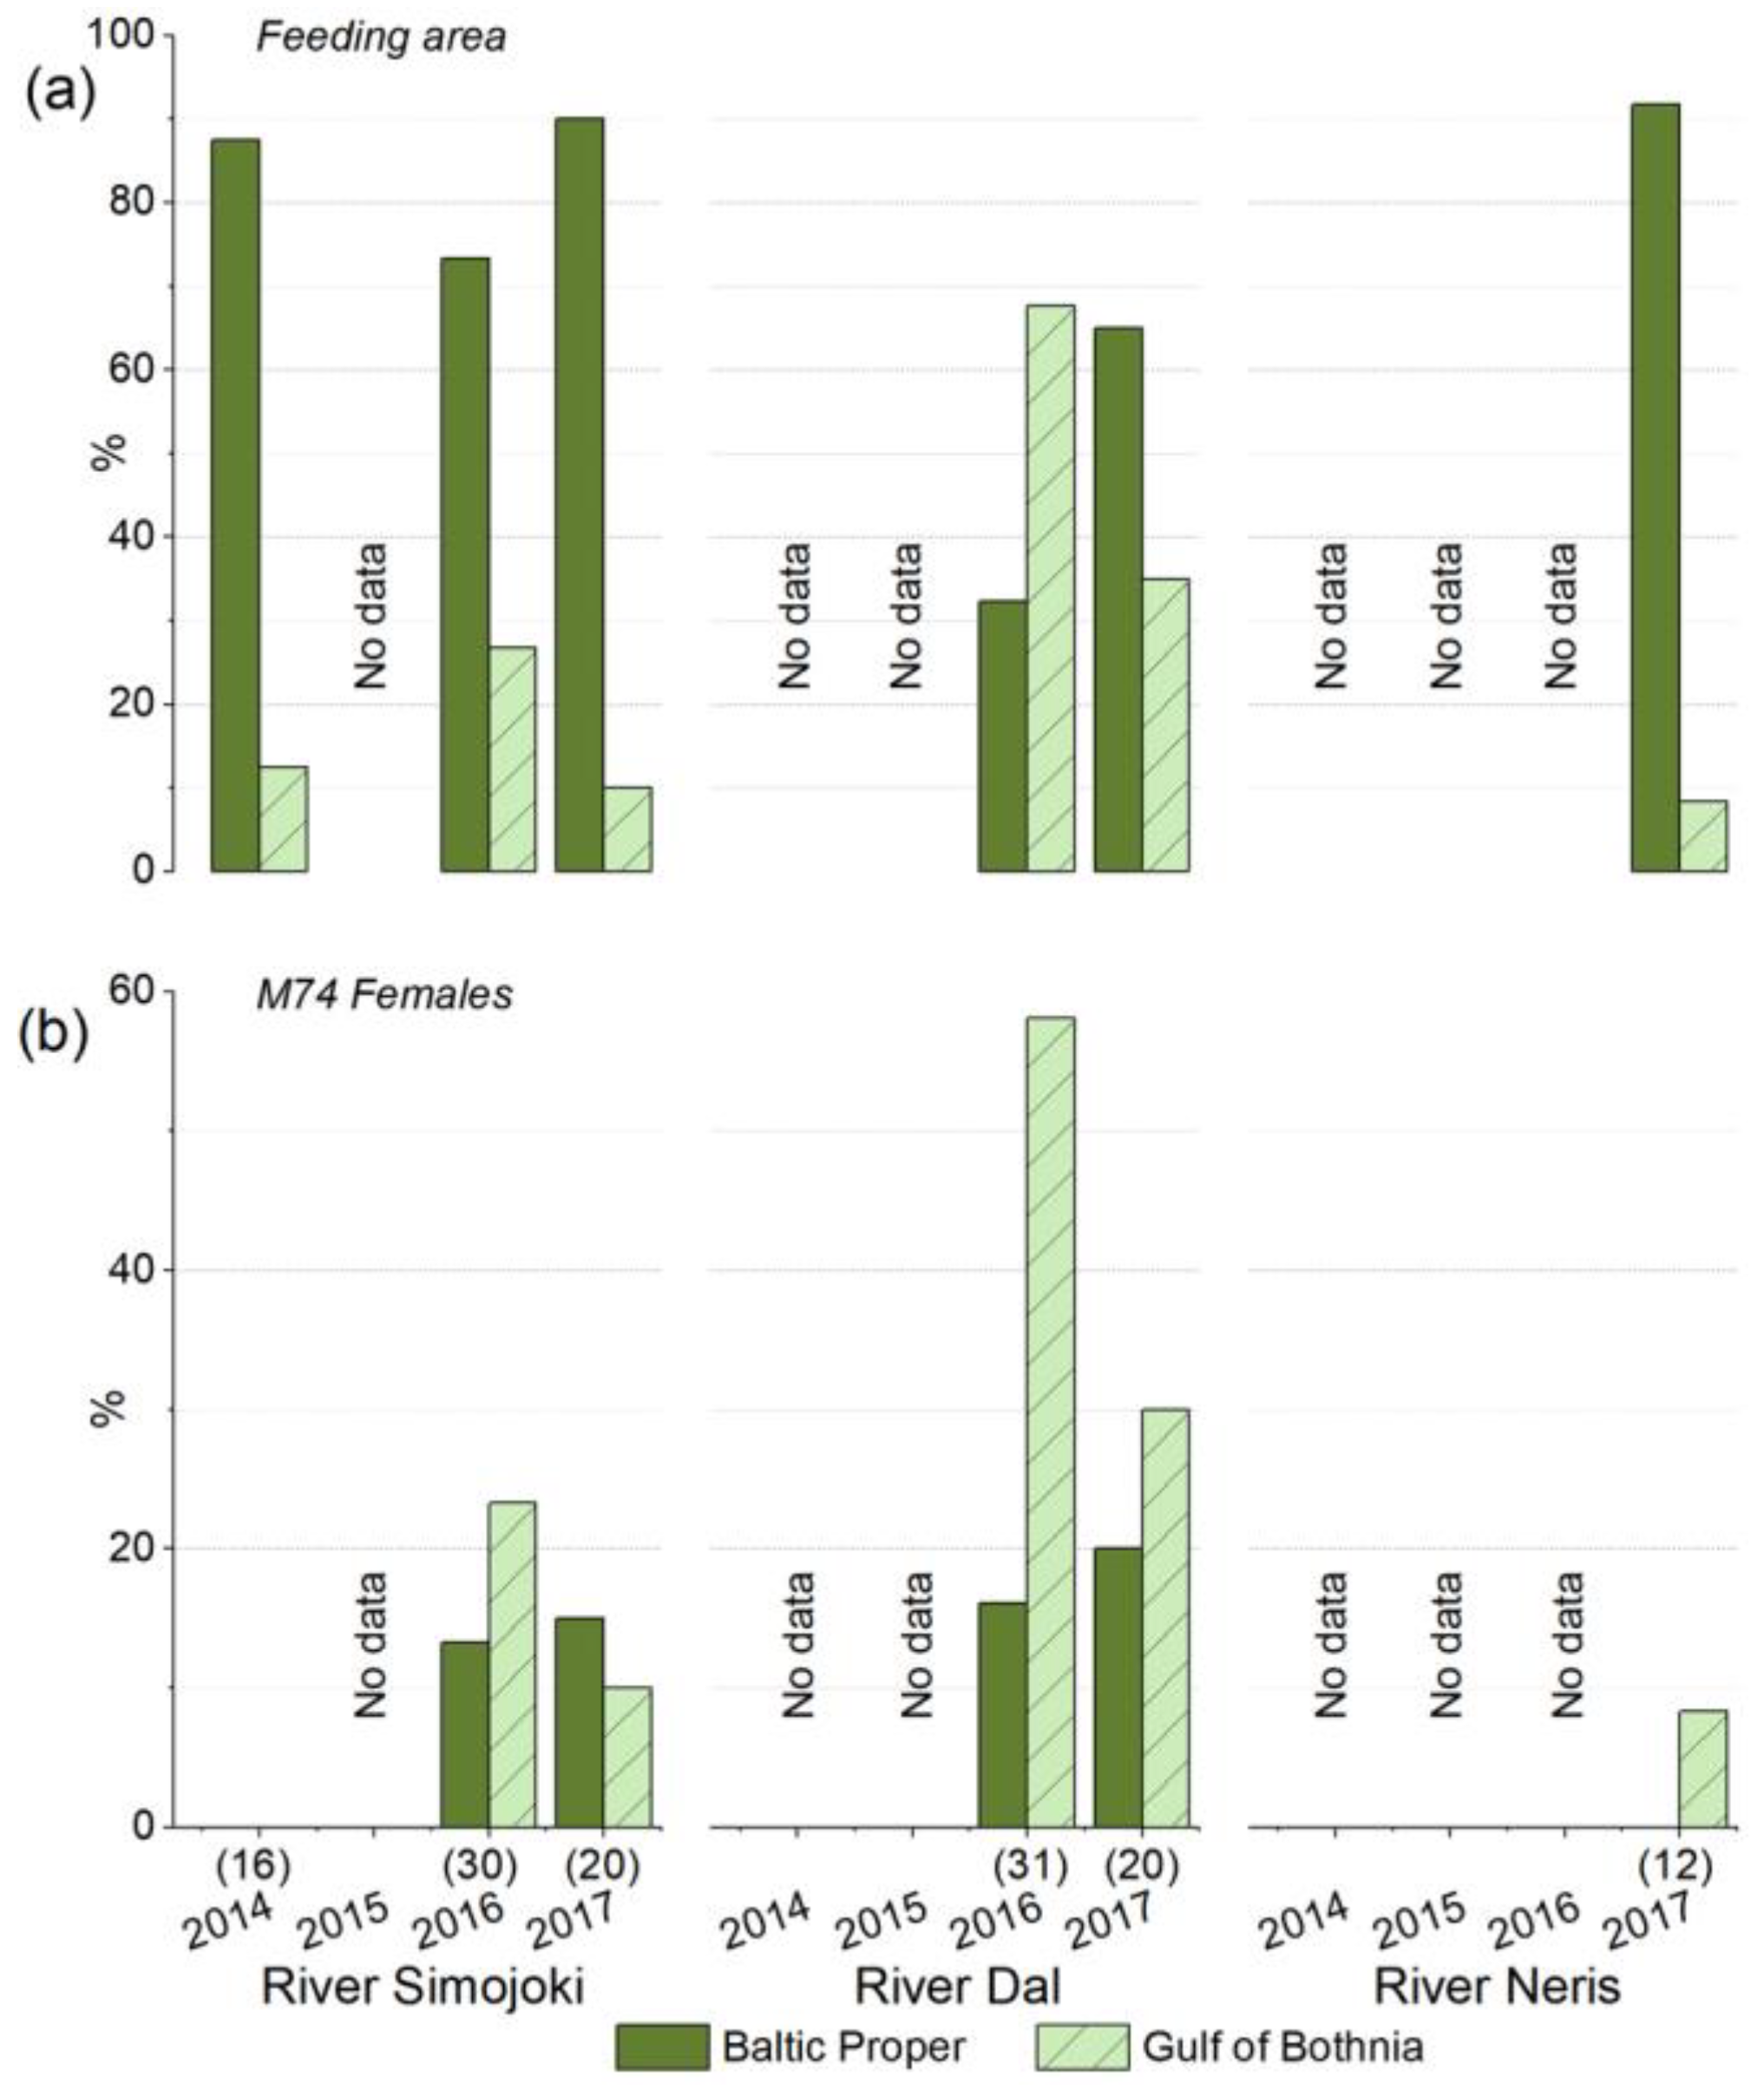
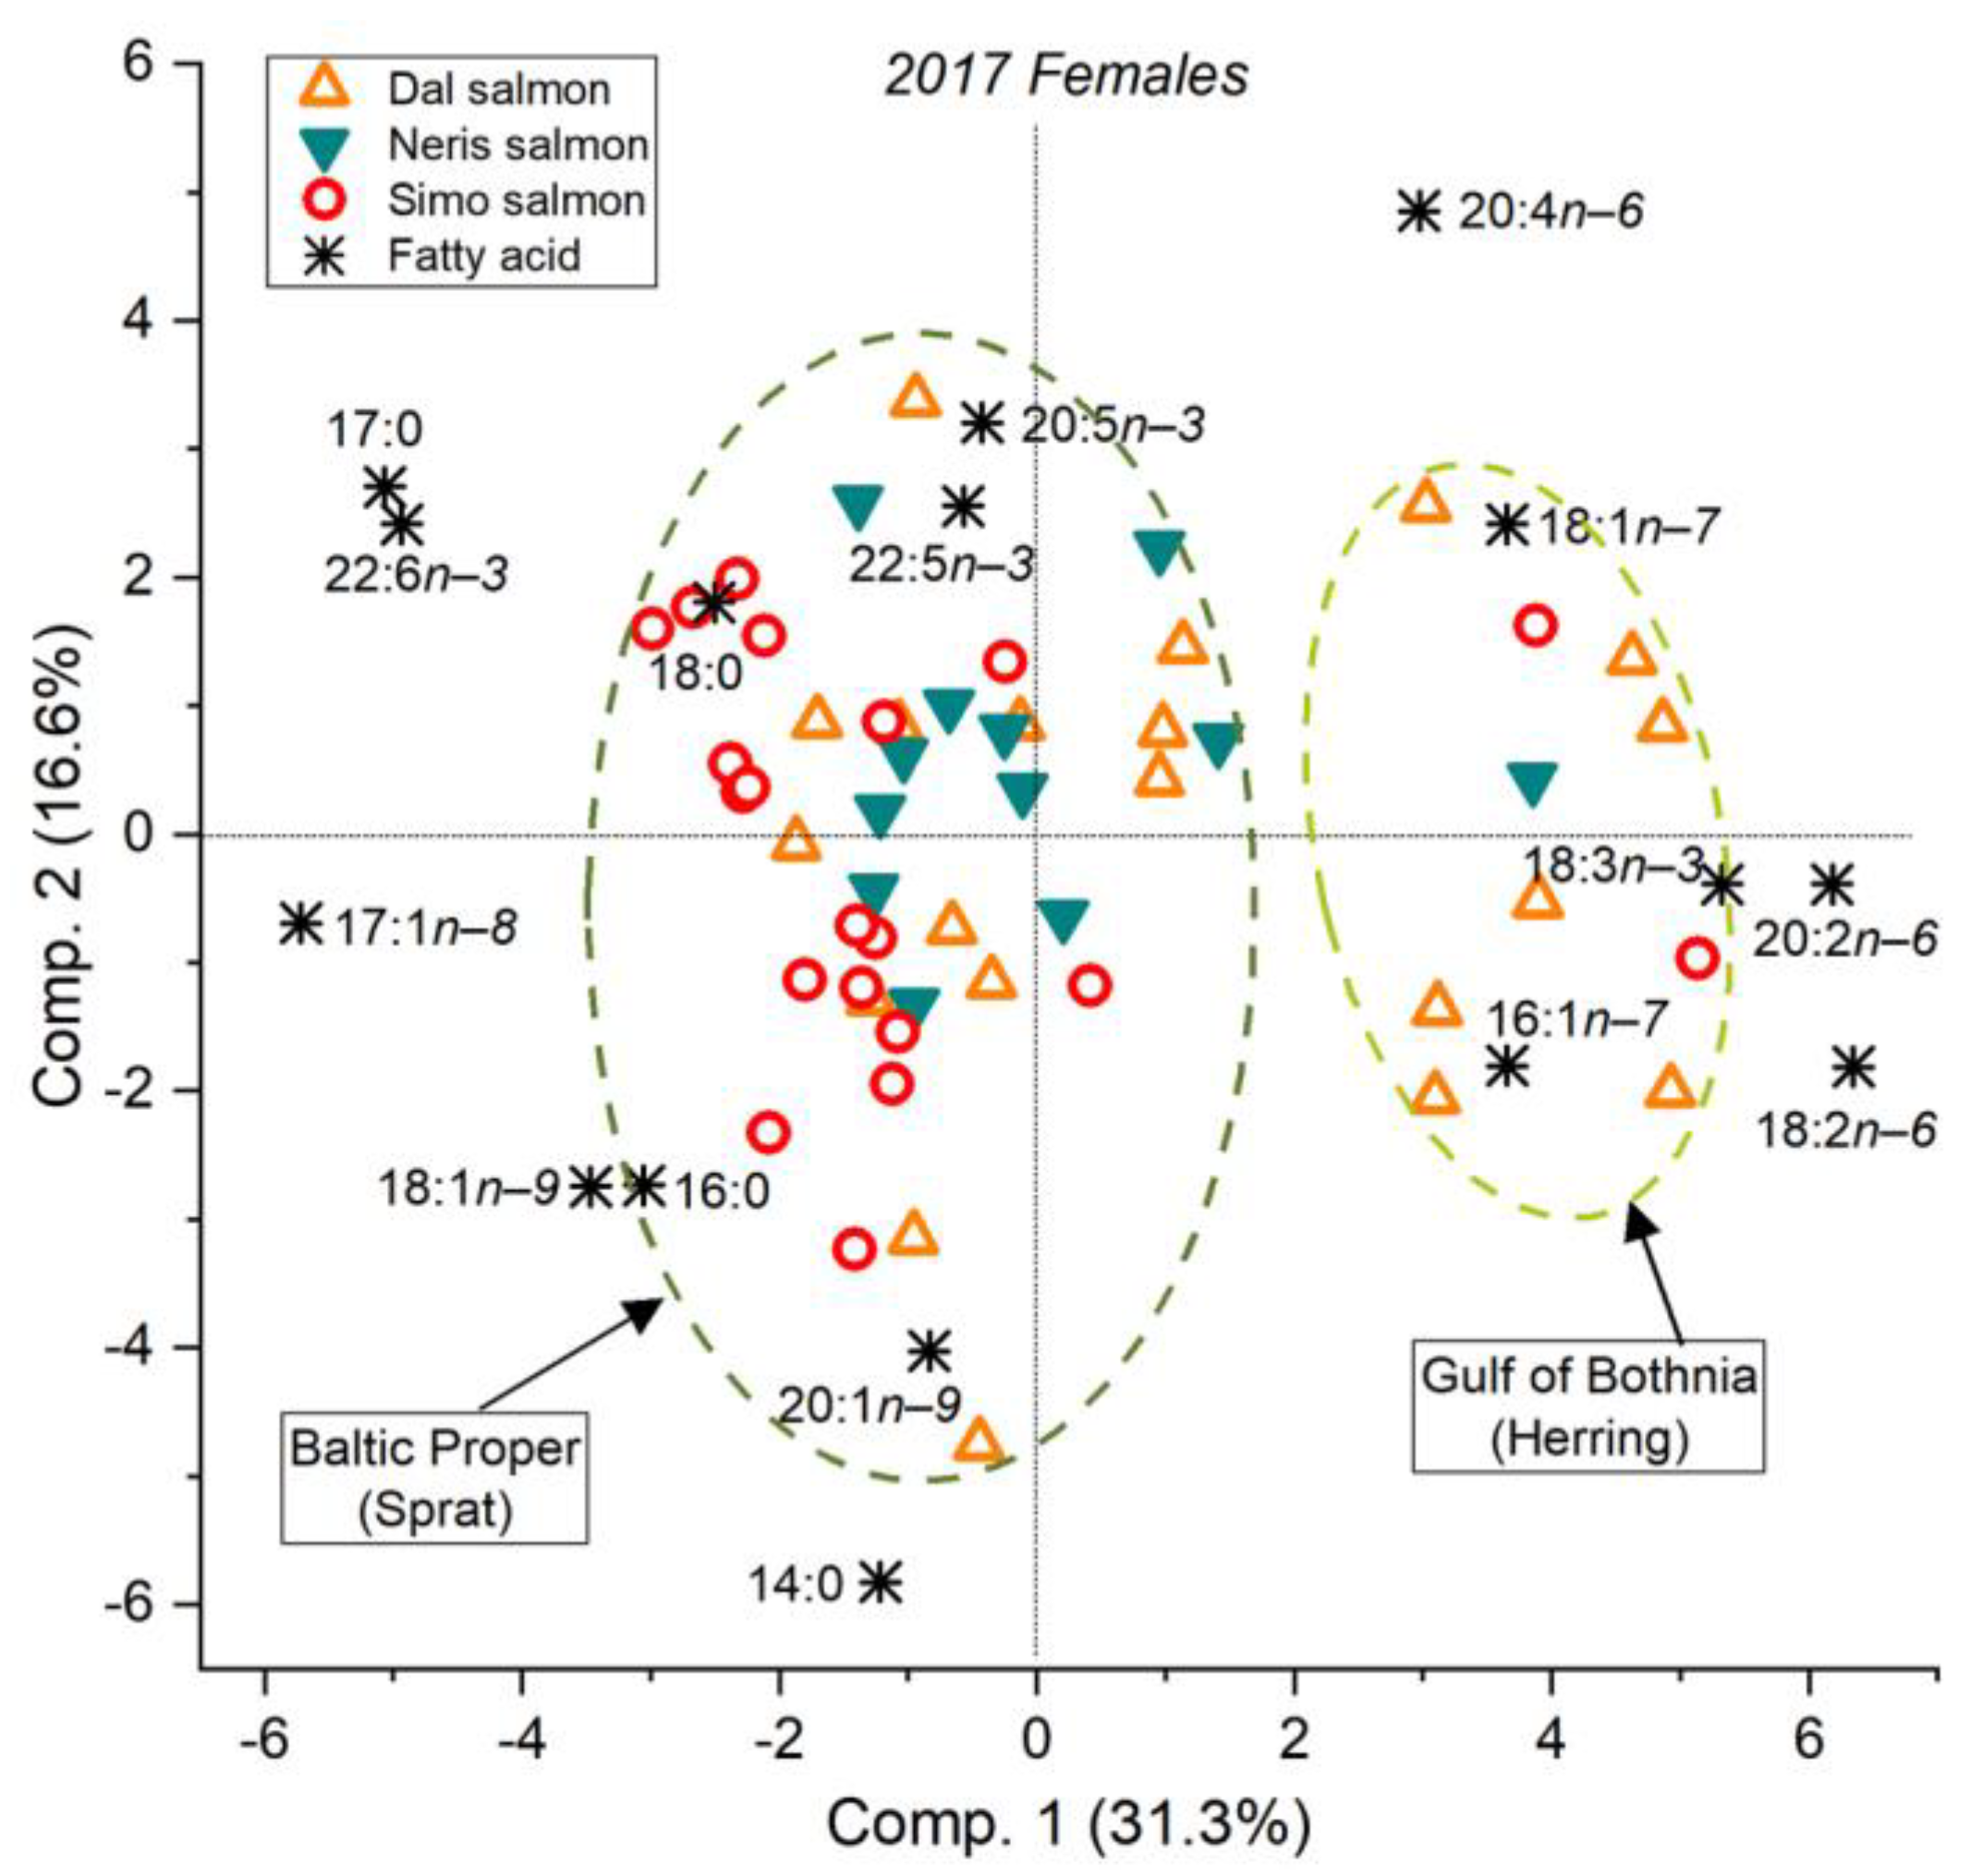
3.5. The River Dal Salmon Feed More in the Gulf of Bothnia Than the River Simojoki Salmon

Based on FASA of eggs, the percentage of the 2016 River Simojoki salmon that had remained to feed in the Gulf of Bothnia instead of continuing to the Baltic Proper was twice the percentage detected in 2014 and 2017 (Figure 4). While in 2014 and 2017, only 10 and 13% of the River Simojoki salmon, respectively, had been feeding in the Gulf of Bothnia, in 2016, the percentage was 27%. However, for the River Dal salmon, as much as 68% of the 2016 females and 35% of the 2017 females remained in the Gulf of Bothnia without continuing their migration south (Figure 4). For the River Neris salmon, <10% of 2017 females migrated from the southern Baltic Proper to the Gulf of Bothnia to feed (Figure 4).
In the eggs of the 2016 salmon that had been feeding in the Baltic Proper, the proportions of DHA, n−3 PUFAs, n−6 PUFAs, and total PUFAs were higher for the River Dal salmon than for the River Simojoki salmon. In contrast, the eggs of the River Simojoki salmon contained 14:0 and 17:1n−8, indicators of feeding on sprat in the southern Baltic Sea, in higher proportions, in addition to SFAs (Supplementary Table S2). In the eggs of 2016 salmon that had been feeding in the Gulf of Bothnia, there were also some significant differences between the reared River Dal salmon and the wild River Simojoki salmon, e.g., n−3 PUFAs and total PUFAs were found in higher proportions in the River Dal salmon eggs, and SFAs were found in higher proportions in the River Simojoki salmon eggs (Supplementary Table S2). Despite some differences in egg FA composition, the females of the Rivers Simojoki and Dal collected in 2016 did not differ significantly, depending on feeding in the Baltic Proper or Gulf of Bothnia.
The FA compositions of M74 and non-M74 females among the River Simojoki or River Dal salmon did not differ significantly within the feeding areas in 2016 (Supplementary Figure S2). In contrast, the River Simojoki M74 females were significantly separated from the River Dal M74 and non-M74 females within the Baltic Proper and Gulf of Bothnia (Supplementary Figure S2). As the River Simojoki M74 females in the Baltic Proper were associated in the PCA biplot with high 14:0 and 17:1n−8, they were indicated to have been feeding in the more southern parts of the Baltic Proper than the River Dal M74 and non-M74 females, which, according to the biplot, were associated with high DHA and ARA (Supplementary Figure S2). In the Gulf of Bothnia feeding group, the River Simojoki M74 females were associated with 16:1n−7 and the saturated FAs 16:0 and stearic acid (18:0). In contrast, the River Dal M74 and non-M74 females in the Gulf of Bothnia group were strongly associated with ARA, DHA, EPA, and DPA.
In the 2016 River Simojoki salmon from the Baltic Proper, the lipid content in the muscle of M74 females from the Baltic Proper was 28% higher than in non-M74 females and 5% higher in the eggs. However, the number of M74 females was small, so the differences with non-M74 females were not statistically significant (Table 2). Considering the muscle FA concentrations, the largest differences in the FA classes were in PUFAs, of which the concentrations of DHA and total n−3 PUFAs were 38% and 37% higher in M74 females than in non-M74 females (Table 2). The concentrations of both 18:1n−9 and total MUFAs were 27% higher in M74 females. Although the concentration of SFAs differed the least, with both 16:0 and total SFA concentrations being only 12% higher in M74 than in non-M74 females, the concentration of 14:0 was up to 22% higher in M74 females (Table 2).

3.6. More Salmon Fed in the Gulf of Bothnia when Young Herring Were Abundant

The classification of the 2017 Baltic salmon into two feeding groups, the Baltic Proper and the Gulf of Bothnia, was clear and statistically significant (p < 0.01) in PCA-based SIMCA for all three rivers (Rivers Simojoki, Dal, and Neris) (Figure 7). The River Simojoki and River Dal salmon ascending in 2017 were grouped into two feeding groups, the Baltic Proper and the Gulf of Bothnia (Supplementary Figure S3a,b), in the same way as the 2014 and 2016 River Simojoki salmon (Figure 3). The PCA biplot showed that the River Neris salmon, except for one, had been feeding in the Baltic Proper (Figure 7 and Figure S3c). The females of the Rivers Simojoki, Dal, and Neris from the Baltic Proper did not differ significantly in the fall of 2017 in FASA.
Of the 2017 salmon that had been feeding in the Baltic Proper, the eggs of the River Dal salmon tended to contain higher proportions of 20:2n−6, ARA, and total n−6 PUFAs, typical of the Gulf of Bothnia diet, than the eggs of the River Simojoki salmon (Supplementary Table S2). In contrast, the eggs of the 2017 River Simojoki salmon in the Baltic Proper group tended to contain 16:0 and total SFAs in higher proportions.
In the eggs of the River Neris salmon in 2017, the proportions of DHA, EPA, n−3 PUFAs, and total PUFAs, as well as 18:3n−3, 18:1n−7, and ARA, were or tended to be higher than in the River Simojoki salmon in 2017. In contrast, the proportions of 18:1n−9 and total MUFAs, as well as DPA, were higher in the eggs of the River Simojoki salmon than in those of the River Neris salmon (Supplementary Table S2).
Considering the M74 and non-M74 females of the Rivers Simojoki and Dal from the Baltic Proper in 2017, the River Dal M74 females were significantly (p < 0.05, SIMCA) separated from the River Simojoki M74 and non-M74 females (Supplementary Figure S4). Both of these River Simojoki salmon groups were associated with SFAs 16:0 and 18:0 and MUFAs, especially with 17:1n−8, indicating more sprat in the diet, and additionally, the M74 females with high 14:0, indicating more southern feeding. Instead, the River Dal salmon were associated with ARA and EPA, and the River Dal M74 females were associated with 18:3n−3, 18:2n−6, and 20:2n−6, indicating more feeding in the Gulf of Bothnia.
Running PCA with the egg FA proportions separately for each river and year, with salmon grouped into M74 females and non-M74 females, also showed two feeding areas, the Baltic Proper and the Gulf of Bothnia (Figure 8). PC1 reflected separation according to feeding area, and PC2 reflected separation according to prey species. As a larger proportion of the 2016 salmon had been feeding in the Gulf of Bothnia than of the 2017 salmon, the proportion of M74 salmon that had been feeding there was also larger in 2016 (Figure 4). Then, 23% of the River Simojoki M74 females, whereas in 2017, 10% had been feeding in the Gulf of Bothnia. In 2016, of the River Dal M74 females, more than half, 58%, had been feeding in the Gulf of Bothnia, while 30% of the 2017 M74 females had been feeding there. The differences in the proportion of M74 cases derived from the Gulf of Bothnia between the River Simojoki and River Dal females, therefore, depended on their feeding frequency there. One of the 2016 River Dal M74 females in the Baltic Proper group differed from the others by being associated with the FAs, ARA, 18:0, 20:1n−9, and heptadecanoic acid (17:0), which suggests feeding in the Gulf of Finland (Figure 8).

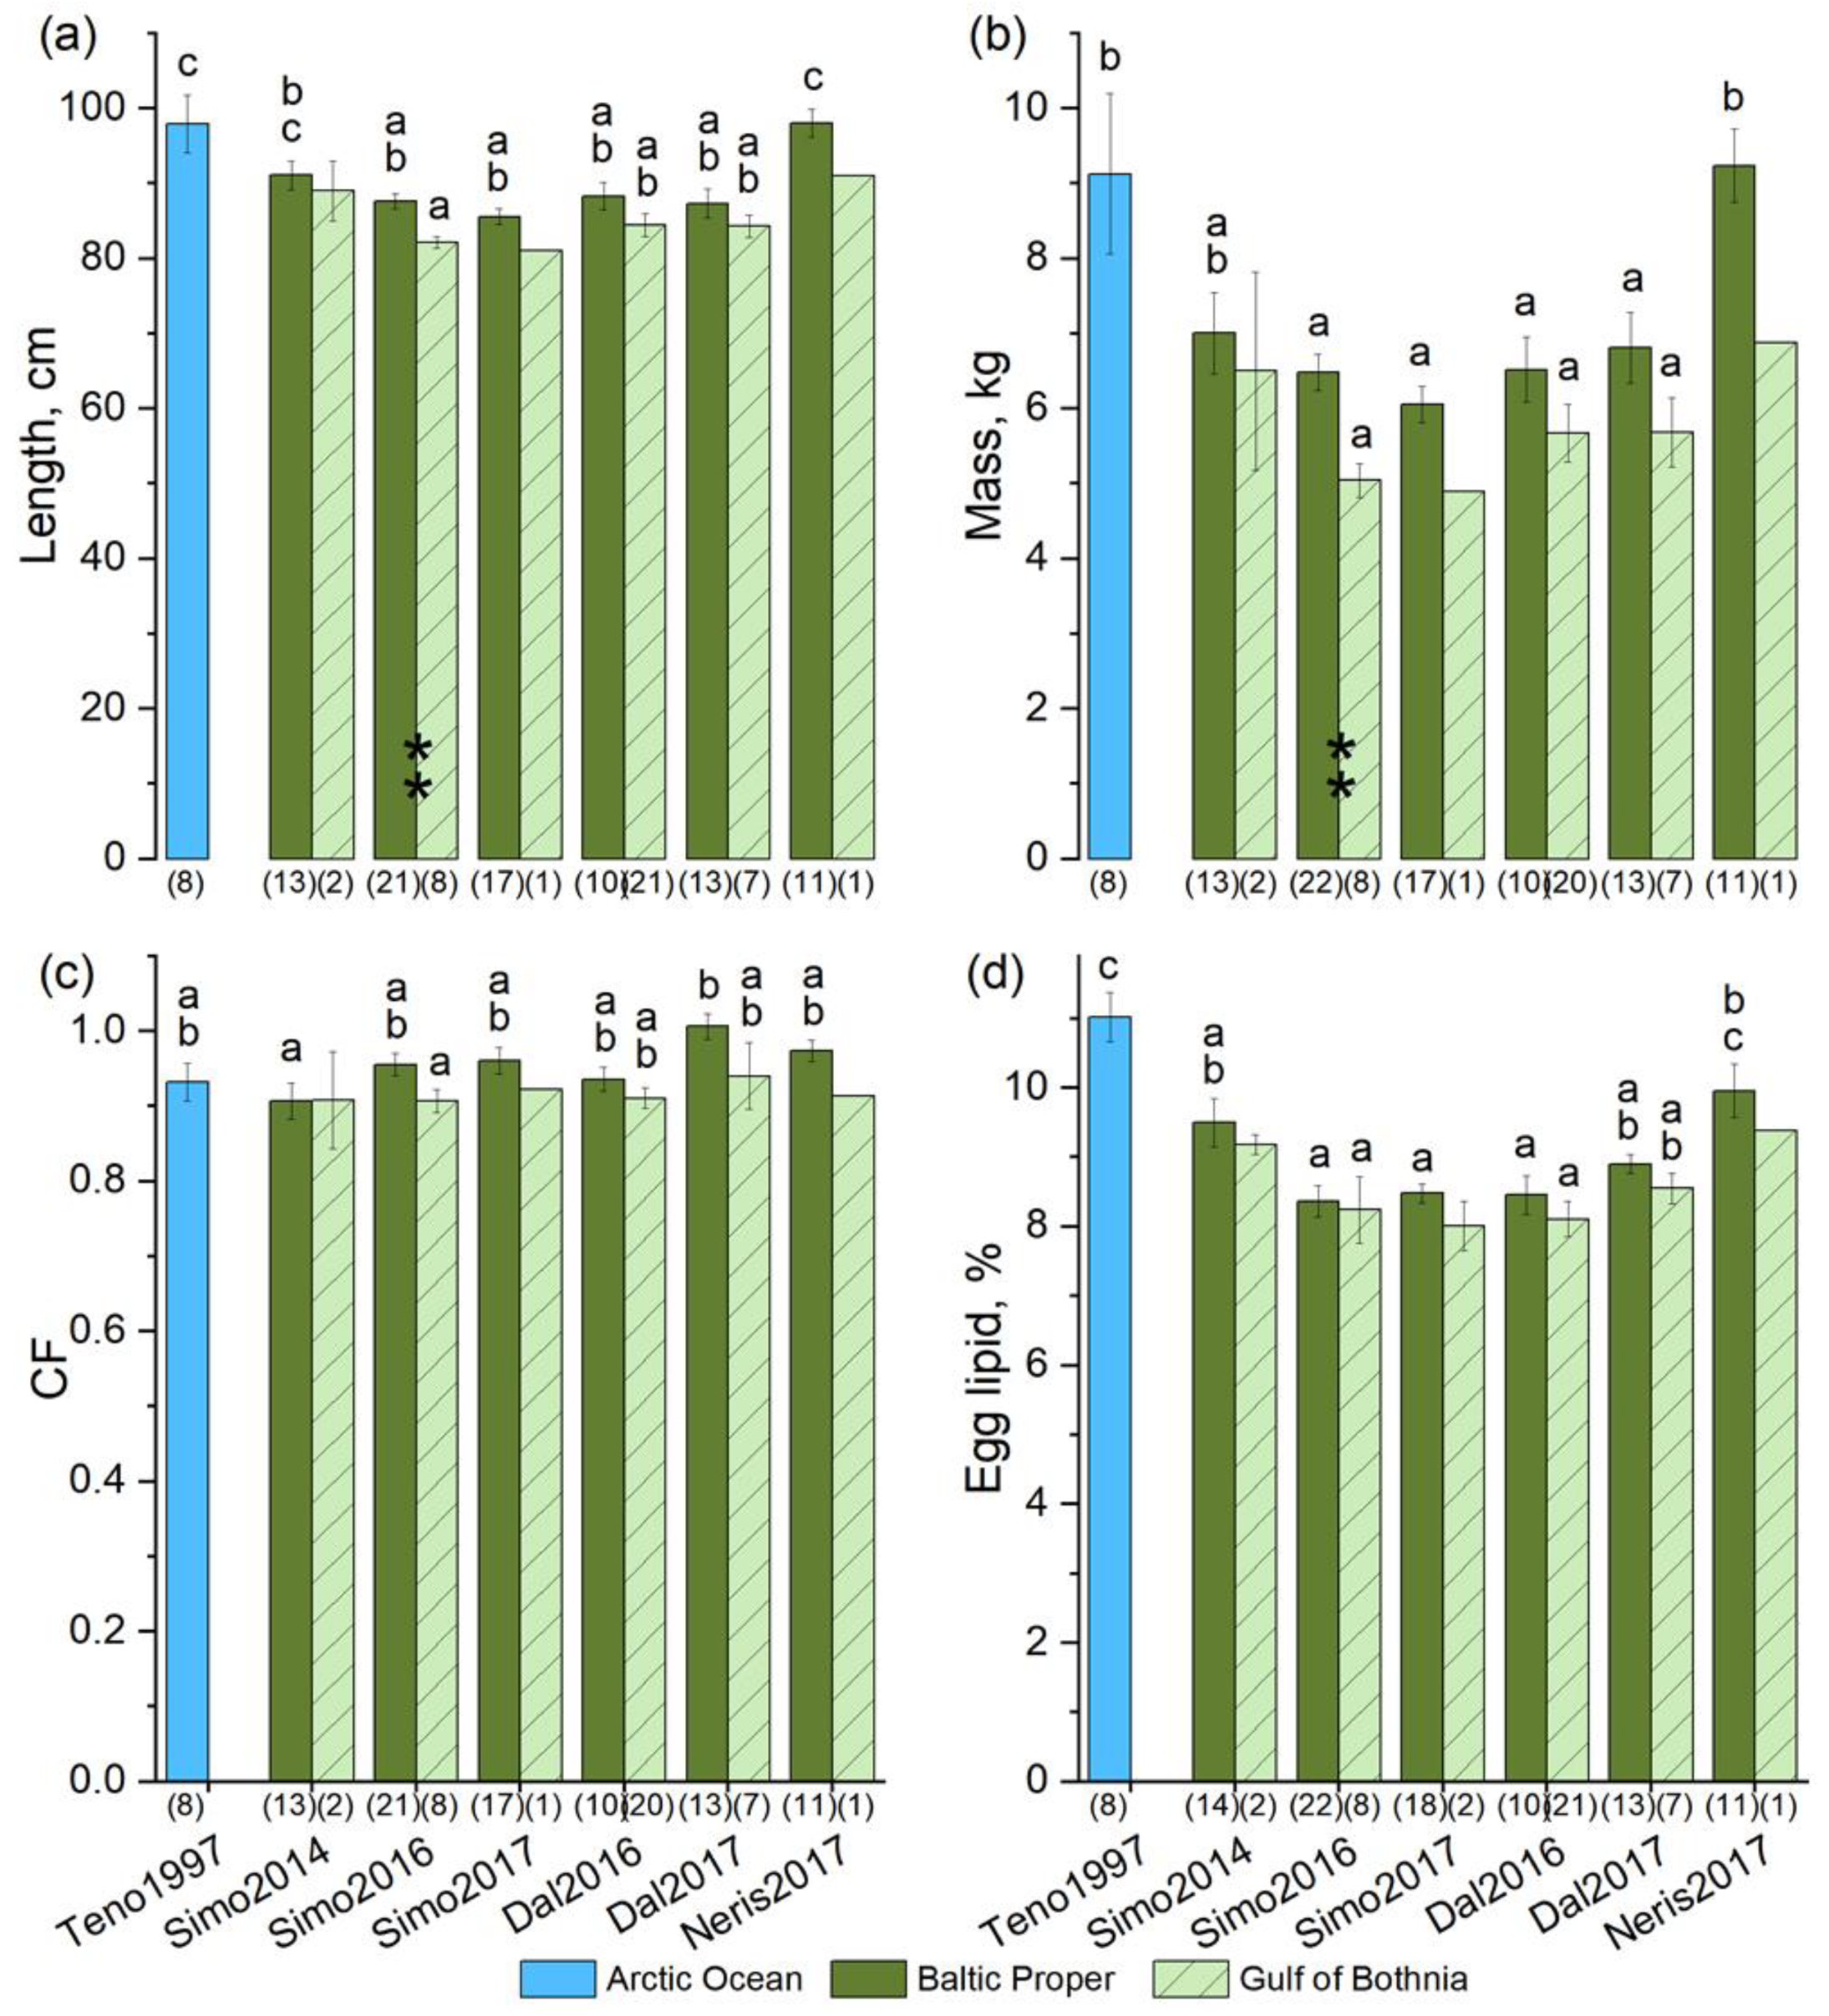
3.7. Salmon Grew Faster in the Baltic Proper Than in the Gulf of Bothnia

The River Simojoki salmon that had been feeding in the Baltic Proper tended to be longer and heavier in 2014 than in 2016 (Figure 9 and Supplementary Table S2). However, the CF tended to be higher in 2016 than in 2014. The length, mass, and CF of the 2016 or 2017 River Simojoki and River Dal salmon from the Baltic Proper did not differ significantly, although they tended to be higher for the River Dal salmon, with the exception of the CF of the River Simojoki salmon in 2016 (Figure 9). The 2017 River Neris salmon that had been feeding in the Baltic Proper were significantly longer and heavier than the 2016 and 2017 River Simojoki and Dal salmon (Figure 9 and Supplementary Table S2).
In general, in 2017, the salmon from the Rivers Simojoki, Dal, and Neris that had been feeding in the Baltic Proper were or tended to be larger, and their CF also tended to be higher than for salmon that had been feeding in the Gulf of Bothnia (Figure 9). Although these differences were non-significant in most cases, the 2016 River Simojoki salmon that had been feeding in the Baltic Proper were significantly (p < 0.01) heavier and longer than the specimens from the Gulf of Bothnia.
Figure 9. Mean (±SE) (a) total body length, (b) body mass, (c) condition factor (CF), and (d) egg lipid content of female 2nd sea-year Baltic salmon ascending the Rivers Simojoki (Simo), Dal, and Neris in 2014–2017 that had been feeding either in the Baltic Proper or the Gulf of Bothnia based on the fatty acid signatures in eggs, and as a comparison, those of the River Tenojoki females (Teno) ascended from the Barents Sea of the Arctic Ocean. The number of samples (N) is indicated in parentheses. No common letters on the top of the columns indicates a significant (p < 0.05, post hoc SNK test, N < 3 not included in the test) difference between the means, and the stars indicate a significant (** = p < 0.01) difference between the areas within the river and year.
Fishes 09 00058 g009

3.8. Relationships between Fish Size and Egg and Muscle Lipid and Egg THIAM

The lipid content of eggs was highest in Arctic Ocean salmon, where it was significantly higher than in the Baltic salmon groups, except for the River Neris salmon (Figure 9). The sea-years of Arctic Ocean salmon were unknown, but their length and mass did not differ (p > 0.05) from the second sea-year River Neris salmon (Figure 9). Among the 2017 salmon from the Baltic Proper, the mean lipid content of the eggs was significantly higher for the River Neris salmon than for the River Simojoki salmon and tended to be higher than for the River Dal salmon. The egg lipid content of the River Neris salmon in 2017 and the River Simojoki salmon in 2014 did not differ significantly, but the egg lipid content was significantly lower for the 2016 River Simojoki and River Dal salmon than for the 2017 River Neris salmon (Figure 9).
When salmon from all rivers were considered together, the lipid content in the eggs increased with the increase in the length and mass of females, although the coefficient of determination was low due to large variability (Supplementary Figure S5). Similarly, in 2016, the lipid content in the muscle of the River Simojoki salmon tended to increase (p > 0.05) with the size of salmon females from the Baltic Proper (Table 3). In contrast, in 2014, the lipid content of the muscle decreased clearly and significantly with the mass, length, and CF of the River Simojoki salmon from the Baltic Proper (Table 3).
In 2014, the concentration of egg THIAM of the River Simojoki salmon from the Baltic Proper was correlated significantly and positively with length and mass and non-significantly with CF, but in contrast, the negative correlations in 2016 in these were non-significant (Table 3). In 2014, the egg THIAM concentration was lower the higher the lipid content was in muscle and eggs, and the negative correlation was stronger with muscle lipids (Table 3). In 2016, the negative correlation of the egg THIAM concentration tended to be significant only with muscle lipid content. There was no clear correlation between muscle and egg lipid content in either year.
Table 3. Pearson correlation coefficients with a significance (p-value) below for total length, body mass, condition factor (CF), and muscle and egg lipid content against muscle and egg lipid content (%) and free thiamine (THIAM) concentration in eggs (nmol g−1) of the River Simojoki salmon females ascending for spawning in 2014 and 2016 after feeding in the Baltic Proper. Significant correlations are given in bold. The number of observations is given in parentheses.
LengthMassCFMuscle LipidEgg Lipid
2014201620142016201420162014201620142016
Muscle lipid−0.6100.317−0.7150.312−0.5720.181
0.0270.1610.0060.1680.0410.432
(13)(21)(13)(21)(13)(21)
Egg lipid−0.3760.063−0.3390.2130.0110.3360.0090.157
0.2050.7850.2580.3540.9710.1360.9750.486
(13)(21)(13)(21)(13)(21)(14)(22)
Egg THIAM0.555−0.2330.671−0.1230.4600.157−0.633−0.393−0.563−0.124
0.0490.3230.0120.6050.1140.5080.0150.0780.0360.592
(13)(20)(13)(20)(13)(20)(14)(21)(14)(21)

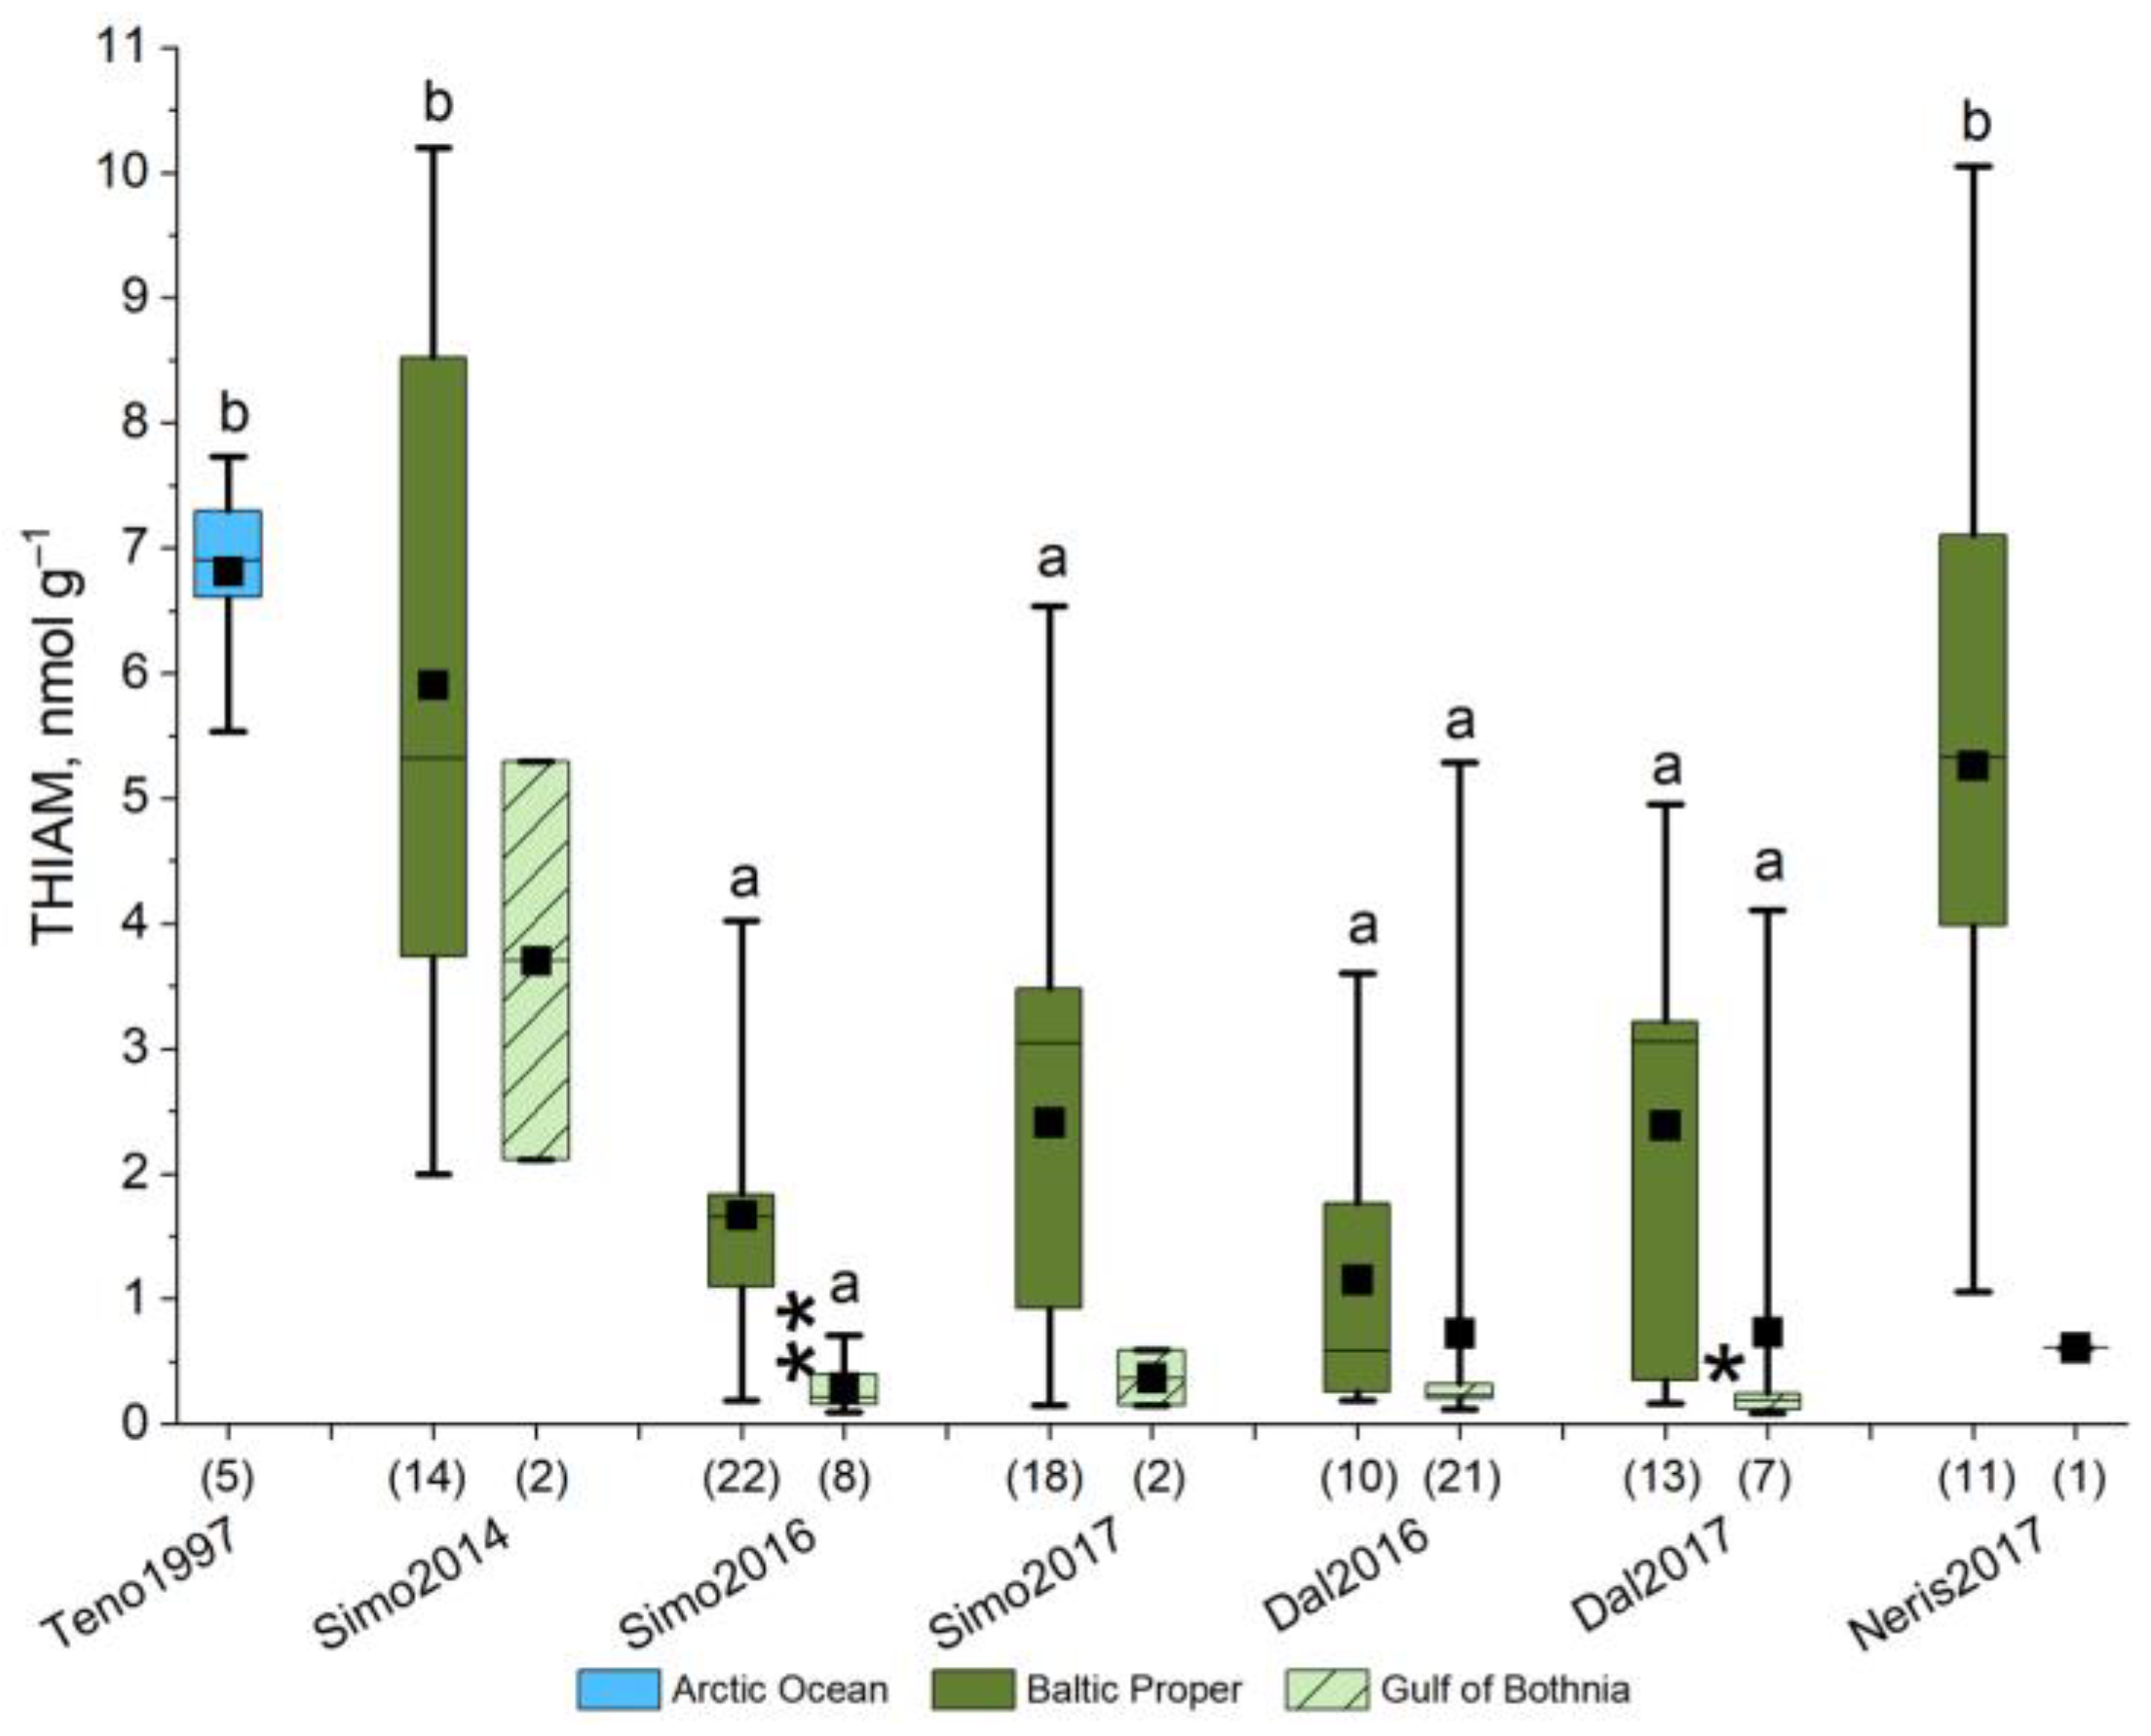
3.9. Low Egg THIAM Concentrations Were Associated with High Muscle n−3 PUFA Concentrations

A significantly lower mean THIAM concentration in eggs in 2016 than in 2014 indicated severe M74 in 2016. The muscle lipid percentage and the CF of the River Simojoki females that had been feeding in the Baltic Proper tended to be higher in the M74 year 2016 than in the non-M74 year 2014 (Figure 10). The concentrations of DHA, total n−3 PUFAs, and total PUFAs in muscle were significantly higher in 2016 than in 2014 in salmon from the Baltic Proper. The difference was most significant with DHA, followed by total n−3 PUFAs (Figure 10). There was no significant difference in the concentrations of SFAs, MUFAs, and n−6 PUFAs in the muscle of these females between the two years (Figure 10).
The concentrations of DHA, total n−3 PUFAs, and total PUFAs in muscle did not differ between the 2016 River Simojoki salmon from the two areas, although the mean THIAM concentration in the eggs was significantly lower for salmon from the Gulf of Bothnia than for salmon from the Baltic Proper (Figure 10). However, there were more than twice as many Baltic Proper salmon as there were Gulf of Bothnia salmon, and the THIAM concentrations in their eggs varied much more than those of Gulf of Bothnia salmon (Figure 10). There was no significant difference in the concentrations of SFAs or MUFAs in the muscle of salmon between the two feeding areas in 2016, but as an indication of the feeding area, the concentration of n−6 PUFAs was higher in Gulf of Bothnia salmon (Figure 10).
When the salmon from all Baltic rivers by feeding areas (unless N < 3) and Arctic Ocean salmon were compared, the mean egg THIAM concentration was the highest for Arctic Ocean salmon, which did not differ significantly from that of the 2014 River Simojoki and the 2017 River Neris salmon from the Baltic Proper (Figure 11). In the non-M74 year 2014, the eggs’ THIAM concentration was significantly higher for the River Simojoki salmon from the Baltic Proper than for the 2016 and 2017 River Simojoki and River Dal salmon from the Baltic Proper. The River Simojoki and River Dal salmon from the Baltic Proper did not differ significantly, but the variation in the THIAM concentration was higher for the River Simojoki salmon than for the River Dal salmon.
Of the 2016 River Simojoki salmon and the 2017 River Dal salmon, the mean egg THIAM concentration was significantly lower (t-test) in salmon that had been feeding in the Gulf of Bothnia than in those from the Baltic Proper (Figure 11). In one salmon specimen of the 2017 River Neris salmon, the egg THIAM concentration (0.61 nmol g−1) was lower than the threshold for possible YSFM. In the PCA biplots (Figure 6b and Figure 7), this individual was localized close to some River Dal specimens whose egg THIAM concentrations were 0.09–0.25 nmol g−1 (N = 6), and which, based on FASA, had been feeding in the Gulf of Bothnia.

4. Discussion

The two feeding areas with their dominant prey species (sprat in the Baltic Proper or herring in the Gulf of Bothnia) of Baltic salmon that ascended the River Simojoki could be determined at spawning by FASA from eggs and muscle. After 2014, when strong year-classes of sprat and herring hatched in the Baltic Proper and Gulf of Bothnia, respectively, salmon thiamine deficiency developed in both areas due to the available diet because the concentrations of DHA and total n−3 PUFAs are highest in the youngest sprat and herring [17]. Thiamine deficiency was the most severe in second sea-year salmon females after two years of feeding on these clupeids, i.e., females in 2016, and was milder in female ascendants a year earlier (2015) and later (2017) [8]. A low THIAM concentration in eggs was associated with the high concentrations of DHA and total n−3 PUFAs in muscle, and the association was stronger with DHA. The concentrations of these FAs in the muscle were higher in the M74 year than in the non-M74 year, and in the M74 year, they were higher in M74 females than in non-M74 females. Although the relationship between THIAM and n−3 PUFA concentrations did not apply to eggs, the proportions of DHA and n−3 PUFAs in eggs were higher for Baltic salmon than for Arctic Ocean salmon ascending the River Tenojoki, which indicates more abundant n−3 PUFAs in the diet of Baltic salmon, especially in 2016. In contrast with muscle, lipid content in eggs was higher in females in the non-M74 year than in the M74 year, and higher in Arctic Ocean salmon than in Baltic salmon. Although the Baltic Proper is the main feeding area of most Baltic salmon, after the strong year-class of herring that hatched in the Gulf of Bothnia, a higher proportion of salmon had been feeding there instead of the Baltic Proper than in other years. A higher proportion of both the River Simojoki and River Dal M74 females in 2016 had, therefore, also been feeding in the Gulf of Bothnia than in the Baltic Proper. However, the River Dal salmon of reared origin had been feeding more in the Gulf of Bothnia than the wild River Simojoki salmon, and a higher percentage of the River Dal M74 females, therefore, originated from the Gulf of Bothnia. In the Baltic Proper, the River Dal salmon had apparently been feeding further north on average than the River Simojoki salmon or had first been feeding in the Gulf of Bothnia before arriving in the Baltic Proper. The FA composition of most of the River Neris salmon suggested that they had probably been feeding in the northern Baltic Proper, but an occasional individual had extended the feeding migration to the Gulf of Bothnia.

4.1. The Fatty Acid Proportions of Muscle and Eggs Similarly Revealed the Prey Species and Feeding Area

The feeding area and the main prey fish of the salmon ascending the River Simojoki in 2014 and 2016 could be determined equally well by the FA proportions of either muscle or eggs, despite some differences in their FA proportions. The characteristic FA patterns of Baltic Proper sprat and Gulf of Bothnia herring [17] found in the muscle FAs of the River Simojoki salmon females spawning in 2014–2017 were similar to those in spawning salmon in 1998 and 2004, as well as in salmon caught during their feeding migration from both areas in 2004 [2,13,22].
The main reason for the differences in the FA proportions between muscle and eggs was that the different FAs of lipids stored during the feeding migration in muscle, in addition to viscera [56,57,58], had been used at different extents and rates for metabolic functions, general activities, and growing oocytes [2,9] during the pre-spawning fast. For example, the body mass of the River Simojoki salmon decreased by 10% between entering the river and spawning, i.e., from June to October [39], and muscle lipid content decreased by 50% during the spawning migration from the southern Baltic Proper in May to the River Simojoki and pre-spawning fasting until spawning in October [22]. Due to the selective catabolism of FAs preferring storage lipids to structural lipids, MUFAs and especially SFAs were consumed the most, and PUFAs were consumed least, in muscle during the spawning migration and pre-spawning fasting of salmonines [2,22,59]. This was most clearly seen in this study as a higher proportion of DHA and total n−3 PUFAs in muscle than in eggs.
When salmonines eat fatty fish, n−3 PUFAs and especially DHA accumulate in exceptionally high concentrations in the TAG fraction in muscle and visceral adipose tissues, which contain the majority of storage lipids [56,60,61]. In muscle, the proportions of 16:0 and 18:1n−9 in the River Simojoki salmon that had been feeding in the Baltic Proper were both in the non-M74 year 2014 and the M74 year 2016 approximately similar to those in the salmon from the Baltic Proper spawning in 2004, when no M74 resulted from feeding in the Baltic Proper [22]. Instead, the proportion of DHA in muscle in 2016 was 12% higher than in 2014 and up to 22% higher than in the non-significant M74 year 2004 [8,22]. The median THIAM concentration in eggs in 2016 was less than one-fifth of that in 2014 and half of that in 2004.
Although the proportion of DHA increased in the muscle of the River Simojoki salmon during the pre-spawning fast, its concentration decreased by 45%, and the concentrations of EPA, DPA, and total PUFAs decreased by 50%, 25%, and 46%, respectively, due to the decrease in lipid content [22]. However, the concentrations of SFAs in muscle decreased much more, e.g., the concentration of 16:0 decreased by 62% [22]. In sprat and herring, an increase in the proportion of DHA was also observed when they lost mass during the winter [2], which was due to preserving DHA as an essential component of the phospholipids of the cell membranes [62].
Because of the selective use of FAs of muscle lipids for metabolism and the transfer to oocytes [9], the lipid content of the River Simojoki salmon eggs during spawning was higher than in muscle. The same was true for Baltic sea trout (Salmo trutta) [63] and several salmonine species from Lake Ontario in North America [7]. Due to the higher lipid content of eggs in 2014 than in 2016, the differences in the proportions of DHA and total n−3 PUFAs between years were less significant in eggs than in muscle. However, the proportion of n−3 PUFAs was also higher in eggs in the M74 year than in the non-M74 year. The diet is, therefore, not only reflected in the composition of the FAs accumulating in fish tissues [57,64] but also in the FA composition of eggs because the body’s lipid reserves are used to grow oocytes.

4.2. Fatty Acid Composition of Baltic Salmon Differs from That of Arctic Ocean Salmon

The FASA of the proportions of FAs in eggs indicated that the diet of Arctic Ocean salmon ascending the River Tenojoki had differed greatly from the diet of Baltic salmon. The association of Arctic Ocean salmon in the PCA biplot with high 16:0 and low DHA suggests that their diet contained more crustaceans and/or leaner prey fish than the diet of Baltic salmon, as the high lipid content of marine prey fish results in high body DHA proportions and concentrations [13,60,61]. However, DHA was the most common n−3 PUFA, 16:0 was the dominant SFA, and 18:1n−9 was the dominant MUFA in the eggs of Arctic Ocean salmon, like in Baltic salmon.
Unlike Baltic salmon [37,38], Atlantic Ocean salmon eat a lot of crustaceans [65], which contain fewer lipids, especially DHA and total n−3 PUFAs, than sprat and herring [66]. According to Jacobsen and Hansen [65], the stomach content (by mass) of Atlantic Ocean salmon in 1992–1995 consisted of 32% of invertebrates, whereas invertebrates have been 2% of the stomach content of Baltic Proper and Gulf of Bothnia salmon in the 1950s and 1960s [67] and <1% in the 1990s [37,38]. In Atlantic shrimp (Pandalus sp.), for example, the concentration of DHA was only one-tenth of that in Baltic sprat and one-sixth in herring [17,66]. In the northern Atlantic Ocean krill species, which comprised approximately 4% of the mass of stomach content in Atlantic salmon [65], the total lipid content of fresh krill ranged between 0.5 and 4.5% [68,69]. According to several years of data, the total lipid content of Baltic sprat in the fall was on average 11%, and in herring, of a size appropriate as prey for salmon (<19 cm), it was 7% [1,17], and the values were similar in samples collected in the fall of 2017 [70].
In the diet of Atlantic Ocean salmon, fatty fish, e.g., Atlantic herring accounted for approximately 8%, mackerel (Scomber scombrus) accounted for 2%, and capelin (Mallotus villosis) accounted for 2% on a mass basis [65]. In the diet of Baltic Proper salmon of >60 cm in length, the proportion of fish other than sprat and herring has been approximately 5% [37,38]. In the Gulf of Bothnia, the diet of salmon has principally consisted of herring [37,38], but one-sea-winter salmon also consumed invertebrates, although they were only about 2–3% of their diet [71]. Salmon smolts released in the northern part of the Gulf of Bothnia in May–June passed through the Gulf during August–September when they reached a length of 24–32 cm and their diet changed solely to fish [33,71]. The feeding history of smolt-phase or one-sea-winter salmon is probably not reflected in the FASA of second sea-year salmon at the time of spawning because the FA composition of juvenile salmon became similar to their current diet after approximately five months of feeding [72]. However, in salmonines, body lipid content, i.e., FA concentration and amount, usually increases with age [56,73].
The lipid percentage of the eggs did not reflect the amount of lipids accumulated in the muscle from the diet because it was not correlated with the lipid content of the muscle. Therefore, the amounts of FAs in the diet could not be estimated from the concentrations of FAs in the eggs. Instead, the FA composition of the eggs reflected the dietary differences between the salmon groups. The proportion of DHA in eggs was significantly lower in Arctic Ocean salmon than in Baltic salmon that had been feeding in the Baltic Proper but did not differ significantly from Baltic salmon that had been feeding in the Gulf of Bothnia. The proportion of n−3 PUFAs also include DPA and EPA, which were, in most cases, more common in Arctic Ocean salmon than in Baltic salmon, especially in those that had been feeding in the Baltic Proper [2]. However, the proportion of n−3 PUFAs in eggs was also significantly lower for Arctic Ocean salmon than for Baltic salmon from the Gulf of Bothnia. Moreover, in the eggs of Atlantic salmon ascending a river on the western coast of Sweden, the proportion of DHA in both the phospholipid and TAG fractions was lower than in the eggs of Baltic salmon [74]. In the TAG fraction, the proportion of n−3 PUFAs was also lower in the Atlantic salmon from this river than in the Baltic salmon but not in the phospholipid fraction [74], whose proportion as a whole is much lower than the proportion of the TAG fraction [75]. As with the eggs of Arctic Ocean salmon compared to the Baltic salmon of this study, the proportion of n−6 PUFAs was also considerably lower in the eggs of this Atlantic river salmon than in the eggs of Baltic salmon [74].

4.3. Salmon Remain to Feed on Young Herring in the Gulf of Bothnia if Abundant

The percentages of the River Simojoki salmon that had remained to feed in the Gulf of Bothnia in 2012 (13%) and 2015 (10%) as smolts, and after feeding there for two years, ascended for spawning in 2014 and 2017, were close to the percentages obtained from the long-term mark–recapture studies. The average annual proportion of the tagged wild River Simojoki salmon recaptured from the Gulf of Bothnia was 14% during 1986–2007 [36]. In contrast, more than one in four (27%) of the River Simojoki salmon females that returned to spawn in 2016 had, according to FASA, remained as smolts in the Gulf of Bothnia in 2014 to feed on abundant young herring [42]. Consistently, according to mark–recapture studies, the proportion of salmon smolts that had halted their feeding migration in the Gulf of Bothnia was higher in the years when herring recruitment was successful there [32,33,76]. In addition to the size of the new year-class of Gulf of Bothnia herring, the production of salmon smolts can affect the number of salmon that stop at the Gulf of Bothnia [76]. The annual total numbers of salmon smolts from stockings and natural reproduction that started their feeding migration in the sea did not differ between 2012 and 2015 [77]. The number of migrating smolts has, therefore, not affected how many of them remained in the Gulf of Bothnia in these years, and the reason was probably the strength of the herring 2014 year-class.
The estimated percentages of salmon that remained in the Gulf of Bothnia obtained from mark–recapture studies have differed between the Rivers Simojoki and Tornionjoki and between wild and reared smolts. For example, while the data from 1986 to 2007 show that an annual average of 14% of the wild River Simojoki salmon smolts compared to 24% of reared ones remained to feed in the Gulf of Bothnia [36], the data from 1999 to 2008 show that 6% of the wild and 15% of the reared River Simojoki salmon smolts remained in the Gulf of Bothnia [35]. For salmon from the River Tornionjoki, the percentages of salmon remaining in the Gulf of Bothnia were somewhat lower: 4% of the wild and 11% of the reared smolts [35]. It, therefore, seems the Tornionjoki salmon probably migrate to the southernmost Baltic Sea fastest among the salmon stocks in the Gulf of Bothnia [78]. Extensive supplementary stockings in these rivers started in the 1990s to revive the two original naturally reproducing salmon stocks, the River Tornionjoki and River Simojoki stocks, as they were on the verge of extinction due to heavy sea fishing in the 1980s and very high M74 mortality in the early and mid-1990s [8,79]. Supplementary stockings were stopped in the early 2000s after the stocks had recovered. All the River Simojoki salmon in the present study were, therefore, wild. In contrast, all the River Dal salmon were reared. Because reared salmon end up feeding in the Gulf of Bothnia more often than wild-born salmon [34], this is a likely explanation for the higher proportion of them feeding in the Gulf of Bothnia than the River Simojoki salmon. Another explanation is that the River Dal salmon probably first migrated northward in the Gulf of Bothnia before heading to the Baltic Proper [78].
The River Dal salmon had also remained to feed on the strong herring 2014 year-class to a larger extent because three out of five of the 2016 River Dal ascendants remained in the Gulf of Bothnia, and about one-third remained in 2017. Furthermore, a higher proportion of M74 females in the River Dal population than M74 females in the River Simojoki population had been feeding in the Gulf of Bothnia in 2016. In 2017, when the incidence of M74 had already decreased, a higher proportion of the River Dal M74 females than the River Simojoki M74 females were still those that had been feeding in the Gulf of Bothnia.
Tag–recapture studies covering years and even decades have provided valuable information about Baltic salmon migrations, although salmon handling, the tag itself, and the physiological stress caused by transportation can affect the survival and migration behavior of smolts [34,35,36,80]. Estimates of salmon distribution based on the mark–recapture method depend on the fishing activity at the time of capture [34]. These method challenges do not apply to the FASA method, which, unlike the mark–recapture method, allows the determination of the feeding area of salmon after their return to the spawning river and seems to be a reliable method for this.

4.4. Different Salmon Stocks Have Different Feeding Patterns

The differences in the FA signatures between salmon from the two feeding groups were also statistically significant for the River Dal and River Neris salmon. Small differences in the FA signatures between these and the River Simojoki salmon indicated some differences in their feeding patterns.
The hatchery-reared River Dal salmon, like the hatchery-reared smolts from the different salmon stocks of the rivers of the northern Gulf of Bothnia, e.g., the Rivers Simojoki, Tornionjoki, and Kemijoki, had remained to feed in the Gulf of Bothnia more often than wild smolts instead of migrating to the Baltic Proper [34,35,36]. In 2016 and 2017, the annual proportions of the River Dal salmon that had been feeding in the Gulf of Bothnia were two to three times higher than the proportions of the River Simojoki salmon feeding in the area. In 2014, when a record herring year-class hatched in the Gulf of Bothnia [42,44], less than one-third (32%) of the River Dal salmon had migrated to the Baltic Proper, whereas almost three out of four River Simojoki salmon (73%) had migrated there.
Although a lower proportion of the River Dal M74 females in 2016 were from the Baltic Proper (16%) than from the Gulf of Bothnia, their proportion was still higher than those of the River Simojoki M74 females from the Baltic Proper (13%). In 2016, the FA signatures of Dal M74 and non-M74 females differed significantly from those of the River Simojoki M74 females from the Baltic Proper and Gulf of Bothnia. A year later, when the abundance of young herring in the prey biomass of the Gulf of Bothnia had already decreased [44], the feeding migration behavior of the River Simojoki 2017 ascendants had returned to the long-term average [36]. Nevertheless, 35% of the River Dal salmon were from the Gulf of Bothnia, and a higher proportion of M74 females of the River Dal salmon originated there (30%) than of the River Simojoki M74 females (10%). A higher proportion of M74 females (20%) of the River Dal salmon than of the River Simojoki salmon (15%) also originated from the Baltic Proper in 2017.
The higher proportion of M74 females among the River Dal salmon than among the River Simojoki salmon is possibly due to their larger size as smolts, as indicated by their larger size at the age of the second sea-year at spawning time. Especially in 2017, the River Dal salmon were larger than the River Simojoki salmon in the Baltic Proper and Gulf of Bothnia feeding groups. Reared salmon smolts are usually larger than wild smolts [35] and are, therefore, readier to prey on fish for food than smaller smolts instead of first eating a mixed diet. Typically, reared smolts also have a higher lipid content than wild smolts, which has been linked to their higher marine mortality [81]. However, the feeding migration routes of the River Dal salmon also differ from the migration routes of the salmon from the northern Gulf of Bothnia rivers [78]. Due to the more southern location of the River Dal in the Gulf of Bothnia, the River Dal salmon smolts directly enter the Bothnian Sea, which is the main spawning and feeding ground for Gulf of Bothnia herring [30]. Instead, the River Simojoki salmon smolts have first come to the Bothnian Bay, where herring are less common than in the Bothnian Sea [82]. Apparently, the larger River Dal salmon had been feeding more and for a longer period than the River Simojoki salmon on abundant young herring, which the salmon’s prey biomass in the Gulf of Bothnia mainly consisted of in 2014 and subsequent years [82]. After accumulating more n−3 PUFAs, the River Dal salmon, therefore, became thiamine deficient more easily than the River Simojoki salmon.
Considering the salmon from the Baltic Proper, in the PCA biplot, the River Simojoki salmon were more clearly associated with 14:0 and 17:1n−8 than the River Dal salmon, indicating their feeding in the more southerly Baltic Proper and more on sprat [2,13]. In contrast, in 2016, most of the River Dal salmon, and in 2017, some of them, were more clearly associated with ARA, other n−6 FAs, and 18:1n−7 than the River Simojoki salmon, suggesting that they had probably been feeding more in the Gulf of Bothnia and more on herring [2,13]. This result is consistent with that of Jacobson et al. [78], according to which the salmon smolts of the River Dal first migrate to the north of the Gulf of Bothnia before heading to the southern Baltic Sea. They could, therefore, have been feeding in the Gulf of Bothnia for a longer period than the River Simojoki salmon. Another and very likely possibility is that the same River Dal salmon had continued to feed in the northern Baltic Proper, i.e., further north on average than the River Simojoki salmon and the salmon from the other Bothnian Bay rivers [78], as mark–recapture studies have previously shown for reared smolts [34]. According to the 2016 catch statistics [82,83], 0–2-year-old herring were more abundant in the northern than in the southern Baltic Proper. However, due to its very strong year-class, sprat have been abundant in the entire Baltic Proper, as well as in the western and central parts of the Gulf of Finland in 2014–2015 [84,85]. Indeed, one 2016 River Dal salmon in the Baltic Proper group was associated in the PCA biplot with the FAs, which suggested feeding in the Gulf of Finland (see [13]). However, like the River Simojoki salmon, the River Dal salmon from the Baltic Proper were associated with 18:1n−9, which is more common in sprat than in herring, and dietary sprat are linked to the development of M74 in the River Dal salmon in the Baltic Proper.
The differences in the FA signatures were more pronounced between M74 than non-M74 females, apparently because the diet of M74 females contained larger amounts of young clupeids than the diet of non-M74 females. This was reflected in higher lipid content and DHA and total n−3 PUFA concentrations in the muscle of the River Simojoki M74 females than in non-M74 females from the Baltic Proper in 2016. The accumulation of marine lipids containing high concentrations of n−3 PUFAs, especially DHA, resulted in thiamine deficiency, as has already been confirmed [7,13,22].
The FA patterns in the eggs of many River Neris salmon suggest that they had headed north and been feeding more on herring and in more northerly Baltic Proper areas on average than the River Simojoki salmon. Two River Neris salmon in the Baltic Proper feeding group were located in the PCA biplot near some River Dal salmon, suggesting a similar diet. Mark–recapture studies have already shown that salmon from rivers in the southern part of the Baltic Sea can migrate toward the northern Baltic Proper and the Gulf of Finland and even to the Gulf of Bothnia [31,32]. The FA composition of one River Neris salmon with the lowest egg THIAM concentration suggests it had been feeding mainly on herring as far as the Gulf of Bothnia. The Gulf of Bothnia feeding groups of the River Dal and River Simojoki salmon in the fall of 2017 with a low THIAM concentration in eggs in the PCA biplot were associated with the same FAs as this individual River Neris salmon. Therefore, due to the very abundant herring 2014 year-class in the Gulf of Bothnia [42,86], salmon from different rivers had been feeding there.

4.5. Abundance of Young Clupeids Increased n−3 PUFA Content and Thiamine Deficiency in Salmon

In the early 2000s, the size of the sprat stock decreased to its smallest since the early 1990s [39]. This resulted in the highest THIAM concentrations in the eggs of salmon in the falls of 2002–2004 since the start of the analyses in 1994 [8,79]. However, THIAM concentrations in salmon eggs were even higher in 2011–2014, reaching a record high in 2014. The stock of cod (Gadus morhua) consuming sprat had recovered to some extent toward the 2010s [42], so the sprat apparently did not dominate the herring—at least not significantly—in the prey biomass of salmon in the Baltic Proper, which was the case in the 1980s [39]. In addition, the small herring suitable for salmon as prey were probably leaner than in the Gulf of Bothnia, as was the case in the early 2000s [13,79].
In the fall of 2015, the THIAM concentrations in salmon eggs were lower than in the previous year, and in the fall of 2016, they were so low that some parent females died of thiamine deficiency before spawning, and all or a proportion of the offspring of 35% of salmon females included in the Finnish M74 monitoring died of M74 [8]. In 2017, when the strong year-classes of prey fish had leveled off [42], the THIAM concentration of the eggs increased, and the proportion of M74 females decreased to 16%. As a result, salmon YSFM decreased to 14% in the spring of 2018. In the fall of 2018, the proportion of M74 females among the salmon of the Rivers Tornionjoki and Kemijoki included in the Finnish M74 monitoring were 1% and 8%, resulting in YSFM of 5% and 8% in the spring of 2019 [8].
In general, strong new year-classes of sprat in the Baltic Proper cause the majority of M74 mortalities, especially when the stocks of cod, which is the main predator of sprat, are weak [39,87,88]. Between 1985 and 2006, YSFM was positively correlated with the total prey biomass of salmon and the sprat biomass in the Baltic Proper and was not correlated with the salmon prey biomass of Baltic Proper herring [39]. Sprat, therefore, dominated herring in the diet of salmon in the Baltic Proper throughout the 1990s and 2000s until the 2010s [1,13,17,37,38] and apparently after this, at least during periods when the new year-classes of sprat have been large.
The 2014 sprat year-class was the third largest in the 1974–2021 survey period [42,43]. In the southern Baltic Sea, herring quickly grow larger than the size that salmon prefer as prey [39], and in this area, only the youngest herring are, therefore, suitable prey for salmon [38,89]. In contrast with herring, sprat grow little after reaching an approximate length of 15 cm [1,17,40], and all sprat are, therefore, of a suitable size for salmon prey [38].
FASA clearly revealed that the dominant prey fish of salmon in the Gulf of Bothnia was herring, as reported earlier [38,39,71]. A small number of sprat migrate from the Baltic Proper to the southern parts of the Gulf of Bothnia, especially when sprat are abundant [30]. Despite this, the amount of sprat in the prey fish biomass of Gulf of Bothnia salmon has remained below 5% [38,39], and sprat are mainly present during the cold-water period, as they return to the Baltic Proper for the summer to spawn [30]. The size of the new herring year-class in the Gulf of Bothnia has varied. Between 1962 and 2021, it first peaked in 2002 and again in 2014 [82,90]. After both these years, the salmon that had been feeding in the Gulf of Bothnia suffered from M74.
As the lipid content is higher in sprat than in herring [13,17,41] and the highest in the youngest sprat [1], by eating young sprat, salmon accumulate lipids and DHA more readily during their feeding migration in the Baltic Proper than by eating herring. Herring in the Baltic Proper and Gulf of Finland tend to be lean in strong sprat stock years because young herring have to compete with sprat for the same food resources [91,92]. Abundant young sprat from the strong 2014 year-class in the Baltic Proper [42,43] resulted in a higher concentration of muscle DHA in second sea-year salmon ascending in 2016 than in salmon ascending in 2014. However, small herring have at least occasionally (e.g., in the early 2000s) been fattier in the Gulf of Bothnia than in the Baltic Proper [13]. In addition, the proportion of n−3 PUFAs has been higher in herring than in sprat [17,41], but in both species, the concentrations of DHA and total n−3 PUFAs have been highest in the youngest age groups [17]. Therefore, when young herring are abundant and fatty in the Gulf of Bothnia, the intake of DHA and total n−3 PUFAs from them is so high that it can cause thiamine deficiency in salmon [13].
When a strong year-class of herring was hatched in the Gulf of Bothnia in 2014 [93], the diet in both the Baltic Proper and the Gulf of Bothnia caused thiamine deficiency in salmon females in 2015–2017 and as a result, M74 mortality among the offspring [8]. Likewise, the largest of the lampreys, mostly females, which ascended the River Perhonjoki on the southeastern Bothnian Bay for spawning in the fall of 2014, died of thiamine deficiency before spawning in the spring of 2015 after suffering from M74 symptoms during the pre-spawning mid-winter fast [4]. The lampreys had apparently also fed on abundant young herring in the Gulf of Bothnia during the summer of 2014, as well as on salmon [94] that remained in the Gulf of Bothnia or those that migrated for spawning to the Gulf of Bothnia rivers in record numbers in 2014 [93].

4.6. Low Egg THIAM Concentration Was Associated with High Muscle, Not Egg, Lipid Content

The concentrations of THIAM in eggs already decreased in salmon that ascended the rivers in the summer of 2015 and spawned in the fall, having been feeding for a year on abundant young sprat in the Baltic Proper or on herring in the Gulf of Bothnia. Only one growing season was, therefore, required for the development of poor thiamine status, because the 0-year-old sprat during the last months of the year and herring during the late summer already reach lengths (circa 50 mm) that make them suitable prey for salmon [38,39,95]. In addition, salmon also feed to a considerable degree in the winter on these youngest prey fish, especially in mild winters [37]. However, thiamine deficiency in the studied salmon, as well as in salmon from the Gulf of Bothnia rivers, for which M74 has been annually monitored, was the worst after two feeding years, i.e., in the salmon that migrated to the sea as smolts in the spring of 2014 and ascended for spawning in the fall of 2016 [8]. As lipids accumulate in salmonines along with growth and age [56,73], the accumulated n−3 PUFAs have already consumed thiamine in energy metabolism and lipid peroxidation during the feeding migration, as seen in a higher hepatic MDA and lower total thiamine concentration in the fattiest salmon in the sea [13].
In addition to providing a large amount of n−3 PUFAs [17,41,52], the youngest sprat and herring probably also provided the least thiamine, especially in relation to the thiamine requirement of salmon [1,17]. Among the age groups, the youngest have the lowest thiamine concentrations, apparently because thiamine is also consumed in their energy metabolism due to their high lipid and DHA content and the peroxidation of n−3 PUFAs [1,17]. Thiamine concentrations were at their maximum in herring in the 3–7 age groups, but only in 6–10-year-old sprat [1]. However, the thiamine concentration in the prey biomass, which consists of several age groups, has generally exceeded the dietary requirements for salmon [1,17], although the requirement increases with the increase in the diet’s energy content [14].
The larger amounts of n−3 PUFAs and especially DHA in the diet of salmon were reflected in their significantly higher concentrations in the muscle of the second sea-year River Simojoki salmon females from the Baltic Proper in the M74 year 2016 than in the non-M74 year 2014. Although the concentration of DHA in muscle tended to be lower in females that had been feeding in the Gulf of Bothnia, the concentration of n−3 PUFAs did not differ between salmon from the two areas, apparently because DPA, EPA, and 18:3n−3 were more common in salmon from the Gulf of Bothnia than in females from the Baltic Proper, as in 2004 [2]. These n−3 PUFAs, although less than DHA, are also prone to lipid peroxidation [19,96], which consumes thiamine. As thiamine depletion increases due to the peroxidation of n−3 PUFAs, with thiamine acting as a site-specific antioxidant against lipid peroxidation [10], salmon on a diet consisting of the youngest, fattiest clupeids have the highest thiamine requirement (see [1]). Hence, not only the exceptionally strong year-class of sprat in the Baltic Proper but also of herring in the Gulf of Bothnia in 2014 and the subsequent high dietary n−3 PUFA content, as in 2002 [13], resulted in a low THIAM concentration in eggs and high YSFM in salmon.
In the muscle of the River Simojoki M74 females in the Baltic Proper group in 2016, the concentrations of DHA, n−3 PUFAs, and total PUFAs were higher than in non-M74 females and resulted in a lower egg THIAM concentration. The association of high YSFM with a higher proportion of DHA and total n−3 PUFAs, and thus with lipid peroxidation, was already suggested by Pickova et al. [74] because of the high proportions of these FAs in eggs. Czesny et al. [97] also suspected that the high proportion of DHA in eggs was connected with TDC in lake trout (Salvelinus namaycush). However, the concentrations of egg n−3 PUFAs and DHA were unrelated to the egg THIAM concentration, so they were not significantly associated with M74 mortality. This was confirmed by the lower THIAM concentrations in salmon eggs in the M74 year 2016 than in the non-M74 year 2014 and in the eggs of Arctic Ocean salmon, in which, due to the high lipid content of eggs, the concentrations of DHA and total n−3 PUFAs were the highest, although their proportions were the lowest. Specifically, the n−3 PUFAs of the body’s lipid stores and their peroxidation after release from TAG cause thiamine deficiency, especially during the spawning migration and fasting but also during the feeding migration [13,22]. This was seen in the strong association of body DHA and total PUFAs with the peroxidation product MDA and poor thiamine status of salmon, while body SFAs were not correlated with these [13,22].
Although n−6 PUFAs were also more common in Baltic than in Arctic Ocean salmon (<7% vs. 2% of all egg FAs), as also found by Pickova et al. [74] between the eggs of Baltic and Atlantic Ocean salmon, they comprised only approximately 11% of egg PUFAs in Baltic Proper salmon, 14% in Gulf of Bothnia salmon, and 5% in the eggs of Arctic Ocean salmon. In addition, the peroxidation of n−6 PUFAs produces little MDA, while their principal peroxidation product is 4-hydroxy-2-nonenal [20,98].
As such, long-chain PUFAs such as DHA, EPA, and ARA are essential for the health and various physiological functions of adult fish, as well as during early development [9,99]. For example, DHA is important for cell membrane fluidity in cold-water fish and for the optimal development and function of the nervous system [100]. In addition, EPA and ARA are precursors of bioactive molecules that have many roles in mediating and controlling various cellular processes [99,101]. The intake of these PUFAs from the diet is important, although salmon can, to some extent, synthesize them [102,103]. As the lipid content of the eggs in Arctic Ocean salmon and in salmon in the non-M74 year was higher than in the M74 year, the concentrations of these so-called physiologically essential fatty acids [9] were even higher in their eggs.

4.7. Variation in the Growth, Lipid, and Egg THIAM Concentration

In the non-M74 year 2014, the lower THIAM concentration in the eggs of the smaller River Simojoki salmon from the Baltic Proper than in larger individuals was associated with their higher muscle lipid content. This could be a consequence of size-dependent prey availability [104] during their principal growing seasons, i.e., in the summers of 2012 and 2013, when only a moderate number of sprat had hatched [42,105]. Thus, the small River Simojoki salmon individuals have mainly eaten sprat and for the most part, the smallest and, therefore, the youngest sprat in the Baltic Proper due to the fast growth rate of herring in the southern Baltic Proper [39], while large salmon individuals have also been able to eat older sprat and herring <19 cm in length [38,89]. Because the youngest sprat are the fattiest prey, the lipid content in the muscle of the 2014 River Simojoki salmon was significantly higher in smaller than larger individuals. Although the THIAM concentration of the eggs in all individuals was higher than the threshold for M74-related YSFM [8] in 2014, THIAM concentrations were lower in smaller than in larger salmon individuals.
The negative correlation of the CF with muscle lipids in the 2014 River Simojoki salmon from the Baltic Proper also showed that even though the largest salmon had a higher CF, their lipid content was lower than that of smaller salmon. In 2014, the protein-to-lipid ratio in the diet of larger salmon appears to have been more optimal for growth, i.e., greater than the ratio in the diet of smaller salmon, as an optimal ratio promotes protein utilization and lipid retention, resulting in an improved growth rate and an increase in CF [106,107]. Analyzed from the data of 2003–2004 [1,40], the protein-to-lipid ratio in Baltic Proper sprat in the fall was only 36% of the optimal ratio that would have provided the best growth rate for juvenile salmon [106]. In Baltic Proper herring of a suitable length for salmon prey, the protein-to-lipid ratio of the fall was considerably higher, i.e., 71% of the optimal value. Interestingly, the survival of salmon smolts that migrated to the Baltic Proper has been higher in years when a strong herring year-class has hatched there [36]. The protein-to-lipid ratios for both sprat and herring increase somewhat with age and toward the spring when both species become leaner during the winter. However, in both sprat and herring, the ratios were mostly below the optimum [1,17].
Arctic Ocean salmon, whose diet probably consisted of a high proportion of crustaceans, like the diet of Atlantic Ocean salmon [65], were longer and weighed more than the River Simojoki and River Dal salmon, but their CF did not differ from the CF of these salmon. For example, a certain share of crustaceans in the diet may stimulate salmon appetite, increase growth rate, and lead to lower CF, as was observed in a feeding trial in which small amounts of krill (Euphausia superba) were added to the diets with close to an optimal protein-to-lipid ratio [108]. Although the mean CF of Baltic salmon M74 females has been higher than that of non-M74 females in the Finnish M74 monitoring in most years [8], the CF of the 2014 salmon from the Baltic Proper shows that an increase in the CF of salmon does not always indicate an increase in their lipid content, and can also mean an increase in muscle mass.
In the M74 year 2016, in contrast with 2014, the lipid content of the muscle of the River Simojoki salmon from the Baltic Proper tended to increase with mass and length, and a similar trend was found in the egg lipid data of all studied salmon. Due to the strong 2014 sprat year-class, larger salmon, whose energy requirement is higher than for smaller salmon, have also had abundant fatty young sprat to consume in the Baltic Proper from the summer of 2014 to the spring of 2016, when they started the spawning migration. Salmon in the Baltic Proper also eat considerable amounts of clupeids in the early winter, when their diet consists largely of young sprat, which hatch later than herring [37]. In salmon with a higher muscle lipid content, the concentration of total n−3 PUFAs, especially DHA, in the muscle was also higher. The higher muscle lipid content and n−3 PUFA concentration of larger salmon in 2016 was reflected in their lower egg THIAM concentration than in smaller females. In general, therefore, the THIAM concentration of eggs was lower the higher the muscle lipid content. Although the lipid content of muscle and eggs was not correlated with each other in either 2014 or 2016, the tendency of the relationship between egg lipid content and THIAM concentration was intra-annually the same as in muscle. River Dal M74 females, which were larger than the River Simojoki M74 females in 2016 and had a higher DHA and total n−3 PUFA proportions in their eggs, also had lower egg THIAM concentrations than the River Simojoki M74 females. Findings from 2016 compared to 2014 suggest some vitellogenesis disorders, resulting in a decreased transfer of FAs and thiamine to oocytes in salmon with a poorer thiamine status.
As the lipid content of the salmon’s diet increases, its protein-to-lipid ratio decreases, and the energy density increases, which inevitably increases the salmon’s need for thiamine. These nutritional factors are interdependent, so it is difficult to infer the cause-and-effect relationship of different factors and their effects on growth. In any case, the lipid content and the concentration of THIAM of the eggs were highest in the largest salmon, i.e., Arctic Ocean salmon, second highest in the River Neris salmon, and third highest in the 2014 River Simojoki salmon in the Baltic Proper feeding group, whose salmon tended to be larger than those in 2016. The mean THIAM concentration in the eggs of Arctic Ocean salmon was an average of ten (3–23) times higher than for the River Simojoki and River Dal salmon in the Baltic Proper and Gulf of Bothnia feeding groups of 2016 and 2017. Furthermore, the lipid content and the THIAM concentration of the eggs were lower in salmon that had been feeding in the Gulf of Bothnia than in salmon from the respective river that had been feeding in the Baltic Proper. In general, the salmon from the Gulf of Bothnia had the lowest body mass, as well as the lowest egg lipid content and the lowest egg THIAM concentration.
The smaller size of the salmon from the Gulf of Bothnia indicates that their growth rate had been slower there than in the Baltic Proper, as has previously been observed [1,33]. The CF of salmon from the Gulf of Bothnia was also lower than in the salmon from the Baltic Proper of the same year, as also found earlier [1]. In 1997, as in 2004, M74 females were smaller on average than non-M74 females [8,39], and even smaller than the River Simojoki salmon from the Gulf of Bothnia in this study. In those years, the incidence of M74 was moderate and low, respectively. Without FASA, it is impossible to know whether the 1997 M74 females, like the 2004 M74 females, had been feeding on herring in the Gulf of Bothnia or small sprat in the Baltic Proper. However, these may be the reasons why, in some years, M74 females among the River Dal salmon had a lower mass and CF than non-M74 females [93].
In 2016, the THIAM concentration in the eggs of the River Simojoki salmon varied as much as 42-fold after two years of feeding in the Baltic Proper, and an 8-fold variation was recorded in the non-M74 year 2014. The THIAM concentrations in the eggs of all the River Simojoki salmon, irrespective of the feeding area, included in the Finnish M74 monitoring varied even more widely. In 2016, the median THIAM concentration in the eggs of all salmon females of the Bothnian Bay rivers (N = 55) was 0.96 nmol g−1 with a 133-fold variation, and in 2017, it was 1.97 nmol g−1 (N = 125) with a 64-fold variation, while in the non-M74 year 2014 (N = 25) with no M74 females, the THIAM concentration was an average of 5.29 nmol g−1 with only an 8-fold variation [8]. The overall variation has been large in years of moderate M74 and less in years with very severe M74 or no M74 [8].
The small variation in THIAM concentration in the years with no M74 indicates that no strong year-classes of sprat have hatched, or if they have, the cod stock has been strong. As a result, the different age groups of the sprat are evenly distributed. In the Baltic Proper, cod can apparently efficiently thin out young sprat, which can be seen when the incidence of M74 is compared with the Baltic fishery statistics [42]. The larger intra-annual variation in the egg THIAM concentration among salmon females in a specific river in years with moderate M74 compared to the years with very severe M74 or in non-M74 years indicates that the abundance of young fatty sprat in the Baltic Proper has varied between the subareas [8]. Furthermore, in years when M74 incidence only depends on feeding in the Gulf of Bothnia, the egg THIAM concentration is low only in these Gulf of Bothnia salmon, such as in 2004 [2,22]. Judging from the stomach content, individual differences in feeding preferences may also explain some of the intra-annual variation in the incidence of M74 [109]. The retention of lipids can probably also differ between salmon individuals, even if they consume the same prey [110]. However, with a diet rich in marine lipids, both the lipid content and the concentrations of DHA and total n−3 PUFAs in salmonines generally increase with size [13,58,60]. Large differences in thiamine status can easily arise between individuals when lipid peroxidation intensifies during fasting, consuming not only thiamine but other antioxidants that protect against general oxidative stress [111,112]. As thiamine deficiency also increases oxidative stress [10], thiamine may decrease with the peroxidation of n−3 PUFAs in a vicious spiral [8,13].

5. Conclusions

The feeding area of spawning salmon can be revealed by FASA in eggs, as well as in muscle. However, only high body lipid content and the high concentration of n−3 PUFAs, mainly DHA, are associated with the low concentration of THIAM in eggs and high YSFM. Salmon M74 is most likely to develop in the Baltic Proper when large year-classes of sprat hatch. However, in a year when a strong cohort of herring is hatched in the Gulf of Bothnia, a higher proportion of Baltic salmon than usual remains to feed in the Gulf of Bothnia, instead of migrating to the Baltic Proper, which is their principal feeding area. Due to the high dietary amount of young and fatty herring in the Gulf of Bothnia, in which the concentration of n−3 PUFAs is higher than in somewhat older herring [17], thiamine deficiency in salmon can also result from feeding in the Gulf of Bothnia. Because reared River Dal salmon, and reared salmon in general, remain to feed in the Gulf of Bothnia more frequently than wild salmon in years when very strong year-classes of herring hatch there, the incidence of M74 is higher among the River Dal salmon and in reared salmon from other Gulf of Bothnia rivers. Differences can also be caused by the predation of some River Dal salmon in the Gulf of Bothnia before continuing to the Baltic Proper. The differences in size between the River Simojoki and River Dal salmon and the differences in their feeding migrations are particularly reflected in M74 females due to their higher body lipid content. The River Neris salmon can also extend their feeding migration to the Gulf of Bothnia. The strong year-classes of both Baltic Proper sprat and Gulf of Bothnia herring increase the lipid content and the concentration and proportion of n−3 PUFAs, especially DHA, in salmon. This results in poor thiamine status in females and a low THIAM concentration in their eggs as thiamine is destroyed, acting as a site-specific antioxidant against lipid peroxidation. Compared to the eggs of Baltic salmon, the eggs of Arctic Ocean salmon, despite having a higher lipid content, contain n−3 PUFAs in lower, and SFAs in higher, proportions. This is due to a more varied ocean diet, which also contains crustaceans and results in higher egg THIAM concentrations than in Baltic salmon. To conclude, thiamine deficiency can develop in Baltic salmon not only after foraging heavily on young sprat in the Baltic Proper but also after foraging heavily on young fatty herring in the Gulf of Bothnia and depends on the abundance of n−3 PUFAs in the diet.

Supplementary Materials

The following supporting information can be downloaded at https://www.mdpi.com/article/10.3390/fishes9020058/s1. Table S1: Mean (±SE) proportions of fatty acids (FAs) and sums of FA structural classes, and body parameters (body mass, length, and condition factor, CF), lipid content in muscle and eggs, and the concentrations of free thiamine (THIAM) in muscle and in unfertilized eggs of River Simojoki salmon female spawners of the M74 year 2016 from the Baltic Proper and Gulf of Bothnia feeding areas; Table S2: Mean (±SE) body mass, total length, and condition factor (CF) of salmon female spawners from the Baltic Rivers Simojoki, Dal, and Neris in 2014–2017 classified as Baltic Proper and the Gulf of Bothnia feeding areas, and those of the River Tenojoki from the Arctic Ocean in 1997, with the number of samples. The concentrations of thiamine components (TPP = thiamine pyrophosphate, TMP = thiamine monophosphate, and THIAM = free thiamine) and total thiamine (TotTh) and lipid content and the proportions of fatty acids and their structural classes in unfertilized eggs are also given; Figure S1: Mean (±SE) fatty acid (FA) concentrations with sums of FA structural classes in the muscle and unfertilized eggs of salmon ascending the River Simojoki in 2014 and 2016 and that had been feeding in the Baltic Proper; Figure S2: Biplots based on PCA for the proportions of fatty acids (FAs) in the eggs of 2nd sea-year salmon in the fall of 2016 from the River Simojoki (Simo) and River Dal (Dal) from (a) the Baltic Proper and (b) the Gulf of Bothnia; Figure S3: Biplot based on PCA for the proportions of fatty acids (FAs) in unfertilized eggs of 2nd sea-year Baltic salmon in the fall of 2017 from (a) the River Simojoki (N = 20), (b) the River Dal (N = 20), and (c) the River Neris (N = 12); Figure S4: Biplot based on PCA for the proportions of fatty acids (FAs) in the eggs of 2nd sea-year salmon in the fall of 2017 from the River Simojoki (Simo) and River Dal (Dal) from the Baltic Proper; Figure S5: Linear models with 95% confidence bands for the correlations of lipid content in unfertilized eggs with (a) total length and (b) body mass of salmon females of the Rivers Simojoki, Dal, Neris, and Tenojoki. Ref. [8] cited in the Supplementary Materials.

Author Contributions

Conceptualization, M.K. and P.J.V.; investigation, P.H. and P.J.V.; resources, P.H., T.P., R.K., P.J.V., M.K., S.N., T.R. and M.R.; validation, S.N., T.R. and M.R.; formal analysis, P.J.V. and R.K.; data curation, P.J.V., P.H., S.N., T.R. and M.R.; writing—original draft preparation, M.K. and P.J.V.; writing—review and editing, R.K., T.P., P.H., M.K., P.J.V., S.N., T.R. and M.R.; visualization, P.J.V., M.K. and R.K.; project administration, P.J.V. All authors have read and agreed to the published version of the manuscript.

Funding

This research received no external funding.

Institutional Review Board Statement

In Finland, the procedure of this research related to sample collection and treatment is set in the legislation and official governmental administrative regulations and obeys European legislation in animal experimentation. We only relayed and utilized the yearly practice and routine in the Baltic salmon conservative program.

Data Availability Statement

The datasets used and analyzed during the current study are available from the corresponding author upon reasonable request.

Acknowledgments

We thank EHFVF in the national monitoring program of M74 in salmon of the Swedish University of Agricultural Sciences, Sweden, for resources, Esa-Pekka Juntunen for taking the River Simojoki salmon samples and providing the samples and fish data, Jörgen Rask and Stefan Palm from the Swedish University of Agricultural Sciences, Egidijus Leliūna from the Fisheries Service under the Ministry of Agriculture of the Lithuanian Republic, and Sirkka Heinimaa for providing salmon eggs and data for the Rivers Dal, Neris, and Tenojoki, respectively. Rupert Moreton revised the English.

Conflicts of Interest

The authors declare no conflicts of interest. The funders played no role in the design of the study, the collection, analyses, or interpretation of data, the writing of the manuscript, or the decision to publish the results.

References

  1. Keinänen, M.; Uddström, A.; Mikkonen, J.; Casini, M.; Pönni, J.; Myllylä, T.; Aro, E.; Vuorinen, P.J. The thiamine deficiency syndrome M74, a reproductive disorder of Atlantic salmon (Salmo salar) feeding in the Baltic Sea, is related to the fat and thiamine content of prey fish. ICES J. Mar. Sci. 2012, 69, 516–528. [Google Scholar] [CrossRef]
  2. Keinänen, M.; Käkelä, R.; Ritvanen, T.; Pönni, J.; Harjunpää, H.; Myllylä, T.; Vuorinen, P.J. Fatty acid signatures connect thiamine deficiency with the diet of the Atlantic salmon (Salmo salar) feeding in the Baltic Sea. Mar. Biol. 2018, 165, 161. [Google Scholar] [CrossRef]
  3. Koski, P.; Pakarinen, M.; Nakari, T.; Soivio, A.; Hartikainen, K. Treatment with thiamine hydrochloride and astaxanthine for the prevention of yolk-sac mortality in Baltic salmon fry (M74 syndrome). Dis. Aquat. Org. 1999, 37, 209–220. [Google Scholar] [CrossRef]
  4. Vuorinen, P.J.; Juntunen, E.-P.; Iivari, J.; Koski, P.; Nikonen, S.; Rokka, M.; Ritvanen, T.; Pakkala, J.; Heinimaa, P.; Keinänen, M. Lipid-related thiamine deficiency cause mortality of river lampreys (Lampetra fluviatilis) during pre-spawning fasting. Reg. Stud. Mar. Sci. 2023, 62, 14. [Google Scholar] [CrossRef]
  5. Crozier, L.G.; Siegel, J.E. A comprehensive review of the impacts of climate change on salmon: Strengths and weaknesses of the Literature by life stage. Fishes 2023, 8, 50. [Google Scholar] [CrossRef]
  6. Bylund, G.; Lerche, O. Thiamine therapy of M74 affected fry of Atlantic salmon Salmo salar. Bull. Eur. Assoc. Fish Pathol. 1995, 15, 93–97. [Google Scholar]
  7. Futia, M.H.; Connerton, M.J.; Weidel, B.C.; Rinchard, J. Diet predictions of Lake Ontario salmonines based on fatty acids and correlations between their fat content and thiamine concentrations. J. Great Lakes Res. 2019, 45, 934–948. [Google Scholar] [CrossRef]
  8. Vuorinen, P.J.; Rokka, M.; Nikonen, S.; Juntunen, E.-P.; Ritvanen, T.; Heinimaa, P.; Keinänen, M. Model for estimating thiamine deficiency-related mortality of Atlantic salmon (Salmo salar) offspring and variation in the Baltic salmon M74 syndrome. Mar. Freshw. Behav. Physiol. 2021, 54, 97–131. [Google Scholar] [CrossRef]
  9. Tocher, D.R. Metabolism and functions of lipids and fatty acids in teleost fish. Rev. Fish. Sci. 2003, 11, 107–184. [Google Scholar] [CrossRef]
  10. Gibson, G.E.; Zhang, H. Interactions of oxidative stress with thiamine homeostasis promote neurodegeneration. Neurochem. Int. 2002, 40, 493–504. [Google Scholar] [CrossRef]
  11. Lonsdale, D.; Marrs, C. Thiamine Deficiency Disease, Dysautonomia, and High Calorie Malnutrition; Academic Press: London, UK; San Diego, CA, USA, 2019. [Google Scholar]
  12. Mommsen, T.P.; Walsh, P.J. Vitellogenesis and oocyte assembly. In Fish Physiology, Volume XI, The Physiology of Developing Fish, Part A Eggs and Larvae; Hoar, W.S., Randall, D.J., Eds.; Academic Press: London, UK, 1988; pp. 347–406. [Google Scholar]
  13. Keinänen, M.; Nikonen, S.; Käkelä, R.; Ritvanen, T.; Rokka, M.; Myllylä, T.; Pönni, J.; Vuorinen, P.J. High lipid content of prey fish and n-3 PUFA peroxidation impair the thiamine status of feeding-migrating Atlantic salmon (Salmo salar) and is reflected in hepatic biochemical indices. Biomolecules 2022, 12, 526. [Google Scholar] [CrossRef]
  14. Woodward, B. Dietary vitamin requirements of cultured young fish, with emphasis on quantitative estimates for salmonids. Aquaculture 1994, 124, 133–168. [Google Scholar] [CrossRef]
  15. Depeint, F.; Bruce, W.R.; Shangari, N.; Mehta, R.; O’Brien, P.J. Mitochondrial function and toxicity: Role of the B vitamin family on mitochondrial energy metabolism. Chem. Biol. Interact. 2006, 163, 94–112. [Google Scholar] [CrossRef]
  16. Combs, G.F., Jr.; McClung, J.P. Thiamin. In The Vitamins, Fundamental Aspects in Nutrition and Health, 5th ed.; Academic Press: London/Cambridge/Oxford, UK; San Diego, CA, USA, 2017; pp. 297–314. [Google Scholar]
  17. Keinänen, M.; Käkelä, R.; Ritvanen, T.; Myllylä, T.; Pönni, J.; Vuorinen, P.J. Fatty acid composition of sprat (Sprattus sprattus) and herring (Clupea harengus) in the Baltic Sea as potential prey for salmon (Salmo salar). Helgol. Mar. Res. 2017, 71, 4. [Google Scholar] [CrossRef]
  18. Thomas, M.J. The role of free radicals and antioxidants: How do we know that they are working? Crit. Rev. Food Sci. 1995, 35, 21–39. [Google Scholar] [CrossRef]
  19. Spector, A.A. Lipid metabolism: Essential fatty acids. In Biochemical and Physiological Aspects of Human Nutrition; Stipanuk, M.H., Ed.; Saunders/Elsevier: Amsterdam, The Netherlands, 2000; pp. 365–383. [Google Scholar]
  20. Del Rio, D.; Stewart, A.J.; Pellegrini, N. A review of recent studies on malondialdehyde as toxic molecule and biological marker of oxidative stress. Nutr. Metab. Cardiovasc. Dis. 2005, 15, 316–328. [Google Scholar] [CrossRef]
  21. Lukienko, P.I.; Mel’nichenko, N.G.; Zverinskii, I.V.; Zabrodskaya, S.V. Antioxidant properties of thiamine. Bull. Exp. Biol. Med. 2000, 130, 874–876. [Google Scholar] [CrossRef]
  22. Vuorinen, P.J.; Rokka, M.; Ritvanen, T.; Käkelä, R.; Nikonen, S.; Pakarinen, T.; Keinänen, M. Changes in thiamine concentrations, fatty acid composition, and some other lipid-related biochemical indices in Baltic Sea Atlantic salmon (Salmo salar) during the spawning run and pre-spawning fasting. Helgol. Mar. Res. 2020, 74, 10. [Google Scholar] [CrossRef]
  23. Balon, E.K. Terminology of intervals in fish development. J. Fish. Board Can. 1975, 32, 1663–1670. [Google Scholar] [CrossRef]
  24. Brown, S.B.; Fitzsimons, J.D.; Palace, V.P.; Vandenbyllaardt, L. Thiamine and early mortality syndrome in lake trout. In Early Life Stage Mortality Syndrome in Fishes of the Great Lakes and the Baltic Sea; McDonald, G., Fitzsimons, J.D., Honeyfield, D.C., Eds.; American Fisheries Society: Bethesda, MD, USA, 1998; pp. 18–25. [Google Scholar]
  25. Keinänen, M.; Tolonen, T.; Ikonen, E.; Parmanne, R.; Tigerstedt, C.; Rytilahti, J.; Soivio, A.; Vuorinen, P.J. Reproduction disorder of Baltic salmon—M74. In Kalatutkimuksia—Fiskundersökningar; Finnish Game and Fisheries Research Institute: Helsinki, Finland, 2000; Volume 165, 38p, (In Finnish with English Abstract). [Google Scholar]
  26. Brown, S.B.; Arts, M.T.; Brown, L.R.; Brown, M.; Moore, K.; Villella, M.; Fitzsimons, J.D.; Honeyfield, D.C.; Tillitt, D.E.; Zajicek, J.L.; et al. Can diet-dependent factors help explain fish-to-fish variation in thiamine-dependent early mortality syndrome? J. Aquat. Anim. Health 2005, 17, 36–47. [Google Scholar] [CrossRef]
  27. Amcoff, P.; Börjeson, H.; Landergren, P.; Vallin, L.; Norrgren, L. Thiamine (vitamin B1) concentrations in salmon (Salmo salar), brown trout (Salmo trutta) and cod (Gadus morhua) from the Baltic sea. Ambio 1999, 28, 48–54. [Google Scholar]
  28. Brown, S.B.; Honeyfield, D.C.; Hnath, J.G.; Wolgamood, M.; Marcquenski, S.V.; Fitzsimons, J.D.; Tillitt, D.E. Thiamine status in adult salmonines in the Great Lakes. J. Aquat. Anim. Health 2005, 17, 59–64. [Google Scholar] [CrossRef]
  29. Futia, M.H.; Hallenbeck, S.; Noyes, A.D.; Honeyfield, D.C.; Eckerlin, G.E.; Rinchard, J. Thiamine deficiency and the effectiveness of thiamine treatments through broodstock injections and egg immersion on Lake Ontario steelhead trout. J. Great Lakes Res. 2017, 43, 352–358. [Google Scholar] [CrossRef]
  30. Aro, E. A review of fish migration patterns in the Baltic. Rap. Proc.-Verb. Reun. Cons. Int. Explor. Mer. 1989, 190, 72–96. [Google Scholar]
  31. Bartel, R. Return of salmon back to Polish waters. Int. J. Ecohydr. Hydrobiol. 2001, 1, 377–392. [Google Scholar]
  32. Ikonen, E. The Role of the Feeding Migration and Diet of Atlantic Salmon (Salmo salar L.) in Yolk-Sac Fry Mortality (M74) in the Baltic Sea. Ph.D. Thesis, Department of Biological and Environmental Sciences, Faculty of Biosciences, University of Helsinki, Finland and Finnish Game and Fisheries Research Institute, Helsinki, Finland, 2006. [Google Scholar]
  33. Salminen, M.; Kuikka, S.; Erkamo, E. Divergence in feeding migration of Baltic salmon (Salmo salar L.); the significance of smolt size. Nord. J. Freshw. Res. 1994, 69, 32–42. [Google Scholar]
  34. Jutila, E.; Jokikokko, E.; Kallio-Nyberg, I.; Saloniemi, I.; Pasanen, P. Differences in sea migration between wild and reared Atlantic salmon (Salmo salar L.) in the Baltic Sea. Fish. Res. 2003, 60, 333–343. [Google Scholar] [CrossRef]
  35. Kallio-Nyberg, I.; Romakkaniemi, A.; Jokikokko, E.; Saloniemi, I.; Jutila, E. Differences between wild and reared Salmo salar stocks of two northern Baltic Sea rivers. Fish. Res. 2015, 165, 85–95. [Google Scholar] [CrossRef]
  36. Kallio-Nyberg, I.; Saloniemi, I.; Jutila, E.; Jokikokko, E. Effect of hatchery rearing and environmental factors on the survival, growth and migration of Atlantic salmon in the Baltic Sea. Fish. Res. 2011, 109, 285–294. [Google Scholar] [CrossRef]
  37. Karlsson, L.; Ikonen, E.; Mitans, A.; Hansson, S. The diet of salmon (Salmo salar) in the Baltic sea and connections with the M74 syndrome. Ambio 1999, 28, 37–42. [Google Scholar]
  38. Hansson, S.; Karlsson, L.; Ikonen, E.; Christensen, O.; Mitans, A.; Uzars, D.; Petersson, E.; Ragnarsson, B. Stomach analyses of Baltic salmon from 1959-1962 and 1994-1997: Possible relations between diet and yolk-sac-fry mortality (M74). J. Fish Biol. 2001, 58, 1730–1745. [Google Scholar] [CrossRef]
  39. Mikkonen, J.; Keinänen, M.; Casini, M.; Pönni, J.; Vuorinen, P.J. Relationships between fish stock changes in the Baltic Sea and the M74 syndrome, a reproductive disorder of Atlantic salmon (Salmo salar). ICES J. Mar. Sci. 2011, 68, 2134–2144. [Google Scholar] [CrossRef]
  40. Vuorinen, P.J.; Parmanne, R.; Vartiainen, T.; Keinänen, M.; Kiviranta, H.; Kotovuori, O.; Halling, F. PCDD, PCDF, PCB and thiamine in Baltic herring (Clupea harengus L.) and sprat [Sprattus sprattus (L.)] as a background to the M74 syndrome of Baltic salmon (Salmo salar L.). ICES J. Mar. Sci. 2002, 59, 480–496. [Google Scholar] [CrossRef]
  41. Røjbek, M.C.; Tomkiewicz, J.; Jacobsen, C.; Støttrup, J.G. Forage fish quality: Seasonal lipid dynamics of herring (Clupea harengus L.) and sprat (Sprattus sprattus L.) in the Baltic Sea. ICES J. Mar. Sci. 2014, 71, 56–71. [Google Scholar] [CrossRef]
  42. ICES. Baltic fisheries assessment working group (WGBFAS). ICES Sci. Rep. 2020, 2, 643. [Google Scholar] [CrossRef]
  43. Pönni, J. 3. Kilohaili. In Kalakantojen Tila Vuonna 2021 Sekä Ennuste Vuosille 2022 ja 2023; Luonnonvara- ja biotalouden tutkimus 72; Raitaniemi, J., Sairanen, S., Eds.; Natural Resources Institute Finland (Luke): Helsinki, Finland, 2022; pp. 24–28. (In Finnish) [Google Scholar]
  44. Pönni, J. 2. Silakka. In Kalakantojen Tila Vuonna 2021 Sekä Ennuste Vuosille 2022 ja 2023; Luonnonvara- ja biotalouden tutkimus 72; Raitaniemi, J., Sairanen, S., Eds.; Natural Resources Institute Finland (Luke): Helsinki, Finland, 2022; pp. 9–23. (In Finnish) [Google Scholar]
  45. Raitaniemi, J.; Natural Resources Institute Finland (Luke), Turku, Finland. Personal communication, 2016.
  46. Ackman, R.G. Characteristics of the fatty acid composition and biochemistry of some fresh-water fish oils and lipids in comparison with marine oils and lipids. Comp. Biochem. Physiol. 1967, 22, 907–922. [Google Scholar] [CrossRef]
  47. Budge, S.M.; Iverson, S.J.; Bowen, W.D.; Ackman, R.G. Among- and within-species variability in fatty acid signatures of marine fish and invertebrates on the Scotian Shelf, Georges Bank, and southern Gulf of St. Lawrence. Can. J. Fish. Aquat. Sci. 2002, 59, 886–898. [Google Scholar] [CrossRef]
  48. Happel, A.; Pattridge, R.; Walsh, M.; Rinchard, J. Assessing diet compositions of Lake Ontario predators using fatty acid profiles of prey fishes. J. Great Lakes Res. 2017, 43, 838–845. [Google Scholar] [CrossRef]
  49. Happel, A.; Maier, C.; Farese, N.; Czesny, S.; Rinchard, J. Fatty acids differentiate consumers despite variation within prey fatty acid profiles. Freshw. Biol. 2019, 64, 1416–1426. [Google Scholar] [CrossRef]
  50. Vuorinen, P.J.; Keinänen, M.; Heinimaa, P.; Iivari, J.; Juntunen, E.-P.; Kannel, R.; Pakarinen, T.; Romakkaniemi, A. M74-oireyhtymän seuranta Itämeren lohikannoissa. In RKTL:n Työraportteja 41; Finnish Game and Fisheries Research Institute: Helsinki, Finland, 2014; 24p. (In Finnish) [Google Scholar]
  51. Hiilivirta, P.; Ikonen, E.; Lappalainen, J. Comparison of two methods for distinguishing wild from hatchery-reared salmon (Salmo salar Linnaeus, 1758) in the Baltic Sea. ICES J. Mar. Sci. 1998, 55, 981–986. [Google Scholar] [CrossRef]
  52. Lind, Y.; Huovila, T.; Käkelä, R. A retrospective study of fatty acid composition in Baltic herring (Clupea harengus membras) caught at three locations in the Baltic Sea (1973–2009). ICES J. Mar. Sci. 2018, 75, 330–339. [Google Scholar] [CrossRef]
  53. Happel, A.; Jonas, J.L.; McKenna, P.R.; Rinchard, J.; He, J.X.; Czesny, S.J. Spatial variability of lake trout diets in Lakes Huron and Michigan revealed by stomach content and fatty acid profiles. Can. J. Fish. Aquat. Sci. 2018, 75, 95–105. [Google Scholar] [CrossRef]
  54. Kvalheim, O.M.; Karstang, T.V. A general-purpose program for multivariate data- analysis. Chemometr. Intell. Lab. 1987, 2, 235–237. [Google Scholar] [CrossRef]
  55. Wold, S.; Sjöström, M. SIMCA: A method for analyzing chemical data in terms of similarity and analogy. In Chemometrics: Theory and Application; Kowalski, B., Ed.; American Chemical Society: Washington, DC, USA, 1977; pp. 243–282. [Google Scholar]
  56. Corraze, G.; Kaushik, S. Lipids from marine and freshwater fish, Les lipides des poissons marins et d’eau douce. OCL 1999, 6, 111–115. [Google Scholar]
  57. Polvi, S.M.; Ackman, R.G. Atlantic salmon (Salmo salar) muscle lipids and their response to alternative dietary fatty acid sources. J. Agric. Food Chem. 1992, 40, 1001–1007. [Google Scholar] [CrossRef]
  58. Gélineau, A.; Corraze, G.; Boujard, T.; Larroquet, L.; Kaushik, S. Relation between dietary lipid level and voluntary feed intake, growth, nutrient gain, lipid deposition and hepatic lipogenesis in rainbow trout. Reprod. Nutr. Dev. 2001, 41, 487–503. [Google Scholar] [CrossRef] [PubMed]
  59. Penney, Z.L.; Moffitt, C.M. Fatty-acid profiles of white muscle and liver in stream-maturing steelhead trout Oncorhynchus mykiss from early migration to kelt emigration. J. Fish Biol. 2015, 86, 105–120. [Google Scholar] [CrossRef] [PubMed]
  60. Alvarez, M.J.; Lopez-Bote, C.J.; Diez, A.; Corraze, G.; Arzel, J.; Dias, J.; Kaushik, S.J.; Bautista, J.M. Dietary fish oil and digestible protein modify susceptibility to lipid peroxidation in the muscle of rainbow trout (Oncorhynchus mykiss) and sea bass (Dicentrarchus labrax). Br. J. Nutr. 1998, 80, 281–289. [Google Scholar] [CrossRef] [PubMed]
  61. Kjær, M.; Todorcevic, M.; Torstensen, B.; Vegusdal, A.; Ruyter, B. Dietary n-3 HUFA affects mitochondrial fatty acid β-oxidation capacity and susceptibility to oxidative stress in Atlantic salmon. Lipids 2008, 43, 813–827. [Google Scholar] [CrossRef]
  62. Stillwell, W.; Wassall, S.R. Docosahexaenoic acid: Membrane properties of a unique fatty acid. Chem. Phys. Lipids 2003, 126, 1–27. [Google Scholar] [CrossRef]
  63. Vuorinen, P.J.; Paasivirta, J.; Piilola, T.; Surma-Aho, K.; Tarhanen, J. Organochlorine compounds in Baltic salmon and trout. I. Chlorinated hydrocarbons and chlorophenols 1982. Chemosphere 1985, 14, 1729–1740. [Google Scholar] [CrossRef]
  64. Jobling, M. Nutrient partitioning and the influence of feed composition on body composition. In Food Intake in Fish; Houlihan, D., Boujard, T., Jobling, M., Eds.; Blackwell Science Ltd.: Oxford, UK, 2001; pp. 354–375. [Google Scholar]
  65. Jacobsen, J.A.; Hansen, L.P. Feeding habits of wild and escaped farmed Atlantic salmon, Salmo salar L., in the Northeast Atlantic. ICES J. Mar. Sci. 2001, 58, 916–933. [Google Scholar] [CrossRef]
  66. Hyvönen, L.; Koivistoinen, P. Fatty acid analysis, TAG equivalents as net fat value, and nutritional attributes of fish and fish products. J. Food Compos. Anal. 1994, 7, 44–58. [Google Scholar] [CrossRef]
  67. Thurow, F. On Food, Behaviour and Population Mechanism of Baltic Salmon; Report 4; Swedish Salmon Research Institute: Stockholm, Sweden, 1968; pp. 1–16. [Google Scholar]
  68. Saether, O.; Ellingsen, T.E.; Mohr, V. Lipids of North Atlantic krill. J. Lipid Res. 1987, 27, 274–285. [Google Scholar] [CrossRef]
  69. Tou, J.C.; Jaczynski, J.; Chen, Y.-C. Krill for Human Consumption: Nutritional Value and Potential Health Benefits. Nutr. Rev. 2007, 65, 63–77. [Google Scholar] [CrossRef]
  70. Vuorinen, P.J.; Myllylä, T.; Ritvanen, T.; Keinänen, M. Lipid and fatty acid contents in three prey species of Baltic salmon (Salmo salar) from three areas of the Baltic Sea. Manuscript in preparation.
  71. Salminen, M.; Erkamo, E.; Salmi, J. Diet of post-smolt and one-sea-winter Atlantic salmon in the Bothnian Sea, northern Baltic. J. Fish Biol. 2001, 58, 16–35. [Google Scholar] [CrossRef]
  72. Budge, S.M.; Penney, S.N.; Lall, S.P. Response of tissue lipids to diet variation in Atlantic salmon (Salmo salar): Implications for estimating diets with fatty acid analysis. J. Exp. Mar. Biol. Ecol. 2011, 409, 267–274. [Google Scholar] [CrossRef]
  73. Vuorinen, P.J.; Keinänen, M.; Kiviranta, H.; Koistinen, J.; Kiljunen, M.; Myllylä, T.; Pönni, J.; Peltonen, H.; Verta, M.; Karjalainen, J. Biomagnification of organohalogens in Atlantic salmon (Salmo salar) from its main prey species in three areas of the Baltic Sea. Sci. Total Environ. 2012, 421–422, 129–143. [Google Scholar] [CrossRef] [PubMed]
  74. Pickova, J.; Kiessling, A.; Pettersson, A.; Dutta, P.C. Comparison of fatty acid composition and astaxanthin content in healthy and by M74 affected salmon eggs from three Swedish river stocks. Comp. Biochem. Physiol. B 1998, 120, 265–271. [Google Scholar] [CrossRef]
  75. Zhang, J.; Tao, N.; Zhao, Y.; Wang, X.; Wang, M. Comparison of the fatty acid and triglyceride profiles of big eye tuna (Thunnus obesus), Atlantic salmon (Salmo salar) and bighead carp (Aristichthysnobilis) heads. Molecules 2019, 24, 3983. [Google Scholar] [CrossRef]
  76. Kallio-Nyberg, I.; Peltonen, H.; Rita, H. Effects of stock-specific and environmental factors on the feeding migration of Atlantic salmon (Salmo salar) in the Baltic Sea. Can. J. Fish. Aquat. Sci. 1999, 56, 853–861. [Google Scholar] [CrossRef]
  77. Pakarinen, T.; Romakkaniemi, A.; Jokikokko, E.; Orell, P.; Erkinaro, J.; Koljonen, M.-L.; Keinänen, M.; Saura, A.; Jaala, E. 4. Lohi. In Kalakantojen Tila Vuonna 2016 Sekä Ennuste Vuosille 2017 ja 2018; Luonnonvara- ja biotalouden tutkimus 77; Raitaniemi, J., Manninen, K., Eds.; Natural Resources Institute Finland (Luke): Helsinki, Finland, 2017; pp. 27–49. (In Finnish) [Google Scholar]
  78. Jacobson, P.; Gådmark, A.; Huss, M. Population and size-specific distribution of Atlantic salmon Salmo salar in the Baltic Sea over five decades. J. Fish Biol. 2020, 96, 408–417. [Google Scholar] [CrossRef]
  79. Keinänen, M.; Iivari, J.; Juntunen, E.-P.; Kannel, R.; Heinimaa, P.; Nikonen, S.; Pakarinen, T.; Romakkaniemi, A.; Vuorinen, P.J. Thiamine Deficiency M74 of Salmon Can Be Prevented; Riista- ja kalatalous Selvityksiä 14/2014; Luke: Helsinki, Finland, 2014; 41p. (In Finnish) [Google Scholar]
  80. Holder, P.E.; Wood, C.M.; Lawrence, M.J.; Clark, T.D.; Suski, C.D.; Weber, J.-M.; Danylchuk, A.J.; Cooke, S.J. Are we any closer to understanding why fish can die after severe exercise? Fish Fish. 2022, 23, 1400–1417. [Google Scholar] [CrossRef]
  81. Pasternack, M.; Salminen, M.; Heinimaa, P. Physiological Condition and Migratory Readiness of Hatchery-Reared Neva Stock Salmon Smolts in 2007–2009; Riista- ja Kalatalous Selvityksiä 16/2010; Finnish Game and Fisheries Research Institute: Helsinki, Finland, 2010; 33p. (In Finnish) [Google Scholar]
  82. Pönni, J. 1. Silakka. In Kalakantojen Tila Vuonna 2016 Sekä Ennuste Vuosille 2017 ja 2018; Luonnonvara- ja biotalouden tutkimus 77; Raitaniemi, J., Manninen, K., Eds.; Natural Resources Institute Finland (Luke): Helsinki, Finland, 2017; pp. 6–17. (In Finnish) [Google Scholar]
  83. ICES. Report of the Baltic Fisheries Assessment Working Group (WGBFAS), 19–26 April 2017, Copenhagen, Denmark, Proceedings of the ICES CM 2017/ACOM:11; The International Council for the Exploration of the Sea (ICES): Copenhagen, Denmark, 2017; p. 810. [Google Scholar]
  84. Raitaniemi, J.; Manninen, K. (Eds.) Kalakantojen Tila Vuonna 2014 Sekä Ennuste Vuosille 2015 ja 2016; Natural Resources Institute Finland (Luke): Helsinki, Finland, 2015; p. 90. (In Finnish) [Google Scholar]
  85. Raitaniemi, J.; Manninen, K. (Eds.) Kalakantojen Tila Vuonna 2015 Sekä Ennuste Vuosille 2016 ja 2017; Luonnonvara- ja biotalouden tutkimus 57; Natural Resources Institute Finland (Luke): Helsinki, Finland, 2016; p. 85. (In Finnish) [Google Scholar]
  86. Pönni, J. Silakka. In Kalakantojen Tila Vuonna 2018 Sekä Ennuste Vuosille 2019 ja 2020; Sairanen, S., Raitaniemi, J., Eds.; Luonnonvara- ja biotalouden tutkimus 48; Natural Resources Institute Finland (Luke): Helsinki, Finland, 2019; pp. 6–16. (In Finnish) [Google Scholar]
  87. Bagge, O.; Thurow, F.; Steffensen, E.; Bay, J. The Baltic cod. Dana 1994, 10, 1–28. [Google Scholar]
  88. Niiranen, S.; Orio, A.; Bartolino, V.; Bergström, U.; Kallasvuo, M.; Neuenfeldt, S.; Ustups, D.; Casini, M. Predator-prey body size relationships of cod in a low-diversity marine system. Mar. Ecol.-Progr. Ser. 2019, 627, 201–206. [Google Scholar] [CrossRef]
  89. Jacobson, P.; Gårdmark, A.; Östergren, J.; Casini, M.; Huss, M. Size-dependent prey availability affects diet and performance of predatory fish at sea: A case study of Atlantic salmon. Ecosphere 2018, 9, e02081. [Google Scholar] [CrossRef]
  90. ICES. Baltic fisheries assessment working group (WGBFAS). ICES Sci. Rep. 2021, 3, 732. [Google Scholar] [CrossRef]
  91. Möllmann, C.; Kornilovs, G.; Fetter, M.; Köster, F.W. Climate, zooplankton, and pelagic fish growth in the central Baltic Sea. ICES J. Mar. Sci. 2005, 62, 1270–1280. [Google Scholar] [CrossRef]
  92. Casini, M.; Cardinale, M.; Hjelm, J. Inter-annual variation in herring, Clupea harengus, and sprat, Sprattus sprattus, condition in the central Baltic Sea: What gives the tune? Oikos 2006, 112, 638–650. [Google Scholar] [CrossRef]
  93. ICES. Baltic salmon and trout assessment working group (WGBAST). ICES Sci. Rep. 2020, 2, 261. [Google Scholar] [CrossRef]
  94. Axén, C.; Koski, P. Salmon Deaths in Torne River 2014–2016, Report of a Swedish-Finnish Survey, Dnr SVA 2017/59; Dnr Evira/2489/0165/2016; SVA: Uppsala, Sweden; Evira: Oulu, Finland, 2017; 92p, Available online: https://www.sva.se/media/lmkd2dbf/slutrapport_laxdoden-tornealv_2016.pdf (accessed on 21 April 2017)(In Swedish and Finnish).
  95. Salminen, M. Marine Survival of Atlantic Salmon in the Baltic Sea; Technical Report 4; North Pacific Anadromous Fish Commission: Vancouver, BC, Canada, 2002; pp. 27–29. [Google Scholar]
  96. Østbye, T.K.; Kjær, M.A.; Rørå, A.M.B.; Torstensen, B.; Ruyter, B. High n-3 HUFA levels in the diet of Atlantic salmon affect muscle and mitochondrial membrane lipids and their susceptibility to oxidative stress. Aquacult. Nutr. 2011, 17, 177–190. [Google Scholar] [CrossRef]
  97. Czesny, S.; Dettmers, J.M.; Rinchard, J.; Dabrowski, K. Linking egg thiamine and fatty acid concentrations of Lake Michigan lake trout with early life stage mortality. J. Aquat. Anim. Health 2009, 21, 262–271. [Google Scholar] [CrossRef] [PubMed]
  98. Frankel, E.N. Lipid Oxidation; Woodhead Publishing Limited: Cambridge, UK, 2012; p. 470. [Google Scholar]
  99. Parrish, C.C. Essential fatty acids in aquatic food webs. In Lipids in Aquatic Ecosystems; Arts, M.T., Brett, M.T., Kainz, M.J., Eds.; Springer: Dordrecht, The Netherlands; Heidelberg, Germany; London, UK; New York, NY, USA, 2009; pp. 309–326. [Google Scholar]
  100. Logue, J.A.; Howell, B.R.; Bell, J.G.; Cossins, A.R. Dietary n-3 long-chain polyunsaturated fatty acid deprivation, tissue lipid composition, ex vivo prostaglandin production, and stress tolerance in juvenile dover sole (Solea solea L.). Lipids 2000, 35, 745–755. [Google Scholar] [CrossRef] [PubMed]
  101. Ahlgren, G.; Vrede, T.; Goedkoop, W. Fatty acid ratios in freshwater fish, zooplankton and zoobenthos—Are there spesific optima? In Lipids in Aquatic Ecosystems; Arts, M.T., Brett, M.T., Kainz, M.J., Eds.; Springer: Dordrecht, The Netherlands; Heidelberg, Germany; London, UK; New York, NY, USA, 2009; pp. 147–178. [Google Scholar]
  102. Zheng, X.; Torstensen, B.E.; Tocher, D.R.; Dick, J.R.; Henderson, R.J.; Bell, J.G. Environmental and dietary influences on highly unsaturated fatty acid biosynthesis and expression of fatty acyl desaturase and elongase genes in liver of Atlantic salmon (Salmo salar). BBA-Mol. Cell Biol. L. 2005, 1734, 13–24. [Google Scholar] [CrossRef]
  103. Morais, S.; Monroig, O.; Zheng, X.; Leaver, M.J.; Tocher, D.R. Highly unsaturated fatty acid synthesis in Atlantic salmon: Characterization of ELOVL5- and ELOVL2-like elongases. Mar. Biotechnol. 2009, 11, 627–639. [Google Scholar] [CrossRef]
  104. Jacobson, P. Size-Dependent Predator-Prey Interactions, Distribution and Mortality in Salmon: Effects on Individuals and Populations. Ph.D. Thesis, Swedish University of Agricultural Sciences, SLU, Öregrund, Sweden, 2020. [Google Scholar]
  105. Pönni, J. 2. Kilohaili. In Kalakantojen tila Vuonna 2016 Sekä Ennuste Vuosille 2017 ja 2018; Luonnonvara-ja biotalouden tutkimus 77; Raitaniemi, J., Manninen, K., Eds.; Natural Resources Institute Finland (Luke): Helsinki, Finland, 2017; pp. 18–21. (In Finnish) [Google Scholar]
  106. Grisdale-Helland, B.; Gatlin, D.M.; Helland, S.J. Optimization of dietary macronutrients for Atlantic salmon post-smolts using increasing ration levels. Aquaculture 2013, 408, 88–94. [Google Scholar] [CrossRef]
  107. Dessen, J.E.; Weihe, R.N.; Hatlen, B.; Thomassen, M.S.; Rorvik, K.A. Different growth performance, lipid deposition, and nutrient utilization in in-season (S1) Atlantic salmon post-smolt fed isoenergetic diets differing in protein-to-lipid ratio. Aquaculture 2017, 473, 345–354. [Google Scholar] [CrossRef]
  108. Hatlen, B.; Berge, K.; Nordrum, S.; Johnsen, K.; Kolstad, K.; Mørkøre, T. The effect of low inclusion levels of Antarctic krill (Euphausia superba) meal on growth performance, apparent digestibility and slaughter quality of Atlantic salmon (Salmo salar). Aquacult. Nutr. 2017, 23, 721–729. [Google Scholar] [CrossRef]
  109. Vuorinen, P.J.; Kiviranta, H.; Koistinen, J.; Pöyhönen, O.; Ikonen, E.; Keinänen, M. Organohalogen concentrations and feeding status in Atlantic salmon (Salmo salar L.) of the Baltic Sea during the spawning run. Sci. Total Environ. 2014, 468–469, 449–456. [Google Scholar] [CrossRef]
  110. Bell, J.G.; McEvoy, J.; Webster, J.L.; McGhee, F.; Millar, R.M.; Sargent, J.R. Flesh lipid and carotenoid composition of Scottish farmed Atlantic salmon (Salmo salar). J. Agric. Food Chem. 1998, 46, 119–127. [Google Scholar] [CrossRef]
  111. Miki, W. Biological functions and activities of animal carotenoids. Pure Appl. Chem. 1991, 63, 141–146. [Google Scholar] [CrossRef]
  112. Shimidzu, N.; Goto, M.; Miki, W. Carotenoids as singlet oxygen quenchers in marine organisms. Fish. Sci. 1996, 62, 134–137. [Google Scholar] [CrossRef]
Figure 1. The Baltic Sea with subareas, the Baltic Proper, the Gulf of Bothnia, and the Gulf of Finland. Rivers where salmon ascended and were sampled are indicated, including the R. Tenojoki flowing into the Barents Sea in the Arctic Ocean. The International Council for the Exploration of the Sea (ICES) is the origin of the map.
Fishes 09 00058 g001
Figure 2. Time trends of the median free thiamine (THIAM) concentration in unfertilized eggs and the proportion of M74 females of salmon spawners from the Finnish rivers flowing into the Gulf of Bothnia from the reproduction periods 1991/1992–2022/2023 according to M74 monitoring. The number of salmon is given in parentheses below the x-axis. The median egg THIAM concentration and the proportion of M74 females with the number of salmon (N) are also given for the River Dal salmon in 2016 and 2017. The median THIAM concentration in the eggs of the River Neris salmon (N = 16) monitored in 2017 was 4.84 nmol g−1 (not shown).
Fishes 09 00058 g002
Figure 3. Biplot based on the PCA for the proportions of fatty acids (FAs) in (a) muscle and (b) unfertilized eggs of 2nd sea-year salmon females ascending the River Simojoki (Simo salmon) in the non-M74 year 2014 and M74-year 2016 grouped (circled) according to the FA signatures to their feeding areas with dominant prey species. The two feeding groups differed significantly (p < 0.01) in the SIMCA test on the FA signatures both of muscle and eggs, which indicate feeding either on sprat in the Baltic Proper or on herring in the Gulf of Bothnia. The number of observations was 46 in both.
Fishes 09 00058 g003
Figure 6. Biplot based on PCA for the proportions of fatty acids (FAs) in unfertilized eggs of salmon (a) ascending the River Simojoki (Simo salmon) of the Baltic Sea in 2014, 2016, and 2017 and the River Tenojoki (flowing into the Barents Sea in the Arctic Ocean) in 1997 (Teno salmon) and (b) ascending the River Simojoki, River Dal (Dal salmon), and River Neris (Neris salmon) of the Baltic Sea and the River Tenojoki. Salmon were grouped (circled) according to the FA signatures to their feeding areas, the Baltic Proper, the Gulf of Bothnia (or Baltic Sea), and the Arctic Ocean. The SIMCA test resulted in a significant (p < 0.01) difference between all the pairs of the circled groups in (a) and in (b). The total number of samples was 74 in (a) and 137 in (b).
Fishes 09 00058 g006
Figure 7. Biplot based on PCA for the proportions of fatty acids (FAs) in unfertilized eggs of 2nd sea-year salmon ascending the River Simojoki (Simo salmon), River Dal (Dal salmon), and River Neris (Neris salmon) in 2017. Salmon were grouped (circled) according to the FA signatures of the two feeding areas. The circled groups, indicating feeding in the Baltic Proper on sprat or in the Gulf of Bothnia on herring, differed significantly (p < 0.01, SIMCA test). The total number of samples was 52.
Fishes 09 00058 g007
Figure 8. Biplots based on PCA on the proportions of fatty acids (FAs) in unfertilized eggs of 2nd sea-year salmon ascending the River Simojoki (Simo salmon), River Dal (Dal salmon), and River Neris (Neris salmon) of the Baltic Sea in the years 2014, 2016, and 2017. Salmon were grouped (circled) according to the FA signatures of the two feeding areas. The circled groups indicating feeding in the Baltic Proper on sprat or in the Gulf of Bothnia on herring within a river differ significantly (p < 0.01, SIMCA).
Fishes 09 00058 g008
Figure 10. Comparisons for 2nd sea-year River Simojoki salmon from the Baltic Proper between 2014 (Simo2014) and 2016 (Simo2016) and between the River Simojoki salmon from the Baltic Proper and the Gulf of Bothnia in 2016 for the egg THIAM concentration, muscle lipid content, condition factor (CF), and concentrations of different structural classes of fatty acids and docosahexaenoic acid (DHA, 22:6n−3) in muscle. The lines above the figures indicate pairs to compare, and the significance of the t-test is given. In the box plots, the whiskers depict the range (min–max), the upper and lower parts of the boxes depict 25 and 75% of the observations, the horizontal lines depict the median value, and the squares depict the mean concentration. The number of observations is given on the x-axis of the lowest figures.
Fishes 09 00058 g010
Figure 11. THIAM concentration in unfertilized eggs of 2nd sea-year salmon ascending the Rivers Simojoki (Simo), Dal, and Neris in 2014–2017 assigned by fatty acid signatures to the feeding areas of the Baltic Proper or the Gulf of Bothnia and in the eggs of salmon ascending the River Tenojoki (Teno) from the Barents Sea in the Arctic Ocean. Different letters indicate a significant (p < 0.05, post hoc SNK test; N < 3 not included in the test) difference between the groups, and stars indicate a significant (* = p < 0.05 and ** = p < 0.01, t-test) difference between the adjacent groups. The number of samples (N) is given in parentheses. For further details, see the caption of Figure 10.
Fishes 09 00058 g011
Table 1. The year when the eggs of salmon females ascending the different Baltic rivers (Rivers Simojoki, Dal, and Neris) were stripped for the M74 monitoring after feeding in the Baltic Sea and of salmon ascending from the Barents Sea to the River Tenojoki after feeding in the Arctic Ocean, and the mean (±SE) body mass, total length, Fulton’s condition factor (CF), and the sea-year age with the number (N) of sampled salmon females. Analysis of total lipid, fatty acids (FAs), and thiamine (Th, all females from M74 monitoring) in the 2nd sea-year salmon is indicated by “x”, and the number of samples for each analysis is given. n.a. = not analyzed.
YearRiverMassLengthCFSea AgeNSamples for Analyses
MuscleEgg
LipidFANThNLipidFAN
2014Simojoki7.3 ± 0.591 ± 20.94 ± 0.02n.a.(26)xx(16)x(26)xx(16)
2016Simojoki6.6 ± 0.388 ± 10.96 ± 0.012.1 ± 0.1(38)xx(30)x(38)xx(30)
2016Dal6.2 ± 0.386 ± 10.91 ± 0.022.1 ± 0.0(49)n.a.n.a. x(49)n.a.x(31)
2017Simojoki6.5 ± 3.486 ± 21.03 ± 0.072.2 ± 0.1(38)n.a.n.a. x(38)n.a.x(20)
2017Dal6.3 ± 0.286 ± 10.96 ± 0.022.0 ± 0.0(52)n.a.n.a. x(52)n.a.x(20)
2017Neris8.9 ± 0.598 ± 20.94 ± 0.022.1 ± 0.2(16)n.a.n.a. x(16)n.a.x(12)
1997Tenojoki9.1 ± 1.198 ± 40.93 ± 0.03n.a.(8)n.a.n.a. x(5)xx(8)
Table 2. Mean (±SE) body mass, length, condition factor (CF), free thiamine (THIAM) concentration in eggs, muscle and egg lipid content, and the concentrations of fatty acids and their structural classes in the muscle of the River Simojoki salmon ascendants from the Baltic Proper in 2016 divided, based on the egg THIAM concentration, into non-M74 (>0.71 nmol g−1) and M74 females (≤0.71 nmol g−1) [8]. The difference (%) of the variables between M74 and non-M74 females is also given.
Non-M74 FemalesM74 FemalesDiff. %
Mass, kg6.55 ± 0.30(17)6.18 ± 0.27(4)−5.6
Length, cm87.6 ± 1.2(17)87.5 ± 1.7(4)−0.1
CF0.96 ± 0.02(17)0.92 ± 0.04(4)−4.2
THIAM, nmol g−11.98 ± 0.23(17)0.34 ± 0.06(4)−82.7
Muscle lipid, %5.47 ± 0.49(18)7.01 ± 1.31(4)28.2
Egg lipid, %8.29 ± 0.27(18)8.71 ± 0.36(4)5.1
14:0, mg g−10.76 ± 0.11(18)0.93 ± 0.14(4)22.4
16:0, mg g−17.01 ± 0.66(18)7.82 ± 0.92(4)11.6
17:0, mg g−10.14 ± 0.01(18)0.17 ± 0.02(4)21.4
18:0, mg g−12.06 ± 0.18(18)2.39 ± 0.32(4)16.0
16:1n−7, mg g−11.48 ± 0.16(18)1.76 ± 0.27(4)18.9
17:1n−8, mg g−10.15 ± 0.02(18)0.18 ± 0.03(4)20.0
18:1n−7, mg g−11.73 ± 0.16(18)1.99 ± 0.26(4)15.0
18:1n−9, mg g−111.73 ± 1.13(18)14.94 ± 2.71(4)27.4
20:1n−9, mg g−10.81 ± 0.08(18)1.07 ± 0.23(4)32.1
18:2n−6, mg g−11.55 ± 0.15(18)1.87 ± 0.31(4)20.6
20:2n−6, mg g−10.34 ± 0.03(18)0.44 ± 0.09(4)29.4
18:3n−3, mg g−10.94 ± 0.09(18)1.17 ± 0.19(4)24.5
20:4n−6 (ARA), mg g−10.34 ± 0.02(18)0.43 ± 0.07(4)26.5
20:5n−3 (EPA), mg g−13.26 ± 0.28(18)4.27 ± 0.80(4)31.0
22:5n−3 (DPA), mg g−12.65 ± 0.30(18)3.72 ± 0.96(4)40.4
22:6n−3 (DHA), mg g−113.98 ± 1.15(18)19.32 ± 4.76(4)37.9
n−3 PUFA, mg g−121.32 ± 1.84(18)29.12 ± 6.77(4)36.6
n−6 PUFA, mg g−12.37 ± 0.21(18)2.92 ± 0.50(4)23.2
SFA, mg g−110.7 ± 1.0(18)12.0 ± 1.4(4)12.1
MUFA, mg g−117.47 ± 1.68(18)22.20 ± 4.00(4)26.9
PUFA, mg g−125.00 ± 2.13(18)33.72 ± 7.58(4)34.8
Disclaimer/Publisher’s Note: The statements, opinions and data contained in all publications are solely those of the individual author(s) and contributor(s) and not of MDPI and/or the editor(s). MDPI and/or the editor(s) disclaim responsibility for any injury to people or property resulting from any ideas, methods, instructions or products referred to in the content.

