Abstract
The predominant form of aquaculture is the facility fishery, which is also subject to significant impacts from marine disasters. Conducting research on the extraction of facility fishery areas based on remote sensing technology is crucial to efficiently comprehending the configuration of coastal culture patterns and to establishing scientifically sound plans for managing and administering these areas. The extensive dispersion of facility fishery areas in coastal regions poses a challenge to the conduction of comprehensive field surveys. The utilization of satellite remote sensing images for information extraction has emerged as a significant area of research in the fields of coastal fishery and ecological environment. This study provides a systematic description of the current research status of coastal fishery area extraction methods using remote sensing technology from 2000 to 2022 reported in the literature. The methods discussed include the visual interpretation method, image element-based classification, object-based classification, supervised classification, unsupervised classification, and neural network classification. The extraction accuracy of each method in the coastal facility fishery area is evaluated, and the advantages and disadvantages of these methods, as well as their limitations and existing problems, are analyzed in detail, to construct a reference framework for the investigation of the high-precision extraction of facility fishery areas from satellite remote sensing images.
Keywords:
satellite remote sensing image; coastal facility fishery area; target recognition; information extraction Key Contribution:
A systematic analysis of the current research status of coastal fishery area extraction methods using remote sensing technology from 2000 to 2022 is conducted, and six information extraction methods for coastal facility fishery area based on optical satellite remote sensing images are reviewed. The selection suggestions of optical satellite data and information extraction methods of coastal facility fishery area are provided.
1. Introduction
The swift advancement of facility fisheries has generated considerable economic benefits, particularly in China. The widespread distribution of facility fishery areas presents an obstacle for efficient and precise monitoring using conventional management approaches, thereby impeding the sustainable and systematic growth of aquaculture [1,2]. Facility fisheries are also susceptible to impairment from marine disasters, such as storm surges, waves, and sea ice [3]. The implementation of scientific planning is therefore advantageous in comprehending the spatial arrangement of aquaculture areas, regulating and overseeing fishery facilities, and efficiently averting and alleviating the adverse consequences of marine calamities. However, the dispersion of fishery facilities and inadequate development of surrounding road infrastructures present certain challenges in conducting comprehensive field surveys [1]. The use of image recognition techniques based on satellite remote sensing imagery confers a distinctive benefit in providing precise, uninterrupted and cost-effective feature data for the monitoring and administration of facility fishery areas [4].
The remote sensing image recognition technique provides important technical support for the study of fishery information extraction, and is widely employed in various domains, e.g., marine planning and coastal development [5], topographic and geological exploration [6], disaster prevention and mitigation [7], and ecological protection [8]. The applications of this technology in the field of fisheries mainly pertain to the information extraction of aquaculture areas [9], environmental studies of fishing grounds [10], and the habitat analysis of fish species [11]. Extensive research related to the information extraction of fishery facilities has been conducted using a combination of remote sensing imagery and image recognition techniques, and has yielded noteworthy scientific achievements.
A facility fishery, remote sensing satellite data sources and spatial feature information extraction methods are overviewed, focusing on the research progress of remote sensing image recognition technology in the past 20 years. This study aims to provide scientific support for research on the extraction method of satellite remote sensing image recognition with broad applicability and high extraction precision. To achieve this objective, a systematically analysis of extraction accuracy and the features of the existing recognition algorithms has been conducted.
2. Fishery Facilities and Remote Sensing Images
2.1. Fishery Facilities
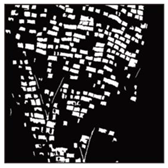
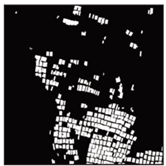
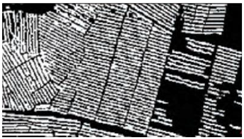
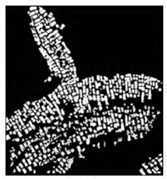
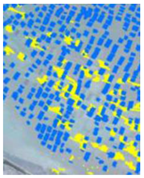
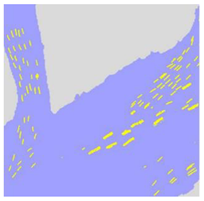
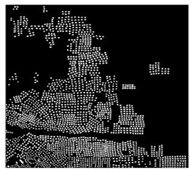
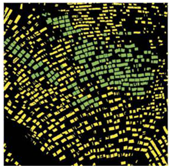
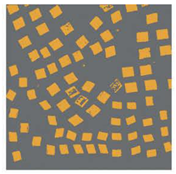
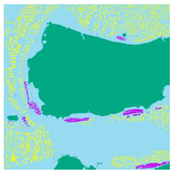
Coastal facility fisheries are a sustainable mode of marine aquaculture that can play a crucial role in meeting the growing demand for seafood [12]. The two primary forms of coastal facility fisheries are cage-based and raft-based aquaculture. Cage aquaculture can be classified into nearshore and deep-sea cage culture. Nearshore cages are characterized by their simplicity of construction and limited resistance to wind and waves [13]. These cages are primarily utilized for the cultivation of various types of aquatic creatures, such as small yellow croaker (Larimichthys polyactis), puffer fish (Takifugu rubripes), and Japanese seabass (Lateolabrax japonicus) [14]. Deep-sea cages are highly equipped and possess robust wind and wave resilience, serving as a means for cultured species such as Atlantic salmon (Salmo salar) and pompano (Trachinotus ovatus) [1]. Raft facilities, involving the culture of seaweed (e.g., kelp Laminaria japonica) and shellfish (e.g., pacific oyster Crassostrea gigas), consist of raft frames, floats, and ropes, and are anchored to the seabed with cables [15]. Remote sensing images of these fishery facilities in a coastal area are represented in Figure 1.
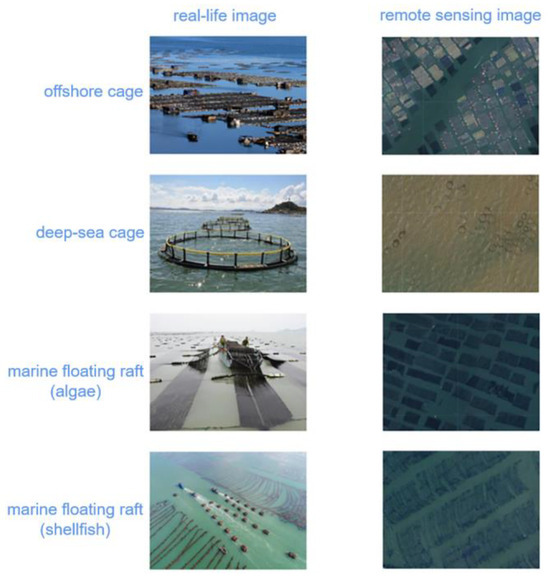
Figure 1.
Images of fishery facilities in a coastal area.
2.2. Satellite Remote Sensing
High-resolution images are obtained from remote sensing satellites, which can be classified into two main categories based on the sensors utilized by the acquiring satellites: optical satellites and synthetic aperture radar satellites [16]. Optical satellites provide high-resolution multispectral remote sensing images with rich information on the spatial distribution and spectral characteristics of the Earth’s surface, making them a widely used data source for studies involving the extraction of information from facility fishery areas [17]. As shown in Table 1, the optical satellite data sources used for feature information extraction since the 1980s primarily comprise Landsat 8, Sentinel-2, GaoFen-2, etc. The process of selecting appropriate remote sensing satellite images necessitates a careful consideration of various factors, including but not limited to research objectives, the geographical location, and temporal constraints. The Landsat 8 and Sentinel-2 satellites are capable of achieving a minimum spatial pixel size of 15 and 10 m, respectively. This level of resolution is sufficient to provide comprehensive information and facilitate the precise classification and quantitative analysis of measuring facility fishery areas. When conducting research within a restricted scope, such as when analyzing a specific facility fishery area, it is recommended to select a satellite image with a higher resolution, such as GaoFen-2. In order to investigate the development of fishery facilities, it is imperative to opt for satellite imagery that spans extended durations, such as Landsat 5 and Landsat 7. Satellite imagery with a reduced temporal resolution can provide extensive historical image data spanning several decades, which can be leveraged to investigate the evolutionary patterns of fishery areas associated with facilities. Such a meticulous approach is essential for obtaining precise and all-encompassing research outcomes. The most frequently cited research works in the field of facility fishery area extraction based on remote sensing data within the past decade are listed in Table 2, where the most commonly used satellite data types are from the GaoFen and Landsat series.

Table 1.
List of most relevant optical satellites for the observation of aquaculture sites.
Table 2.
Use of optical remote sensing data in papers related to aquaculture area classification studies.
3. Data Sources
The literature reviewed in this paper includes studies on the use of remote sensing images to extract facility fishery area. Both Chinese and English databases were selected for the literature search. The primary data source for the English literature was derived from the fundamental collection of Web of Science (WOS), a globally recognized and authoritative citation index database that encompasses SCIE, SSCI, A&HCI and other sub-collections. The corpus of the Chinese literature was obtained from the China Knowledge Network (CNKI) database, which covers prominent Chinese journals featured in Peking University, and CSCD and CSSCI databases. The keywords “extract* or detect*”, “satellite image* or remote* sens* or hyper spectral” and “facility fishery or aquaculture” were selected, and the query was conducted using these keywords from January 1994 to December 2022. In total, 853 publications were retrieved from the WOS database, including 36 review papers. An additional exploration of research avenues pertaining to the field of “Fisheries” yielded 296 publications in total, which encompassed 11 review papers. Using the same keywords, 34 publications on CNKI were obtained. The aforementioned 330 publications were thoroughly examined and subsequently used for CiteSpace citation analysis. In total, 22 pertinent publications elucidating diverse classification methods for the classification of coastal facility fishery areas were selected and employed in the analysis section of the classification methodologies.
According to previous research, the occurrence of citation bursts associated with specific keywords could reflect the emergence of research hotspots in a particular field during a given time period [36]. Based on the mutation analysis module of the CiteSpace 5.1.R6 software, the research field experienced a period of stagnation between 2000 and 2005 (Table 3). From 2005 to 2017, there was a gradual increase in research activities, with a concentration of keywords such as “geospatial information” and “environmental impact”. There was a surge in the usage of certain keywords such as “classification”, “algal bloom”, and “aquaculture” in recent years. Notably, “aquaculture” gained significant attention with a strength value of 3.29, indicating that it became the current research hotspot.
Table 3.
Keywords with the strongest citation bursts.
The geographical distribution of research institutions that published literature pertaining to the utilization of remote sensing images for the purpose of extracting research from facility fishery areas was primarily concentrated in Asia and the Americas. The countries that had a publishing count surpassing 15 were China, USA, Germany, and Vietnam. The articles were obtained from 64 nations or regions, with the involvement of 274 research institutions globally. Among these institutions, the 15 mentioned by name demonstrate the highest level of interconnection, and the 3 leading organizations were the Chinese Academy of Sciences (CAS), the University of Chinese Academy of Sciences (UCAS), and Jiangsu Center for Collaborative Innovation in Geographical Information Resource. CAS was mostly associated with research conducted in other academic institutions.
Centrality is one of the indicators with which to evaluate the importance of nodes in a network, where nodes with a centrality exceeding 0.1 are considered central, with higher values indicating greater academic influence and importance [36]. In total, 433 journals published research results in related fields. The journal “Remote Sensing of Environment” had the highest number of citations, totaling 136, but its node centrality was only 0.02, indicating that despite the abundance of research related to the journal, its academic impact was relatively low. “Marine Pollution Bulletin” and “Aquaculture” had a comparatively lower count of overall citations; their node centralities were recorded to be 0.12 and 0.16, respectively, therefore meeting the criterion for central node status and consequently indicating a high academic impact.
Since 2002, there has been an overall increase in the number of relevant papers published in journals (Figure 2). Over the course of the previous half-decade, there was a notable surge in the quantity of articles pertaining to WOS, which corresponded with an increase in research interest. Since 2017, the number of articles published in core journals gradually increased, and many domestic scientific research institutions focused on related research based on the remote sensing extraction of aquaculture areas.
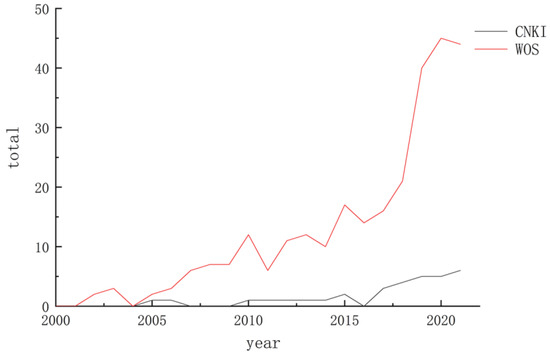
Figure 2.
Trends in the number of published articles between January 2000 and December 2021.
4. Classification and Extraction of Information on Coastal Facilities and Fishery Areas
4.1. Preprocessing
Preprocessing is a widely adopted technique in remote sensing that aims to standardize images to reduce the errors caused by imaging and to enhance the correspondence between images and actual features. The main procedures comprise five steps, namely radiometric calibration, atmospheric correction, distortion correction, georeferencing, and image fusion [37].
Radiation correction removes errors due to external environmental factors such as solar radiation and the sensor itself, which can blur the image and reduce the image resolution [38]. During the transmission process, the spectrum of the ground object undergoes scattering, absorption, and refraction because of the presence of water vapor, oxygen, carbon dioxide, and aerosol particles. This results in a reduction in spectrum energy and a modification of the spectrum distribution. Atmospheric correction involves the adjustment of the spectral distribution in order to derive real physical model parameters [39]. Distortion correction removes any geometric distortion, which may arise due to various factors such as the curvature of the Earth’s surface or the optics of the sensor [40]. Georeferencing is the process of assigning spatial coordinates to an image, thereby enabling a precise cartographic representation of the Earth’s surface features [41]. Image fusion integrates images with different resolutions into a singular image [42], where low-resolution multispectral remote sensing images are merged with high-resolution monospectral images of the same region to produce high-resolution multispectral images.
4.2. Methods of Classification
Remote sensing image classification is an important methodology that utilizes remote sensing data and computer technology to analyze and manipulate remote sensing images, the purpose of which is to categorize the pixels in remote sensing images into different categories to achieve the identification, classification, and monitoring of ground objects.
Remote sensing image classification methodologies are usually classified into manual visual classification, pixel-based image analysis (PBIA) classification, object-based image analysis (OBIA) classification, supervised classification, unsupervised classification and neural network classification [43].
4.2.1. Manual Visual Classification
Manual visual classification relies on the identification of feature information pertaining to the target features (color, shape, texture, location, etc.) [44]. Recognition is achieved through comparative analysis, including the steps of preliminary interpretation, a field survey of the target area, detailed interpretation, a field inspection of the target area, and the mapping of the results. This classification method is appropriate for processing small batches of data, and its extraction results are primarily employed for image verification.
4.2.2. PBIA/OBIA Classification
The PBIA classification method has been widely utilized in the automated extraction of remote sensing pictures, representing one of the earlier approaches in this field [45], which facilitates the analysis of spectral feature values among pixels and enhances feature information to optimize the extraction of target characteristics. The OBIA classification method takes into account several factors such as the target’s structure and texture, and the association between neighboring image elements, which involves the transformation of individual image elements into image objects, incorporating spatial information about these objects as well as their semantic characteristics [46]. The detailed classification processes are represented in Figure 3.
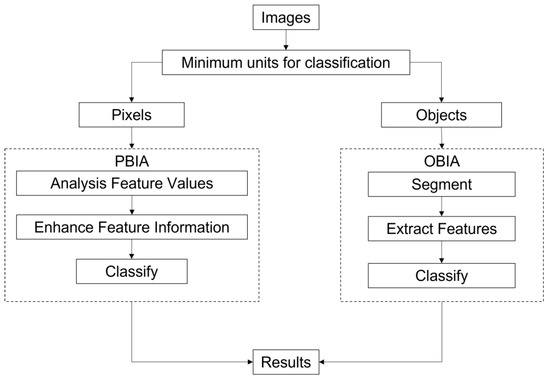
Figure 3.
Flowchart of PBIA classification and OBIA classification.
(a) PBIA classification
The fundamental concept underlying the feature index is the mitigation of the influence of background information and accentuation of the contrast between the target region and surrounding areas. This is achieved via inter-spectral operations, such as ratio and difference, which serve to emphasize the distinctive characteristics of the target region. The initial application of the method involved the extraction of land targets, namely the utilization of the normalized difference vegetation index (NDVI) to assess crop growth and nutrient levels, as well as the use of the normalized difference water index (NDWI) for the identification of river regions [47]. By utilizing the aforementioned characteristic indices as benchmarks and incorporating the distinctive spectral data of fishery establishments, we choose to employ ratio indices from various sensitivity bands to delineate the fishery areas of coastal facilities [27,34].
The PBIA classification method is frequently employed for demarcating fishery zones in coastal facilities, as evidenced in Table 4. Ma et al. [32] conducted a study in which they utilized ASTER remote sensing images and employed the index construction approach to create the normalized difference aquaculture index (NDAI), which was developed based on the spectral characteristics of the region and proven to be effective in identifying and delineating the coastal aquaculture area in Yantai City, situated in the Shandong Province of China. Cheng et al. [22] introduced an innovative band set that incorporates the NDAI extraction index, utilizing a multi-source feature fusion technique to extract marine raft and coastal cage culture areas.
Table 4.
Application of PBIA classification in coastal facility fishery area.
Nevertheless, this approach exhibits constraints in terms of information collecting and fails to comprehensively demonstrate the benefits offered by high-resolution remote sensing imagery. The advancement in spectral resolution and spatial resolution has led to an increased amount of information contained inside a single pixel, which poses challenges when attempting to extract correlation information between pixels, such as spatial relationships and texture shape aspects. Furthermore, the classification of PBIA is fundamentally insufficient in addressing the problem of noise [48,49]. One of the current areas of research focus involves strategies aimed at preventing or reducing the adverse effects of the aforementioned issues on the results of extraction processes.
(b) OBIA classification
The phase of OBIA classification typically encompasses three sequential steps, namely segmentation, feature extraction, and classification. Image segmentation refers to the process of dividing an image into distinct objects or regions, which is achieved by considering many factors such as spectral, spatial, and background features. The process of feature extraction involves extracting a certain collection of features from each item that has been split into individual objects. The aforementioned characteristics may encompass the spectral, textural, and shape-based properties of the object. The classification process involves the utilization of a classification algorithm to analyze a set of extracted features, with the aim of assigning each object to a distinct class or category.
As demonstrated in Table 5, the utilization of OBIA classification proves to be suitable for high-spatial-resolution images, as evidenced by its implementation in the field of fisheries. Wang et al. [19] based GF-1 data imagery to analyze various features of objects associated with different farming modes in Tuolin Bay, Eastern Guangdong, including spectral, spatial morphology, and texture characteristics. The association relationships between these features are treated as transaction data, and data mining techniques are applied to identify strong rules, to classify and extract information pertaining to the four distinct farming modes present in the area. The multi-feature analysis approach was proposed by Zhong et al. [45], and involves using the enhanced constraint energy minimum algorithm and the maximum inter-group variance method (also known as the Otsu [50] method) for the initial extraction of the target; then, object-oriented analysis methods are integrated to extract the facility area. While association rule classification and object orientation have expanded the means of acquiring information in traditional logical reasoning classification methods and have notably enhanced classification outcomes, such as precision and recall, the construction of rule sets remains a challenging aspect in ongoing research [51].
Table 5.
Application of OBIA classification in coastal facility fishery area.
4.2.3. Supervised/Unsupervised Classification
Supervised and unsupervised classifications of remote sensing image are derived from the domain of machine learning, and the flowcharts of these two methods are shown in Figure 4. Supervised classification employed labeled training examples to classify remote sensing data. The process is characterized by a high level of automation, encompassing the delineation of information categories, the assessment of their spectral distinctiveness, the identification of suitable classification algorithms, and the subsequent application of these algorithms for data categorization. However, the use of this approach necessitates a substantial amount of precisely annotated training samples, a process that can be both time-consuming and costly to obtain. For example, Zhong et al. [52] effectively used an integration-enhanced gradient descent (IEGD) technique based on supervised classification to extract feature information from port aquaculture areas.
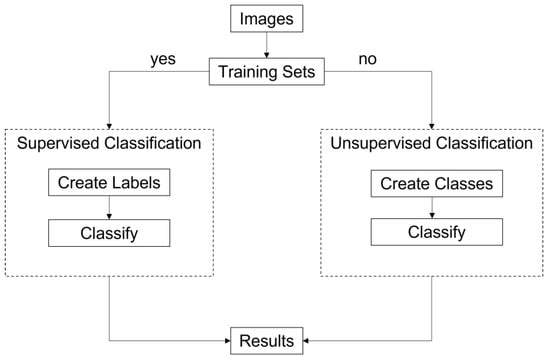
Figure 4.
Flowchart of supervised classification and unsupervised classification.
On the other hand, unsupervised classification [53] is a technique that does not rely on pre-defined classes and that entails the application of clustering algorithms to group pixels with comparable spectral characteristics into classes that are subsequently defined based on their spectral features. The classes that emerge from this process can be used for the purpose of identifying specific areas of interest, which can then be subjected to further categorization through the application of supervised methods. Liu et al. [26] extracted and created thematic maps of fish cage and raft culture regions in the coastal provinces of China. Although unsupervised classification does not require labeled training samples, it can present difficulties in terms of the interpretation and validation of the resulting classifications.
4.2.4. Neural Network Classification
Convolutional neural networks (CNN) have demonstrated remarkable accuracy in various domains, including image classification, target recognition, and semantic segmentation [22,25]; the process of CNN classification is presented in Figure 5. Common metrics used to evaluate accuracy in classification tasks include classification accuracy, precision, and recall [54,55]. The CNN algorithm has been found to require a reasonably large quantity of training data for remote sensing images and is capable of processing many types of input data [56]. Currently, multidimensional neural networks are being employed in conjunction with enhanced algorithms to enhance the efficiency of recognition and extraction processes. Jiang et al. [21] developed a 3D CNN model with an optimized cross-entropy loss function to extract aquaculture area information through classification using a support vector machine classifier. The widespread application of algorithmic models for aquaculture information extraction is facilitated by the continuous advancement of neural network technology (Table 6).
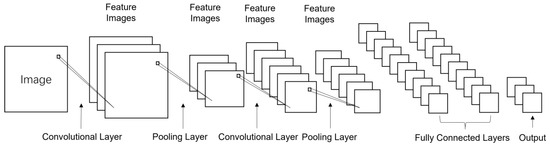
Figure 5.
The diagram structure of CNN extracting features from images using convolution and pooling.
Table 6.
Neural network classification in the coastal facility fishery area application.
4.3. Accuracy Assessment
The precision of remote sensing images can be evaluated using the confusion matrix, which enables and assessment to be conducted by analyzing all pixels across different categories and presenting a concise overview of the degree of misclassification between the classified categories and the actual categories [57]. The calculation of several performance metrics such as overall accuracy, the Kappa coefficient, the producer’s accuracy, the user’s accuracy, the misclassification error, and the missed classification error can be conducted in the aquaculture area [17]. Several techniques are also employed, including comparison analysis [58], statistical approaches [59], and spatial consistency tests [60], in addition to confusion matrices.
At present, there is a lack of a universally applicable approach for the comprehensive extraction of all aquaculture sites. It is imperative to be prudent while picking an extraction method, as each method possesses distinct advantages and disadvantages. Therefore, careful consideration of the specific conditions is warranted. Table 7 presents a complete analysis of the strengths and weaknesses associated with six distinct extraction methods.
Table 7.
Comparison of advantages and disadvantages of different classification methods.
Table 8 summarizes a comprehensive overview of the performance of various extraction methods, as reported in relevant studies conducted between 2010 and 2022. Among the aforementioned methods, the average extraction accuracy of the raft farming area is recorded at 91.3%, while the fish cages exhibit an average extraction accuracy of 92.7%. The table reveals a notable concentration of studies focused on image elements or object classification, with extraction accuracy consistently surpassing the average. Conversely, there is a scarcity of studies exploring supervised, unsupervised, and neural network classification, and in these cases, the extraction accuracy tends to be comparatively lower.
Table 8.
Extraction accuracy of different aquaculture zone classification methods from 2010 to 2022.
5. Conclusions and Prospects
Implementing intelligent management approaches enables the efficient and exact monitoring of fisheries areas in order to support the sustainable and methodical expansion of aquaculture facilities. This study provides a comprehensive overview of the application of remote sensing imagery to the information extraction of aquaculture areas, where the structure, advantages and limitations of six methods are analyzed. On this basis, we proposed potential solutions addressed to the existing challenges.
The significance and relevance of extracting information from remote sensing images of coastal fishery facilities, particularly using GF and Landsat satellite data, are steadily increasing as evidenced by citation analysis. It is difficult to utilize spatial relations in PBIA, which could be solved via spatial correlation analysis, and it has noise problems that could be solved using hyperspectral data. OBIA is more suitable for extracting aquaculture regions as it simplifies post-classification editing and improves spatial accuracy by reducing spectral confusion between classes, but still has challenges in rule set construction. A potential way, such as data mining, is suggested to automate rule association to improve the efficiency and accuracy of rule set construction. Since supervised classification requires a large number of samples, we suggest using semi-supervision or weak supervision to reduce the number of samples. For the problem in which the results of unsupervised classification are difficult to interpret, other data sources could be used to help with interpretation. Although CNN requires a large amount of training data to improve accuracy, it can be combined with migration learning or data augmentation to compensate for the lack of training data. CNN exhibits significant promise for further advancement, excelling in the extraction of multidimensional characteristics and management with multiple input data.
Therefore, OBIA and CNN could be prioritized for the extraction of aquaculture areas. In addition, advances in remote sensing and image recognition technology may allow for improved extraction performance and generalizability through model coupling.
Author Contributions
Conceptualization and supervision, Z.L., J.Z. and R.W.; methodology, data curation, formal analysis, and visualization, A.C. and G.Y.; writing—original draft preparation, A.C. and J.Z.; writing—review and editing, Z.L., R.W. and J.Z. All authors have read and agreed to the published version of the manuscript.
Funding
This research was partially supported by the National Key Research and Development Program of China (Grant No. 2019YFC0312104).
Institutional Review Board Statement
Not applicable.
Informed Consent Statement
Not applicable.
Data Availability Statement
Not applicable.
Acknowledgments
We would like to thank Ping Qing and Hongtao Fu form East China Sea Branch, Ministry of Natural Resources for their help in data collection.
Conflicts of Interest
The authors declare no conflicts of interest.
References
- Long, L.; Liu, H.; Cui, M.; Zhang, C.; Liu, C. Offshore aquaculture in China. Rev. Aquac. 2024, 16, 254–270. [Google Scholar] [CrossRef]
- Tan, Y.; Lou, S. Research and development of a large-scale modern recreational fishery marine ranch System. Ocean Eng. 2021, 233, 108610. [Google Scholar] [CrossRef]
- Yuk, J.H.; Kang, J.S.; Myung, H. Applicability Study of a Global Numerical Weather Prediction Model MPAS to Storm Surges and Waves in the South Coast of Korea. Atmosphere 2022, 13, 591. [Google Scholar] [CrossRef]
- Yen, K.; Chen, C. Research gap analysis of remote sensing application in fisheries: Prospects for achieving the sustainable development goals. Remote Sens. 2021, 13, 1013. [Google Scholar] [CrossRef]
- Lin, M.; Jia, Y. Past, Present and Future Marine Microwave Satellite Missions in China. Remote Sens. 2022, 14, 1330. [Google Scholar] [CrossRef]
- Ding, H.; Jing, L.; Xi, M.; Bai, S.; Yao, C.; Li, L. Research on Scale Improvement of Geochemical Exploration Based on Remote Sensing Image Fusion. Remote Sens. 2023, 15, 1993. [Google Scholar] [CrossRef]
- Li, C.; Sun, N.; Lu, Y.; Guo, B.; Wang, Y.; Sun, X.; Yao, Y. Review on Urban Flood Risk Assessment. Sustainability 2023, 15, 765. [Google Scholar] [CrossRef]
- Chen, H.; Lan, Y.; Fritz, B.; Hoffmann, W.; Liu, S. Review of agricultural spraying technologies for plant protection using unmanned aerial vehicle (UAV). Int. J. Agric. Biol. Eng. 2021, 14, 38–49. [Google Scholar] [CrossRef]
- Wang, J.; Yang, X.; Wang, Z.; Ge, D.; Kang, J. Monitoring Marine Aquaculture and Implications for Marine Spatial Planning-An Example from Shandong Province, China. Remote Sens. 2022, 14, 732. [Google Scholar] [CrossRef]
- Yin, X.; Yang, D.; Zhao, L.; Zhong, R.; Du, R. Fishery Resource Evaluation with Hydroacoustic and Remote Sensing in Yangjiang Coastal Waters in Summer. Remote Sens. 2023, 15, 543. [Google Scholar] [CrossRef]
- Dias-Silva, K.; Vieira, T.; Matos, T.; Juen, L.; Simiao-Ferreira, J.; Hughes, R.; Junior, P. Measuring stream habitat conditions: Can remote sensing substitute for field data? Sci. Total Environ. 2021, 788, 147617. [Google Scholar] [CrossRef] [PubMed]
- Deng, J.; Bai, Y.; Chen, Z.; Shen, T.; Li, C.; Yang, X. A Convolutional Neural Network for Coastal Aquaculture Extraction from High-Resolution Remote Sensing Imagery. Sustainability 2023, 15, 5332. [Google Scholar] [CrossRef]
- Ma, Y.; Qu, X.; Feng, D.; Zhang, P.; Huang, H.; Zhang, Z.; Gui, F. Recognition and statistical analysis of coastal marine aquacultural cages based on R3Det single-stage detector: A case study of Fujian Province, China. Ocean Coast. Manag. 2022, 225, 106244. [Google Scholar] [CrossRef]
- Kong, Y.; Liao, Z.; Ma, X.; Liang, M.; Xu, H.; Mai, K.; Zhang, Y. Effects of different dietary lipid levels on intestinal mucosal barrier and microbial community of juvenile tiger puffer Takifugu rubripes. Aquac. Nutr. 2021, 27, 1626–1639. [Google Scholar] [CrossRef]
- Kong, H.; Shen, J.; Zhao, Y.; Sun, Q. Assessment of Sea-Area Benchmark Pricing: Using Chinese Aquaculture to Evaluate and Revise the Price Structure of Resources. J. Coast. Res. 2022, 38, 925–936. [Google Scholar] [CrossRef]
- Sun, L.; Li, C. A High-Resolution, Wide-Swath SAR Imaging System Based on Tandem SAR Satellites. Sensors 2022, 22, 7747. [Google Scholar] [CrossRef]
- Tharwat, A. Classification assessment methods. Appl. Comput. Inform. 2021, 17, 168–192. [Google Scholar] [CrossRef]
- Cui, B.; Fei, D.; Shao, G.; Lu, Y.; Chu, J. Extracting raft aquaculture areas from remote sensing images via an improved U-Net with a PSE structure. Remote Sens. 2019, 11, 2053. [Google Scholar] [CrossRef]
- Wang, F.; Xia, L.; Chen, Z.; Cui, W. Remote sensing identification of coastal zone mariculture modes based on association-rules object-oriented method. Trans. Chin. Soc. Agric. Eng. 2018, 34, 210–217. [Google Scholar] [CrossRef]
- Cheng, B.; Liang, C.; Liu, X.; Liu, Y. Research on a novel extraction method using Deep Learning based on GF-2 images for aquaculture areas. Int. J. Remote Sens. 2020, 41, 3575–3591. [Google Scholar] [CrossRef]
- Jiang, Z.; Ma, Y. Accurate extraction of offshore raft aquaculture areas based on a 3D-CNN model. Int. J. Remote Sens. 2020, 41, 5457–5481. [Google Scholar] [CrossRef]
- Cheng, B.; Liu, Y.; Liu, X.; Wang, G.; Ma, X. Research on extraction method of coastal aquaculture areas on high resolution remote sensing image based on multi-features fusion. Remote Sens. Technol. Appl. 2018, 33, 296–304. [Google Scholar]
- Liang, C.; Cheng, B.; Xiao, B.; He, C.; Liu, X.; Jia, N.; Chen, J. Semi-/weakly-supervised semantic segmentation method and its application for coastal aquaculture areas based on multi-source remote sensing images-taking the Fujian coastal area (mainly Sanduo) as an Example. Remote Sens. 2021, 13, 1083. [Google Scholar] [CrossRef]
- Su, H.; Wei, S.; Qiu, J.; Wu, W. RaftNet: A New Deep Neural Network for Coastal Raft Aquaculture Extraction from Landsat 8 OLI Data. Remote Sens. 2022, 14, 4587. [Google Scholar] [CrossRef]
- Wu, Y.; Chen, F.; Ma, Y.; Liu, J.; Li, X. Research on automatic extraction method for coastal aquaculture area using Landsat8 data. Remote Sens. Land Resour. 2018, 30, 96–105. [Google Scholar] [CrossRef]
- Liu, Y.; Wang, Z.; Yang, X.; Zhang, Y.; Yang, F.; Liu, B.; Cai, P. Satellite-based monitoring and statistics for raft and cage aquaculture in China’s offshore waters. Int. J. Appl. Earth Obs. Geoinf. 2020, 91, 102118. [Google Scholar] [CrossRef]
- Fu, T.; Zhang, L.; Yan, X.; Chen, B.; Yan, M. Spatio-temporal patterns and sustainable development of coastal aquaculture in Hainan Island, China: 30 Years of evidence from remote sensing. Ocean Coast. Manag. 2021, 214, 105897. [Google Scholar] [CrossRef]
- Nurdin, N.; Setiawan, R.; Helmi, M.; Maslukah, L.; Agus, A.; AS, M.; Anas, A.; Nurfitrah, M.; Komatsu, T. Spatial water quality and plastic buoy of seaweed culture in coastal area, Indonesia. SPIE Future Sens. Technol. 2020, 11525, 15. [Google Scholar] [CrossRef]
- Mallick, S.; Rudra, S. Land use changes and its impact on biophysical environment: Study on a river bank. Egypt. J. Remote Sens. Space Sci. 2021, 24, 1037–1049. [Google Scholar] [CrossRef]
- Fu, Y.; Ye, Z.; Deng, J.; Zheng, X.; Huang, Y.; Yang, W.; Wang, Y.; Wang, K. Finer resolution mapping of marine aquaculture areas using WorldView-2 imagery and a hierarchical cascade convolutional neural network. Remote Sens. 2019, 11, 1678. [Google Scholar] [CrossRef]
- Fu, Y.; Deng, J.; Ye, Z.; Gan, M.; Wang, K.; Wu, J.; Yang, W.; Xiao, G. Coastal aquaculture mapping from very high spatial resolution imagery by combining object-based neighbor features. Sustainability 2019, 11, 637. [Google Scholar] [CrossRef]
- Ma, Y.; Zhao, D.; Wang, R.; Su, W. Offshore aquatic farming areas extraction method based on ASTER data. Trans. Chin. Soc. Agric. Eng. 2010, 26, 120–124. [Google Scholar]
- Wang, S.; Huang, C.; Li, H.; Liu, Q. Synergistic Integration of Time Series Optical and SAR Satellite Data for Mariculture Extraction. Remote Sens. 2023, 15, 2243. [Google Scholar] [CrossRef]
- Lu, Y.; Li, Q.; Du, X.; Wang, H. A method of coastal aquaculture area automatic extraction with high spatial resolution images. Remote Sens. Technol. Appl. 2015, 30, 486–494. [Google Scholar]
- Sui, B.; Jiang, T.; Zhang, Z.; Pan, X.; Liu, C. A modeling method for automatic extraction of offshore aquaculture zones based on semantic segmentation. Int. J. Geo-Inf. 2020, 9, 145. [Google Scholar] [CrossRef]
- Visualizing Patterns and Trends in Scientific Literature. Available online: http://cluster.ischool.drexel.edu/~cchen/citespace (accessed on 22 April 2022).
- Singh, M.; Gayathri, V.; Chaudhuri, D. A Simple Data Preprocessing and Postprocessing Techniques for SVM Classifier of Remote Sensing Multispectral Image Classification. Xplore. J. Sel. Top. Appl. Earth Obs. Remote Sens. 2022, 15, 7248–7262. [Google Scholar] [CrossRef]
- Seo, D.; Yang, D.; Paik, G. Analysis of image preprocessing effects in a Landsat image simulation. KSCE J. Civ. Eng. 2020, 24, 2186–2192. [Google Scholar] [CrossRef]
- Santini, F.; Palombo, A. Physically Based Approach for Combined Atmospheric and Topographic Corrections. Remote Sens. 2019, 11, 1218. [Google Scholar] [CrossRef]
- Zhang, Y.; Mei, X.; Ma, Y.; Jiang, X.; Peng, Z.; Huang, J. Hyperspectral Panoramic Image Stitching Using Robust Matching and Adaptive Bundle Adjustment. Remote Sens. 2022, 14, 4038. [Google Scholar] [CrossRef]
- Fasel, B.; Spörri, J.; Gilgien, M.; Boff, G.; Chardonnens, J.; Müller, E.; Aminian, K. Georeferencing of high-resolution satellite imagery using an iterative image-based approach. Remote Sens. 2016, 8, 671. [Google Scholar] [CrossRef]
- Soszynska, A.; Werff, H.; Hieronymus, J.; Hecker, C. A New and Automated Method for Improving Georeferencing in Nighttime Thermal ECOSTRESS Imagery. Sensors 2023, 23, 5079. [Google Scholar] [CrossRef]
- Mehmood, M.; Shahzad, A.; Shabbir, A.; Ali, N. Remote Sensing Image Classification: A Comprehensive Review and Applications. Math. Probl. Eng. 2022, 58, 959. [Google Scholar] [CrossRef]
- Wang, X.; Cao, J.; Liu, J.; Li, X.; Wang, L.; Zuo, F.; Bai, M. Improving the Interpretability and Reliability of Regional Land Cover Classification by U-Net Using Remote Sensing Data. Chin. Geogr. Sci. 2022, 32, 979–994. [Google Scholar] [CrossRef]
- Zhong, Y. Study on High Resolution Remote Sensing Extraction and Classification of Zhanjiang Offshore Aquaculture Area. Master’s Thesis, Guangdong Ocean University, Zhanjiang, China, 2020. [Google Scholar]
- Zhou, W.; Ming, D.; Xu, L.; Bao, H.; Wang, M. Stratified object-oriented image classification based on remote sensing image scene division. J. Spectrosc. 2018, 1, 3918954. [Google Scholar] [CrossRef]
- Calcagno, F.; Romano, E.; Furnitto, N.; Jamali, A.; Failla, S. Remote Sensing Monitoring of Durum Wheat under No Tillage Practices by Means of Spectral Indices Interpretation: A Preliminary Study. Sustainability 2022, 14, 15012. [Google Scholar] [CrossRef]
- Li, B.; Zhou, Y.; Xie, D.; Zheng, L.; Wu, Y.; Yue, J.; Jiang, S. Stripe Noise Detection of High-Resolution Remote Sensing Images Using Deep Learning Method. Remote Sens. 2022, 14, 873. [Google Scholar] [CrossRef]
- Huang, J.; Wang, G.; Hu, G.; Yang, H. Research on the method of change detection for high resolution satellite remote sensing image. Bull. Surv. Mapp. 2016, 8, 30–34. [Google Scholar] [CrossRef]
- Chen, C.; Kong, H.; Wu, B. Edge detection of remote sensing image based on Grünwald-Letnikov fractional difference and Otsu threshold. Electron. Res. Arch. 2023, 31, 1287–1302. [Google Scholar] [CrossRef]
- Saba, S.; Ali, M.; Turab, S.; Waseem, M.; Faisal, S. Comparison of pixel, sub-pixel and object-based image analysis techniques for co-seismic landslides detection in seismically active area in Lesser Himalaya, Pakistan. Nat. Hazards 2023, 115, 2383–2398. [Google Scholar] [CrossRef]
- Zhong, Y.; Liao, S.; Yu, G.; Fu, D.; Huang, H. Harbor Aquaculture Area Extraction Aided with an Integration-Enhanced Gradient Descent Algorithm. Remote Sens. 2021, 13, 4554. [Google Scholar] [CrossRef]
- Xu, M.; Wu, M.; Chen, K.; Zhang, C.; Guo, J. The Eyes of the Gods: A Survey of Unsupervised Domain Adaptation Methods Based on Remote Sensing Data. Remote Sens. 2022, 14, 4380. [Google Scholar] [CrossRef]
- Li, Z.; Wang, Y.; Zhang, N.; Zhang, Y.; Zhao, Z.; Xu, D.; Ben, G.; Gao, Y. Deep Learning-Based Object Detection Techniques for Remote Sensing Images: A Survey. Remote Sens. 2022, 14, 2385. [Google Scholar] [CrossRef]
- Chandra, N.; Vaidya, H. Building detection methods from remotely sensed images. Curr. Sci. 2023, 122, 1252–1267. [Google Scholar] [CrossRef]
- Muruganantham, P.; Wibowo, S.; Grandhi, S.; Samrat, N.; Islam, N. A Systematic Literature Review on Crop Yield Prediction with Deep Learning and Remote Sensing. Remote Sens. 2022, 14, 1990. [Google Scholar] [CrossRef]
- Jia, J.; Song, J.; Kong, Q.; Yang, H.; Teng, Y.; Song, X. Multi-Attention-Based Semantic Segmentation Network for Land Cover Remote Sensing Images. Electronics 2023, 12, 1347. [Google Scholar] [CrossRef]
- Bazzi, H.; Baghdadi, N.; Charron, F.; Zribi, M. Comparative Analysis of the Sensitivity of SAR Data in C and L Bands for the Detection of Irrigation Events. Remote Sens. 2022, 14, 2312. [Google Scholar] [CrossRef]
- Liang, Z.; Wang, C.; Duan, Z.; Liu, H.; Liu, X.; Khan, K. A Hybrid Model Consisting of Supervised and Unsupervised Learning for Landslide Susceptibility Mapping. Remote Sens. 2021, 13, 1464. [Google Scholar] [CrossRef]
- Zhou, L.; Xu, E.; Hao, S.; Ye, Y.; Zhao, K. Data-Wise Spatial Regional Consistency Re-Enhancement for Hyperspectral Image Classification. Remote Sens. 2022, 14, 1227. [Google Scholar] [CrossRef]
- Chu, J.; Zhao, D.; Zhang, F. Wakame raft interpretation method of remote sensing based on association rules. Remote Sens. Technol. Appl. 2021, 27, 941–946. [Google Scholar] [CrossRef]
- Liu, H.; Liu, X.; Liu, X. An automatic extraction method for cage-fenced culture area. Remote Sens. 2021, 36, 64–71. [Google Scholar] [CrossRef]
- Zhong, Y. Recognition and Detection Method of Raft Aquaculture Area Based on Deep Learning. Master’s Thesis, Shandong University of Science and Technology, Qingdao, China, 2019. [Google Scholar]


Disclaimer/Publisher’s Note: The statements, opinions and data contained in all publications are solely those of the individual author(s) and contributor(s) and not of MDPI and/or the editor(s). MDPI and/or the editor(s) disclaim responsibility for any injury to people or property resulting from any ideas, methods, instructions or products referred to in the content. |
© 2024 by the authors. Licensee MDPI, Basel, Switzerland. This article is an open access article distributed under the terms and conditions of the Creative Commons Attribution (CC BY) license (https://creativecommons.org/licenses/by/4.0/).