Review

A Critical Assessment of the Process and Logic Behind Fish Production in Marine Recirculating Aquaculture Systems

School of Engineering, Saarland University of Applied Sciences (HTW Saar), Goebenstraße 40, 66117 Saarbrücken, Germany
Fishes 2024, 9(11), 431; https://doi.org/10.3390/fishes9110431
Submission received: 31 August 2024 / Revised: 17 October 2024 / Accepted: 19 October 2024 / Published: 25 October 2024
(This article belongs to the Special Issue Advances in Recirculating and Sustainable Aquaculture Systems)

Abstract

A recirculating aquaculture system (RAS) represents a forward-looking form of aquaculture. A RAS consists of fish tanks and water treatment processes in a closed loop to sustain the environmental conditions for fish production. However, the rapid industrialization of the technology is fraught with transfer problems. This review justifies a RAS process chain based on fish biology. The underlying concept has been evaluated by the author in experimental and commercial RAS projects. The core idea is that the fish must be considered as a technical subcomponent in a RAS, determining the technology. Fish, when considered as small biological machines, are still a black box in many ways. However, their basic biology and physiology provide all the knowledge to implement them in a technical setting. The information required to understand this concept is presented and discussed based on current scientific knowledge. The conclusion is that the technology is available but needs to be rigorously implemented. If this were carried out, fish production in RASs would be ecologically sustainable, which is already claimed for RASs but is not always the reality in commercial applications.
Key Contribution: RAS production of fish is a path to sustainable supply. However, the process still needs to gain reliability. To achieve this, the biological and technical processes must be carefully harmonized. In the review, the single processes typically implemented in RASs are examined based on the biology of fishes and arranged in a RAS process chain following a certain logic. The arrangement of processes is discussed and justified according to contemporary science.

Graphical Abstract

1. Introduction

Recirculating aquaculture systems (RASs) are seen as an alternative technology that goes around the restrictions of open aquaculture systems such as net cage farms or through-flow ponds. The restrictions concern the impact of waste streams released into natural ecosystems, the escape of fish out of aquaculture installations, the transfer of disease to wild fish, and the genetic impact on natural fish populations, to name a few examples.
Today, climate change alters natural environments that are traditionally used by aquaculture. The question is raised as to whether aquaculture can rely on production systems operating in environmentally variable natural ecosystems [1]. A possible adaptation strategy is a RAS because it avoids the restrictions immanent in open systems and operates under controlled conditions [2]. However, the extremely positive expectations regarding the technology [2] are overshadowed by the complexity of RAS technology. The complexity in combination with knowledge deficits and poor management [3] consistently leads to failures in everyday operation. Several mass mortality events in commercial operations are reported in the trade press.
A recent report adopts the concept of ‘manufactured risk’ for the production of aquaculture [1]. Higher production risk can arise from aggressive production strategies. RASs could solve the increased production risk of conventional production systems if all aspects and details related to RAS design and operation are considered. These include the biological characteristics of the fish, appropriate process technology, and responsible management. A strategic business development consultant [4] pointed out the full range of constraints considered as obstacles in RAS aquaculture, with reducing environmental impact and improving animal welfare being top development priorities.
A RAS is a technical system in which living creatures must be kept in living conditions that suit their biology. The fish in a RAS must be considered as a subcomponent of a complex hybrid machine. Engineers do this when working on complex machines consisting of individually engineered components. This is also implemented in any microbiological reactor process. Therefore, aquaculture should start doing the same. Besides the fish, the biofilter microbiome [5] is an important component of water treatment. In today’s RAS technology, fish are often not sufficiently considered as creatures with species-specific requirements. Fish should not be considered as components that have to adapt to the existing conditions. Fish in a RAS are exposed to influencing factors [6]. The influencing factors are numerous and lead to a complex structure of mutual dependencies [7]. However, welfare impairment is avoidable in a RAS if optimal conditions prevail [8].
The initial step of RAS design must be carried out independently from economic considerations. A well-developed RAS will then be functional and deliver high-quality products at the expected time, allowing for thorough business planning. This is what the industry is expecting. A RAS project needs to be well designed, enabling an optimized production process that reaches attractive profitability [4].
This review attempts to explain marine RAS technology from another perspective [9] based on two decades of research and development in experimental and commercial marine RASs. Commercial marine RASs included large-scale and small-scale regional fish production for warm-water species such as European seabass (Dicentrarchus labrax), gilthead seabream (Sparus auratus), yellowtail amberjack (Seriola lalandi), Atlantic salmon (Salmo salar), red drum (Sciaenops ocellatus), and Florida pompano (Trachinotus carolinus). Valuable insights were gained volunteering as senior expert in foreign missions, which showed that equal problems were everywhere. Solutions are often not easy to find when biology and technology have not worked hand in hand in design and construction.
To develop a functional RAS, it is necessary to examine the logic of the RAS process chain. This allows each process to be tuned to work well with the processes connected to it. This review does not repeat reviews [3,6] summarizing the state of the technology of RASs. The aim is to illustrate that RASs consist of continuous and discrete processes that are coupled and interact with each other. Even with only a comparatively small number of individual, interacting components in a RAS, a highly complex causal structure results.

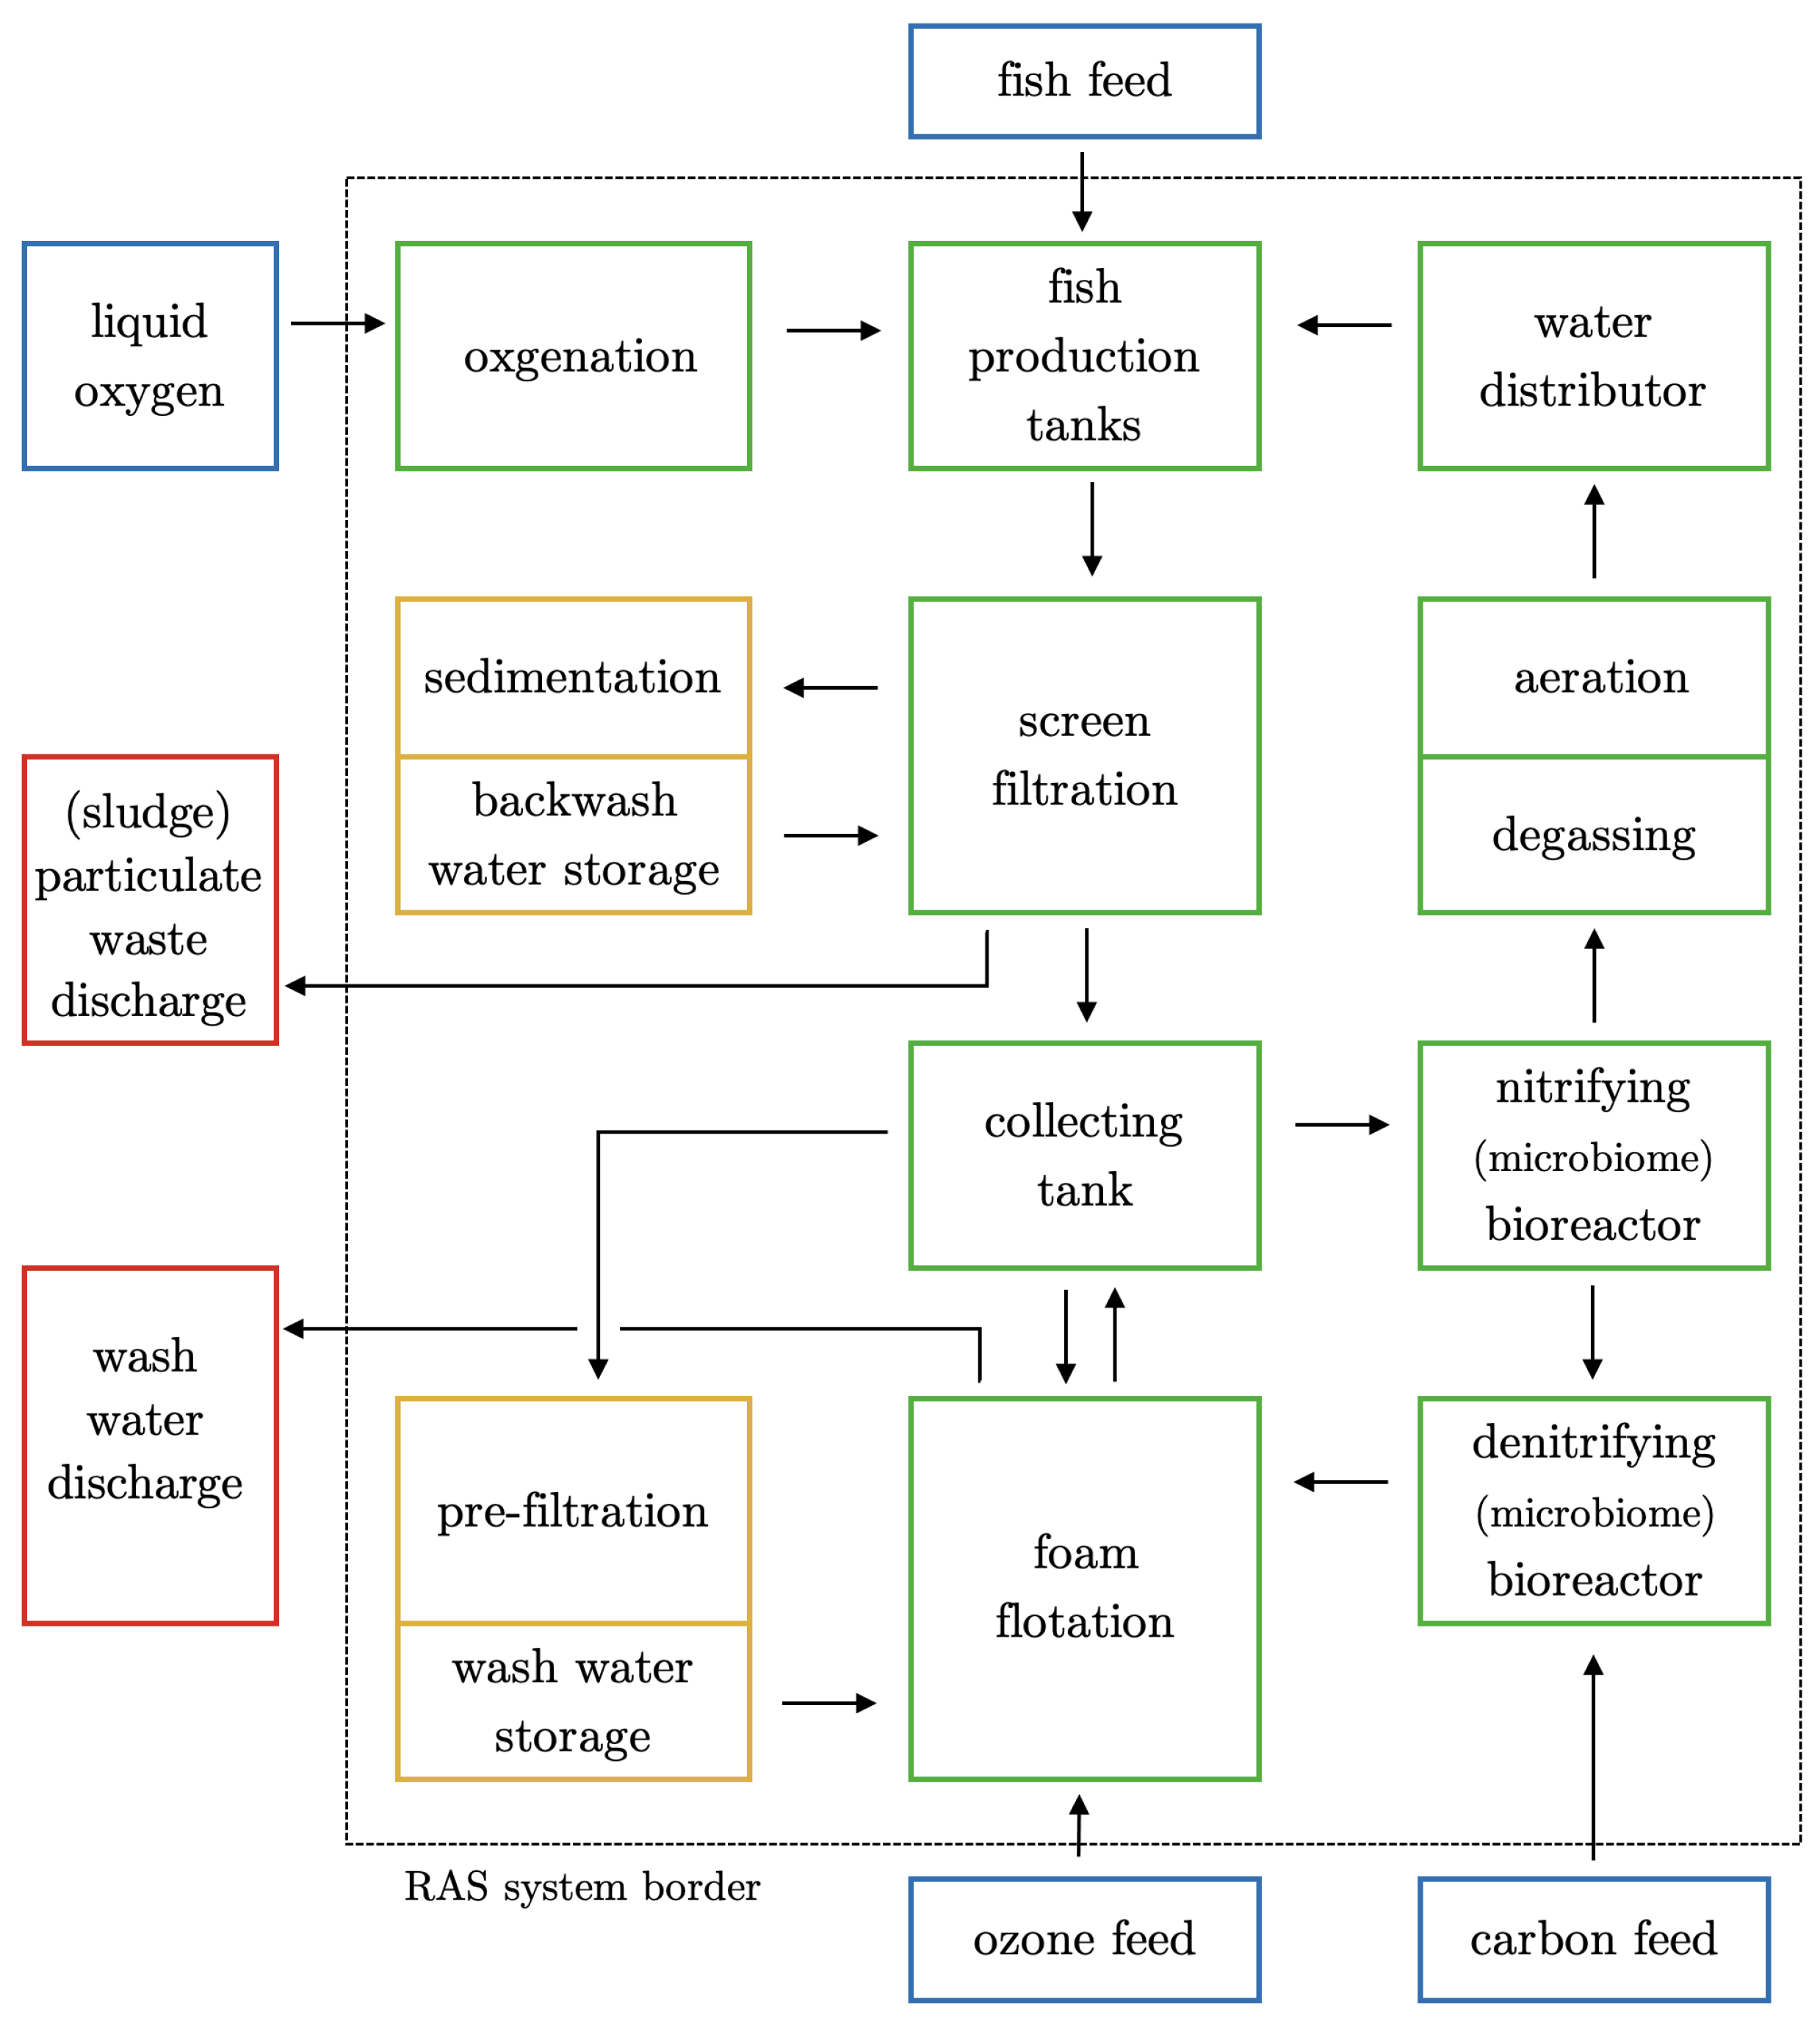
2. The Process Chain and Components of a Marine RAS

Figure 1 shows a general flow chart for a marine RAS that was successfully used by the author in experimental and commercial RAS. Care was taken to combine the components in such a way that optimal interaction of the individual components within the process chain is ensured. The aim is that during operation, every component, i.e., every single process, contributes continuously and with consistent efficiency to water treatment. This allows the necessary living conditions for fish to be maintained in the long term. This is the prerequisite for achieving the production targets and thus for the economic viability of RAS. The aim is to show interactions between the processes in order to support not only the RAS engineering process but also routine operations. This requires close cooperation between biology and engineering, since no biologist can take on the role of an engineer and no engineer can take on the role of a biologist. To ensure clarity, the flow chart in Figure 1 has been reduced to the essential components and processes.

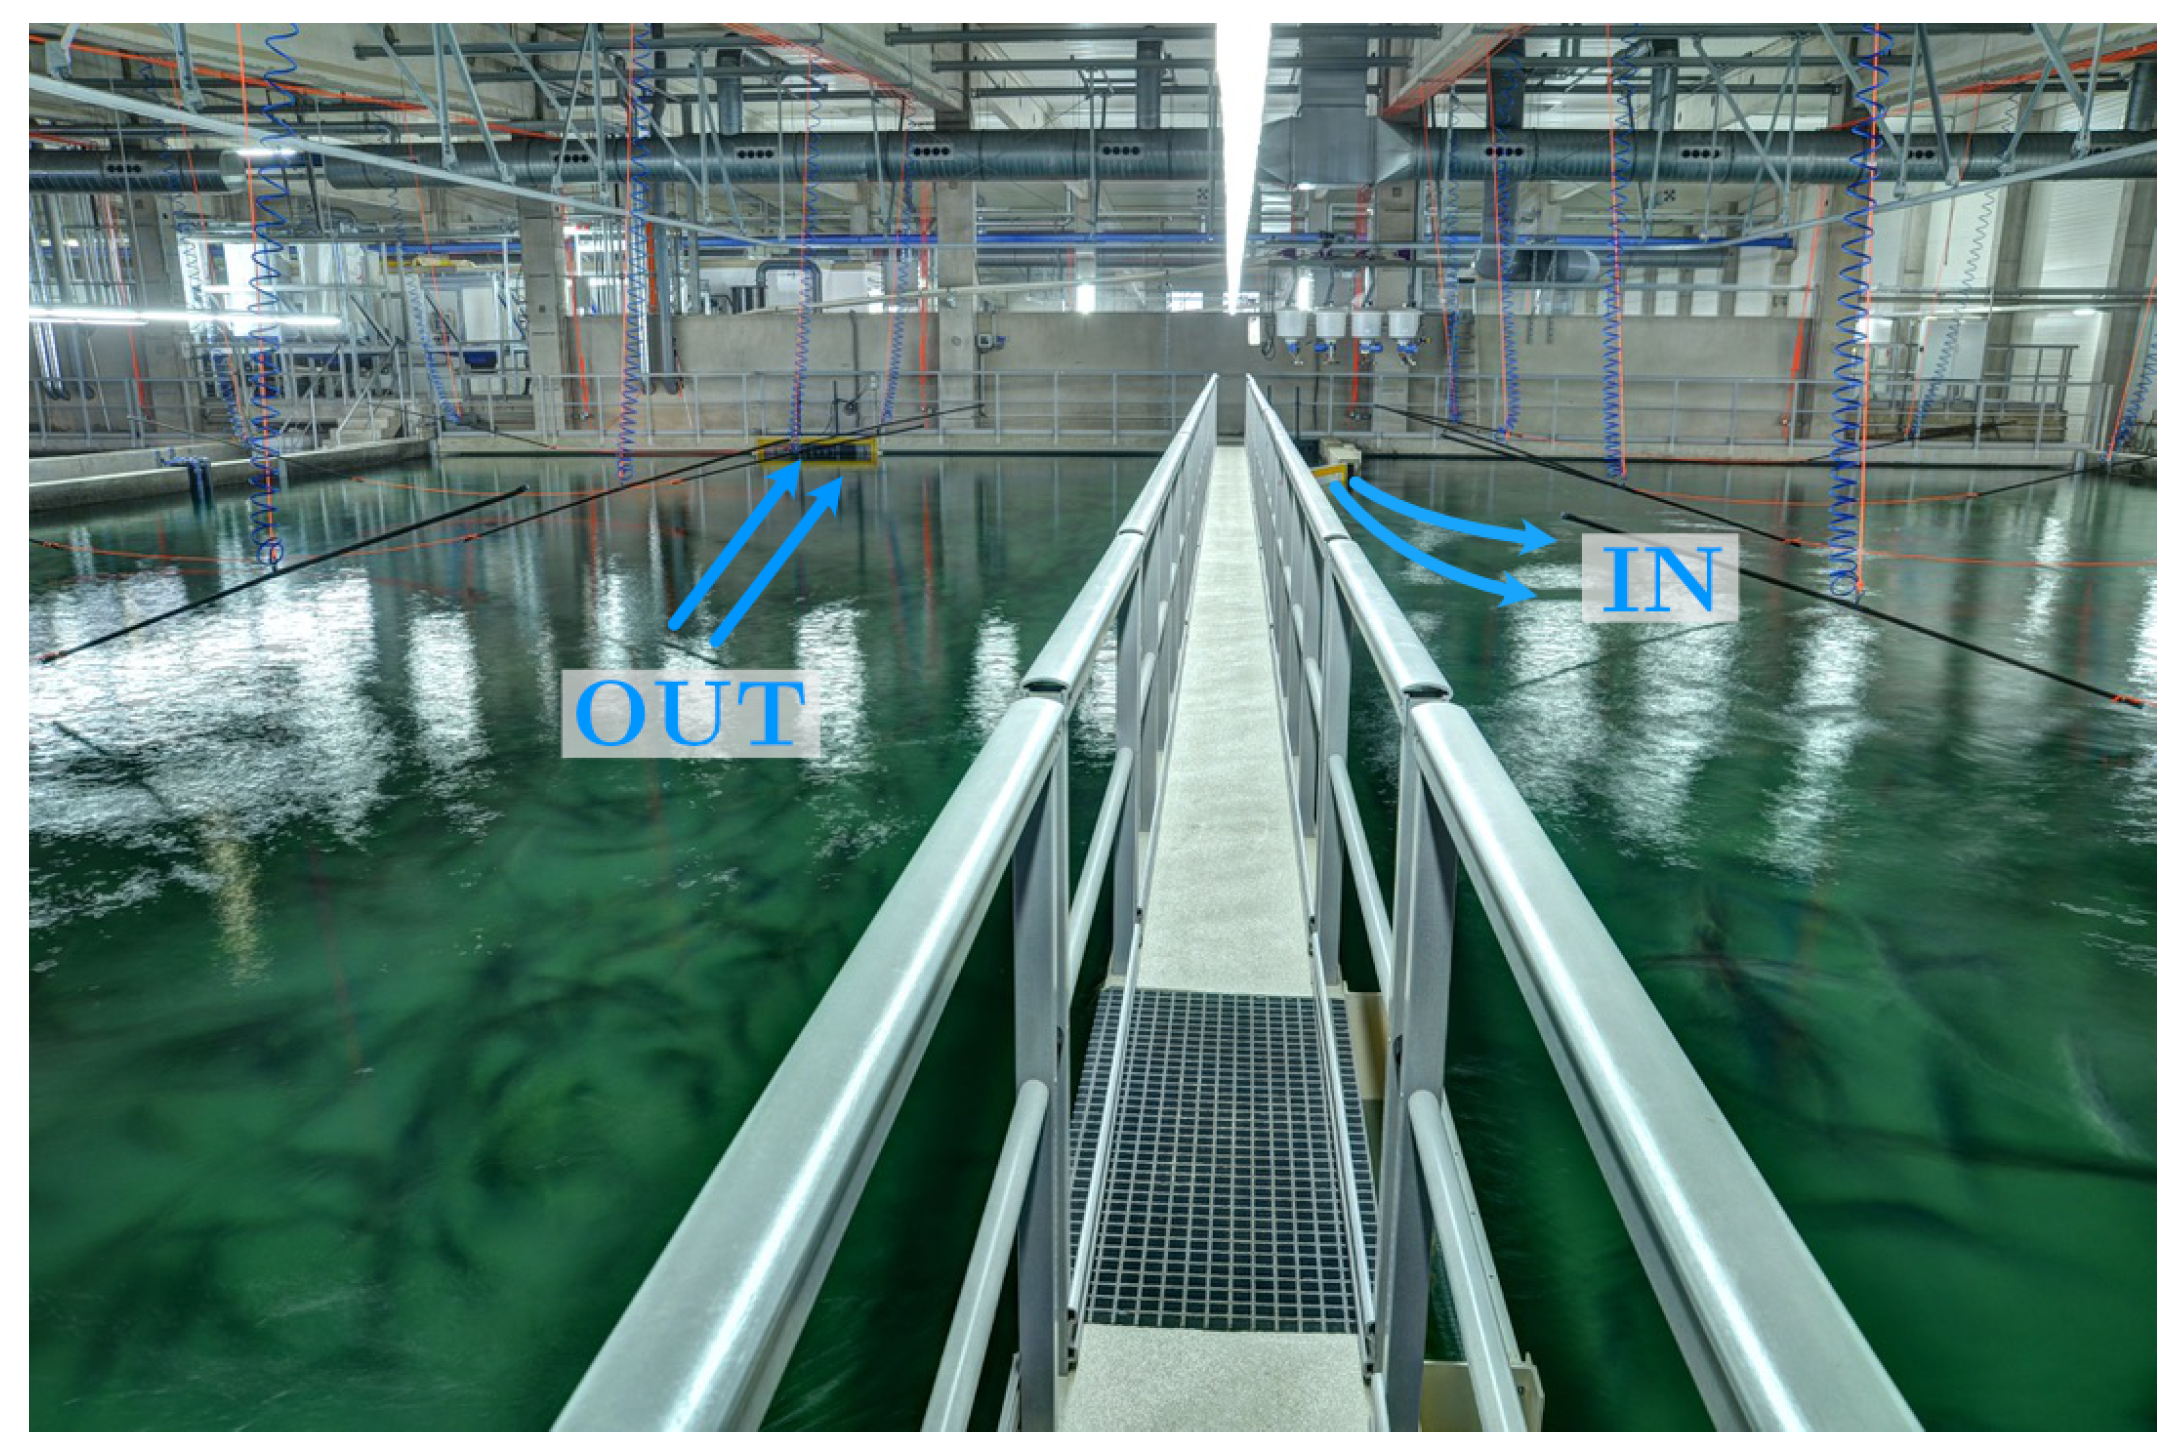
2.1. Fish Production Tanks

In RASs, the fish are maintained in one ore more production tank that is supplied with process water. A circular geometry of the production tank is quite typically used to enhance the removal of large particles at the center drain due to secondary circulation pattern. The secondary pattern develops if the water inlet provides a tangential velocity component on the water surface. The centrifugal force moves the water towards the tank wall, building up a hydrodynamic pressure difference between the tank wall (high pressure) and the tank center (low pressure). The higher hydrodynamic pressure near the tank wall forces a down flow of the tank water, leading to a bottom flow towards the center of the tank. For hydrodynamic reasons, an up-flow of tank water in the tank center must develop. However, this prerequisites a circular flow of the tank water, forcing fish to swim against the direction of the water flow. Rheotactic behavior is widespread in fishes [10], but it does not result in fish swimming at inappropriately high speeds. Fishes can select their habitat within their natural range, whereas a RAS is a confined environment with no possibility of escape.
A difficulty with the circular tank geometry is that the fish are forced to swim continuously. Water velocity changes with position of a fish in the production tank. Water velocity profiles across a vertical plane show that the water velocity reaches a minimum in the center of the tank near the tank bottom [11]. Thus, fish may be able to stay in areas with suitable water flow if not displaced by conspecifics. There may be exceptions in view of experimental results suggesting a continuous forced swimming slightly above one body length of fish per second to maintain high growth rates in Atlantic salmon (Salmo salar) [12]. However, the behavior at the lowest swimming speed (0.5 bodylength s 1 ) was described as ‘more freely’ compared with the groups forced to move around at 1–2.5 bodylength s 1 in the tank at a considerably low stocking density of 5 k g   m 3 . A ‘more freely’ mode of behavior seems to comply to a larger extent with animal welfare requirements.
It may be that the combination of lower density and moderate swimming speed is the best practice for Atlantic salmon (Salmo salar). From laboratory experiments with Pacific coho salmon Oncorhynchus kisutch [13], it can be concluded that natural behavior will continue to be exhibited in a captive environment. The behavioral inventory not only influences metabolic rate but is also likely to alter the preference for higher or lower water velocities according to the species-specific circadian rhythm of activity.
For different fish species exhibiting different behavioral inventories, one or the other geometry might be more suitable. Ultimately, it must be ensured that the geometry supports the behavior of the fish and that the volume flow of the process water is sufficient to reliably replace the water in the production tank. This is the first and absolutely necessary step to a functional RAS. This is often not well acknowledged because of ostensible economic considerations. However, in the end, the functionality of a RAS makes an aquaculture business successful.
An alternative tank geometry is rectangular (Figure 2), which was successfully used in the RAS aquaculture of yellowtail amberjack (Seriola lalandi), European seabass (Dicentrarchus labrax), and gilthead seabream (Sparus aurata). It is used in large- (Figure 2) and small- (Figure 3) scale production. A special feature of this tank geometry is the open-channel flow, minimizing energy consumption for water transport. At one end, the tank receives water from the water treatment system, and at the other end, the water is flushed into the water treatment system. The tank can be divided by net walls to separate fish cohorts of different size or age. The water from the water treatment system flows back into the production tank at moderate speed so that no strong water current is induced, enabling fish of different size and age to display their specific natural behavioral inventory.
One criticism of the rectangular design was that suspended matter cannot be removed and accumulates at the bottom of the production tank. From a technical point of view, this could be a reasonable assumption. However, this is contradicted by experience with a RAS whose production tank consisted of two channels connected at the end. Figure 2 shows the production tank with a stock of sturgeons. No sediments were found at the tank bottom. The apparent blurring of the water surface is due to the process water volume flow and the resulting flow velocity. Moreover, the clear water makes it possible to inspect the entire tank, especially the tank bottom, and to observe the routine behavior of the fish. This is an important indicator of welfare, as it is not a forced behavior. In Figure 3, European sea bass (Dicentrarchus labrax) exhibits schooling behaviour in a small commercial regional supply RAS. The continuous movement of the school prevented the formation of sediment by resuspension.
The fact is that routine fish behavior leads to irregular water currents in a production tank. Fish form groups or schools and sometimes move through the tank at high speed and with rapid changes of direction. This behavior of fish follows a circadian rhythm that is stimulated by alternating periods of light and darkness during a day [14]. From a biological point of view, a rectangular tank is definitely a viable geometry for a RAS, as it does not hinder particle removal in marine RAS. In addition, it supports the development of nature-like behavior and mitigates social stress and aggressive encounters.
Circular and rectangular tanks are just two examples of possible production tank geometries. Many other geometries are currently used in RASs and need to be similarly investigated to determine the advantages and disadvantages. This, however, is beyond the scope of this review.

2.2. Water Distributor

The water distributor (Figure 1) located upstream of the inlet to the production tanks distributes the water to the production tanks at the required volume flow rates. Water transport via pipes is standard, but requires significant process energy due to the pressure loss in pipes and fittings. The return of water from the production tank to the water treatment is often maintained by a low-pressure gradient between the water level of the production tanks and the water level of the water treatment system. This is technically compensated by larger pipe diameters, which reduces the flow velocity of the wastewater stream and may lead to sedimentation of particles. Anaerobic microbial processes may develop in particle accumulations. In the worst case, hydrogen sulfide (H2S) is formed, which inhibits growth [15] and alters routine behavior [16] in fish. H2S has severe consequences for the RAS production process.
A recent publication shows that the critical concentration for H2S is low (1.8 mmol   m 3 or 0.061 g   m 3 ) in Atlantic salmon (Salmo salar) [17]. Details of the physiological consequences showing the potential impact of H2S on the production performance in RAS were investigated in post-smolt salmon (Salmo salar) exposed to elevated H2S concentrations of 0.001 and 0.005 g   m 3 for four weeks [18]. The two experimental groups showed mortality rates of 4.7 % and 16 %, respectively. Growth retardation was evident by a weight reduction of more than 20 % compared to the control group; tissue damage was evident after four weeks of exposure. The results indicate that H2S is detrimental to fish welfare and RAS production even in very low concentrations.
In addition to long-term exposure, short-term contact with acute H2S concentrations can lead to mass mortality, which currently appears to be causing difficulties in marine RAS. Emerging H2S rapidly depletes the oxygen dissolved in the process water ( 2 H 2 S + 3 O 2 2 SO 2 + 2 H 2 O ), resulting in death of fish by asphyxiation.
Regardless of the production tank geometry used, the water replacement rate in the production tank is a crucial parameter. The tank water replacement follows an asymptotic function [19] in the following form: V r = 1 ( e x p ( t · Q p w ) / ( V p t ) ) , where t is the time the water is flowing [h] and Q p w is the process water volume flow rate [ m 3 h −1] into the tank. V p t is the tank volume [ m 3 ]. V r [ h −1] expresses the relative renewal rate of the tank water (Figure 4). The relative water renewal rate increases with increasing water flow rate and is 0.63, 0.86, 0.95, 0.98 for water flow rates of 1, 2, 3, 4 times the production tank volume per hour.
A low process water flow rate ( Q p w ) of one tank volume ( V p t ) per hour would leave 0.37 or 37% of the tank water unreplaced (Figure 4) [19]. This would leave a significant amount of dissolved and suspended waste in the production tank. It would take more than 4 h to completely replace the tank water. During this time, the fish continued to consume feed and release dissolved and particulate matter into the process water. Therefore, at low water volume flow rates ( Q p w ), the remaining waste is expected to accumulate in the production tank and negatively affect the health and performance of the fish. To make matters worse, a literally uncontrollable microbial biomass grows utilizing the remaining waste in the production tank. It possibly carries pathogens. The water renewal rates shown in Figure 4 suggest that a process water flow rate equal to three times the production tank volume ( V r = 0.95 ) is the minimum requirement to avoid a critical accumulation of waste.
High process water flow rates in RASs with many production tanks is probably not easy to achieve and raises energy consumption, as long pipes and many fittings increase the pressure loss. The situation is different with rectangular production tanks. The water distributor shown in Figure 1 is not necessary. The water transport requires less energy because of the minor pressure loss. In addition, the entire tank area can be visually inspected to find and remove accumulations of particulate waste. As mentioned above, the swimming activity of the fish resuspends particles. They are removed with the process water flowing towards the RAS water treatment. In rectangular production tanks with several cohorts of fish, a high process water volume flow can be maintained with comparatively low pump energy. The high water flow ensures that all cohorts are evenly supplied with treated process water.
From Figure 4, it is clear that water exchange is a key factor determining production conditions in a RAS. A comprehensive study with turbot shows that the specific growth rate increases with increasing water exchange in the production tank. In the studied interval of 1 to 8 production tank volumes per hour, the growth rate initially increased together with the water flow. The turning point was reached at 4.7 production tank volumes per hour [20]. Thereafter, the growth rate remained constant. The specific growth rate at the turning point was 25% higher than at a flow of one production tank volume per hour. This proves the need to maintain a high water flow in a RAS circulation, which, however, requires smart engineering to reduce the energy consumption. A water flow of 4.7 production tank volumes per hour results in an almost complete exchange (99%) of the process water in the production tank within one hour [19].

2.3. Screen Filtration
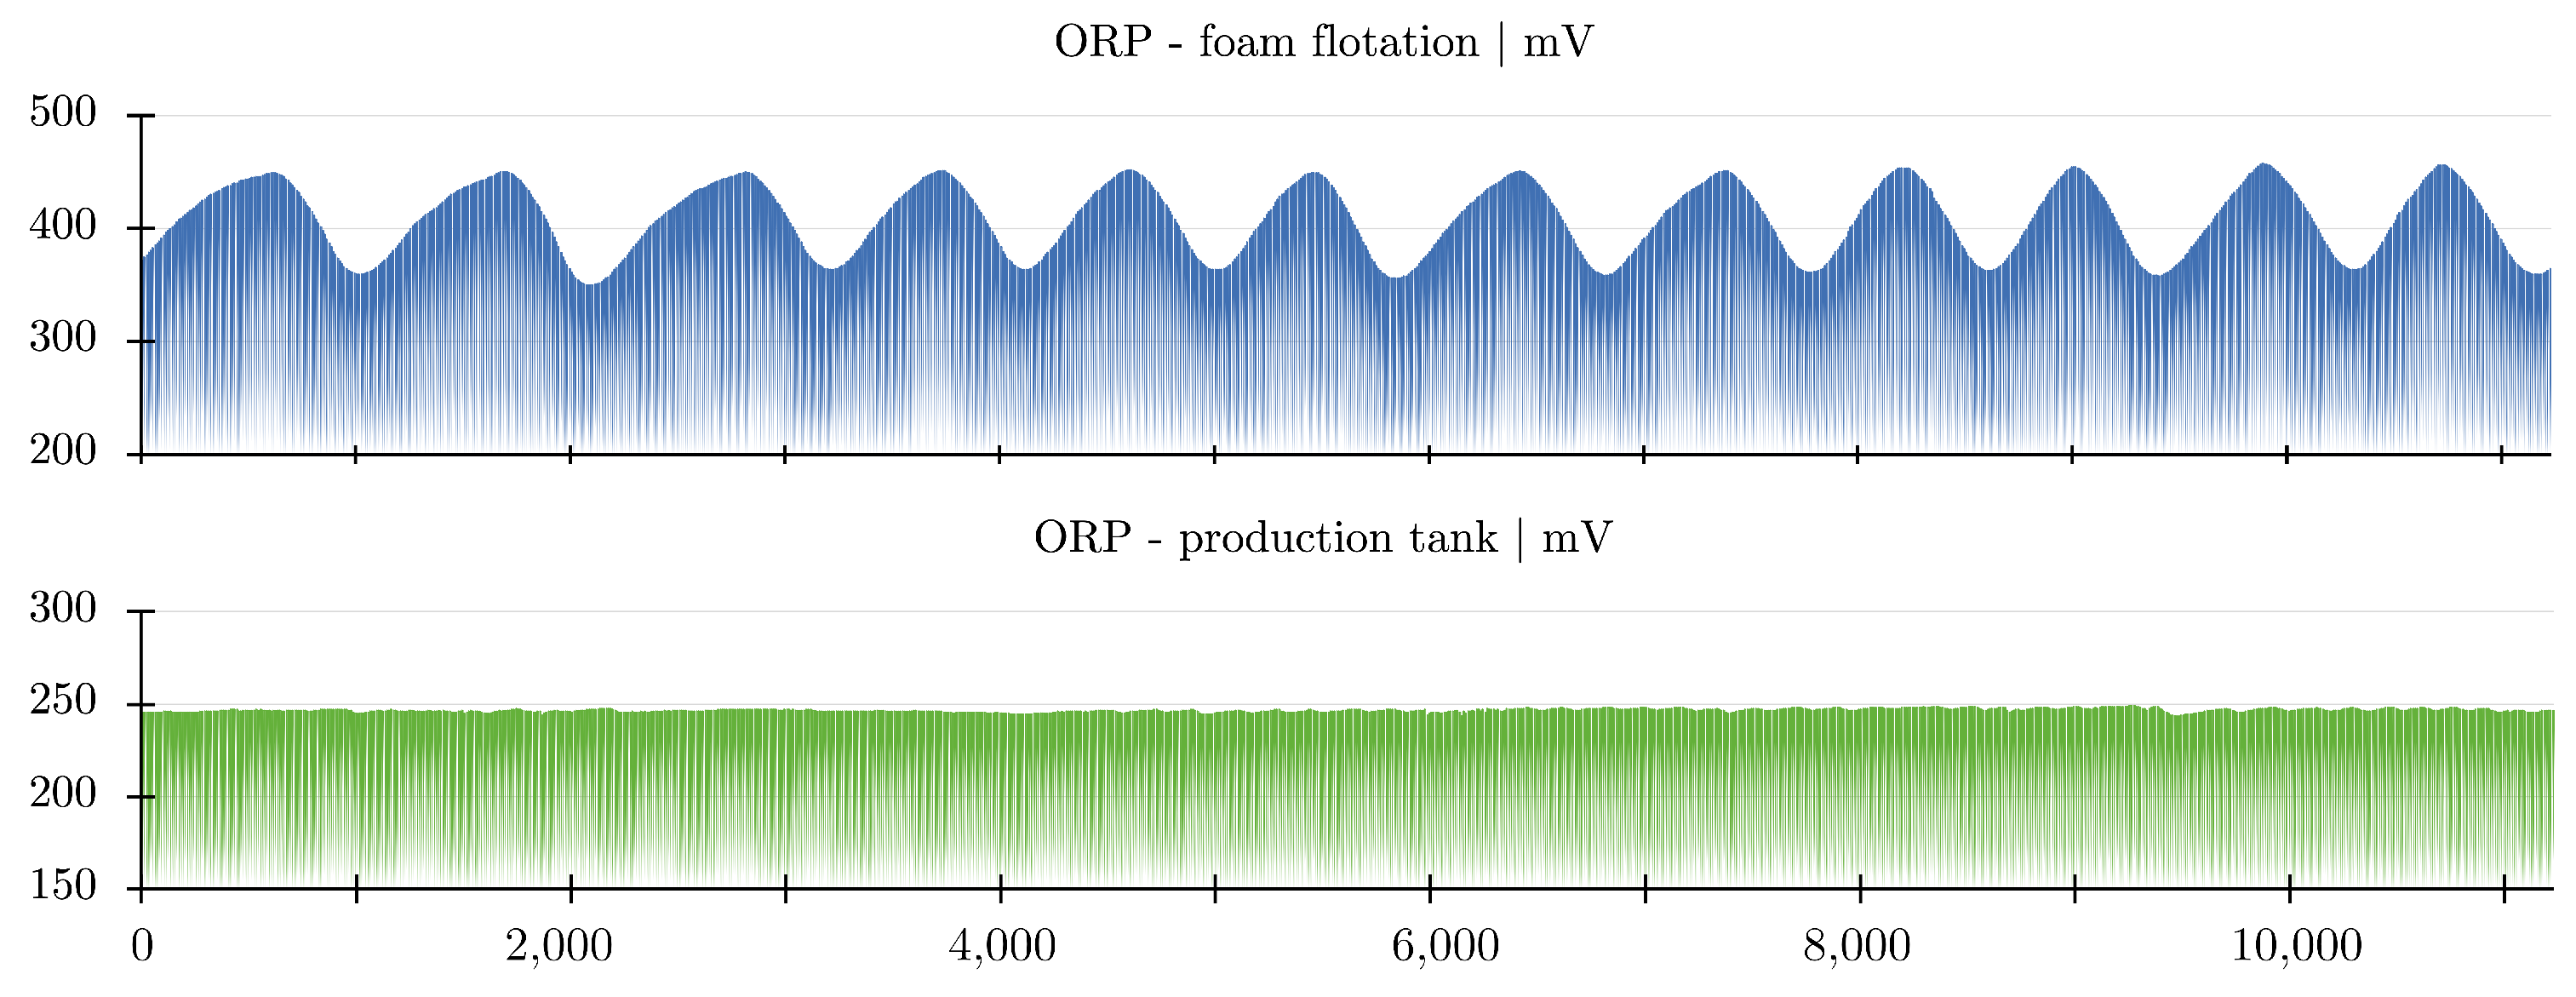
The process water leaving the production tank is usually passed on to a screen filtration system. The screen filtration must be capable of safely passing the total water volume flow from all production tanks under all operating conditions. If not, the water volume flow to the production tanks and back to the water treatment cannot be maintained on the necessary flow rate as it was shown above. As a consequence, the flushing of production tanks is hampered, potentially affecting fish health and growth through accumulating nutrients and particulate matter.
Besides others, drum filters are a typical technical solution. The mesh size of the filter screen is variable and thus also the separation limit. The standard mesh size of drum filters for a RAS is between 60 and 100 µm, but smaller mesh sizes are also available. The mesh size and screen area determine the water volume flow per unit of time. The required high process water volume flow in a RAS (Figure 4) may not be able to be accommodated by a single drum filter. Parallel operation of several drum filters may be required to accommodate the entire back-flow from the production tanks. This would also ease maintenance routines as intensive cleaning of the filter screen can be performed independently for every drum filter. Regular intensive cleaning of filter screens is necessary to maintain water flow rate. This includes the maintenance of pressure pumps and nozzles for the backwash process.
A safe engineering solution is absolutely necessary, since the formation of a so-called filter cake on the filter screen during operation can lead to an additional reduction in the separation limit. This would reduce the possible process water volume flow, as the back-flow from the production tanks is hindered. This must be thoroughly taken into consideration during the selection of components, as process water flow determines the water quality in production tanks.
A critical factor to RAS water quality is drum filters having a so-called ’emergency overflow’, bypassing the water flow around a clogged filter screen. Even if this is a common engineering solution to safeguard operation, a bypass flow would circulate particle-rich process water from the production tank to the water treatment system and back into the production tanks. Organic particles circulating in RASs provide surface area for bacteria and control bacterial biomass in RASs [21]. The assessment of the influence of bacteria on fish health varies. From a veterinary perspective, suspended solids are a catalyst for irritation of the gills in fish [22,23]. The pathology includes hypertrophy and hyperplasia resulting in a hindered oxygen uptake by the gill area. The same pathology was reported from RAS [24]. However, a slight increase in bacterial did not have any apparent effect on salmonid performance or health in RAS [25]. Particles trigger a cascade of effects on fish, including impacts on growth, fertility and mortality [26]. These are adverse factors that should be prevented in aquaculture, also for economic reasons. If particle load determines bacterial biomass, it also may impact RAS aquaculture by forming off-flavor compounds [27] that are not easily depurated from water and produced fish [28].
Particles in RASs are probably no larger than 300 µm in diameter. The majority of particles are probably smaller than 20 µm [25,29]. This indicates that a screen filtration, the drum filter, does not remove all particles. It removes particles that are close to the mesh size and larger. In addition, shear forces lead to a fragmentation of larger particles [29,30] increasing the share of small particles in the process water effluent of the drum filtration. With that, the particle distribution in the RAS would be shifted towards smaller particles contributing to the turbidity in the RAS process water.
Small particles are widespread in the ocean where fish are. Biogenic particles settle in the water column and thus disappear from the surface water [31] feeding the biogeochemical cycle. Larger particles settle faster than smaller particles and release fewer chemical substances. However, Sedimentation, which is a slow process, must be replaced by a much faster process in RASs to maintain natural seawater quality. The proportion of particles under 100 μ m in size, with the majority of particles being under 20 μ m in size, can be separated from RAS process water by flotation [32].

2.4. Foam Flotation

An ozone-enhanced flotation was implemented in RAS water treatment, likely for the first time, almost twenty-five years ago [9]. Some years later, only a few RASs included this process (4% in 2012 [7]), amid scientific reports showing the potential of this technology quite early [33]. The number of RASs using flotation seems to be increasing. But, flotation is often implemented at a late stage when the function of water treatment is the RAS is already hampered by high particle load, which includes bacteria and microorganisms.
Flotation apparatuses in marine RASs typically have the form of a bubble column installed in a side stream (30% of the main water volume flow) downstream to the screen filtration. The geometry is cylindrical. In the lower part of the flotation apparatus, the foam is developing in the liquid phase in the reactor vessel. The foam ascends into the foam zone above the water level and enters into the cylindrical foam collector tube. The foam leaves the flotation apparatus at the upper edge of the foam collector (Figure 5), as well as air and residual ozone. Here, the organic substance (surfactants) is removed with particles including bacteria [34] and other microorganisms (Figure 5).
Flotation is a separation process based on small air/gas bubbles rising upwards in a water column. Technically, it is a countercurrent reactor (contactor), as the process water feed is at the top of the apparatus. Particles adhere to the bubble surface and concentrate at the surface, where they are removed by a skimming device. In RASs where the process water carries considerable amounts of dissolved organic matter surface, active molecules (surfactant) attach to the gas–liquid interface [35]. Gas bubbles surrounded by a thin surfactant layer are called colloidal gas aphrons. They are gaining stability and better withstand external forces [36]. Surfactants can be cationic and anionic. The electrical charges increase the binding capacity of particles to the gas bubbles. Thus, in marine RASs where surfactants enhance the flotation process, the process should be denoted as foam flotation. The bubble surface area is the site where particles, including microorganisms, are removed. The airflow is crucial for the effectiveness of the filtration, and the bubble size determines the surrounding surface area. In seawater, bubbles tend to be smaller, forced by surface tension and lower coalescence [37]. Thus, the effectiveness of flotation can be expected to be higher in seawater compared with freshwater. The threshold salinity to achieve an effective flotation process is around 11 psu salinity [38].
A notable advantage of foam flotation is that organic matter is continuously removed from the RAS process water. The organic surfactants used as a filter matrix in foam flotation are removed from the process water with the air/gas bubbles. This contributes to lower dissolved organic carbon in RASs that could otherwise be used by heterotrophic bacteria. Thus, the foam flotation potentially inhibits excessive production of bacterial biomass. In addition, bacteria cells are floated out of the water as a whole. This removes all cell components and included substances so that organic substance is additionally removed. The beneficial effect on water quality [39] can also be derived from results [40] showing low BOD in RAS process water treated by a two-step particle separation. Ozonation generally improves water quality in RAS, even if used without a flotation [41].
Foam flotation can be enhanced by the addition of ozone to the air stream. The theory is that ozone breaks up large organic molecules [39]. The molecule fragments potentially contribute to the fraction of surface-active substances in RAS process water. However, ozone is highly toxic and forms toxic residual oxidants (TRO). The toxicity of ozone affects the respiratory system in fish [42,43,44]. Ozone affects the gill morphology and causes hemolysis and the aggregation of red blood cells in the lamellar vessels of the fish gills. This leads to the death of fish in a short time. At extreme concentrations of 0.4 g   m 3 50%, fish mortality occurred within 30 min [42].
As simple as the design of a foam flotation apparatus appears, the adjustment of the water, air, and ozone gas flow is complicated. Mass balances that would ease the adjustment are lacking for RAS applications. The diversity of RAS designs and the differences in water quality may not allow the development of general models. Regardless, a comprehensive evaluation of RAS foam flotation process based on a multi-factorial experimental design showed that the ozone feed is likely the primary factor significantly affecting water treatment and water quality [45]. As ozone is usually supplied with the airstream, the air flow needs to be thoroughly adjusted forming a maximal bubble surface area as a contact zone for the ozone.
Ozone is typically supplied into the foam flotation together with an air stream, often by means of a Venturi injector. The control of ozone feed rate is usually controlled by a two-point ORP (Oxidation Reduction Potential) controller. ORP is a proxy variable for the concentration of ozone [38] and TRO. The lower ORP set-point of the controller determines the minimum of the control curve. The maximum of the control curve is determined by the upper ORP set-point and the switch-off delay of the ozone feed (Figure 6, upper graph, ORP—foam flotation). The delay is caused by the residual volume of ozone in the supply lines. The ozone flow rate needs to be thoroughly adjusted to minimize the overshoot of ORP. The control curve in (Figure 6, upper graph, ORP—foam flotation) shows that despite the delayed switch-off, the ORP remained within safe limits (Figure 6, lower graph). The process water leaving the flotation is mixed into the main process water flow. Due to reactions with dissolved organic substances present in the RAS process water, ozone and TRO concentrations typically decrease rapidly in the supply lines to the production tanks.
The ORP in the production tanks usually levels between 200 and 300 mV at a control range of the two-point controller between 350 and 400 mV in the foam flotation (Figure 6). The distance between the point of ozone injection and the production tank usually helps to remove the residuals. This is also the case if ozone is not injected in a foam flotation. Results obtained from experiments in a 38 m 3 semi-commercial RAS show the same picture [46]. The average ORP was 282 ± 13 mV in the production tank for Atlantik salmon post-smolts, while the ozone addition after the screen filter upstream of the production tank increased the ORP in the process water to 334 ± 22 mV. The ozonation did not affect post-smolt production even if transcriptomics revealed the expression of differentially expressed genes in the gills, probably related to an adaptive mucosal response. The ability of fish to respond to secondary stressors was not affected. A thorough control of ozone dosage is essential in a RAS. ORP is a useful proxy variable (Figure 7).
In many RAS applications, it has been observed that a moderate addition of ozone removes turbidity and discoloration in RAS process water. Figure 7 shows the relationship between TRO and ORP based on parallel measurements of TRO and ORP [33]. The red and green frames mark the safety ranges for ORP and TRO derived from the literature [43,44,47,48]. The safety range for TRO (<0.06 g   m 3 ) indicates higher values of the safe ORP limit than would be expected based on safe ORP (<360 mV). In view of the potential impact on fish health, it would be best to design the ozone supply so that the ORP remains in the green marked area of the Figure 7. This can avoid the creation of dangerous residual oxidants. However, if the safe TRO concentration is converted to ORP, the safe ORP range would expand to 500 mV. If dangerous residual oxidants are created, an additional removal process for ozone and residual oxidants would be required after foam flotation [49]. This is expected beyond the area marked with a red line in Figure 7.
ORP is a measure of the ability of a chemical/biological system to undergo oxidation or reduction reactions. Positive ORP values indicate an oxidized state of a system, while negative values indicate a reduced state of a system. However, ORP is a nonspecific variable. In Figure 7, various measured ORPs are shown as points for a constant TRO of 0.03 g   m 3 . The wide range of ORP indicates that various chemical/biological processes contributed to the ORP. However, ORP did not provide any indication of the exact chemical/biological mechanisms behind the changes. Therefore, careful application in RAS is required, possibly by repeated comparative measurement of ORP and TRO concentration.
The ORP in low-density systems such as aquaria ecosystems is maintained at a higher level because a diverse biome support the oxidative state of the system (Figure 7, open squares). A well-structured aquarium habitat supports the valorization of particulate and dissolved organic substances through numerous organisms. Such conditions can be, for example, found in artificial reef ecosystems (aquaria) [50]. The application of ozone would be difficult in these systems because an already high ORP does not allow one to control the ozone feed. On the other hand these measurements point out that an ORP of 350 mV is by no means harmful to fishes in a captive environment if this is achieved by moderate biodiversity. However, this is different in technical systems.
In aquaculture systems, ORP is low due to the waste stream from fish kept in higher biomass in the production tanks. ORP in a RAS is mainly controlled by chemical oxidation processes through the feed of ozone. This has nothing to do with the above-described biologically controlled state. Ozone in aquaculture is merely an additive that if not safely applied can interfere with the biological processes of the few remaining species coexisting in RAS. Regardless, if applied in a careful manner, no negative effects are expected [46].
The disinfection of RAS process water through ozone [51] appears to be a critical endeavor. As highlighted in Figure 7, it is necessary to limit the ozone supply to the foam flotation to maintain safe TRO concentrations in the RAS water cycle (Figure 6). Bacteria are much more tolerant to elevated ozone concentrations. Waterborne pathogenic and heterotrophic bacteria need to be treated with 3–4 g ozone per m 3 for 15 to 60 min to achieve a one-log reduction in bacterial count [52]. In another experiment, a 3–4 log reduction was observed after a one-hour treatment with 3 g ozone per m 3 [53]. The effective ozone concentrations were always above the safe limits for fish that would be exposed for much longer times if disinfection would be carried out in the RAS circulation. These data demonstrate that disinfection would affect fish before it actually had a disinfecting effect.
Another potential impact of ozone in RAS is linked to the nitrifying microbiome in the biofilter. Low ozone concentrations, 0.06 g   m 3 measured as Cl2 equivalent, do not harm the microbiome of the nitrifying biofilter [54]. Even a chronic exposure to ozone concentrations of 0.15 g   m 3 had no effects [55]. In summary, fish are the most sensitive organisms in regard to ozone and, therefore, determine the ozone feed and the maximum allowable ozone concentration.
The central process in ozone-enhanced foam flotation is the continuous removal of bacteria from the process water. In the end, the process water still contains some bacteria. The microbial community of process water in a RAS was found to be similar at the same time in different compartments in the RAS [56]. This is not surprising when process water is kept in circulation in a RAS, especially at the required volume flow rate (Figure 4). Bacteria in moderate density are not a problem in RASs anyway; fish cope well with bacteria in their natural habitat. Typical bacterial cell counts are 0.5 × 10 12 , 1.0 × 10 12 and 5.0 × 10 12   m 3 in the open sea, on the coast, and in estuaries. The problem with microbiomes in RASs seems to be largely related to pathogenic bacteria released by infected fish themselves. However, at some point, the first pathogens must have been introduced into the RAS or selected from the RAS microbiome. Foam flotation removing bacteria from RAS process water is an essential process maintaining safe microbial conditions in RAS.

2.5. Nitrifying Bioreactor

The next treatment step in the process chain of a RAS is the nitrifying bioreactor. Nitrification carried out by bacteria plays a key role in the global biogeochemical nitrogen cycle, with ammonia as the primary substrate. Ammonia (NH3) is converted into nitrite (NO2) and nitrate (NO3).
Ammonia is a common excretory product of protein metabolism in aquatic organisms and has toxic properties that involve several metabolic pathways [57]. Even if ammonia has a central role in aquatic ecosystems [58], it is highly toxic to organisms and is, therefore, rapidly converted by microbial nitrification. Microbial nitrification is a pivotal process in natural ecosystems and so it is in artificial technical systems such as a RAS.
The toxicity of ammonia is related to the concentration of gaseous ammonia, which is in equilibrium with the ammonium ion. The pH, temperature, and salinity of the water determine the equilibrium state. The fraction of toxic ammonia at a given total concentration of ammonia nitrogen (TAN) can be calculated [59]. In seawater RASs, the equilibrium is on the side of ammonium, with less than 1 and up to 10 percent in the form of toxic ammonia. The role of nitrification in RASs is to rapidly convert ammonia and ammonium into nitrite and the least toxic compound, nitrate.
The effects of environmental ammonia on fish have been studied many times. The pathology includes the disruption of energy metabolism, interrupting neuronal pathways, and affects epithelial integrity of the gills [57]. Critical ammonia levels were studied in long-term and short-term experiments. The results of short-term experiments are not relevant to fish production in RASs, as the production time in RASs is beyond days. Only a few studies have investigated the toxicity of ammonia over longer periods of time. In an extensive experimental approach exposing European seabass Dicentrarchus labrax to elevated ammonia levels for 60 days, an overall critical ammonium concentration for growth was described at 5 g   m 3 total ammonia nitrogen (TAN) [60], which includes both the gaseous NH 3 and the ammonium ion NH 4 + . In view to the RAS water quality (23 ° C, 18 psu, pH 7.5), the ammonia concentration would be in the range of 1.4% of the TAN concentration [59], amounting to 0.07 g   m 3 ammonia ( NH 3 -N). The impact of ammonia on the growth of Scophthalmus maximus was investigated at 18 ° C , 33.5 psu salinity, and a pH of 8.04 [61]. The results of the 64 days growth experiment show that at 0.13 g   m 3 ammonia concentration ( NH 3 -N), the growth was significantly depressed. Even simulated low postprandial peaks of ammonia (0.03–0.13 g   m 3 ) significantly and equally reduced growth compared with the control group. In another study, the swimming performance of coho salmon Oncorhynchus kisutch at increasing ammonia levels was investigated [62]. The critical swimming speed was determined to be 17 ° C and pH 7 in freshwater. The critical swimming speed, which is an indication of the highest position-maintaining swimming velocity of fish, decreased from 2.3 in ammonia-free water to 1.5 body length s 1 at 0.07 g   m 3 NH 3 -N. Acute intoxication is of little relevance to fish production in a RAS. Anyway, the 96 h LC 5 0 for Oncorhynchus kisutch was between 0.37 and 0.52 NH 3 -N g   m 3 at 13–14 ° C and pH 7.3–7.8 [63].
Another way to estimate the toxicity of ammonia is to use the concentrations in marine ecosystems as a guard rail for the maximum concentration in a RAS. The course of ammonia concentrations along a transect in the Tamar Estuary shows that ammonia concentrations ( NH 3 -N) decreased from 0.04 g   m 3 in the estuary to 0.03 g   m 3 towards the English Channel [64]. The low concentrations are the result of the biogeochemical cycle with microbial nitrification as a key process [65]. In the Eastern Tropical North Pacific, the sea surface NH 4 + concentration was measured below 0.02 g   m 3 . Concentrations of ammonia in other parts of the oceans may be 10 times lower and require special analytical equipment [66]. Ammonia must, therefore, be seen as a trace component in the seas. Oceanic concentrations represent the safe range for long-term keeping of fish in a RAS environment. The fact that this range is below the experimental limits only shows that fish have a certain tolerance to increased ammonia concentrations, which should not be exhausted in a RAS designed for optimal fish growth. In this respect, it is interesting that an extremely low effect level for Atlantic salmon post-smolts (Salmo salar) was determined at 0.012 g   m 3 NH 3 -N [67]. This low concentration, which is below oceanic concentrations, was the lowest tested ammonia level in the cited study, so this conclusion is vage.
Ammonia is one of probably many stress factors in RASs. Additive effects must, therefore, be assumed. From this point of view, RAS nitrification must be capable of maintaining low ammonia concentrations. Figure 8 shows the maximum allowable TAN at different process water pH calculated for a maximal allowable ammonia concentration of 0.04 g   m 3 in RAS process water that is comparable to a high ammonia concentration in the seas. The allowable TAN depends on process water pH and temperature. The salinity has a minor influence. The allowable TAN is higher in cold water RASs compared with warm water RASs due to the temperature effect on the ammonia/ammonium equilibrium [59].
Nitrite appears to be a less toxic intermediate of nitrification in seawater than in freshwater. Increased methemoglobin levels with oxidative stress in gill tissue and cell apoptosis were observed in Scophthalmus maximus exposed to concentrations of 18 g   m 3 for 96 h [68]. Acute toxicity ( LC 50 , 96 h exposure time) was observed in Sebastes inermis at 700 g   m 3 [69]. The 48 h LC 50 nitrite concentration in freshwater for Oncorhynchus tshawytscha is about 19 g   m 3 [70], which corresponds to the initial stress level in marine fish. A nitrite concentration of 1070 g   m 3 caused a low mortality of 10% in O. tshawytscha in seawater within 48 h. Problems with nitrite in freshwater fish are related to their active Cl uptake mechanism of the gills, which takes up nitrite when this ion is present in the water [71]. From this point of view, nitrite does not seem to be a larger problem in marine fish. However, from the point of view of RAS operations, an elevated nitrite concentration in the process water of a seawater RAS indicates an incomplete nitrification process that requires immediate intervention by operators. In fact, low nitrite concentrations induce metabolic stress long before mortality is observed. No mortality does not indicate safe and appropriate living conditions for fish in a RAS.
Nitrification in RASs is carried out in bioreactors called biofilters. Biofilter implies that the technical process is filtration, which is not the case. Nitrification does not at all remove ammonia excreted by fish. It merely converts ammonia into nitrate nitrogen, which would accumulate in RAS process water if not removed by denitrification (see below). Nitrifying biofilters have in common that the bacterial nitrification process takes place in biofilms that adhere to surfaces. Biofilms in biofilters have a fairly stable microbiome in RAS [56]. The formation of biofilms is based on communication via chemical signaling molecules within the nitrifying microbiome, which is called quorum sensing [72]. The fractionation of these signaling molecules could be a detrimental effect of high ozone doses on bacterial nitrification, while moderate ozonation even seems to promote the biological nitrification process [55,73].
Nitrification technology is well developed and undoubtedly capable of maintaining the required low ammonia and nitrite concentrations in RASs. Nitrification in RASs is usually carried out in fluidized bed bioreactors (MBBR) [74,75] or trickling filters (TF) [76]. When treating process water in a RAS, a combination of both filter types is often used.
An MBBR is a type of underwater bioreactor in which the nitrifying biofilm adheres to the surfaces of plastic biocarriers distributed throughout the bioreactor. The geometry of the bioreactor can vary greatly. Many are in the shape of a rectangular tank, possibly with a sloping bottom. The biocarriers are moved by the water flowing through the bioreactor and a rigid flow of compressed air via nozzles in the lower part of the MBBR. To ensure continuous movement of the biocarriers, the volume of the biocarriers filled into the bioreactor amounts to 40 to 60% of the bioreactor volume. The density of the biocarriers is in the range of the density of the process water. The rigid movement of the biocarriers leads to the shearing of biofilms, which regulates the thickness of the biofilms to a certain extent. Many biocarriers also offer a so-called protected space in which the biofilm is exposed to shear forces to a lesser extent. The available biosurface of the biocarriers largely determines the rate at which ammonia and nitrate are oxidized by bacteria to nitrate.
The MBBR design allows operation at low water pressure. The volume flow of the process water supplies the microbial process with some of the required oxygen [53] and provides bicarbonate to the autotrophic process. The biomass is built up from bicarbonate as the sole carbon source. Carbon dioxide, which is in a pH-controlled equilibrium with bicarbonate in aqueous solutions, is fed into the bioreactor with compressed air. The air also supplies additional oxygen. The size of the air bubbles determines the gas transfer, since smaller bubbles have a larger specific surface area. In seawater, air bubbles remain much smaller than in brackish water or freshwater, which improves gas transfer in both directions, i.e., into and out of the bubbles [37]. The MBBR is involved in controlling the concentration of dissolved gases in the RAS process water, which are in equilibrium with the partial pressures in the atmosphere [77].
A trickling filter is basically a vertical bioreactor where the biofilms grow either on blocks of biocarriers material or on loose biocarriers fills. The process water is pumped to the top of the reactor and distributed over the surface via a distribution plate. The process water flows downwards following gravity, with the downward flowing water forming a thin film of water on the surface of the bacterial biofilm. The process water is collected in the lower part of the bioreactor and returned to the RAS circulation.
The water supply to a TF requires more energy due to the geometry and installation above the water level (water column). However, the water film above the biofilm serves for gas transfer because the design of a TF allows for internal airflow. Airflow through the bioreactor can be increased by a fan directing the airflow upwards countercurrent to the downward flowing water. As in the MBBR, the supply of oxygen and bicarbonate is partly provided by the volume flow of the process water. The main gas transfer is likely to occur via the water film according to equilibrium concentrations [77]. Design criteria and notes on the operation of TF have been discussed in detail [78].
The conversion rate of the nitrification process depends on the kinetics of the bacterial biofilm [79] occupying the surface of the biocarriers. The kinetics are controlled by physical, chemical, and biological processes that depend on a number of variables, such as temperature, salinity, dissolved oxygen concentration, process water volume flow, turbulence, pH, alkalinity, contaminants, substrate concentration, and concentration of organic matter. All these variables cannot be overlooked during the planning and design of nitrification bioreactors in a RAS.
Nitrification is temperature-controlled. Both steps of nitrification, the biological oxidation of ammonia and subsequently of nitrite, follow a typical optimal curve with a maximum conversion rate at 30 ° C [80]. Above 30 ° C , the nitrification rates decrease. The temperature dependence roughly follows the Arrhenius theory, which predicts a doubling of the conversion rate for a 10-degree increase in temperature. For RAS design, the surface-specific removal rate is a design criterion. The surface-specific removal rate refers to the surface area available on the biocarriers. Depending on the process water temperature, the required biocarrier surface area must be adjusted to ensure the conversion of the ammonia excreted by the fish. This must be based on a reliable growth model for the target fish species. From the surface area, the volume of the biocarriers can be calculated, which is the criterion for the design of the bioreactor. If the size of the bioreactor is not optimally designed from the beginning, the fish will suffer from residual ammonia and nitrite concentrations.
Salinity does not seem to be a problem for the nitrification process in RASs. RAS bioreactors can be activated with brackish water and marine nitrifying bacterial strains. Nitrification rates were the same in seawater with 30 psu salinity and in brackish water with 15 psu salinity [81] amid distinctive bacterial communities that may be found in freshwater, brackish water, and seawater MBBR [82].
Abrupt salinity changes from freshwater to 25 psu [83] are critical. Complete inhibition was observed when salinity was steeply increased to 25 psu. Ammonia and nitrite removal rates were reduced by 25% at 10 psu salinity and by more than 90% at 15 psu salinity. However, this seems to be a specific problem for salmon farming and does not occur in marine fish that spend their entire life cycle in the sea. In these fish species, salinity is maintained at fairly constant levels in RASs.
The oxygen supply to nitrification is crucial and another necessary design criterion to maintain optimal conditions for the nitrifying microbiome. Oxygen is supplied to nitrifying bioreactors by the volume flow of the process water and either by bubble aeration (MBBR) [84] or air flow (TF). The TAN removal rate in RAS nitrification decreases with decreasing oxygen saturation [85]. Careful control of the oxygen supply to nitrification is therefore essential. The greatest oxygen consumption in nitrifying bioreactors was found for the ammonia-oxidizing bacteria (37–53%), followed by the nitrite-oxidizing bacteria (28–37%) [86]. The remaining oxygen consumption was caused by the heterotrophic microbiome (3–8%). Such a partitioning of oxygen consumption occurs under well-controlled operating conditions, but it can change very quickly when the organic carbon load of the nitrifying bioreactor increases due to a higher loading of the process water.
The process water pH impacts nitrification. An acceptable range for nitrification can be between pH 7 and 9 based on data available from the literature [79]. However, results from experiments in the marine environment [87] showed a different picture. Nitrification rates were 50% lower at pH 7 and 90% lower at pH 6.5 than in seawater at pH 8. At pH 6, nitrification was completely inhibited. Therefore, the origin of the nitrifying biome seems to be important. However, this aspect is beyond the scope of this review, but it must be considered when operating a RAS.
Bacterial nitrification depends on the substrate concentration. It generally follows a Monod equation with r = nitrification rate = ( r m a x · c ) / ( c s + c ) with c = the concentration of the substrate, e.g., TAN concentration, and c s = the substrate concentration at r r m a x = 0.5 . The Monod equation shows a substrate-dependent and a substrate-independent concentration range for the nitrification rate. The half-order kinetic describes the range of substrate dependency where the nitrification rate r is increasing along with increasing TAN concentrations ( r = a + b · c 0.5 ) [88]. Above a certain TAN concentration, the nitrification rate does not further increase. This concentration rate is described by the so-called zero-order kinetic where the nitrification rate is constant ( r = c o n s t ). There are countless scientific publications with results on conversion rates in a nitrifying bioreactor. These cannot be meaningfully summarized. In each RAS, the nitrifying microbiome finds different conditions and will develop differently, and it is also based on the initial bacterial populations.
In a commercial RAS for sea bream (Sparus aurata) and seabass (Dicentrarchus labrax), the critical TAN concentration for the transition from half-order to zero-order kinetics was determined at 3.5 g   m 3 [88]. Beyond this concentration the nitrification rate remains constant regardless of further increasing TAN concentrations and TAN is possibly not sufficiently converted into nitrate. The conversion rate of ammonia/ammonium nitrogen (TAN) at higher TAN concentrations (zero order kinetic) depends on the biomass of the nitrifying microbiome, i.e., on the actively nitrifying biofilm area in the bioreactor. Under this condition, the surface area of the biocarriers must be large enough that a complete conversion of the excreted nitrogen is possible. The engineering must take this into account in order to find a functional solution that ensures complete nitrification at any possible TAN concentration in the RAS process water. The role of nitrification in RASs is, as already written above, the conversion of ammonia/ammonium into nitrite and finally into nitrate, which is the lowest toxic compound. This is a decisive biological process in RASs and in nature, where nitrification significantly governs the biogeochemical nitrogen cycle [89].
Nitrification bioreactors must be designed to maintain high nitrifying bacteria biomass at low heterotrophic biomass. The heterotroph guild of bacteria on nitrifying bioreactors in RASs is governed by the carbon feed regardless of whether it is in the form of particulate or dissolved mater [79,90,91]. The heterotrophic guild must be kept on low biomass to ensure autotrophic nitrification at a high rate. Recent investigations again underline that the organic carbon to ammonia nitrogen ratio in the process water (C:N) feeds the competition between nitrifying and heterotrophic bacteria for oxygen and surface area that can be colonized [92]. Thus, to ensure and endure the nitrification process, the upstream processes removing particles and dissolved organic matter, i.e., the screen filtration and foam flotation, are pivotal to the functionality of the nitrification process in a RAS.
To make matters worse, in areas with heterotrophic bacterial biomass, the aerobic biology in nitrifying bioreactors can be partially replaced by an anaerobic process, denitrification. This can be made even worse if hydrogen sulfide (H2S) is formed in biofilters [93] by an unintended microbiome in the anoxic organic matrix. In industrial biotechnology, this would definitely be avoided by a technical upgrade to the bioreactor and alterations in the operational mode. This is definitely the solution for RASs to avoid fish deaths from hydrogen sulfide poisoning, which are now increasingly reported.
It seems difficult to detect harmful H2S through fish behavior, as the physiology of the fish is already significantly impaired by the time the toxic gas is detected by the fish [16]. Atlantic salmon (Salmo salar) can detect H2S at 0.010 g   m 3 . This is close to the effective H2S concentration (0.005 g   m 3 ) causing physiological alterations in Atlantic salmon (Salmo salar) [18]. The fish responded with increased swimming speed, irregular swimming patterns, and loss of schooling behavior. From a biologist’s point of view, this shows how severe the effects on the fish were. The detection level was not sufficiently low to detect possible emerging subacute poisoning in time. Consideration should be given to enhancing engineering and operation so that no H2S is formed.
Nitrification is one of two biological processes in process water treatment in RASs. Nitrification consumes alkalinity [94], resulting in a pH drop in the RAS process water, which affects fish physiology (growth, reproduction, behavior, and survival) [95] and biochemistry (blood oxygen transport) [96]. In contrast, the denitrification process generates alkalinity [94,97]. This can minimize the otherwise necessary alkalinity supplement in RASs. Therefore, coupling these two processes is logical and reasonable, especially in RASs with minimal water consumption.

2.6. Denitrifying Bioreactor

The denitrification process is a treatment step in RASs that is carried out in a side-stream bioreactor. This bioprocess must be included if the RAS aquaculture is to be environmentally friendly and sustainable. A RAS, especially when used in industrial-scale production, is a point source of particulate and dissolved waste. Dissolved nitrogen is a significant part of the load in RAS effluents. If released into the environment, it is causing a cascade of negative impacts on ecosystem function. In this respect, a RAS that has not implemented a denitrification process must be considered a similar threat to ecosystems [98] as industrial livestock farming.
Even if most of the fixed nitrogen in the ocean is in the oxidized form of nitrate [99], the concentrations are low, as nitrate is assimilated by primary producers of the food web. An extensive analysis of ocean data comprising ocean depth down to 1000 m, a temperature range from −5 to 35 ° C , and salinities from 28 to 38 psu showed that high levels of nitrate are between 2 and 3 g   m 3 , corresponding to a concentration of 0.5–0.7 g   m 3 nitrate nitrogen [100]. Most of the ocean surface carries nitrate-nitrogen concentrations as low as 0.08 g   m 3 [101]. From a fish biologist’s point of view, the nitrate concentration in the oceans must be considered completely tolerable for fish and thus represents a guideline for the operation of RAS. This would also comply with the requirements of environmental protection as the discharged RAS process water would not carry an excessive inorganic nitrogen load.
It becomes difficult if the low concentrations in the seas are used as a criterion for the process water in a RAS, where nitrate nitrogen may reach concentrations in excess of 100 g   m 3 . In a 42-day-lasting experiment with turbot (Psetta maxima), a significant negative effect of nitrate on growth (specific growth rate, SGR) was observed at nitrate-nitrogen concentrations of ≥125 g   m 3 . Effects on health and feed conversion ratio (FCR) were prominent at ≥250 g   m 3 nitrate-nitrogen concentrations [102]. In the same study, the share of methemoglobin in the blood that is meant to be one physiological pathway of nitrate toxicity was determined. The share of methemoglobin remained on 18–20% in all tested groups of fish that were exposed to 0, 125, 250, and 500 g   m 3 nitrate-nitrogen concentration. An effect on methemoglobin was described for Bidyanus bidyanus in freshwater after an exposure of 21 days [103]. The share of methemoglobin in the blood increased from 4 to 21 and 34% at 0, 50, and 100 g   m 3 nitrate-nitrogen concentration, respectively. Dissolved nitrate can impair oxygen transport in fish.
In a ten-week-lasting experiment with European seabass (Dicentrarchus labrax), an effect of increasing nitrate concentration (13, 123, 243, an 501 g   m 3 NO3-N) was suspected above 243 g   m 3 , as hepato-somatic index (HSI) and daily feed intake (DFI) were negatively correlated with increasing nitrate levels. The LC50, 96h for nitrate-nitrogen (NO3-N) tested for different fish species is above 500 g   m 3 and may reach 3000 g   m 3 in very tolerant species [104].
The experimental results show that considerably higher concentrations are tolerable if no other stressors are added. From an environmental perspective, nitrate concentrations (NO3-N) of less than a gram per cubic meter are tolerable in the process of water discharge (wastewater). Assuming a RAS production at a stocking density of 50 k g   m 3 and a feeding rate of 1% body weight per day, the amount of feed administered to the fish daily in one cubic meter of water would be 500 g. At a protein content of 50%, 250 g of protein would be fed in one day. The ammonia excretion rate can be assumed to be 10% of the feed protein [105]. Thus, 25 g of nitrogen would be excreted in the form of ammonia in one day, resulting in a concentration of 25 g   m 3 in the holding volume for the fish. Assuming that an additional amount of water of 25% is necessary for water treatment in RASs, the 25 g of nitrogen would be diluted in 1.25 m 3 . The increase in concentration after one day would be 20 g   m 3 in the RAS process water. From this very simplified calculation, it can be concluded that a critical nitrate-nitrogen concentration in the process water of RASs would be reached within two weeks. The impact on the environment through the discharge of process water would also not be tolerable amid the eutrophication of aquatic ecosystems. Therefore, it seems essential to implement a sink for inorganic nitrogen in the form of a denitrification bioreactor.
In denitrification bioreactors, several microbial pathways can be involved to remove nitrogen from process water. A common pathway is heterotrophic denitrification using, for example, methanol as an organic substrate, which was investigated in an early laboratory experiment in a columnar bioreactor filled with limestone granules [106]. The conclusion was that this type of packed bed denitrification is not self-regulating like the autotrophic nitrification process. Since fluctuations in nitrate levels are expected in RASs, stabilization of the C:N ratio is essential and may require a monitoring system coupled with automatic substrate dosing. In another laboratory experiment, researchers had an optimistic view on this particular process and concluded that low nitrate concentration <1 g   m 3 can be maintained in closed aquaculture systems by a columnar denitrification bioreactor using ethanol as a carbon source [107]. Although they point out problems with bacterial growth leading to clogging of the biocarrier packing (brick granules), the process would fit perfectly with the concept of sustainable RAS aquaculture. The problem with clogging of denitrification bioreactors was solved by using fluidized bed technology and a blower that recirculates the gas from the headspace [108]. Unfortunately, details about the engineering were not given. Many problems with denitrification do not seem to have been adequately addressed in commercial RASs to date. A recent study summarized several problems of heterotrophic denitrification. One is an incomplete denitrification process and the release of toxic nitrite as a byproduct due to insufficient carbon supply. Another is the wastage of carbon sources that exceeds metabolic needs [109].
A more recent study describes in detail the Moving Bed Biofilm Reactor (MBBR) for denitrification in RAS [110]. The biocarriers were continuously moved using a centrifugal pump and a discrete cleaning process with pressurized gas from the headspace of the bioreactor prevented clogging by shearing off the bacterial biomass. The process control was based on an extensive set of sensors coupled with computer-aided automation. Three months of operation showed that manually adjusted pulsed carbon feed, either by acetate or glycerol, in conjunction with an ORP (oxidation-reduction potential) controlled process water feed worked quite well. The nitrate-nitrogen concentration in the RAS process water decreased linearly from 176 to 35 g   m 3 . However, the researcher still mentioned the poor manual adjustment of the C:N ratio. A new publication presents a solution to this problem [40]. Based on the process scheme in Figure 1, a virtual sensor was discovered that can detect nitrite in the wastewater of an incomplete denitrification process. This requires a coupling of denitrifying bioreactor and foam flotation that is shown in Figure 1. The effluent from the denitrification bioreactor is mixed into the process water flow towards the flotation so that microbial biomass, as well as dissolved organic carbon, is removed. This may also include the removal of traces of (H2S). It seems that the growing demand for sustainable RASs has stimulated the refinement of the biotechnology of denitrification bioreactors in RASs. It is now necessary to implement the technology to avoid nitrogenous waste discharge.
In heterotrophic denitrification bioreactors, anaerobic denitrifying bacteria coexist with anaerobic ammonia oxidizers (anammox) [111]. The anammox pathway, NH4+ + NO2→ N2 + H2O would require ammonium [112] and nitrite in considerable concentrations in the bioreactor to allow a significant contribution to the nitrate removal process. Nitrite can be formed by an incomplete denitrification process [109], reaching considerable concentrations [40]. It theoretically can reach the nitrate-nitrogen concentration of the inflowing process water. Ammonia may occasionally occur in disturbed denitrification bioreactors in moderate concentrations [110], but likely not high enough for the anammox stoichiometry. In a well-operated heterotrophic denitrifying bioreactor, ammonium and nitrite concentration will be minimal.
Heterotrophic denitrification must be implemented as a stable singular process [110] that allows careful control and avoids the formation of undesirable byproducts. From this point of view, anammox must be considered as a randomly occurring process. The potential contribution of anammox to nitrogen removal is probably small, but it can reach 10–20% of the total nitrogen removal in a denitrification bioreactor installed in a dedicated process chain [113].
A promising approach is the use of internal carbon sources of a RAS for denitrification [113,114]. Experimental investigations on the use of internal carbon sources were carried out within a RAS loop and as end-of-pipe treatment of RAS wastewater. In the first case, the internal RAS loop was connected to a biogas fermentation via the denitrification bioreactor [113]. The denitrification was fed with process water from nitrification and the backwash water from the solid filter upstream to the nitrification. An upflow anaerobic sludge blanket reactor (UASB) was connected to the settler downstream of the denitrification bioreactor. A total of 12% of the process energy was recovered through the biogas fermentation, and 95% of the excreted nitrogen was removed through the denitrification processes. The complexity of the RAS was higher, but the reuse of internal sources suggests much better sustainability. The nitrate-nitrogen concentration in the process water was maintained at about 20 g   m 3 , which is far below the concentration in many commercial RAS. The effluent contained 4% of the feed nitrogen, which represents a significant reduction in pollution potential compared with a conventional RAS without a denitrification process. It would be desirable for the industry to apply such results to achieve better sustainability. Eutrophication by aquaculture and mariculture must be reckoned as a profound detrimental impact on ecosystems [98].
Global change, population growth, industrialization, and agri- and aquaculture business are likely to further worsen conditions in estuaries and coastal waters through eutrophication [115]. The consequences of eutrophication are dense, potentially harmful algal blooms deteriorating water quality, fostering the loss of habitats and natural resources. Oxygen depletion in estuaries and coastal waters will further exacerbate the impacts on living resources. RAS aquaculture may be a part in this pollution scenario, as the volume of discharged water multiplied by pollutant concentration represents the burden on the environment. Unfortunately, waste quantities and discharge by RASs are rarely mentioned, but they are a critical aspect that has long been known.
An end-of-pipe treatment of RAS wastewater was investigated using a fed-batch denitrification bioreactor process [114]. The achievable denitrification rate was dependent on the carbon source, with acetate achieving the highest efficiency. Propionate and ethanol were less efficient. The lowest rates were achieved with organic fish waste either in raw form or prefermented. The internal carbon source, i.e., organic fish waste, proved to be a suitable substrate. A limitation was the amount of excess COD in the wastewater caused by an insufficiently matched carbon supply. The COD:NO3-N ratio was calculated from stoichiometry. However, it must be noted that the end-of-pipe treatment does not maintain the desired low nitrate-nitrogen concentrations in the process water of RASs, which should be mandatory in RAS fish production.

2.7. Degassing, Aeration, and Oxygenation

Carbon dioxide removal (degassing) and oxygenation of process water are central processes in RASs. Carbon dioxide is a determining environmental factor that interacts with the respiratory physiology of fish. The effect of elevated carbon dioxide on fish physiology has recently been studied in the context of climate change [116]. The study investigated the effect of an increased partial pressure of CO2 (1694 µatm), which corresponds to about 2.8 g   m 3 , calculated using the saturation concentration [77]. The carbon dioxide concentration was moderately elevated compared with the potential concentrations expected under aquaculture conditions [117]. Nevertheless, the researchers describe a potential impact on the allosteric load of marine fish, compromising the ability to cope with additional stressors. Thus, a slight increase in carbon dioxide concentration may have a profound effect on the long-term resilience of fish under aquaculture.
The effects of increasing carbon dioxide concentrations (4.5, 25.8, and 41.6 g   m 3 ) on metabolism and growth were investigated in turbot (Scophthalmus maxmus) [117]. The weight gain decreased significantly by 25% and 60% in the fish groups exposed to 25.8 and 41.6 g   m 3 CO2 compared with the fish group exposed to 4.5 g   m 3 CO2. This is an indicator that growth retardation must be expected if carbon dioxide is not desorbed from the RAS process water. Another study sees the limit for dissolved carbon dioxide concentration in juvenile turbot at 9–10 g   m 3 [20]. The CO2 threshold for Atlantik salmon post-smolt was determined at 12 g   m 3 [118]. Above the threshold concentration, the growth was significantly lower, and skin damage became obvious. Fish body weight at the end of the 18-week experiment decreased from above 400 g at 5 and 12 g   m 3 CO2 concentration to below 300 g in fish exposed to 19–40 g   m 3 CO2. Elevated CO2 concentration around 10 g   m 3 may contribute to the occurrence of nephrocalcinosis in fish exposed for 6 weeks [119]. The oxygen consumption of Atlantik salmon Salmo salar decreased significantly at increasing dissolved CO2 concentrations beyond 28 g   m 3 [120]. The high CO2 concentration resulted in a low pH of 6.75. Low pH affects the respiratory physiology of fish by changing the affinity of hemoglobin, which potentially hinders oxygen uptake. Elevated CO2 concentrations could, therefore, affect energy metabolism in fish. Looking at the data, the CO2 concentration should not exceed 10 g   m 3 in RAS. As already mentioned above, low pH can also impair nitrification and denitrification processes in RAS raising the stress level for fish in a RAS. The severe impact on fish physiology and possibly of microbial processes of elevated CO2 levels by all means requires to control CO2 concentrations in RASs.
In RASs, carbon dioxide desorption takes place in various components, such as fluidized bed or trickle bed bioreactors, foam flotation, and all turbulent areas where carbon dioxide comes into contact with the atmosphere. This includes the production tanks. When the CO2 concentration exceeds the saturation concentration [77], CO2 is released into the atmosphere via the water surface as small gas bubbles.
A recent publication describes CO2 desorption in a commercial RAS in detail [119], providing essential insights into the implementation of the degassing process in RASs. The degasser was a drip tower filled with PE rings with a lattice structure that allowed high water and air flow. The removal efficiency of the degasser was 58%. In addition, the moving bed filter removed 14–27% of the CO2, even if an additional release of CO2 must be assumed from the biofilm. Data from an experiment lasting three months show that the pH gradually decreased from 7.5 to values below 7.0. The capacity of the degasser was not sufficient to remove the amount CO2 that would have been necessary. In two further experiments, the pH was maintained between 7.2 and 7.4 by adding NaOH. However, the question still is whether more than one degassing device could prevent pH drop in a RAS by more complete desorption of CO2, as this gadget is designed to desorb CO2 from the process water at a high efficiency.
Carbon dioxide desorption was investigated in a vertical degasser with a block-shaped grid structure and passive aeration [121]. The removal efficiency was 67 to 89% for one pass. Desorption was independent of salinity, and even forced aeration did not increase the efficiency. The CO2 concentration in the influent was positively correlated with the removal efficiency. With this device and the potential removal of carbon dioxide during passage through a moving bed or trickling filter bioreactor, additional airlift could ensure the necessary CO2 mass transfer (desorption). Airlift is used in RAS production tanks to create water currents and add oxygen to the process water. At the same time, they are able to remove CO2 with an efficiency of 10–40% [122]. The efficiency is related to the water flow rate, which in turn depends on the air flow in an airlift. Given these results, the removal of carbon dioxide that is potentially harmful to fish can be safely achieved by a series of coupled processes in the RAS.
Oxygen supply in RASs is achieved through aeration and gas transfer (O2). The dissolved oxygen (DO) concentration in water is the outmost important water quality parameter for aquatic life, as the availability of oxygen is limited in water. In a recent publication it is shown that salmon aquaculture at the coast of British Columbia is affected by reduced oxygen concentrations potentially impacting the growth and welfare of salmon in aquaculture. The results of the monitoring of 21 aquaculture sites classify 42, 57, and 1% of the hourly recorded oxygen concentration as optimal (DO > 7 g   m 3 ), suboptimal (4 < DO ≤ 7 g   m 3 ), and stressed (DO < 4 g   m 3 ). A 58% share of suboptimal dissolved oxygen concentrations provides arguments to relocate aquaculture on land in RAS. In fact, the task of RAS aquaculture would then be to maintain appropriate oxygen conditions in RAS.
Fish ecology is compromised by reduced oxygen levels [123], resulting in poor growth [124,125]. Salmon, like many other fish species, are able to cope with low dissolved oxygen conditions during short-term exposure and to recover from low oxygen stress after oxygen levels return to normal. Avoidance behavior [126], indicating incipient limiting oxygen conditions, occurs at intermediate oxygen conditions, between 60% and 70% oxygen concentration [127]. The critical oxygen saturation level for coho salmon Oncorhynchus kisutsch is below 30% dissolved oxygen concentration, which is similar for the Mediterranean seabream (Diplodus puntazzo) [128] and common dentex (Dentex dentex) [129]. The factor that finally determines the necessary oxygen flow into the RAS water by aeration or oxygenation is the concentration of dissolved oxygen below which a reduction in fish growth is to be expected [130]. The growth of European seabass (Dicentrarchus labrax) exposed to an average DO of 40% air saturation was 76% of that of the control (86% DO) [131]. Groups of juvenile seabass exposed to fluctuating oxygen conditions (40–86% air saturation) grew at intermediate rate not significantly from the growth at normoxic or hypoxic treatments. Fish may be capable of coping with reduced dissolved oxygen conditions in a well-controlled laboratory environment. This, however, might be different in RAS when many factors increase the level of stress.
Oxygen can be transferred using air (aeration) or pure oxygen (O2, oxygenation). Aeration takes place in many components in a RAS circulation. Oxygen is transferred in the moving bed or trickling bioreactors. The foam flotation transfers oxygen. Due to the height of the water column, the water will likely be oversaturated with atmospheric gases in the outlet. An increased partial pressure of atmospheric gases in the process water can cause health issues through gas bubble trauma [132,133]. Oversaturation, however, will be balanced in the degasser downstream to the foam flotation. Degassing and aeration/oxygenation are commonly coupled in one device (Figure 1) such as a low height packed column or a low head oxygenator [134]. Oxygen transfer can be enhanced through pipeline diffused aeration [135]. Oxygen is also supplied to the process water in a production tank when multiple jets distribute the inflowing process water at the water surface.
However, due to the stocking density of fish in RASs and the resulting high oxygen consumption, the oxygen mass flow with the inflowing process water will not be sufficient. Additional devices for the transfer of oxygen will be necessary (Figure 1, oxygenation). The oxygenation usually uses pure oxygen injected by various gadgets. This can be bubble-column-type aerators such as airlifts [136,137]. Fine bubble aeration through air diffusers [138] is used for continuous aeration in production tanks or as emergency devices distributing pure oxygen in case of a severe drop in DO. Oxygenation in a side stream to the production tank can be carried out with oxygen cones [139].

3. Discussion

In the previous chapter, the technical components of a marine RAS were presented. One focus was on the natural habitat of marine fish as a guideline for beneficial living conditions, and another on the transfer of the current state of knowledge into RAS technology. In conclusion, it can be said that it is possible to develop RAS technology in such a way that the natural limits of the biology and physiology of the fish are not exceeded. The technology is available, and the highly advanced state of knowledge allows the processes to be significantly improved if necessary. The interactions between components and processes are discussed below, since most problems in RAS operation are due to internal disturbances caused by the interplay of processes.
A RAS is a complex technology that is characterized by numerous interactions between the biological and the technical processes. In Figure 9, the interactions are shown as an overlay to the process diagram in Figure 1. However, the representation is not complete. It emphasizes the most obvious interactions that are mainly linked to process water flow rate, insufficient particle removal, and flows of matter.
The process water volume flow is of crucial importance for the production conditions in RASs. At low volume flow, the water in a production tank is only partially replaced (Figure 4) and dissolved and particulate inorganic and organic substances accumulate in the production tank water. The importance of the water volume flow can basically, although by no means completely, be illustrated by a quite simple stationary mass balance.
The mass balance is performed for a simplified RAS circuit (Figure 10A). Water flows between the production tank for the fish and the nitrifying bioreactor that converts the TAN to nitrate. Additional components such as particle filters are omitted since the calculations are only carried out for dissolved TAN. It is further assumed that a steady flow of process water is maintained in the nitrification bioreactor. The relative fraction of the excretion by the fish, which represents the load on the system, is shown in Figure 10B. The relative TAN excretion is presented as the hourly relative fraction based on measurements in a commercial RAS. For a 24-h day, the individual hourly fractions would sum to 1.0. In Figure 10C,D, the TAN conversion rate in the nitrification bioreactor is presented as relative and volumetric removal rate. Graph C shows that in the commercial RAS, a maximum TAN conversion rate was achieved at a TAN concentration of about 3 g   m 3 , which is consistent with the results from the literature [88]. For further calculations, the relative removal rate was set to a constant rate of 0.6 at TAN concentrations below 0.2 g   m 3 because few data were available for lower TAN concentrations. At high TAN concentrations above 4.8 g   m 3 , the relative TAN removal rate was set to 0.1 for the same reason (Figure 10C, dashed lines). The exchange rate of the tank water was calculated according to the process water volume flow (Figure 4) [19].
The results of the calculations performed for each hourly interval during a 4-day time period are presented in Figure 11. The calculations were performed for tank water volume flows of 1, 2, and 4 production tank volumes per hour. The following calculations were repeadetly carried out:
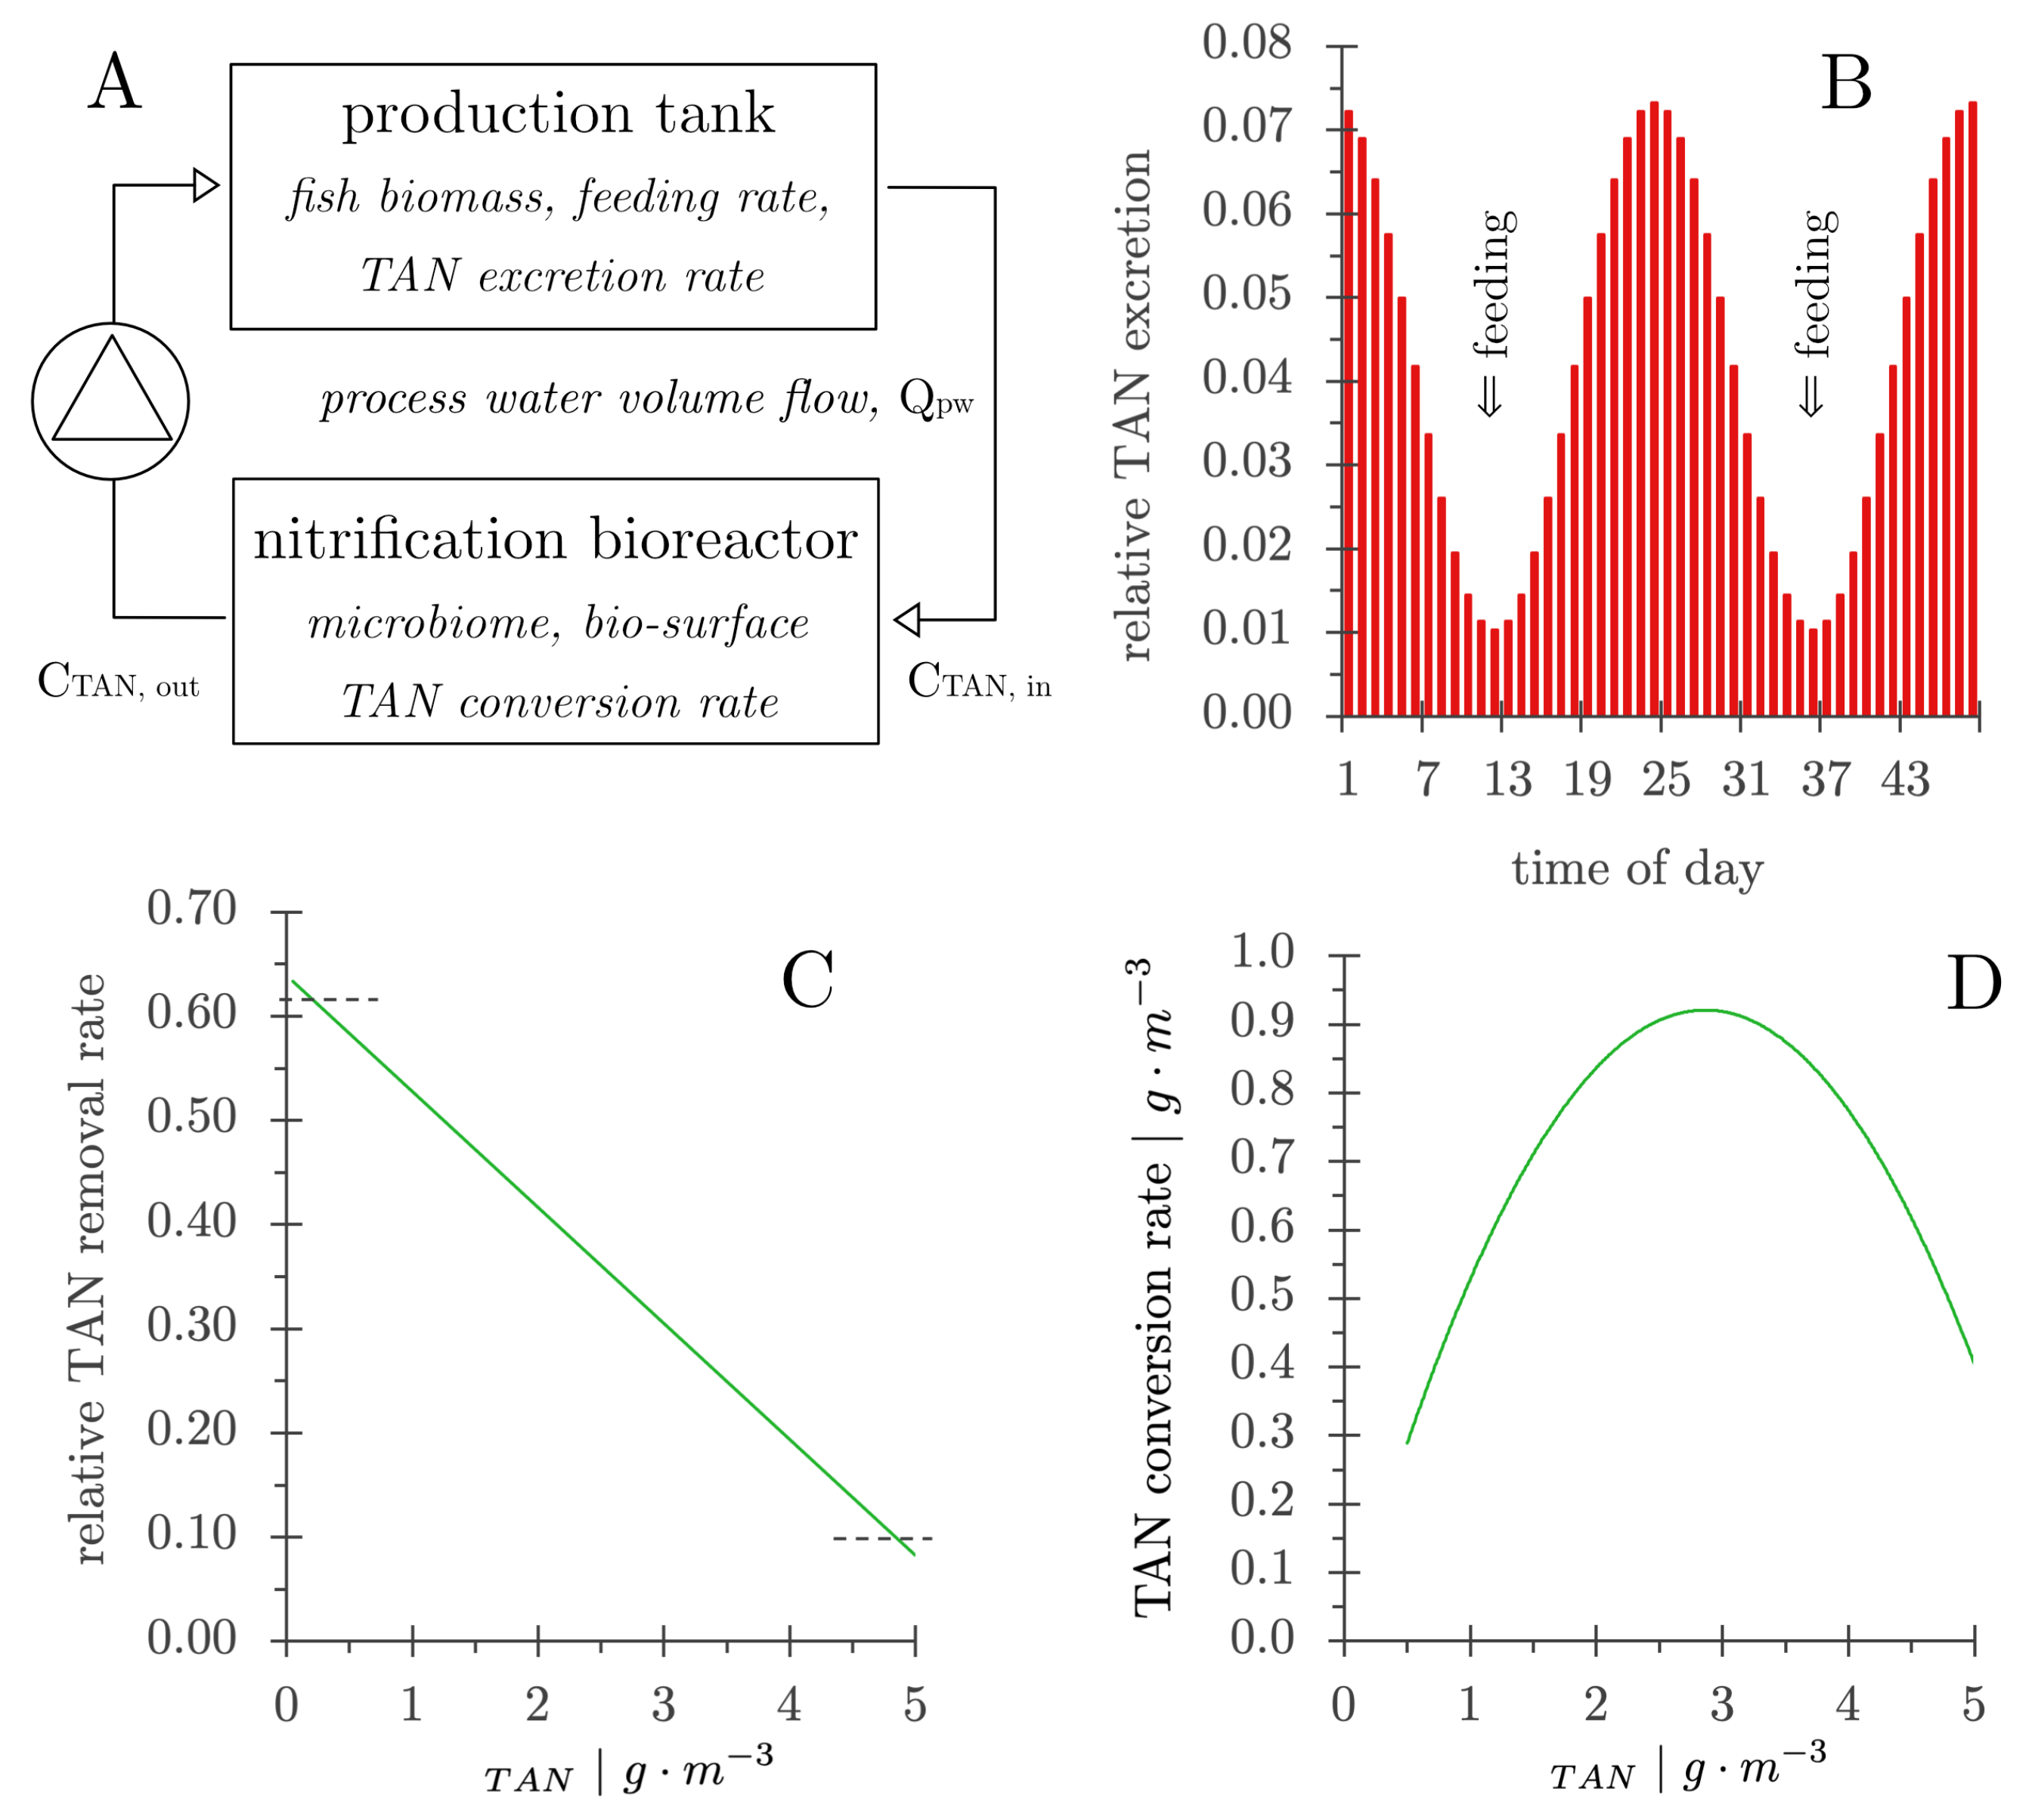
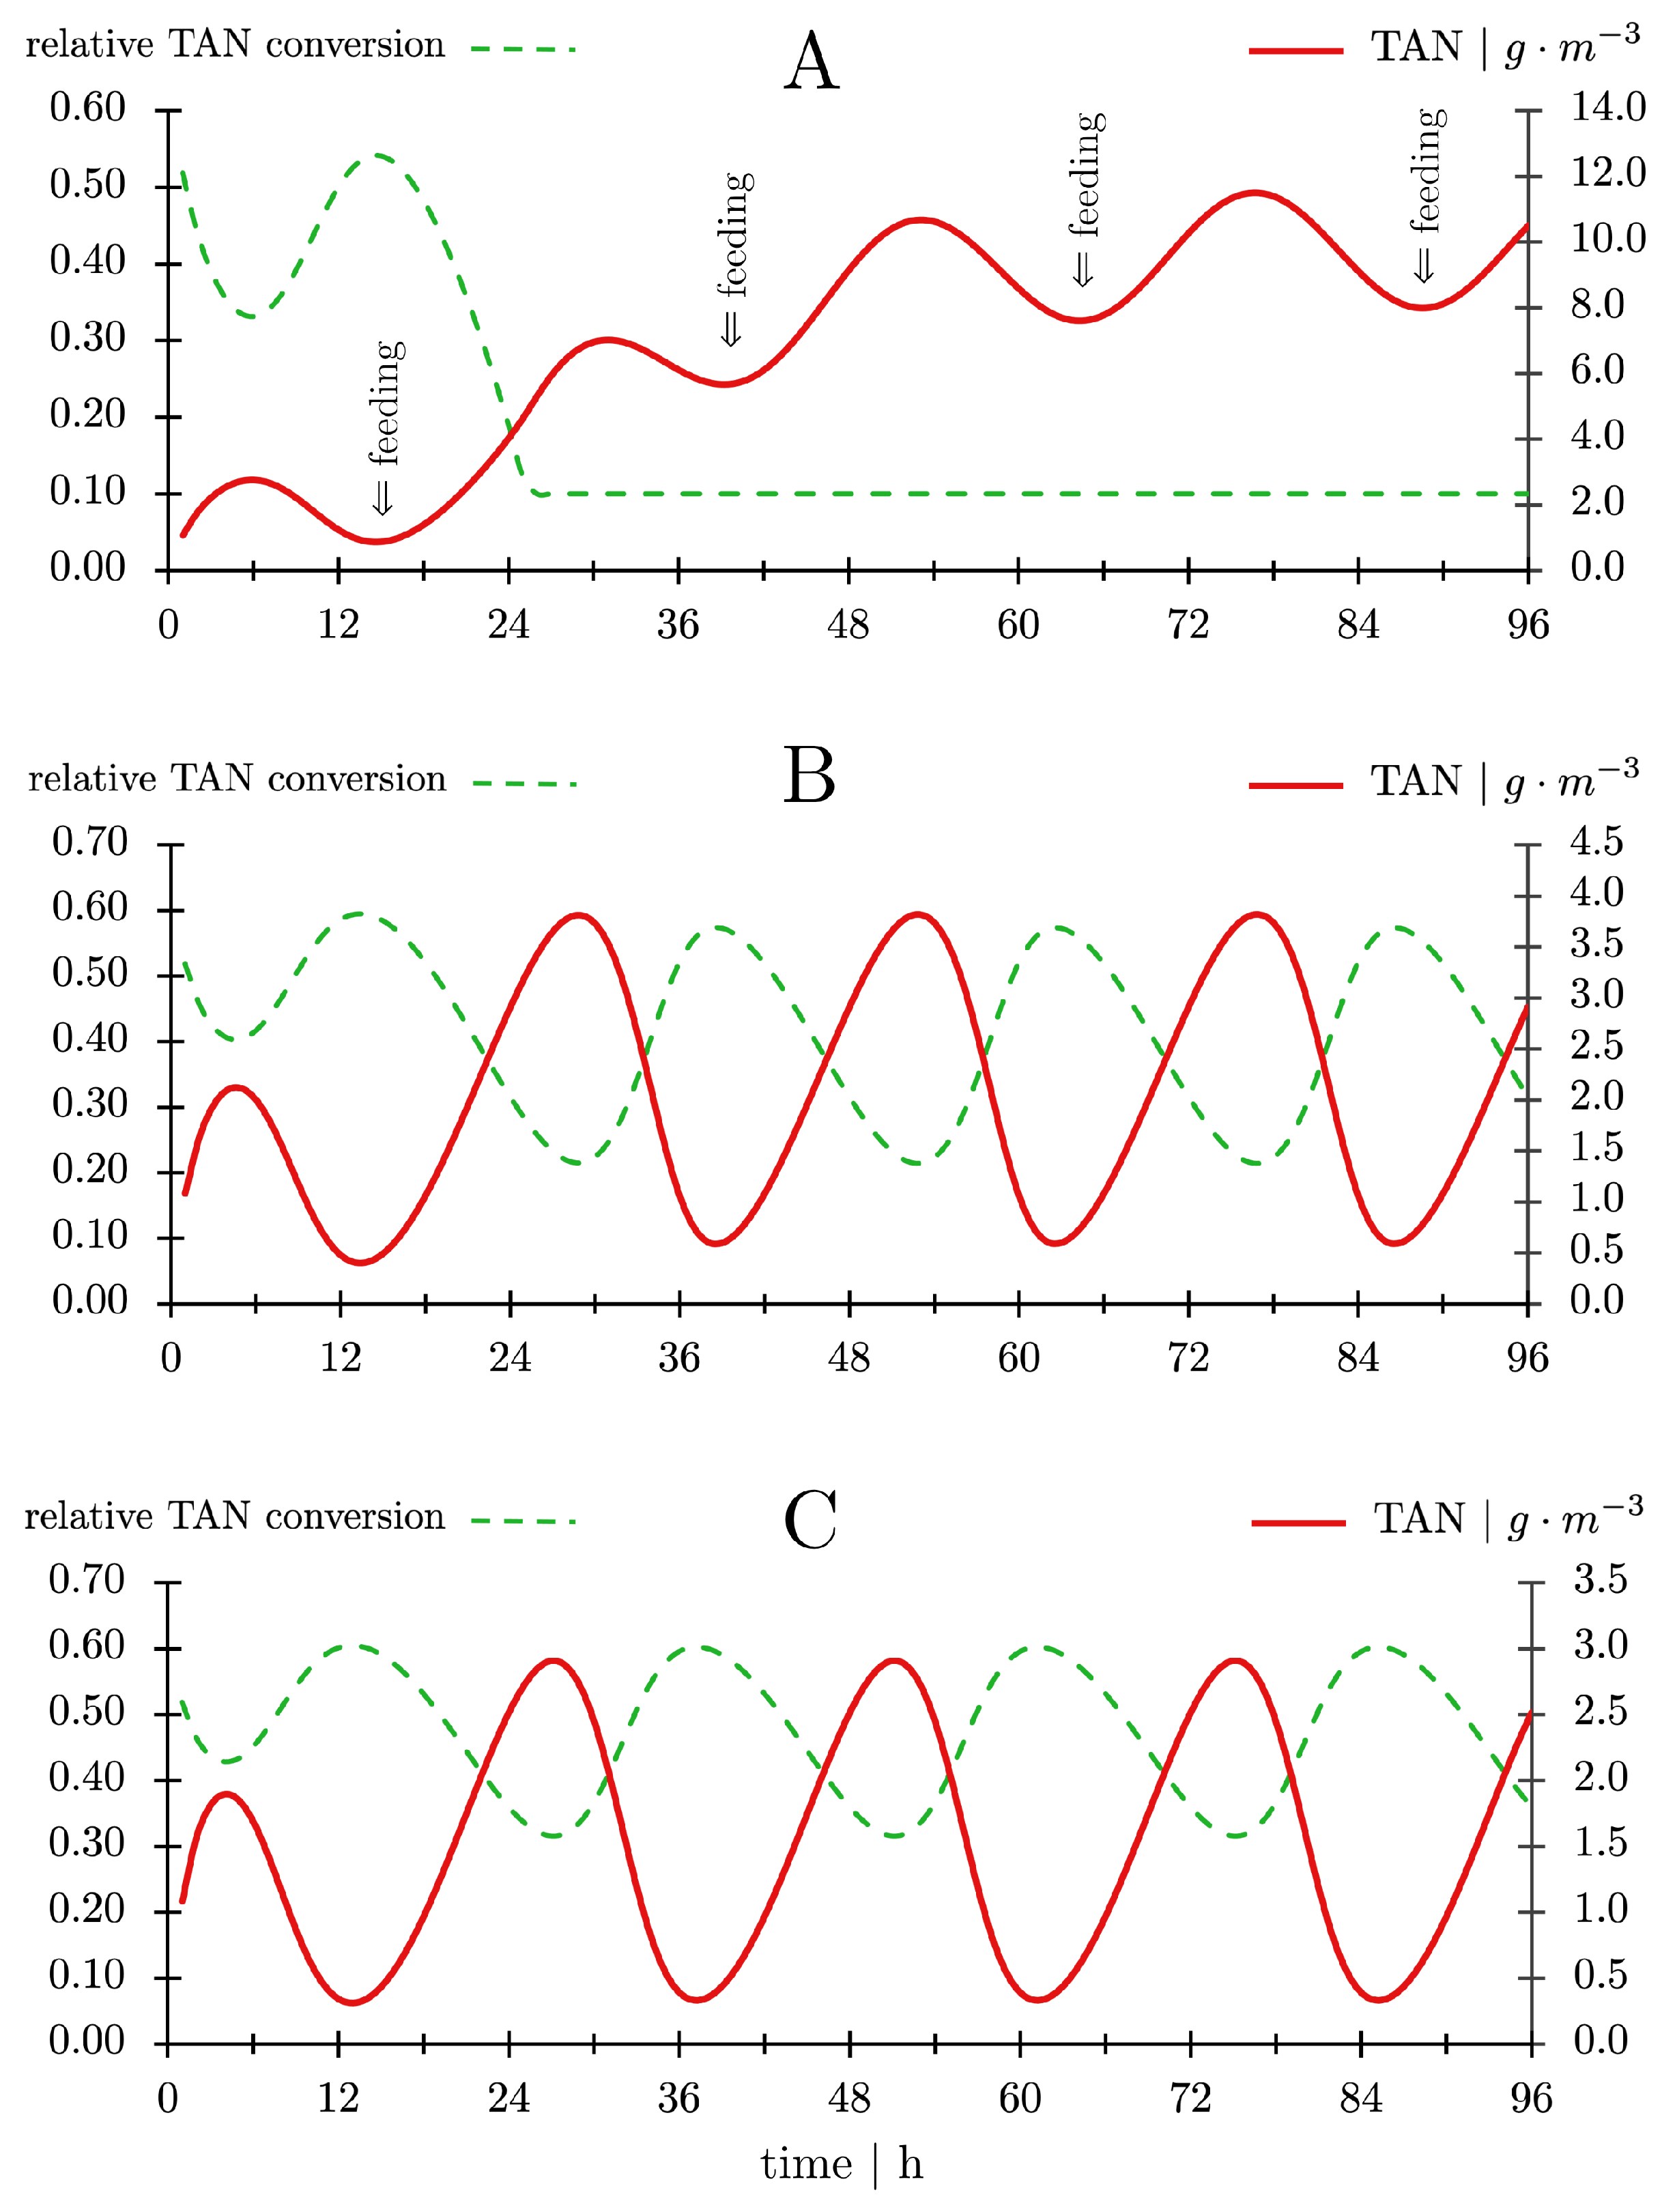
  • The TAN concentration in the production tank was calculated from the TAN concentration in the bioreactor effluent (CTAN,out) and the TAN excretion by the fish [105].
  • The TAN concentration in the influent to the nitrifying bioreactor (CTAN,in) was calculated from the TAN concentration in the production tank and the water exchange rate.
  • The TAN concentration in the nitrification bioreactor effluent (CTAN,out) was calculated after one pass through the nitrifying bioreactor using the rate of decrease in concentration as shown in Figure 10C.
The results in Figure 11, A indicate that a low water volume flow (Qpc) causing a low water replacement rate in the production tank would result in a high TAN concentration. This is caused by a low conversion rate in the nitrifying bioreactor. Even if the TAN conversion rate followed the increase and decrease in fishes nitrogen excretion during the first 24 h, the raising TAN concentration reduced the conversion rate to the minimum of 0.1. Thus, TAN concentration increased to a maximum of 11.5 g   m 3 during the 96 h simulation. Although these results are theoretical and could be better using a dynamic model, they point to the importance of process water flow in RASs. The TAN concentration can still remain within safe limits (Figure 8) if water temperature and pH were relatively low. However, this cannot be considered a sufficient operating condition, as the fish may already be reaching the limits of stress. In addition, the increasing particulate load in the production tank, the increasing concentration of carbon dioxide, and the possible decreasing dissolved oxygen content due to increased bacterial activity would [21] additionally stress the fish. These are critical changes in the living conditions for the fish in the production tank.
A different temporal progression is observed for higher water volume flows (Figure 11B,C). If the process water volume flow Qpw is increased to two and four times the water volume of the production tank, a recurring pattern results that is synchronized by feeding, i.e., the supply of nitrogen with the feed. The maximum TAN concentrations declines to 3.8 and 2.9 g   m 3 at flow rates of two and four times the production tank volume, respectively. Thus, the TAN concentrations remain within safe limits depending on the pH and the temperature of the production tank water (Figure 8). Similar findings are reported in the literature. In a freshwater RAS for pike perch Sander lucioperca, a high water exchange rate of 2.7 times the production tank volume per hour had a significant effect on water quality [140]. Another experimental RAS study showed that an increase in flow rate to 4.7 production tank volumes per hour resulted in a lower ammonia and carbon dioxide concentration and a better growth in turbot Scophthalmus maximus [20]. The steady-state mass balance, however incomplete, reflects these results well. Such assessments are of utmost importance to uncover interactions before starting a RAS design.
Looking at Figure 11, the question arises as to which management measures could help to improve the situation. An obvious solution is to reduce the fish biomass (stocking density) in the tank to reduce the loading of metabolic waste (excreta). A descriptive study on Atlantic Salmon (Salmo salar L.) post-smolt RAS production operated at stocking densities that were described as well below 75 k g   m 3 [119]. However, in another publication [141] the specific growth rate (SGR) significantly declined at stocking densities of 50 k g   m 3 and at stocking densities above. The feed conversion ratio (FCR) was lowest at a stocking density of 25 k g   m 3 . The FCR increased 20% at densities between 50 and 100 k g   m 3 . At 125 k g   m 3 the FCR was almost doubled. An investigation into the performance of Atlantic salmon (Salmo salar) in RAS suggested that stocking density might not exceed 30 k g   m 3 [142]. The authors concluded that RAS is relative closed system in which the accumulation is a critical factor increasing along with stocking density. It remains unclear whether this was probably related to the process water flow as suggested in Figure 11. Stocking densities are also reported for European seabass (Dicentrarchus labrax) [143]. The authors finally concluded that seabass can be produced in RAS at stocking densities of 70 k g   m 3 . Another Study on European seabass did not find an impact on feed intake, feed efficiency, an growth up to 60 k g   m 3 stocking density [144]. In any case, higher fish stocking densities require high process water exchange rates to maintain water quality in tanks (Figure 11).
Stocking density can be discussed from different viewpoints. From the biological point of view, the first signs of impact on fish must be considered as the capacity limit of the system. From a technical point of view, loss of fish would probably be seen as the first warning signal. The steady-state mass balance (Figure 11) suggests that stocking density is a crucial factor in RASs because of limits to water replacement in the tank. Production tanks operated at lower stocking densities are a good choice in the long term, avoiding damage to the fins and eyes of the fish [141]. Even if potential animal welfare problems may not be well acknowledged in RAS, reduced growth and fish losses can be cited as arguments for reconsidering the size, shape and process water flow requirements of production tanks. At the end the fish production proves a RAS to be functional. This is undoubtedly supported through an appreciation of the biology of fishes kept in an captive environment.
The stocking density in RASs must be interpreted differently depending on the tank geometry. Fish that are forced to swim against a current in a circular tank are not able to display routine behavior. Fish that can move freely in a tank (Figure 2 and Figure 3), on the other hand, show shoaling or schooling behavior. These are social aggregations [145]. In Figure 12, a school of young seabass swims along the tank wall in a small-scale experimental RAS. The water flow is high to ensure clear water in the production tank as common for fishes in their natural environment. This supports the synchronization of the swarm through optical recognition of conspecifics. The movements of the fish, which at this time form an extremely dense group, are synchronous and polarized according to their natural behavioral inventory. The stocking density within the school of fish was well above the RAS design criterion of 40 k g   m 3 calculated for fishes evenly distributed in the production tank. The fishes show the behavior as they would do in their natural environment. The distribution of fish in the production tank changes continuously and suddenly. Some tank areas are not used when the fishes are moving in a dense school. An overall low stress level can be assumed in fish building a school in a production tank. Compliance with animal welfare through fundamental ethological knowledge is also gaining attention in aquaculture net pens. It was found that a change from routine swimming in low currents to a swimming activity determined by stronger currents in the environment could cause considerable stress if fish are subjected to it long term [146].
A high process water flow through a production tank ensures that particles are removed and passed on to the filtration processes. If this is not the case, a number of interactions with other processes result, such as nitrification and gas transfer (Figure 9). Particles in RASs are surface areas for bacteria and foster bacterial activity. A study on particle surface area and bacterial activity in recirculating aquaculture revealed a strong, positive, linear correlation between the available particle surface area in an 8.5 m 3 RAS and bacterial activity [21]. It is therefore necessary to remove particles over the whole particle size range. In a RAS for rainbow trout (Oncorhynchus mykiss) operated with a drum filter, the accumulation of particles smaller than 15 μ m accounted for 98% of the particle load [25]. Small particles have a large specific surface that can be colonized by bacteria. In marine RASs, a foam flotation is capable of removing small particle fractions. The two-stage particle separation, consisting of a screen filter and a foam flotation [9], seems to have gradually become a technical standard in marine RASs, as foam flotation enables RASs to produce even delicate marine fish species, such as Seriola lalandi [147].
If the screen filtration as the first step of water treatment in a RAS does not remove the proportion of larger particles (>100 μ m ), the subsequent flotation process may be more or less hindered (Figure 9). The so-called ‘emergency overflow’ used in drum filtration also has harmful effects on the subsequent water treatment components, as large particles remain in the process water and can disrupt the nitrification process and impair degassing and oxygenation. Large particles can sediment and build up organic materials in dead spaces of the water treatment.
Particles can be inorganic substances or organic residues from fish feed or fish excreta, as well as bacteria. When particle surfaces are colonized by bacteria, they cause a lot of problems in RASs, as they can release compounds that impair taste or form toxic hydrogen sulfide (Figure 9). On the other hand, bacteria can be pathogens. The solution is to remove small particles, and with that bacteria, as completely as possible. A well-dimensioned foam flotation system treating part of the main process water flow in a side stream is a possible technology. The water volume flow in the side stream is still based on experience and needs to be confirmed.
An evaluation of protein skimmer performance, which is a common name used for foam flotation, concluded that foam flotation enhanced by a moderate addition of ozone controls bacterial activity and microparticles in commercial RASs [45]. It is emphasized that ozone merely improves the flotation process and must not be applied at doses harmful to fish (Figure 7). The foam flotation potentially reduces H2S formation and the off-flavor production through a reduction in particle and bacteria counts in the process water.
Off-flavors are typically caused by geosmin (GSM) and 2-methylisoborneol (MIB), which are lipophilic metabolic byproducts of the metabolism of bacteria (Figure 9). The lipophilic nature explains the quick accumulation in fish flesh. Off-flavor-forming bacteria are heterotrophic and facultatively anaerobic. Organically enriched process water in combination with aerobic or anoxic areas in a RAS are potential production sites of off-flavor compounds [28] (Figure 9).
GSM and MIB in fish products have a very low human detection limit in the range of 1–10 μ g   k g 1 [148]. GSM and MIB are rapidly taken up by the fish in RASs. The fishes become unsellable. The depuration process may last long (16 d) which also causes a considerable weight loss [28]. As depuration commonly uses flowing water (single pass), the concept of RASs having low water consumption is foiled. Depuration in RASs is possible using a considerable dose of hydrogen peroxide (H2O2) for disinfecting the system [149]. The gas transfer during depuration is minimal, and best practice seems to be to remove the aeration media from gas transfer devices. This, however, would limit the carrying capacity of a depuration RAS and would be an additional system to the production RAS. It is therefore logical to thoroughly remove particles and dissolved organic matter from RAS process water instead of using additional depuration systems after.
It is difficult to understand why the formation of hydrogen sulphide in RASs is not prevented by technical changes in the process scheme of RASs. Three factors play a major role (Figure 9): One factor is the particle load in RASs if there is insufficient filtration. The other factor is hydrodynamics, i.e., inadequate flow conditions in the production tank, pipe systems, and components, such as in the bioreactors (Figure 9). The third one is the available mass of sulfate available to bacteria for the formation of H2S [150].
It was shown that nano membrane filtration at the seawater inlet could reduce the sulfate concentration in the intake water of RASs by a factor of 15 [150]. H2S formation was reduced by a factor of three in the fixed bed biofilters. Since H2S is extremely toxic, it remains unclear whether this would have a positive effect on the survival rate in a RAS. The initial concentration was still 28 g   m 3 SO42−-S in the fixed-media reactors. The critical H2S concentration is between 0.001 g   m 3 [18] and 0.061 g   m 3 for Atlantic salmon (Salmo salar) [17]. Nano membrane filtration would increase energy consumption that is critically evaluated [151] in RASs. The authors conclude that an economical and ecologically sustainable RAS production requires, among others, a compromise between energy consumption and productivity. Another point of view could be that energy consumption is determined by the necessary technical processes in a RAS and is therefore an unchangeable quantity with the exception of all measures to increase energy efficiency. The question is, is a peculiar process necessary for the function of a RAS or not? It is conceivable that reliable clarification of the process water and the avoidance of hotspots in a RAS could have a similar effect.
The formation of H2S in aerobic nitrifying bioreactors (Figure 9) is a critical process interacting with fishes that must be avoided in any case. In a study on H2S production in the MBBR of a commercial RAS, it was found that H2S formation occurs when the biocarriers (biomedia) are not sufficiently kept in motion and/or the bioreactor fluid is not sufficiently oxygenated [93]. These are technical problems related to the design of the bioreactor that can be resolved through engineering. However, it seems that after installing a RAS, it is literally impossible to push for improvements. This could be related to business management that has no experience with the complex technology of a RAS. Unfortunately, this is not included in the long list of common mistakes in RAS farms [4].
Poor performance of the nitrifying bioreactor due to the formation of H2S would lead to another problem, as nitrification would be hindered in anaerobic zones of nitrifying bioreactors and beyond if H2S were formed. The conversion of each gram of TAN requires 4.2 g of oxygen. The total oxygen consumption in the bioreactor is higher because it also involves the metabolism of the heterotrophic bacterial guild [85]. A hotspot-forming H2S [93] would deprive the process water of oxygen and cause lower TAN conversion. An increase in TAN in the circulating process water must be expected (Figure 9).
The next impact of H2S formation affects the denitrification bioreactor, as no nitrate is supplied to the process. Ultimately, all bioreactors are affected, and the water quality can only be maintained at a probably low level by water exchange. However, this is a serious environmental burden, as toxic substances would also be carried away with the waste water.
If degassing fails to remove carbon dioxide from the process water, the pH of the process water drops to low values that still do not occur in the natural oceanic environment. In bastard halibut Paralichthys olivaceus, an increase in ambient CO2 concentration resulting in a decrease in seawater pH to 6.2 caused a drop in blood pH, which could be regulated by the fish to normal by an increase in hydrogen carbonate [152]. A higher arterial CO2 concentration served to maintain the gradient towards the ambient water. Even if the experiments were performed under extreme pH conditions, the impact of elevated CO2 concentrations on the physiology of fishes is obvious. At this point, we need to contemplate that the whole energy metabolism of fish could be negatively affected by elevated CO2, having a significant impact on RAS productivity, as revealed by several investigations into the impact of CO2 on growth in fish [117,118,120]. As gas transfer is a well-documented process and unit operation in process technology, it seems possible through enhanced engineering to maintain gas concentrations in the water according to the atmospheric partial pressures [77]. Investigations into the performance of a degasser in a brackish water pilot-scale RAS for post-smolt Atlantic salmon (Salmo salar) showed that CO2 concentration can be kept in safe limits [119].
As written above, the pH is a potentially governing factor on the nitrification process (Figure 9). Thus, an incomplete removal of CO2 can be expected to have an impact on the nitrification rate. However, in MBBR and trickling filters, gas transfer is an inherent process that can be expected to dampen the potential impact of an increased CO2 concentration. The conversion of every gram of TAN releases, with respect to the stoichiometry, 5.9 g of carbon dioxide. This amount, plus an elevated CO2 load in the process water, may eventually not be compensated by the internal gas transfer in the nitrification bioreactors. Gas transfer in a nitrifying bioreactor is a secondary effect of the bioreactor design, rather than being a strict design criterium.
However, it appears that the drop in pH caused by an elevated CO2 concentration is often seen as a circumstance that shifts the balance between ammonia and ammonium towards ammonium, thus having a positive effect on RAS operation. This would make it possible to operate the RAS circulation at a higher TAN concentration (Figure 8). However, there is a good reason for limiting the pH scale in the Figure, as the balance between H2S (gas), HS, and S2− shifts steeply towards higher H2S concentrations at pH values below 7 [153]. The toxic effect of H2S is that the gas easily passes through the gills of fish into the bloodstream and thus into the cells. In the cells, it disrupts energy metabolism. It would therefore be better to set a higher pH value to shift the equilibrium towards hydrosulfide (HS). Taking the risks linked to the concentrations of NH3 and H2S into account, it would be appropriate to keep the pH in the process water at a value that takes both equilibria into account, especially, if the formation of H2S is to be expected. To maintain pH around 7.5 would be the logical measure. However, a functional nitrification process is then needed to maintain low NH3 concentrations.
As indicated by the branched arrows in Figure 9, the water volume flow in pipes, channels, components, and production tanks has a significant impact on the water quality in RASs. Wherever the water velocity in the RAS is reduced, deposition of organic sediment can lead to the formation of H2S. This can cause major problems in extensive piping networks distributing the process water to individual production tanks. However, the risk can be minimized if particles are thoroughly removed by sieve filtration and foam flotation. Thus, once again, one can conclude that the most important RAS process is particle removal. This would prevent the leaching of organic matter in particles remaining in the process water.
Particles provide a surface for bacteria [21], while dissolved organic matter is an easily accessible energy source for floating bacteria and bacterial flocs. The result can be the formation of uncontrollable microbial build-ups in the process water and on almost any surface, affecting water quality and fish health. In many RASs, visibility in the production tanks is poor for this reason, making it difficult to observe the fish. However, this is extremely important because problems would be detectable at a very early stage through a change in behavior. This quasi-biological measure is often more sensitive than any measuring instrument. However, this is only possible if the fish are allowed to behave routinely and not forced into rigid behavior by stimuli (water flow).
Bacterial overload in RASs can lead to the production of flavor compounds. Geosmin production is positively correlated with high concentrations of organic matter [154], although the number of bacteria carrying the GeoA gene, which encodes geosmin synthase, can be extremely low in marine RASs. Phosphorus promotes GSM production in process water [155]. A functional denitrification bioreactor could likely reduce the production of flavor compounds in RASs because it removes nitrate and phosphorus in parallel. Denitrifying phosphorus-accumulating organisms (DNPAO) are gaining importance in water treatment because these organisms can combine phosphorus removal and denitrification in one process using organic substrates. Experiments have shown that the nitrate removal rate is strongly correlated with phosphorus uptake [156]. DNPAO have been identified at the genus level as Dechloromonas and Pseudomonas [157]. However, it remains unclear to what extent this process could be implemented and controlled in RAS. Another measure would be, for example, an electrochemical process [158], which would require further RAS components.
The simplest way to avoid off-flavors remains to reduce bacterial density and to remove dissolved organic carbon from the process water. Both are possible by a two-stage particle separation. A small RAS for regional marine fish production is shown in Figure 3. The seawater is clear, as shown in Figure 12. The fish are harvested from the tank and sold to the customer on demand. This would not be possible if off-flavors accumulate in the process water and affect the smell and taste of the fish. The same conditions are possible in large-scale RASs (Figure 2).
So far, it has been repeatedly shown that the production conditions in RASs can be technically controlled. Once the biological framework has been communicated, the basic operations of process engineering can be adapted and scaled. Technical processes require process energy Depending on the efficiency of the processes, a large part of this process energy is released as heat to the process water. The temperature of the process water therefore increases during the normal operation. This requires that heat must be continuously removed from the system to keep the water temperature within safe limits. This can be performed by various cooling systems. Further heat transfer occurs via the building. This must be resolved by through the structural design. Depending on the season and the preferred temperature range of the fish cooling and heating may be necessary.
The dimensioning of cooling (summer) and heating (winter) must follow the preferred temperature range of the fish species. This can be performed experimentally. For example, the preferred temperature range for European seabass Dicentrarchus labrax is 24–28 ° C [159]. Preferred temperature in juvenile turbot (Scophthalmus maximus) was determined between 16 and 19 ° C [160]. The optimal temperature range for Atlantic salmon Salmo salar can be inferred from the oceanic migration of the species [161]. Preferred temperature of individually tagged fish is mostly not exceeding 10 ° C in the northern migratory range. The upper limit for the preferred water temperatures seems to be below 15 ° C for salmon migrating in the southern migratory range. This information must be taken into account during planning and operation of RASs.
However, it is often neglected that the fish in a RAS also release heat to the process water [162]. The metabolic efficiency in fish is no more than 36%, which is probably low compared with technical components. The heat is lost via the fish’s body wall, fins, and gills. Heat transfer between fish and ambient water can be estimated from fish oxygen consumption, which is a proxy variable for metabolic effort. Conversion of oxygen consumption to heat loss in fish can be calculated by indirect calorimetry from metabolic efficiency (about 36%) using an oxycaloric conversion factor. The oxycaloric conversion factor for fish is about 19.7 k J   dm 3 oxygen [163]. Indirect calorimetry requires summing the total oxygen consumption of a fish according to its activity level and feed intake. In salmonids, heat transfer into the process water can result in a temperature rise in the range of 1 ° C in the process water in one 1 day. In fast-swimming and growing fish, such as yellowtail amberjack Seriola lalandi, the temperature rise would likely double. The heat transfer must be calculated before starting the RAS design and dimensioning the heat exchangers and cooling machine capacity.
In the RAS process scheme (Figure 1), two red boxes indicate the waste output of the RAS. Waste output is inevitable in any type of aquaculture, but it can be managed much better in a RAS. A RAS usually has very low water consumption, so the waste can be transferred to secondary processes. This makes RASs more sustainable, as pollution can be avoided. Pollution from aquaculture has been a focus of aquaculture science for decades [164]. However, change is still slow. If RAS aquaculture wants to claim to be sustainable, it must include the reuse of RAS-derived material. At its best, it is a fully integrated process for removing inorganic nutrients through the production of plant biomass [165]. An example of integration is the use of the organic sludge in biogas fermentation. For example, the small RAS shown in Figure 3 on a farm in northern Germany produces sea fish and feeds the organic sludge into the biogas plant to generate energy. The results of such coupling can be impressive [113]: In a RAS with almost zero water exchange, 12% of the process energy was recovered through biogas fermentation. A total of 95% of the excreted nitrogen was removed by the denitrification processes. This reduced the potential environmental impact of fish production to a minimum. It should be noted that the amount of waste in fish production is always the same. The difference between conventional systems and nonintegrated RASs with fully integrated RASs is that fully integrated RASs recycle organic and inorganic substances that would otherwise be released into the environment with the waste stream. Then, the statement [4] that a RAS is a revolutionary form of fish production and has no impact on the environment would come closer to the truth.
Experience shows that the design of commercial RASs must be critically questioned from the beginning in order to create the conditions for reliable production. Figure 13 shows two curves showing expectations and results. Additionally, two curves are drawn showing the possible growth of the fish in the net pen and in an experimental RAS.
At the beginning of a RAS project, the fish species to be produced is usually selected based on market data and market expectations. A biologist would then first search the literature for growth data of the fish species in order to be able to model the growth process and define the conditions required for maximum growth. This data is the basis for the subsequent design process. If this data is taken seriously, the RAS production process would deliver the expected fish biomass at the end of a production cycle. This seems to be a logical approach, but it is not necessarily applied.
In Figure 13, the blue curve represents the growth of the fish species in a net cage under the best possible environmental conditions. This growth can be considered optimal. The green curve is based on data from a RAS experiment. Here, the expectations are significantly dampened. In any case, a biologist would tend to take these data into account for the design of the RAS as the experimental RAS growth would still be within the economic range. The yellow curve in Figure 13 is the expected growth according to the developer of the commercial RAS. The expectation is significantly above the experimental RAS growth and only slightly below the growth curve for production in net cages in the natural, unaffected environment of the fish species. These two curves in Figure 13 could have been a warning signal if a critical evaluation had been made before the project started. The red curve in Figure 13 shows what was actually achieved during the operation of the RAS. The growth of the fish was hampered by a number of problems. These included insufficient process water volume flow and inadequate particle filtration. The lack of a valid growth model and the lack of growth monitoring led to overfeeding overloading the process water. Another factor was the water temperature outside the optimal range for the fish species. In the end, the product was spoiled by off-flavor. The reasons for the failure can be summarized as follows:
-
During the project planning, the fundamentals and feasibility were not sufficiently questioned. Independent opinions would probably have revealed the risks.
-
When the RAS was completed and put into operation, well-trained personnel with specialization in the operation of RASs should have taken over the system maintenance.
-
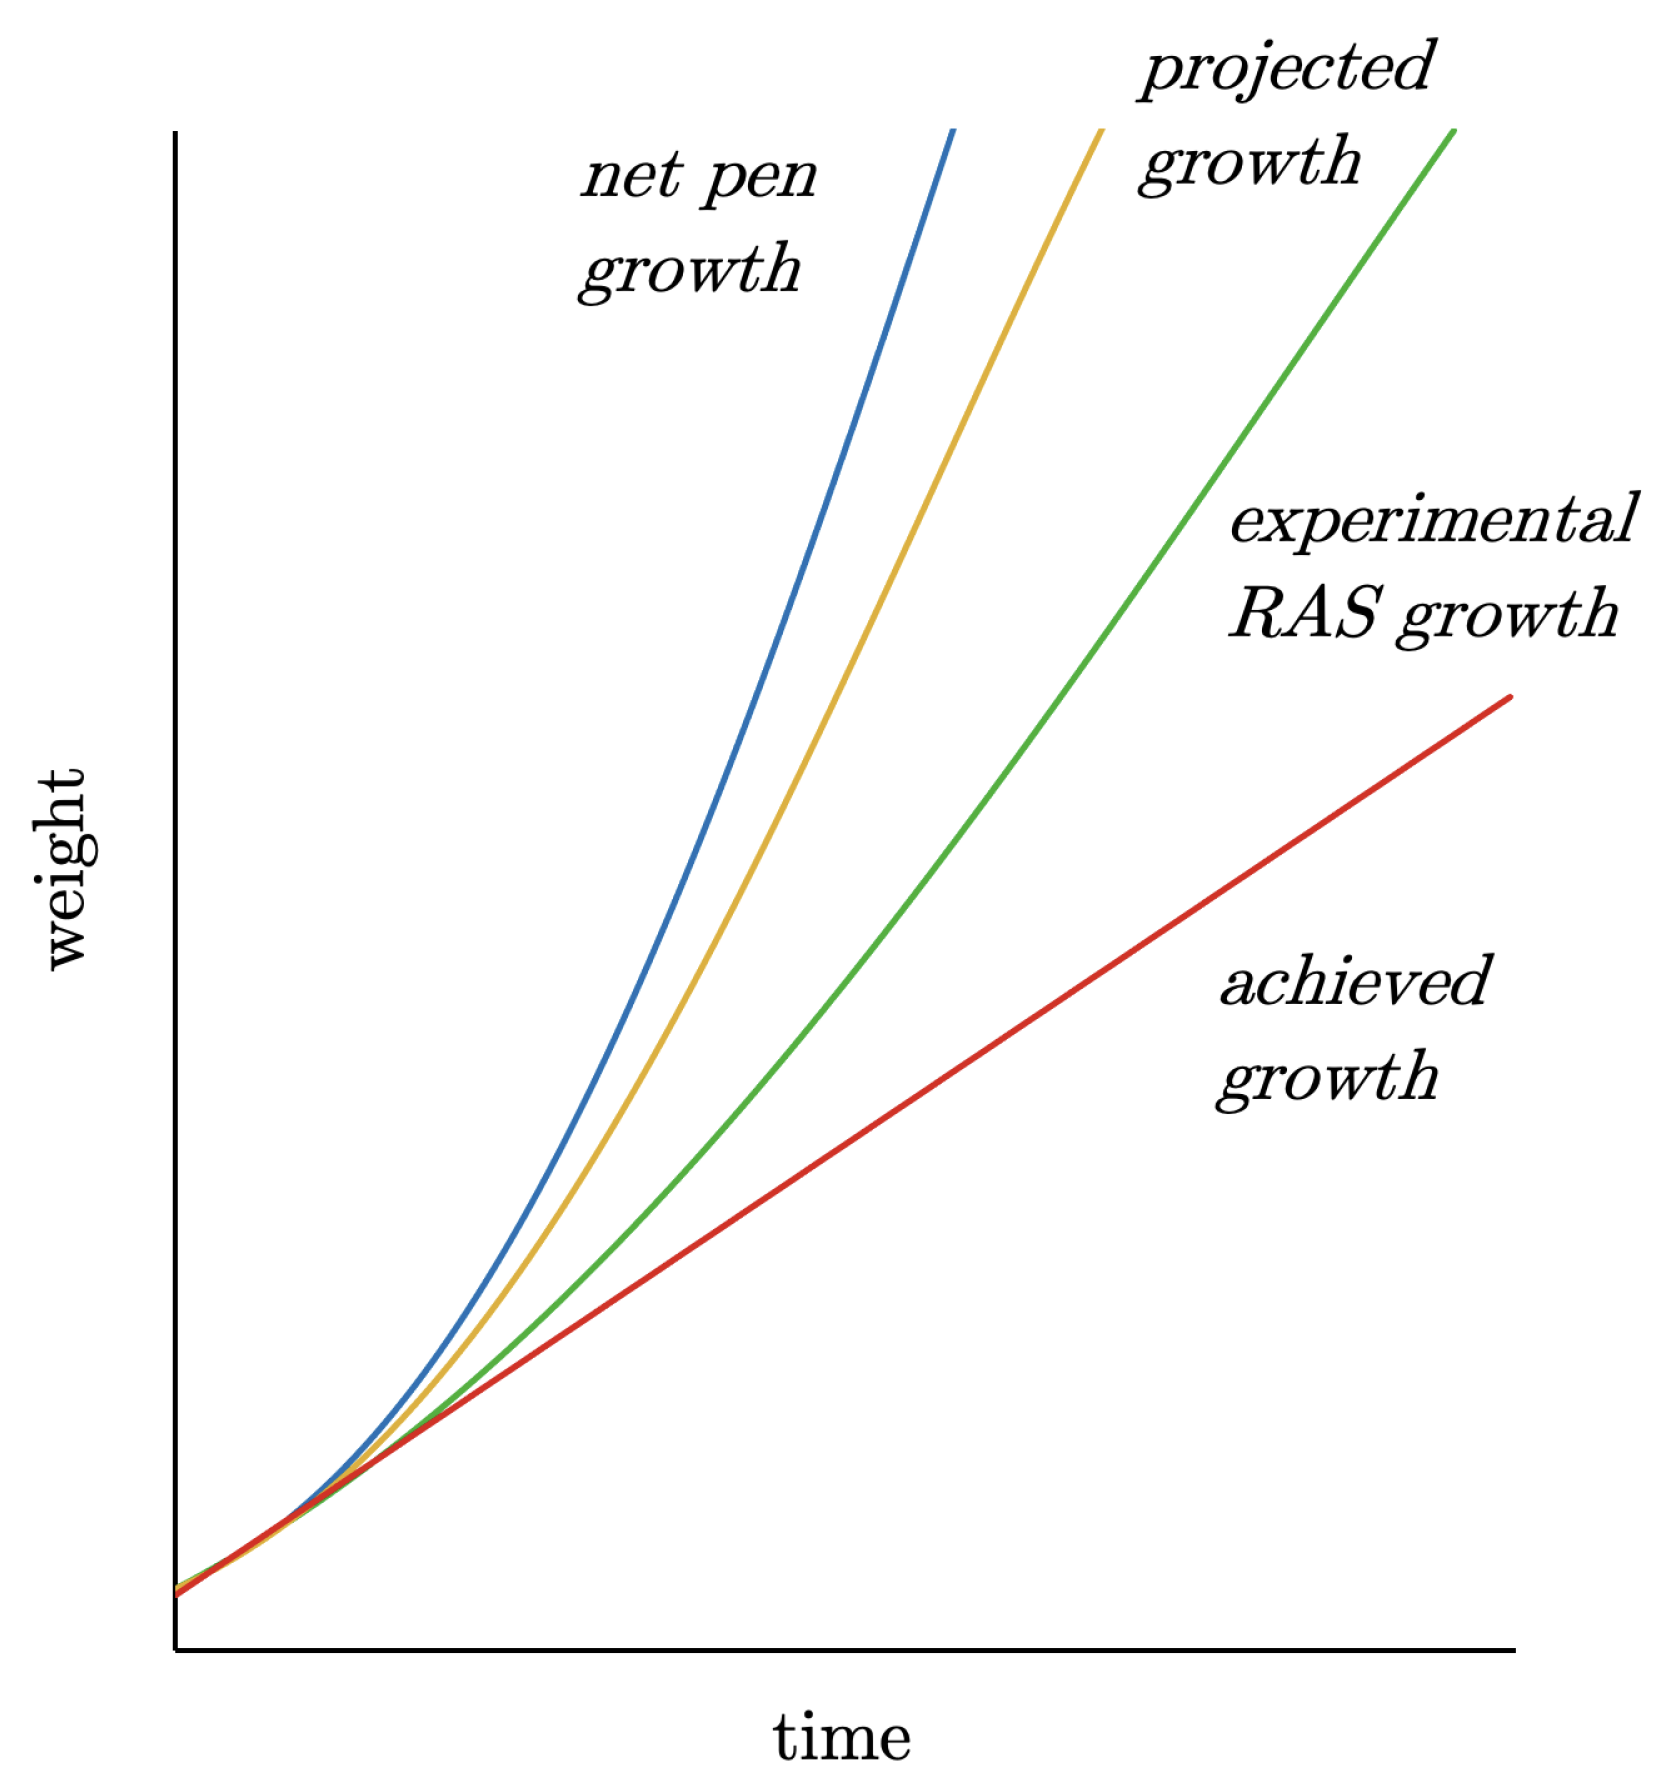
When the first problems arose on the farm, as can be seen in Figure 13 from the linear growth, measures should have been taken immediately. This would have included reducing the stocking density until the problems that were already emerging had been resolved.
-
The management should have worked cooperatively with the employees and experts to find solutions. Ultimately, management’s insistence on the manufacturer’s planning documents was the real cause of the problems.
A RAS is a complex process technology in which living creatures must be kept under living conditions that correspond to their biology. The fish in the RAS, a technical system, must be viewed as a subcomponent, as must the accompanying organisms, namely the bacteria in the bioreactors. Neither the fish nor the bacteria have sufficient plasticity to adapt to living conditions in a RAS that are not congruent to their natural habitats. A RAS production process only works if the technical processes support the biology of the organisms, i.e., the biology the fishes and the biology of the microbiome (Figure 1). This concept has been repeatedly justified here. The end result is a technology that is scientifically sound, accepted by business developers, and implemented in successful projects.
An improvement in RAS technology is only possible if the processes are strictly harmonized with each other and the operating states are continuously monitored during operation. Process automation plays a crucial role in this. An old but well-suited methodology is control statistics that can be implemented for all kind of variables of the RAS production process to detect deviations from normal. The methods are available in [167]. Variation within a stable process is inevitable by nature. Variations outside statistical limits of the stable process, however, need to be detected, evaluated, and corrected.
A simple extension to the data acquisition system, such as numerical software, could help to realize a better process control [168] and a continuous adaptation of automation algorithms. Routines of machine learning appear to be well suited to drawing conclusions on interactions from measured values and to adapting the automation algorithms or to discover interactions and new rules (see, for example, [40]). In contrast, pure theoretical modeling has sometimes weak ties to real-world RAS operation and seems less useful, but it may be an helpful tool for understanding interdependencies (Figure 11).
Continuous estimation of biomass in RASs could solve most of the problems associated with system overloads caused for example by overfeeding. Growth retardation can be detected on an early stage allowing to search for the cause and find solutions. Methods for estimating biomass include, for example, optical (near-infrared camera) [169] and acoustic (SONAR) technologies [170] combined with machine learning. Optical systems may require quite clear water conditions, even if several cameras deployed simultaneously in shrimp ponds achieved usable results [171]. Acoustic (SONAR) systems even work under adverse water conditions. However, these conditions are certainly unsuitable for responsible RAS production.
Optical or acoustic imaging are possible solutions to control and adjust the feeding rate during RAS operation. Feed is the determining (energy) resource in fish production and accounts for the main load to the process water (Figure 1). If feeding is safely controlled through the concept of model predictive automation, no systemic overload is to be expected during the production (growth) process.
In any case, applied research that makes the transfer of insights from fundamental research possible is needed to reveal obstacles, to refine the RAS process technology, and to achieve a stable and robust process control. The prerequisite, however, is the appreciation of the biology of the fishes and of the accompanying organisms, i.e., the microbiomes of the biofilters. The importance of considering the organisms in a RAS for the design of the technology cannot be emphasized enough. Failures in RAS production are mostly due to the disregard of fundamental biological relationships and rules.

4. Conclusions

RASs are the potential future of aquaculture production amid the irreversible damage caused by global change that is increasingly affecting natural productivity. However, this opportunity could be missed if productivity, sustainability, and environmental protection are not demonstrably achieved in RAS operations. A return to open-system aquaculture is by no means a solution to counteract the declining stability of ecosystems and their living natural resources.
Knowledge of the biology and physiology of fish enables an adapted, functioning process technology. However, the implementation in the RAS design seems to be too influenced by the prevailing standards of technology. Fish in RAS environments often seem to be considered as organisms with high plasticity. At the end, they are overloaded with stressors having a negative impact on production in RAS. Similar effects exist for the supporting microbiome participating in the microbial RAS processes.
RAS aquaculture still cannot claim to have achieved a broad level of sustainability. It is necessary to minimize the resource consumption of RAS production by improving the welfare and survival of fish. With every loss of fish, scarce resources such as water, energy, fish feed, oxygen and many other inputs are wasted. Reusing the by-products of production in coupled recycling processes would be another measure to achieve a higher level of sustainability.

5. Future Directions

RAS production is largely independent of the environment and could be used for various fish species worldwide. The technology needs to be introduced especially in areas affected by climate change, where this puts regional food supplies at risk.
Aquaculture in RAS can provide products on a regional and industrial scale. However, RAS production is not about size, but about responsible production that provides affordable and safe food. RAS are a way to contribute to food and protein supplies in a sustainable way. However, this requires responsible management.
Waste recycling in RAS needs to be solved. The possibilities to recycle the waste stream through coupled productions are not really apparent, although they would represent a logical extension of the RAS technology and would enable the development of sustainable circular production.

Funding

This research received no external funding.

Institutional Review Board Statement

Not applicable.

Informed Consent Statement

Not applicable.

Data Availability Statement

The raw data supporting the conclusions of this article will be made available by the authors on request.

Conflicts of Interest

The author declares that this scientific review was conducted in the absence of any commercial or financial relationship that could be constructed as a potential conflicts of interest.

References

  1. Singh, G.G.; Sajid, Z.; Mather, C. Quantitative analysis of mass mortality events in salmon aquaculture shows increasing scale of fish loss events around the world. Sci. Rep. 2008, 14, 3763. [Google Scholar] [CrossRef] [PubMed]
  2. Ahmed, N.; Turchini, G.M. Recirculating aquaculture systems (RAS). Environmental solution and climate change adaptation. J. Clean. Prod. 2021, 297, 126604. [Google Scholar] [CrossRef]
  3. Nilav, A.; Suman, N.; Abhilipsa, B.; Tapas, P. A review on recirculating aquaculture systems: Challenges and opportunities for sustainable aquaculture. Inno. Farm. 2020, 5, 017–024. [Google Scholar]
  4. Golfand, I. Economics of growing salmon in recirculating aquaculture systems (RAS). J. Aquac. Mar. Biol. 2023, 12, 99–102. [Google Scholar] [CrossRef]
  5. Schreier, H.J.; Mirzoyan, N.; Saito, K. Microbial diversity of biological filters in recirculating aquaculture systems. Curr. Opin. Biotechnol. 2010, 21, 318–325. [Google Scholar] [CrossRef]
  6. Li, H.; Cui, Z.; Cui, H.; Bai, Y.; Yin, Z.; Qu, K. A review of influencing factors on a recirculating aquaculture system: Environmental conditions, feeding strategies, and disinfection methods. J. World Aquac. Soc. 2023, 54, 566–602. [Google Scholar] [CrossRef]
  7. Badiola, M.; Mendiola, D.; Bostock, J. Recirculating Aquaculture Systems (RAS) analysis: Main issues on management and future challenges. Aquac. Eng. 2012, 51, 26–35. [Google Scholar] [CrossRef]
  8. Colson, V.; Sadoul, B.; Valotaire, C.; Prunet, P.; Gaumé, M.; Labbé, L. Welfare assessment of rainbow trout reared in a Recirculating Aquaculture System: Comparison with a Flow-Through System. Aquaculture 2015, 436, 151–159. [Google Scholar] [CrossRef]
  9. Waller, U. Tank culture and recirculating systems. In Environmental Impact of Aquaculture, 1st ed.; Black, K.D., Ed.; Sheffield Academic Press: Sheffield, UK, 2001; pp. 99–127. [Google Scholar]
  10. Coombs, S.; Bak-Coleman, J.; Montgomery, J. Rheotaxis revisited: A multi-behavioral and multisensory perspective on how fish orient to flow. J. Exp. Biol. 2020, 223, jeb223008. [Google Scholar] [CrossRef]
  11. Davidson, J.; Summerfelt, S. Solids flushing, mixing, and water velocity profiles within large (10 and 150 m) circular ‘Cornell-type’ dual-drain tanks. Aquac. Eng. 2004, 32, 245–271. [Google Scholar] [CrossRef]
  12. Timmerhaus, G.; Lazado, C.C.; Cabillon, N.A.R.; Reiten, B.K.M.; Johansen, L.-H. The optimum velocity for Atlantic salmon post-smolts in RAS is a compromise between muscle growth and fish welfare. Aquaculture 2021, 532, 736076. [Google Scholar] [CrossRef]
  13. Waller, U.; Black, E.; Burt, D.; Groot, C.; Rosenthal, H. The reaction of young coho Oncorhynchus kisutch to declining oxygen levels during long-term exposure. J. Appl. Ichthyol. 2000, 16, 14–19. [Google Scholar] [CrossRef]
  14. Akaarir, M.; Martorell-Barceló, M.; Morro, B.; Suau, M.; Alós, J.; Aspillaga, E.; Gamundí, A.; Grau, A.; Lana, A.; Nicolau, M.C.; et al. Measuring activity-rest rhythms under different acclimation periods in a marine fish using automatic deep learning-based video tracking. Chronobiol. Int. 2024, 41, 959–970. [Google Scholar] [CrossRef] [PubMed]
  15. Marius, C.B.; Kiemer, M.C.B.; Black, K.D.; Lussot, L.; Bullock, A.M.; Ezzi, I. The effects of chronic and acute exposure to hydrogen sulfide on Atlantic salmon (Salmo salar L.). Aquaculture 1995, 135, 311–327. [Google Scholar]
  16. Ciani, E.; Kvæstad, B.; Stormoen, M.; Mayer, I.; Gupta, S.; Ribičić, D.; Netzer, R. Early warning through video monitoring: Dissolved hydrogen sulfide (H2S) affects Atlantic salmon swimming behavior in recirculating aquaculture systems. Aquaculture 2024, 581, 740201. [Google Scholar] [CrossRef]
  17. Bergstedt, J.H.; Skov, P.V. Acute hydrogen sulfide exposure in post-smolt Atlantic salmon (Salmo salar): Critical levels and recovery. Aquaculture 2023, 570, 739405. [Google Scholar] [CrossRef]
  18. Lazado, C.C.; Stiller, K.T.; Timmerhaus, G.; Megård Reiten, B.K.; Nicolaysen, I.L.; Carletto, D.; Alipio, H.R.; Bergstedt, J.H.; Andersen, Ø. Mucosal and systemic physiological changes underscore the welfare risks of environmental hydrogen sulphide in post-smolt Atlantic salmon (Salmo salar). Ecotoxicol. Environ. Saf. 2024, 270, 115897. [Google Scholar] [CrossRef]
  19. Kraul, S.; Szyper, J.P.; Burke, B. Practical Formulas for Computing Water Exchange Rates. Progress. Fish-Cult. 1985, 47, 69–70. [Google Scholar] [CrossRef]
  20. Schram, E.; Verdegem, M.C.; Widjaja, R.; Kloet, C.J.; Foss, A.; Schelvis-Smit, R.; Roth, B.; Imsland, A.K. Impact of increased flow rate on specific growth rate of juvenile turbot (Scophthalmus maximus, Rafinesque 1810). Aquaculture 2009, 292, 46–52. [Google Scholar] [CrossRef]
  21. Pedersen, P.B.; von Ahnen, M.; Fernandes, P.; Naas, C.; Pedersen, L.-F.; Dalsgaard, J. Particle surface area and bacterial activity in recirculating aquaculture systems. Aquac. Eng. 2017, 78, 18–23. [Google Scholar] [CrossRef]
  22. Branson, E. Environmental Aspects of Aquaculture. In Aquaculture for Veterinarians; Brown, L., Ed.; Pergamon Press: Oxford, UK, 1993; pp. 57–67. [Google Scholar]
  23. Klontz, G.W. Environmental Requirements and Environmental Diseases of Salmonids. In Fish Medicine; Stoskopf, M.K., Ed.; W. B. Saunders Company: Philadelphia, PA, USA, 1993; pp. 333–358. [Google Scholar]
  24. Dahle, S.W.; Bakke, I.; Birkeland, M.; Nordøy, K.; Dalum, A.S.; Attramadal, K.J.K. Production of lumpfish (Cyclopterus lumpus L.) in RAS with distinct water treatments: Effects on fish survival, growth, gill health and microbial communities in rearing water and biofilm. Aquaculture 2020, 522, 735097. [Google Scholar] [CrossRef]
  25. Becke, C.; Schumann, M.; Steinhagen, D.; Geist, J.; Brinker, A. Physiological consequences of chronic exposure of rainbow trout (Oncorhynchus mykiss) to suspended solid load in recirculating aquaculture systems. Aquaculture 2018, 484, 228–241. [Google Scholar] [CrossRef]
  26. Bruton, M.N. The effects of suspensoids on fish. Hydrobiologia 1985, 125, 221–241. [Google Scholar] [CrossRef]
  27. Moretto, J.A.; Freitas, P.N.N.; Souza, J.P.; Oliveira, T.M.; Brites, I.; Pinto, E. off-flavors in Aquacultured Fish: Origins and Implications for Consumers. Fishes 2022, 7, 34. [Google Scholar] [CrossRef]
  28. Azaria, S.; van Rijn, J. off-flavor compounds in recirculating aquaculture systems (RAS): Production and removal processes. Aquac. Eng. 2018, 83, 57–64. [Google Scholar] [CrossRef]
  29. Fernandes, P.M.; Pedersen, L.-F.; Pedersen, P.B. Daily micro particle distribution of an experimental recirculating aquaculture system—A case study. Aquac. Eng. 2014, 60, 28–34. [Google Scholar] [CrossRef]
  30. Langer, J.; Efthimiou, S.; Rosenthal, H.; Bronzi, P. Drum filter performance in a recirculating eel culture unit. J. Appl. Ichthyol. 1996, 12, 61–65. [Google Scholar] [CrossRef]
  31. Lal, D. The Oceanic Microcosm of Particles. Science 1977, 198, 997–1009. [Google Scholar] [CrossRef]
  32. Sander, E. Skimmers in the marine aquarium. Petfish Mon. 1967, 2, 49–51. [Google Scholar]
  33. Waller, U.; Orellana, J.; Sander, M. The Control of Water Quality and Hygienic Conditions in Aquaculture Recirculation Systems (RAS): The Use of Foam Fractionation and Ozone. In Proceedings of the IOA/IUVA Joint World Congress on Ozone and Ultraviolet Technologies, Los Angeles, CA, USA, 27–29 August 2007; Volume 4, pp. 1916–1936. [Google Scholar]
  34. Fabio Brambilla, F.; Antonini, M.; Ceccuzzi, P.; Terova, G.; Saroglia, M. Foam fractionation efficiency in particulate matter and heterotrophic bacteria removal from a recirculating seabass (Dicentrarchus labrax) system. Aquac. Eng. 2008, 39, 37–42. [Google Scholar] [CrossRef]
  35. Burghoff, B. Foam fractionation applications. J. Biotechnol. 2012, 161, 126–137. [Google Scholar] [CrossRef] [PubMed]
  36. Prakash, R.; Majumder, S.K.; Singh, A. Flotation technique: Its mechanisms and design parameters. Chem. Eng. Process. Process. Intensif. 2018, 127, 249–270. [Google Scholar] [CrossRef]
  37. Zieminski, S.A.; Hume, R.M.; Durham, R. Rates of oxygen transfer from air bubbles to aqueous NaCl solutions at various temperatures. Mar. Chem. 1976, 4, 333–346. [Google Scholar] [CrossRef]
  38. Sander, M. Aquarientechnik in Süß- und Sewasser, 1st ed.; Ulmer: Stuttgart, Germany, 1998; 256p. [Google Scholar]
  39. Rosenthal, H.; Otte, G. Ozonation in an Intensive Fish Culture Recycling System. Ozone Sci. Eng. 1979, 1, 319–327. [Google Scholar] [CrossRef]
  40. Ernst, A.; Steinbach, C.; Wagner, K.; Waller, U. Virtual Sensing of Nitrite: A Novel Control for Safe Denitrification in Recirculating Aquaculture Systems (RASs). Fishes 2024, 9, 398. [Google Scholar] [CrossRef]
  41. Spiliotopoulou, A.; Rojas-Tirado, P.; Chhetri, R.K.; Kaarsholm, K.M.S.; Martin, R.; Pedersen, P.B.; Pedersen, L.-F.; Andersen, H.R. Ozonation control and effects of ozone on water quality in recirculating aquaculture systems. Water Res. 2018, 133, 289–298. [Google Scholar] [CrossRef]
  42. Fukunaga, K.; Suzuki, T.; Arita, M.; Suzuki, S.; Hara, A.; Yamauchi, K.; Shinriki, N.; Ishizaki, K.; Takama, K. Acute toxicity of ozone against morphology of gill and erythrocytes of Japanese charr (Salvelinus leucomaenis). Comp. Biochem. Physiol. C Comp. Pharmacol. Toxicol. 1992, 101, 331–336. [Google Scholar] [PubMed]
  43. Reiser, S.; Schroeder, J.P.; Wuertz, S.; Kloas, W.; Hanel, R. Histological and physiological alterations in juvenile turbot (Psetta maxima, L.) exposed to sublethal concentrations of ozone-produced oxidants in ozonated seawater. Aquaculture 2010, 307, 157–164. [Google Scholar] [CrossRef]
  44. Stiller, K.T.; Kolarevic, J.; Lazado, C.C.; Gerwins, J.; Good, C.; Summerfelt, S.T.; Mota, V.C.; Espmark, Å.M.O. The Effects of Ozone on Atlantic Salmon Post-Smolt in Brackish Water—Establishing Welfare Indicators and Thresholds. Int. J. Mol. Sci. 2020, 21, 5109. [Google Scholar] [CrossRef]
  45. Kovács, B.D.; de Jesus Gregersen, K.J.; Rüppel, F.; von Danwitz, A.; Pedersen, L.-F. Evaluating protein skimmer performance in a commercial seawater recirculating aquaculture system (RAS). Aquac. Eng. 2023, 103, 102369. [Google Scholar] [CrossRef]
  46. Lazado, C.C.; Stiller, K.T.; Reiten, B.-K.M.; Osório, J.; Kolarevic, J.; Johansen, L.-H. Consequences of continuous ozonation on the health and welfare of Atlantic salmon post-smolts in a brackish water recirculating aquaculture system. Aquat. Toxicol. 2021, 238, 105935. [Google Scholar] [CrossRef] [PubMed]
  47. Li, X.; Blancheton, J.P.; Liu, Y.; Triplet, S.; Michaud, L. Effect of oxidation–reduction potential on performance of European seabass (Dicentrarchus labrax) in recirculating aquaculture systems. Aquac. Int. 2014, 22, 1263–1282. [Google Scholar] [CrossRef]
  48. Powell, A.; Chingombea, P.; Lupatsch, I.; Shields, R.J.; Lloyd, R. The effect of ozone on water quality and survival of turbot (Psetta maxima) maintained in a recirculating aquaculture system. Aquac. Eng. 2015, 64, 20–24. [Google Scholar] [CrossRef]
  49. Schroeder, J.P.; Reiser, S.; Croot, L.P.; Hanel, R. A Comparative Study on the Removability of Different Ozone-Produced Oxidants by Activated Carbon Filtration. Ozone Sci. Eng. 2011, 33, 224–231. [Google Scholar] [CrossRef]
  50. Adey, W.H.; Loveland, K. Dynamic Aquaria—Building Living Ecosystems, 2nd ed.; Academic Press: New York, NY, USA, 1998; pp. 195–202. [Google Scholar]
  51. Goncalves, A.A.; Gagnon, G.A. Ozone Application in Recirculating Aquaculture System: An Overview. Ozone Sci. Eng. 2011, 33, 345–367. [Google Scholar] [CrossRef]
  52. Jyoti, K.K.; Pandit, A.B. Ozone and cavitation for water disinfection. Biochem. Eng. J. 2004, 18, 9–19. [Google Scholar] [CrossRef]
  53. Shi, Q.; Chen, Z.; Wei, F.; Mao, Y.; Xu, Q.; Li, K.; Lu, Y.; Hu, H.-Y. Identification of surrogates for rapid monitoring of microbial inactivation by ozone for water reuse: A pilot-scale study. J. Hazard. Mater. 2022, 424, 127567. [Google Scholar]
  54. Qi, W.; Skov, P.V.; de Jesus Gregersen, K.J.; Mousavi, S.; Pedersen, L.; Mota, V.C. Estimating biofilm activity on biofilter elements in recirculating aquaculture systems (RAS) for rearing Atlantic salmon parr (Salmo salar) during operation with ozone and peracetic acid. Aquaculture 2025, 594, 741381. [Google Scholar] [CrossRef]
  55. Schroeder, J.P.; Klatt, S.F.; Schlachter, M.; Zablotski, Y.; Keuter, S.; Spieck, E.; Schulz, C. Impact of ozonation and residual ozone-produced oxidants on the nitrification performance of moving-bed biofilters from marine recirculating aquaculture systems. Aquac. Eng. 2015, 65, 27–36. [Google Scholar] [CrossRef]
  56. Bakke, I.; Åm, A.L.; Kolarevic, J.; Ytrestøyl, T.; Vadstein, O.; Attramadal, K.J.K.; Terjesen, B.F. Microbial community dynamics in semi-commercial RAS for production of Atlantic salmon post-smolts at different salinities. Aquac. Eng. 2017, 78, 42–49. [Google Scholar] [CrossRef]
  57. Ip, Y.K.; Chew, S.F. Ammonia Production, Excretion, Toxicity, and Defense in Fish: A Review. Front. Physiol. 2010, 1, 134. [Google Scholar] [CrossRef] [PubMed]
  58. Edwards, T.M.; Puglisa, H.J.; Kent, D.B.; Duran, L.J.; Bradshaw, L.M.; Farag, A.M. Ammonia and aquatic ecosystems—A review of global sources, biogeochemical cycling, and effects on fish. Sci. Total Environ. 2024, 907, 167911. [Google Scholar] [CrossRef]
  59. Clegg, S.; Whitfield, M.A. chemical model of seawater including dissolved ammonia and the stoichiometric dissociation constant of ammonia in estuarine water and seawater from −2 to 40 °C. Geochim. Cosmochim. Acta 1995, 59, 2403–2421. [Google Scholar] [CrossRef]
  60. Dosdat, A.; Ruyet, J.P.; Covés, D.; Dutto, G.; Gasset, E.; Roux, A.L.; Lemarié, G. Effect of chronic exposure to ammonia on growth, food utilisation and metabolism of the European seabass (Dicentrarchus labrax). Aquat. Living Resour. 2003, 16, 509–520. [Google Scholar] [CrossRef]
  61. Foss, A.; Imsland, A.K.; Roth, B.; Schram, E.; Stefansson, S.O. Effects of chronic and periodic exposure to ammonia on growth and blood physiology in juvenile turbot (Scophthalmus maximus). Aquaculture 2009, 296, 45–50. [Google Scholar] [CrossRef]
  62. Wicks, B.J.; Joensen, R.; Tang, Q.; Randall, D.J. Swimming and ammonia toxicity in salmonids: The effect of sub lethal ammonia exposure on the swimming performance of coho salmon and the acute toxicity of ammonia in swimming and resting rainbow trout. Aquat. Toxicol. 2002, 59, 55–69. [Google Scholar] [CrossRef]
  63. Thurston, R.V.; Russo, R.C.; Vinogradov, G.A. Ammonia toxicity to fishes. Effect of pH on the toxicity of the unionized ammonia species. Environ. Sci. Technol. 1981, 15, 837–840. [Google Scholar] [CrossRef]
  64. Mantoura, R.F.C.; Woodward, E.M.S. Optimization of the indophenol blue method for the automated determination of ammonia in estuarine waters. Estuar. Coast. Shelf Sci. 1983, 17, 219–224. [Google Scholar] [CrossRef]
  65. Peng, X.; Fuchsman, C.A.; Jayakumar, A.; Oleynik, S.; Martens-Habbena, W.; Devol, A.; Ward, B.B. Ammonia and nitrite oxidation in the Eastern Tropical North Pacific. Glob. Biogeochem. Cycles 2015, 29, 2034–2049. [Google Scholar] [CrossRef]
  66. Zhu, Y.; Yuan, D.; Huang, Y.; Ma, J.; Feng, S. A sensitive flow-batch system for on board determination of ultra-trace ammonium in seawater: Method development and shipboard application. Anal. Chim. Acta 2013, 794, 47–54. [Google Scholar] [CrossRef]
  67. Fivelstad, S.; Schwarz, J.H.; Strømsnes, H.; Olsen, A.B. Sublethal effects and safe levels of ammonia in seawater for Atlantic salmon postsmolts (Salmo salar L.). Aquac. Eng. 1995, 14, 271–280. [Google Scholar] [CrossRef]
  68. Jia, R.; Han, C.; Lei, J.; Liu, B.; Huang, B.; Huo, H.H.; Yin, S. Effects of nitrite exposure on haematological parameters, oxidative stress and apoptosis in juvenile turbot (Scophthalmus maximus). Aquat. Toxicol. 2005, 169, 1–9. [Google Scholar] [CrossRef]
  69. Park, I.; Lee, J.; Hur, J.W.; Song, Y.; Na, H.; Noh, C.H. Acute Toxicity and Sublethal Effects of Nitrite on Selected Hematological Parameters and Tissues in Dark-banded Rockfish, Sebastes inermis. J. World Aquac. Soc. 2007, 38, 188–199. [Google Scholar] [CrossRef]
  70. Crawford, R.E.; Allen, G.H. Seawater Inhibition of Nitrite Toxicity to Chinook Salmon. Trans. Am. Fish. Soc. 1977, 106, 105–109. [Google Scholar] [CrossRef]
  71. Kroupova, H.; Machova, J.; Svodobova, J. Nitrite influence on fish: A review article. Vet. Med. Czech 2005, 50, 461–471. [Google Scholar] [CrossRef]
  72. Ruiz, P.; Vidal, J.M.; Sepulveda, D.; Torres, C.; Villouta, G.; Carrasco, C.; Aguilera, F.; Ruiz-Tagle, N.; Urrutia, H. Overview and future perspectives of nitrifying bacteria on biofilters for recirculating aquaculture systems. Rev. Aquac. 2020, 12, 1478–1494. [Google Scholar] [CrossRef]
  73. Park, J.; Kim, P.-H.; Park, S.; Daniels, H.V. Effects of two different ozone doses on total residual oxidants, nitrogen compounds and nitrification rate in seawater recirculating systems for black seabream Acanthopagrus schlegelii (Bleeker). Aquac. Eng. 2015, 67, 1–7. [Google Scholar] [CrossRef]
  74. Ødegaard, H. Innovations in wastewater treatment: The moving bed biofilm process. Water Sci. Technol. 2006, 53, 17–33. [Google Scholar] [CrossRef]
  75. Madan, S.; Madan, R.; Hussain, A. Advancement in biological wastewater treatment using hybrid moving bed biofilm reactor (MBBR): A review. Appl. Water Sci. 2022, 12, 141. [Google Scholar] [CrossRef]
  76. Wik, T. Trickling filters and biofilm reactor modelling. Rev. Environ. Sci. Bio/Technol. 2003, 2, 193–212. [Google Scholar] [CrossRef]
  77. Colt, J. Dissolved Gas Concentrations in Water, 2nd ed.; Elsevier: London, UK, 2012; pp. 1–289. [Google Scholar]
  78. Eding, E.H.; Kamstra, A.; Verreth, J.A.J.; Huisman, E.A.; Klapwijk, A. Design and operation of nitrifying trickling filters in recirculating aquaculture: A review. Aquac. Eng. 2006, 34, 234–260. [Google Scholar] [CrossRef]
  79. Chen, S.; Ling, J.H.; Blancheton, J.P. Nitrification kinetics of biofilm as affected by water quality factors. Aquac. Eng. 2006, 34, 179–197. [Google Scholar] [CrossRef]
  80. Kinyage, J.P.; Pedersen, L.-F. Impact of temperature on ammonium and nitrite removal rates in RAS moving bed biofilters. Aquac. Eng. 2016, 75, 51–55. [Google Scholar] [CrossRef]
  81. Kumar, R.V.; Joseph, V.; Philip, R.; Bright Singh, I.S. Nitrification by stringed bed suspended bioreactors at different salinities and substrate concentrations. Indian J. Geo-Mar. Sci. 2014, 43, 1899–1904. [Google Scholar]
  82. Gonzalez-Silva, B.M.; Jonassen, K.R.; Bakke, I.; Østgaard, K.; Vadstein, O. Nitrification at different salinities: Biofilm community composition and physiological plasticity. Water Res. 2016, 95, 48–58. [Google Scholar] [CrossRef]
  83. Kinyage, J.P.; Pedersen, P.B.; Pedersen, L.-F. Effects of abrupt salinity increase on nitrification processes in a freshwater moving bed biofilter. Aquac. Eng. 2019, 84, 91–98. [Google Scholar] [CrossRef]
  84. Suriasni, P.A.; Faizal, F.; Panatarani, C.; Hermawan, W.; Joni, I.M. A Review of Bubble Aeration in Biofilter to Reduce Total Ammonia Nitrogen of Recirculating Aquaculture System. Water 2023, 15, 808. [Google Scholar] [CrossRef]
  85. Suhr, K.I.; Pedersen, P.B. Nitrification in moving bed and fixed bed biofilters treating effluent water from a large commercial outdoor rainbow trout RAS. Aquac. Eng. 2010, 42, 31–37. [Google Scholar] [CrossRef]
  86. Qi, W.; Skov, P.V.; de Jesus Gregersen, K.J.; Pedersen, L.-F. Estimation of nitrifying and heterotrophic bacterial activity in biofilm formed on RAS biofilter carriers by respirometry. Aquaculture 2022, 561, 738730. [Google Scholar] [CrossRef]
  87. Huesemann, M.H.; Skillman, A.D.; Crecelius, E.A. The inhibition of marine nitrification by ocean disposal of carbon dioxide. Mar. Pollut. Bull. 2002, 44, 142–148. [Google Scholar] [CrossRef]
  88. Díaz, V.; Ibáñez, R.; Gómez, P.; Urtiaga, A.M.; Ortiz, I. Kinetics of nitrogen compounds in a commercial marine Recirculating Aquaculture System. Aquac. Eng. 2012, 50, 20–27. [Google Scholar] [CrossRef]
  89. Kraft, B.; Tegetmeyer, H.E.; Sharma, R.; Klotz, M.G.; Ferdelman, T.G.; Hettich, R.L.; Geelhoed, J.S.; Strous, M. The environmental controls that govern the end product of bacterial nitrate respiration. Science 2014, 345, 676–679. [Google Scholar] [CrossRef] [PubMed]
  90. Zhu, S.; Chen, S. Effects of organic carbon on nitrification rate in fixed film biofilters. Aquac. Eng. 2001, 25, 1–11. [Google Scholar] [CrossRef]
  91. Ling, J.H.; Chen, S. Impact of organic carbon on nitrification performance of different biofilters. Aquac. Eng. 2005, 33, 150–162. [Google Scholar] [CrossRef]
  92. Navada, S.; Knutsen, M.F.; Bakke, I.; Vadstein, O. Nitrifying biofilms deprived of organic carbon show higher functional resilience to increases in carbon supply. Sci. Rep. 2020, 10, 7121. [Google Scholar] [CrossRef]
  93. Rojas-Tirado, P.A.; Aalto, S.L.; Åtland, Å.; Letelier-Gordo, C.O. Biofilters are potential hotspots for H2S production in brackish and marine water RAS. Aquaculture 2021, 536, 736490. [Google Scholar] [CrossRef]
  94. Li, B.; Irvin, S.I. The comparison of alkalinity and ORP as indicators for nitrification and denitrification in a sequencing batch reactor (SBR). Biochem. Eng. J. 2007, 34, 248–255. [Google Scholar] [CrossRef]
  95. Mariu, A.; Chatha, A.M.; Naz, S.; Khan, M.F.; Safdar, W.; Ashraf, I. Effect of Temperature, pH, Salinity and Dissolved Oxygen on Fishes. J. Zool. Syst. 2023, 1, 1–12. [Google Scholar] [CrossRef]
  96. Tresguerres, M.; Clifford, A.M.; Harter, T.S.; Roa, J.N.; Thies, A.B.; Yee, D.P.; Brauner, C.J. Evolutionary links between intra- and extracellular acid-base regulation in fish and other aquatic animals. J. Exp. Zool. 2020, 333, 449–465. [Google Scholar] [CrossRef]
  97. Klas, S.; Mozes, N.; Lahav, O. Development of a single-sludge denitrification method for nitrate removal from RAS effluents: Lab-scale results vs. model prediction. Aquaculture 2006, 259, 342–353. [Google Scholar] [CrossRef]
  98. Prakash, A.; Khanam, S. Nitrogen Pollution Threat to Mariculture and Other Aquatic Ecosystems: An Overview. J. Pharm. Pharmacol. 2021, 9, 428–433. [Google Scholar] [CrossRef]
  99. Zakem, E.J.; Al-Haj, A.; Church, M.J.; Van Dijken, G.L.; Dutkiewicz, S.; Foster, S.Q.; Fulweiler, R.W.; Mills, M.M.; Follows, M.J. Ecological control of nitrite in the upper ocean. Nat. Commun. 2018, 9, 1206. [Google Scholar] [CrossRef] [PubMed]
  100. Kamykowski, D.; Zentara, S.-J. Predicting plant nutrient concentrations from temperature and sigma-t in the upper kilometer of the world ocean. Deep-Sea Res. 1986, 33, 89–105. [Google Scholar] [CrossRef]
  101. Bristow, L.A.; Mohr, W.; Ahmerkamp, S.; Kuypers, M.M. Nutrients that limit growth in the ocean. Curr. Biol. 2017, 27, R474–R478. [Google Scholar] [CrossRef]
  102. Bussel, C.G.; Schroeder, J.P.; Wuertz, S.; Schulz, C. The chronic effect of nitrate on production performance and health status of juvenile turbot (Psetta maxima). Aquaculture 2012, 326–329, 163–167. [Google Scholar] [CrossRef]
  103. Gomez Isaza, D.F.; Cramp, R.L.; Franklin, C.E. Thermal plasticity of the cardiorespiratory system provides cross-tolerance protection to fish exposed to elevated nitrate. Comparative biochemistry and physiology. Toxicol. Pharmacol. 2020, 240, 108920. [Google Scholar]
  104. Pierce, R.H.; Weeks, J.M.; Prappas, J.M. Nitrate Toxicity to Five Species of Marine Fish. J. World Aquac. Soc. 1993, 24, 105–107. [Google Scholar] [CrossRef]
  105. Timmons, M.B.; Ebeling, J.M. Mass Balance, Loading Rate and Fish Growth. In Recirculating Aquaculture, 3rd ed.; Ithaca Publishing Company, LLC: New York, NY, USA, 2013; p. 69. [Google Scholar]
  106. Balderston, W.L.; Sieburth, J.M. Nitrate removal in closed-system aquaculture by columnar denitrification. Appl. Environ. Microbiol. 1976, 32, 808–818. [Google Scholar] [CrossRef]
  107. Sauthier, N.; Grasmick, A.; Blancheton, J.P. Biological denitrification applied to a marine closed aquaculture system. Water Res. 1998, 32, 1932–1938. [Google Scholar] [CrossRef]
  108. Müller-Belecke, A.; Zienert, S.; Thürmer, C.; Kaufhold, S.; Spranger, U. The self cleaning inherent gas denitrification-reactor for nitrate elimination in RAS for pike perch (Sander lucioperca) production. Aquac. Eng. 2013, 57, 18–23. [Google Scholar] [CrossRef]
  109. Almeida, P.; Dewasme, L.; Vande Wouwer, A.V. Denitrification Control in a Recirculating Aquaculture System—A Simulation Study. Processes 2020, 8, 1306. [Google Scholar] [CrossRef]
  110. Stavrakidis-Zachou, O.; Ernst, A.; Steinbach, C.; Wagner, K.; Waller, U. Development of denitrification in semi-automated moving bed biofilm reactors operated in a marine recirculating aquaculture system. Aquac. Int. 2019, 27, 1485–1501. [Google Scholar] [CrossRef]
  111. Preena, P.G.; Rejish Kumar, V.J.; Singh, I.S. Nitrification and denitrification in recirculating aquaculture systems: The processes and players. Rev. Aquac. 2021, 13, 2053–2075. [Google Scholar] [CrossRef]
  112. Lahav, O.; Massada, I.B.; Yackoubov, D.; Zelikson, R.; Mozes, N.; Tal, Y.; Tarre, S. Quantification of anammox activity in a denitrification reactor for a recirculating aquaculture system. Aquaculture 2009, 288, 76–82. [Google Scholar] [CrossRef]
  113. Yogev, U.; Sowers, K.R.; Mozes, N.; Gross, A. Nitrogen and carbon balance in a novel near-zero water exchange saline recirculating aquaculture system. Aquaculture 2017, 467, 118–126. [Google Scholar] [CrossRef]
  114. Letelier-Gordo, C.O.; Huang, X.; Aalto, S.L.; Pedersen, P.B. Activated sludge denitrification in marine recirculating aquaculture system effluent using external and internal carbon sources. Aquac. Eng. 2020, 90, 102096. [Google Scholar] [CrossRef]
  115. Rabalais, N.N.; Turner, R.E.; Díaz, R.J.; Justić, D. Global change and eutrophication of coastal waters. ICES J. Mar. Sci. 2009, 66, 1528–1537. [Google Scholar] [CrossRef]
  116. Servili, A.; Lévêque, E.P.; Mouchel, O.; Devergne, J.; Lebigre, C.; Roussel, S.; Mazurais, D.; Zambonino-Infante, J. Ocean acidification alters the acute stress response of a marine fish. Sci. Total Environ. 2023, 858, 159804. [Google Scholar] [CrossRef]
  117. Stiller, K.T.; Vanselow, K.H.; Moran, D.; Bojens, G.; Voigt, W.; Meyer, S.; Schulz, C. The effect of carbon dioxide on growth and metabolism in juvenile turbot Scophthalmus maximus L. Aquaculture 2015, 444, 143–150. [Google Scholar] [CrossRef]
  118. Mota, V.C.; Nilsen, T.O.; Gerwins, J.; Gallo, M.; Ytteborg, E.; Baeverfjord, G.; Kolarevic, J.; Summerfelt, S.T.; Terjesen, B.F. The effects of carbon dioxide on growth performance, welfare, and health of Atlantic salmon post-smolt (Salmo salar) in recirculating aquaculture systems. Aquaculture 2019, 498, 578–586. [Google Scholar] [CrossRef]
  119. Jafari, L.; Fivelstad, S.; Attramadal, K.; Flataker, H.; Mjaatvedt, P.; Olsen, A.B.; Chierici, M.; Hosfeld, C.D. A descriptive study of Carbon Dioxide Production and Removal in Full-Scale RAS for Atlantic Salmon (Salmo salar L.) Post-Smolt: A Comparison of Two Different Measurement Methods for CO2. Aquac. Eng. 2024, 107, 102442. [Google Scholar] [CrossRef]
  120. Khan, J.R.; Johansen, D.Y.; Skov, P.V. The effects of acute and long-term exposure to CO2 on the respiratory physiology and production performance of Atlantic salmon (Salmo salar) in freshwater. Aquaculture 2018, 491, 20–27. [Google Scholar] [CrossRef]
  121. Moran, D. Carbon dioxide degassing in fresh and saline water I: Degassing performance of a cascade column. Aquac. Eng. 2010, 43, 29–36. [Google Scholar] [CrossRef]
  122. Moran, D. Carbon dioxide degassing in fresh and saline water. II: Degassing performance of an air-lift. Aquac. Eng. 2010, 43, 120–127. [Google Scholar] [CrossRef]
  123. Kramer, D.L. Dissolved oxygen and fish behavior. Environ. Biol. Fishes 1987, 18, 81–92. [Google Scholar] [CrossRef]
  124. Chabot, D.; Dutil, J. Reduced growth of Atlantic cod in non-lethal hypoxic conditions. J. Fish Biol. 1999, 55, 472–491. [Google Scholar]
  125. Stierhoff, K.; Targett, T.E.; Miller, K.L. Ecophysiological responses of juvenile summer and winter flounder to hypoxia: Experimental and modeling analyses of effects on estuarine nursery quality. Mar. Ecol. Prog. Ser. 2006, 325, 255–266. [Google Scholar] [CrossRef]
  126. Jones, J. The Reactions of Fish to Water of Low Oxygen Concentration. J. Exp. Biol. 1952, 29, 403–415. [Google Scholar] [CrossRef]
  127. Waller, U.; Rosenthal, H.; Black, E. The respiration of young coho Oncorhynchus kisutch at gradually declining oxygen levels and during recovery from oxygen deprivation. J. Appl. Ichthyol. 1997, 13, 73–78. [Google Scholar] [CrossRef]
  128. Cerezo, J.; García, B.G. The effects of oxygen levels on oxygen consumption, survival and ventilatory frequency of sharpsnout sea bream (Diplodus puntazzo Gmelin, 1789) at different conditions of temperature and fish weight. J. Appl. Ichthyol. 2004, 20, 488–492. [Google Scholar] [CrossRef]
  129. Valverde, J.C.; López, F.J.; García, B.G. Oxygen consumption and ventilatory frequency responses to gradual hypoxia in common dentex (Dentex dentex): Basis for suitable oxygen level estimations. Aquaculture 2006, 256, 542–551. [Google Scholar] [CrossRef]
  130. Seginer, I.; Mozes, N. A note on oxygen supply in RAS: The effect of water temperature. Aquac. Eng. 2012, 50, 46–54. [Google Scholar] [CrossRef]
  131. Thetmeyer, H.; Waller, U.; Black, K.D.; Inselmann, S.; Rosenthal, H. Growth of European seabass (Dicentrarchus labrax L.) under hypoxic and oscillating oxygen conditions. Aquaculture 1999, 174, 355–367. [Google Scholar] [CrossRef]
  132. Colt, J. Gas supersaturation—Impact on the design and operation of aquatic systems. Aquac. Eng. 1986, 5, 49–85. [Google Scholar] [CrossRef]
  133. Pleizier, N.K.; Brauner, C.J. Causes and consequences of gas bubble trauma on fish gill function. J. Comp. Physiol. Biochem. Syst. Environ. Physiol. 2024, 194, 739–747. [Google Scholar] [CrossRef]
  134. Vinci, B.; Davidson, J.; Naveh, E.; Engler, O. Low head oxygenator performance characterization for marine recirculating aquaculture systems. Aquac. Eng. 2016, 75, 22–28. [Google Scholar] [CrossRef]
  135. Ji, M.; Ye, Z.; Li, H. Performance evaluation and mathematical model of pipeline diffused aeration for recirculating aquaculture system. Aquac. Eng. 2024, 105, 102410. [Google Scholar] [CrossRef]
  136. Loyless, J.C.; Malone, R.F. Evaluation of air-lift pump capabilities for water delivery, aeration, and degasification for application to recirculating aquaculture systems. Aquac. Eng. 1998, 18, 117–133. [Google Scholar] [CrossRef]
  137. Orazem, M.E.; Erickson, L.E. Oxygen-transfer rates and efficiencies in one- and two-stage airlift towers. Biotechnol. Bioeng. 1979, 21, 69–88. [Google Scholar] [CrossRef]
  138. Cheng, X.; Xie, Y.; Zheng, H.; Yang, Q.; Zhu, D.; Xie, J. Effect of the Different Shapes of Air Diffuser on Oxygen Mass Transfer Coefficients in Microporous Aeration Systems. Procedia Eng. 2016, 154, 1079–1086. [Google Scholar] [CrossRef]
  139. Colt, J.; Watten, B.J. Applications of pure oxygen in fish culture. Aquac. Eng. 1988, 7, 397–441. [Google Scholar] [CrossRef]
  140. Steinberg, K.; Zimmermann, J.; Meyer, S.; Schulz, C. Start-up of recirculating aquaculture systems: How do water exchange rates influence pikeperch (Sander lucioperca) and water composition? Aquac. Eng. 2018, 83, 151–159. [Google Scholar] [CrossRef]
  141. Calabrese, S.; Nilsen, T.O.; Kolarevic, J.; Ebbesson, L.O.; Pedrosa, C.; Fivelstad, S.; Hosfeld, A.D.; Stefansson, S.O.; Terjesen, B.F.; Takle, H.; et al. Stocking density limits for post-smolt Atlantic salmon (Salmo salar L.) emphasis on production performance and welfare. Aquaculture 2017, 468, 363–370. [Google Scholar] [CrossRef]
  142. Wang, Y.; Chi, L.; Liu, Q.; Xiao, Y.; Ma, D.; Xiao, Z.; Xu, S.; Li, J. Effects of stocking density on the growth and immunity of Atlantic salmon salmo salar reared in recirculating aquaculture system (RAS). J. Oceanol. Limnol. 2018, 37, 350–360. [Google Scholar] [CrossRef]
  143. Sammouth, S.; d’Orbcastel, E.R.; Gasset, E.; Lemariéa, G.; Breuil, G.; Marino, G.; Coeurdacier, J.; Fivelstad, S.; Blancheton, J.P. The effect of density on seabass (Dicentrarchus labrax) performance in a tank-based recirculating system. Aquac. Eng. 2009, 40, 72–78. [Google Scholar] [CrossRef]
  144. Lupatsch, I.; Santos, G.A.; Schrama, J.W.; Verreth, J.A. Effect of stocking density and feeding level on energy expenditure and stress responsiveness in European seabass Dicentrarchus labrax. Aquaculture 2010, 298, 245–250. [Google Scholar] [CrossRef]
  145. Pitcher, T.J.; Parrish, J.K. Functions of shoaling in teleosts. In Behaviour of Teleost Fishes, 2nd ed.; Pitcher, T.J., Ed.; Chapmann & Hall: London, UK, 1993; pp. 363–439. [Google Scholar]
  146. Hvas, M.; Folkedal, O.; Solstorm, D.; Vågseth, T.; Fosse, J.O.; Gansel, L.C.; Oppedal, F. Assessing swimming capacity and schooling behaviour in farmed Atlantic salmon Salmo salar with experimental push-cages. Aquaculture 2017, 473, 423–429. [Google Scholar] [CrossRef]
  147. Orellana, J.; Waller, U.; Wecker, B. Culture of yellowtail kingfish (Seriola lalandi) in a marine recirculating aquaculture system (RAS) with artificial seawater. Aquac. Eng. 2014, 58, 20–28. [Google Scholar] [CrossRef]
  148. Lindholm-Lehto, P.C.; Vielma, J. Controlling of geosmin and 2-methylisoborneol induced off-flavours in recirculating aquaculture system farmed fish—A review. Aquac. Res. 2019, 50, 9–28. [Google Scholar] [CrossRef]
  149. Davidson, J.; Schrader, K.K.; Ruan, E.D.; Swift, B.; Aalhus, J.L.; Juárez, M.; Wolters, W.R.; Burr, G.S.; Good, C.; Summerfelt, S.T. Evaluation of depuration procedures to mitigate the off-flavor compounds geosmin and 2-methylisoborneol from Atlantic salmon Salmo salar raised to market-size in recirculating aquaculture systems. Aquac. Eng. 2014, 61, 27–34. [Google Scholar] [CrossRef]
  150. Fernandes, P.M.; Aalto, S.L.; Åsnes, H.Ø.; Rojas-Tirado, P.A.; Åtland, Å.; Letelier-Gordo, C.O. Sulphate removal by membrane filtration minimizes the risk of hydrogen sulphide formation in fixed bed biofilters. Aquac. Eng. 2024, 106, 102426. [Google Scholar] [CrossRef]
  151. Badiola, M.; Basurko, O.C.; Piedrahita, R.H.; Hundley, P.S.; Mendiola, D. Energy use in Recirculating Aquaculture Systems (RAS): A review. Aquac. Eng. 2018, 81, 57–70. [Google Scholar] [CrossRef]
  152. Ishimatsu, A.; Kikkawa, T.; Hayashi, M.; Lee, K.; Kita, J. Effects of CO2 on Marine Fish: Larvae and Adults. J. Oceanogr. 2004, 60, 731–741. [Google Scholar] [CrossRef]
  153. Bergstedt, J.H.; Skov, P.V.; Letelier-Gordo, C.O. Efficacy of H2O2 on the removal kinetics of H2S in saltwater aquaculture systems, and the role of O2 and NO3. Water Res. 2022, 222, 118892. [Google Scholar] [CrossRef]
  154. Lukassen, M.B.; Menanteau-Ledouble, S.; de Jonge, N.; Schram, E.; Nielsen, J.L. Impact of water quality parameters on geosmin levels and geosmin producers in European recirculating aquaculture systems. J. Appl. Microbiol. 2021, 132, 2475–2487. [Google Scholar] [CrossRef] [PubMed]
  155. Sarker, P.K.; Pilote, A.J.; Auffret, M.D.; Proulx, É.; Villemur, R.; Deschamps, M.; Vandenberg, G.W. Reducing geosmin off-flavor compounds and waste outputs through dietary phosphorus management in rainbow trout aquaculture. Aquac. Environ. Interact. 2014, 6, 105–117. [Google Scholar] [CrossRef]
  156. Yuan, Q.; Oleszkiewicz, J.A. Interaction between Denitrification and Phosphorus Removal in a Sequencing Batch Reactor Phosphorus Removal System. Water Environ. Res. 2010, 82, 536–540. [Google Scholar] [CrossRef]
  157. He, Q.; Song, Q.; Zhang, S.; Zhang, W.; Wang, H. Simultaneous nitrification, denitrification and phosphorus removal in an aerobic granular sequencing batch reactor with mixed carbon sources: Reactor performance, extracellular polymeric substances and microbial successions. Chem. Eng. J. 2018, 331, 841–849. [Google Scholar] [CrossRef]
  158. Ben-Asher, R.; Zohar, Y.; Stromberg, M.; Lahav, O. A new approach for eliminating off-flavors from RAS fish, as part of the normal grow-out period. Water Res. 2023, 249, 121015. [Google Scholar] [CrossRef]
  159. Ruyet, J.P.; Mahé, K.; Bayon, N.L.; Delliou, H.L. Effects of temperature on growth and metabolism in a Mediterranean population of European seabass, Dicentrarchus labrax. Aquaculture 2004, 237, 269–280. [Google Scholar] [CrossRef]
  160. Waller, U. Factors influencing routine oxygen consumption in turbot, Scophthalmus maximus. J. Appl. Ichthyol. 1992, 8, 62–71. [Google Scholar] [CrossRef]
  161. Rikardsen, A.H.; Righton, D.A.; Strøm, J.F.; Thorstad, E.B.; Gargan, P.G.; Sheehan, T.F.; Økland, F.; Chittenden, C.M.; Hedger, R.D.; Næsje, T.F.; et al. Redefining the oceanic distribution of Atlantic salmon. Sci. Rep. 2021, 11, 12266. [Google Scholar] [CrossRef] [PubMed]
  162. Stevens, E.D.; Sutterlin, A.M. Heat transfer between fish and ambient water. J. Exp. Biol. 1976, 65, 131–145. [Google Scholar] [CrossRef] [PubMed]
  163. Waversveld, J.V.; Addink, A.D.; Thillart, G.V.; Smit, H.J. Heat production of fish: A literature review. Comp. Biochem. Physiol. Part A Physiol. 1989, 92, 159–162. [Google Scholar] [CrossRef]
  164. Black, K.D. Environmental Impact of Aquaculture, 1st ed.; Sheffield Academic Press: Sheffield, UK, 2001; 214p. [Google Scholar]
  165. Waller, U.; Buhmann, A.K.; Ernst, A.; Hanke, V.; Kulakowski, A.; Wecker, B.; Orellana, J.; Papenbrock, J. Integrated multi-trophic aquaculture in a zero-exchange recirculation aquaculture system for marine fish and hydroponic halophyte production. Aquac. Int. 2015, 23, 1473–1489. [Google Scholar] [CrossRef]
  166. Austreng, E.; Storebakken, T.; Åsgård, T. Growth rate estimates for cultured Atlantic salmon and rainbow trout. Aquaculture 1987, 60, 157–160. [Google Scholar] [CrossRef]
  167. Lindholm-Lehto, P.C. Water quality monitoring in recirculating aquaculture systems. Aquac. Fish Fish. 2023, 3, 113–131. [Google Scholar] [CrossRef]
  168. Grant, E.L.; Laevenworth, R.S. Statistical Quality Control, 6th ed.; McGraw-Hill: New York, NY, USA, 1988; 714p. [Google Scholar]
  169. Saberioon, M.; Cisar, P. Automated within tank fish mass estimation using infrared reflection system. Comput. Electron. Agric. 2018, 150, 484–492. [Google Scholar] [CrossRef]
  170. Pargi, M.K.; Bagheri, E.; Shirota, F.R.; Eng Huat, K.; Shishehchian, F.; Nathalie, N. Improving Aquaculture Systems using AI: Employing predictive models for Biomass Estimation on Sonar Images. In Proceedings of the 2022 21st IEEE International Conference on Machine Learning and Applications (ICMLA), Nassau, The Bahamas, 12–14 December 2022; pp. 1629–1636. [Google Scholar]
  171. Hung, C.; Tsao, S.C.; Huang, K.; Jang, J.; Chang, H.; Dobbs, F.C. A highly sensitive underwater video system for use in turbid aquaculture ponds. Sci. Rep. 2016, 6, 31810. [Google Scholar] [CrossRef]
Figure 1. The RAS process chain. Green: central components. Yellow: internal reuse of water. Blue: operating resources. Red: waste discharge.
Fishes 09 00431 g001
Figure 2. A rectangular production tank used in an inland RAS. The system is stocked with sturgeons. The arrows show the inlet and outlet for the process water treated in the water treatment at the head end of the tank. The two open flow channels are connected at the rear end. Engineering by Erwin Sander Elektroapparatebau GmbH, Uetze, Germany.
Fishes 09 00431 g002
Figure 3. A rectangular tank in a container-based RAS for regional production of European seabass (Dicentrarchus labrax). The RAS technology follows the process scheme illustrated in Figure 1. The arrows indicate the water flow direction through the three partitions separated by net walls. Courtesy of SEAWATER Cubes GmbH, Saarbrücken, Germany.
Fishes 09 00431 g003
Figure 4. Theoretic tank water renewal rate at increasing water volume flow into the production tank. The water volume flow rate expresses the number of tank volumes fed into the production tank per hour.
Fishes 09 00431 g004
Figure 5. The upper part of a foam flotation where the foam is removed from the RAS. The brownish discoloration comes from particles and bacteria. A unique feature of foam flotation is that the filter medium, i.e., the bubble surface, is continuously replaced. The filter medium is air injected into a bubble column.
Fishes 09 00431 g005
Figure 6. A typical control curve for the redox potential in the foam flotation (upper graph) and the resulting redox potential in the production tank of a commercial RAS (lower graph). On the abscissa the number of the measurement is denoted. The time interval between measurements was 10 s. The lower control value of the two-point controller that switches the ozone generator on and off was set to 350 mV. The redox potential in the foam flotation exceeded the upper control value (400 mV) by 50 mV due to the delayed shutdown of the ozone feed, but it remained within safe limits. Courtesy of SEAWATER Cubes GmbH, Saarbruecken, Germany.
Fishes 09 00431 g006
Figure 7. The relationship between the concentration of total residual oxidants (TRO, as Cl ) and the Oxidation Reduction Potential (ORP) in artificial marine living systems redrawn with data from [33]. The rectangular markers show measurements of OPR in various systems: Open markers show ORP values measured in aquaria displays having a comparably low biomass density and moderate species diversity. Gray markers represents measurements in aquaculture systems having a high biomass density and low species diversity.
Fishes 09 00431 g007
Figure 8. The maximum allowable TAN at different process water pH calculated for an ammonia concentration of 0.04 g   m 3 [59]. The equilibrium concentrations were calculated for a salinity of 18 psu and temperature of 15 ° C (blue) and 25 ° C (red).
Fishes 09 00431 g008
Figure 9. The interactions between components and processes in a marine wastewater treatment system. The interactions are indicated by red lines: effects of particle load and particle sedimentation, blue lines: effects due to insufficient process water flow rate leading to the formation of anaerobic sediments, black lines: effects of material flows including possibly toxic substances and substances affecting product quality, and yellow lines: fish biomass exceeding the capacity of the treatment processes, as an overlay to the process scheme in Figure 1 (green lines and symbols).
Fishes 09 00431 g009
Figure 10. Summary of assumptions used for a simple stationary mass balance (Figure 11). (A): components and process water flow. The associated design criteria and process variables are written in italics. (B): the time-dependent excretion rate of fish as measured in a commercial RAS. (C): the change in TAN concentration in the nitrification bioreactor during a single pass according to data measured in a commercial RAS. Dashed lines indicate the lower and upper limits of the linear algorithm used in the calculations (see text). (D): the mass-specific removal TAN removal rate calculated from (C).
Fishes 09 00431 g010
Figure 11. The results of a virtual stationary mass balance for a simplified RAS as shown in Figure 10. Calculations were carried out for a fish biomass of 50 k g   m 3 , a feeding rate of 0.01 d 1 , and a relative protein content of the feed of 0.3 at different process water volume flows. TAN excretion was calculated after [105]. Process water volume flow was assumed to be 1 (A), 2 (B), and 4 (C) production tank volumes per hour. Relative TAN conversion refers to the conversion efficiency of the nitrification bioreactor. TAN is the total NH3 and NH4+ nitrogen concentration in the production tank.
Fishes 09 00431 g011
Figure 12. A dense group of juvenile European seabass (Dicentrarchus labrax) schooling in the rectangular fish tank of a small experimental RAS at a calculated stocking density of around 40 k g   m 3 . Water quality is maintained by the high process water flow and water treatment components shown in Figure 1. The clarity of the tank water is a result of the foam flotation process (Figure 5).
Fishes 09 00431 g012
Figure 13. Forecast and reality of a RAS project. The axes are not labeled to avoid conflicts that could arise from the recognition of the data source. Blue: the benchmark experiment; growth of the fish in net pens in seawater at water temperatures not exceeding 14 ° C [166]. Yellow: growth forecast by the freshwater RAS developer. Green: growth of the fish in an experimental freshwater RAS. Red: growth of the fish achieved during the commercial freshwater RAS operation. Data from a randomly sampled production tank.
Fishes 09 00431 g013
Disclaimer/Publisher’s Note: The statements, opinions and data contained in all publications are solely those of the individual author(s) and contributor(s) and not of MDPI and/or the editor(s). MDPI and/or the editor(s) disclaim responsibility for any injury to people or property resulting from any ideas, methods, instructions or products referred to in the content.

