
Untangling the Complexity of Small-Scale Fisheries: Building an Understanding of Grouper-Snapper Fisheries Dynamics in Saleh Bay, West Nusa Tenggara, Indonesia

 ,
, 
 , , and
Abstract
:1. Introduction
2. Materials and Methods
2.1. Data Sources
2.1.1. Climate Data
2.1.2. Fisheries Catch and Effort Data
2.2. Characterizing Fishing Operations
2.3. Statistical Analyses
2.3.1. Catch Composition and Diversity of Targeted Groupers and Snappers Species
2.3.2. Seasonal Trends in Catch and Effort
2.3.3. Factors Influencing the CPUE of the Four Main Species
- CPUE ~ Year + Month + Fishing Gear + Trip Hour + Depth + Gross Tonnage + Price … fitted with GLM.
- CPUE ~ Year + Month + Fishing Gear + ƒ (Trip Hour) + ƒ (Depth) + ƒ (Gross Tonnage) + ƒ (Price) … fitted with GAM, where ƒ is a smoothing function.
3. Results
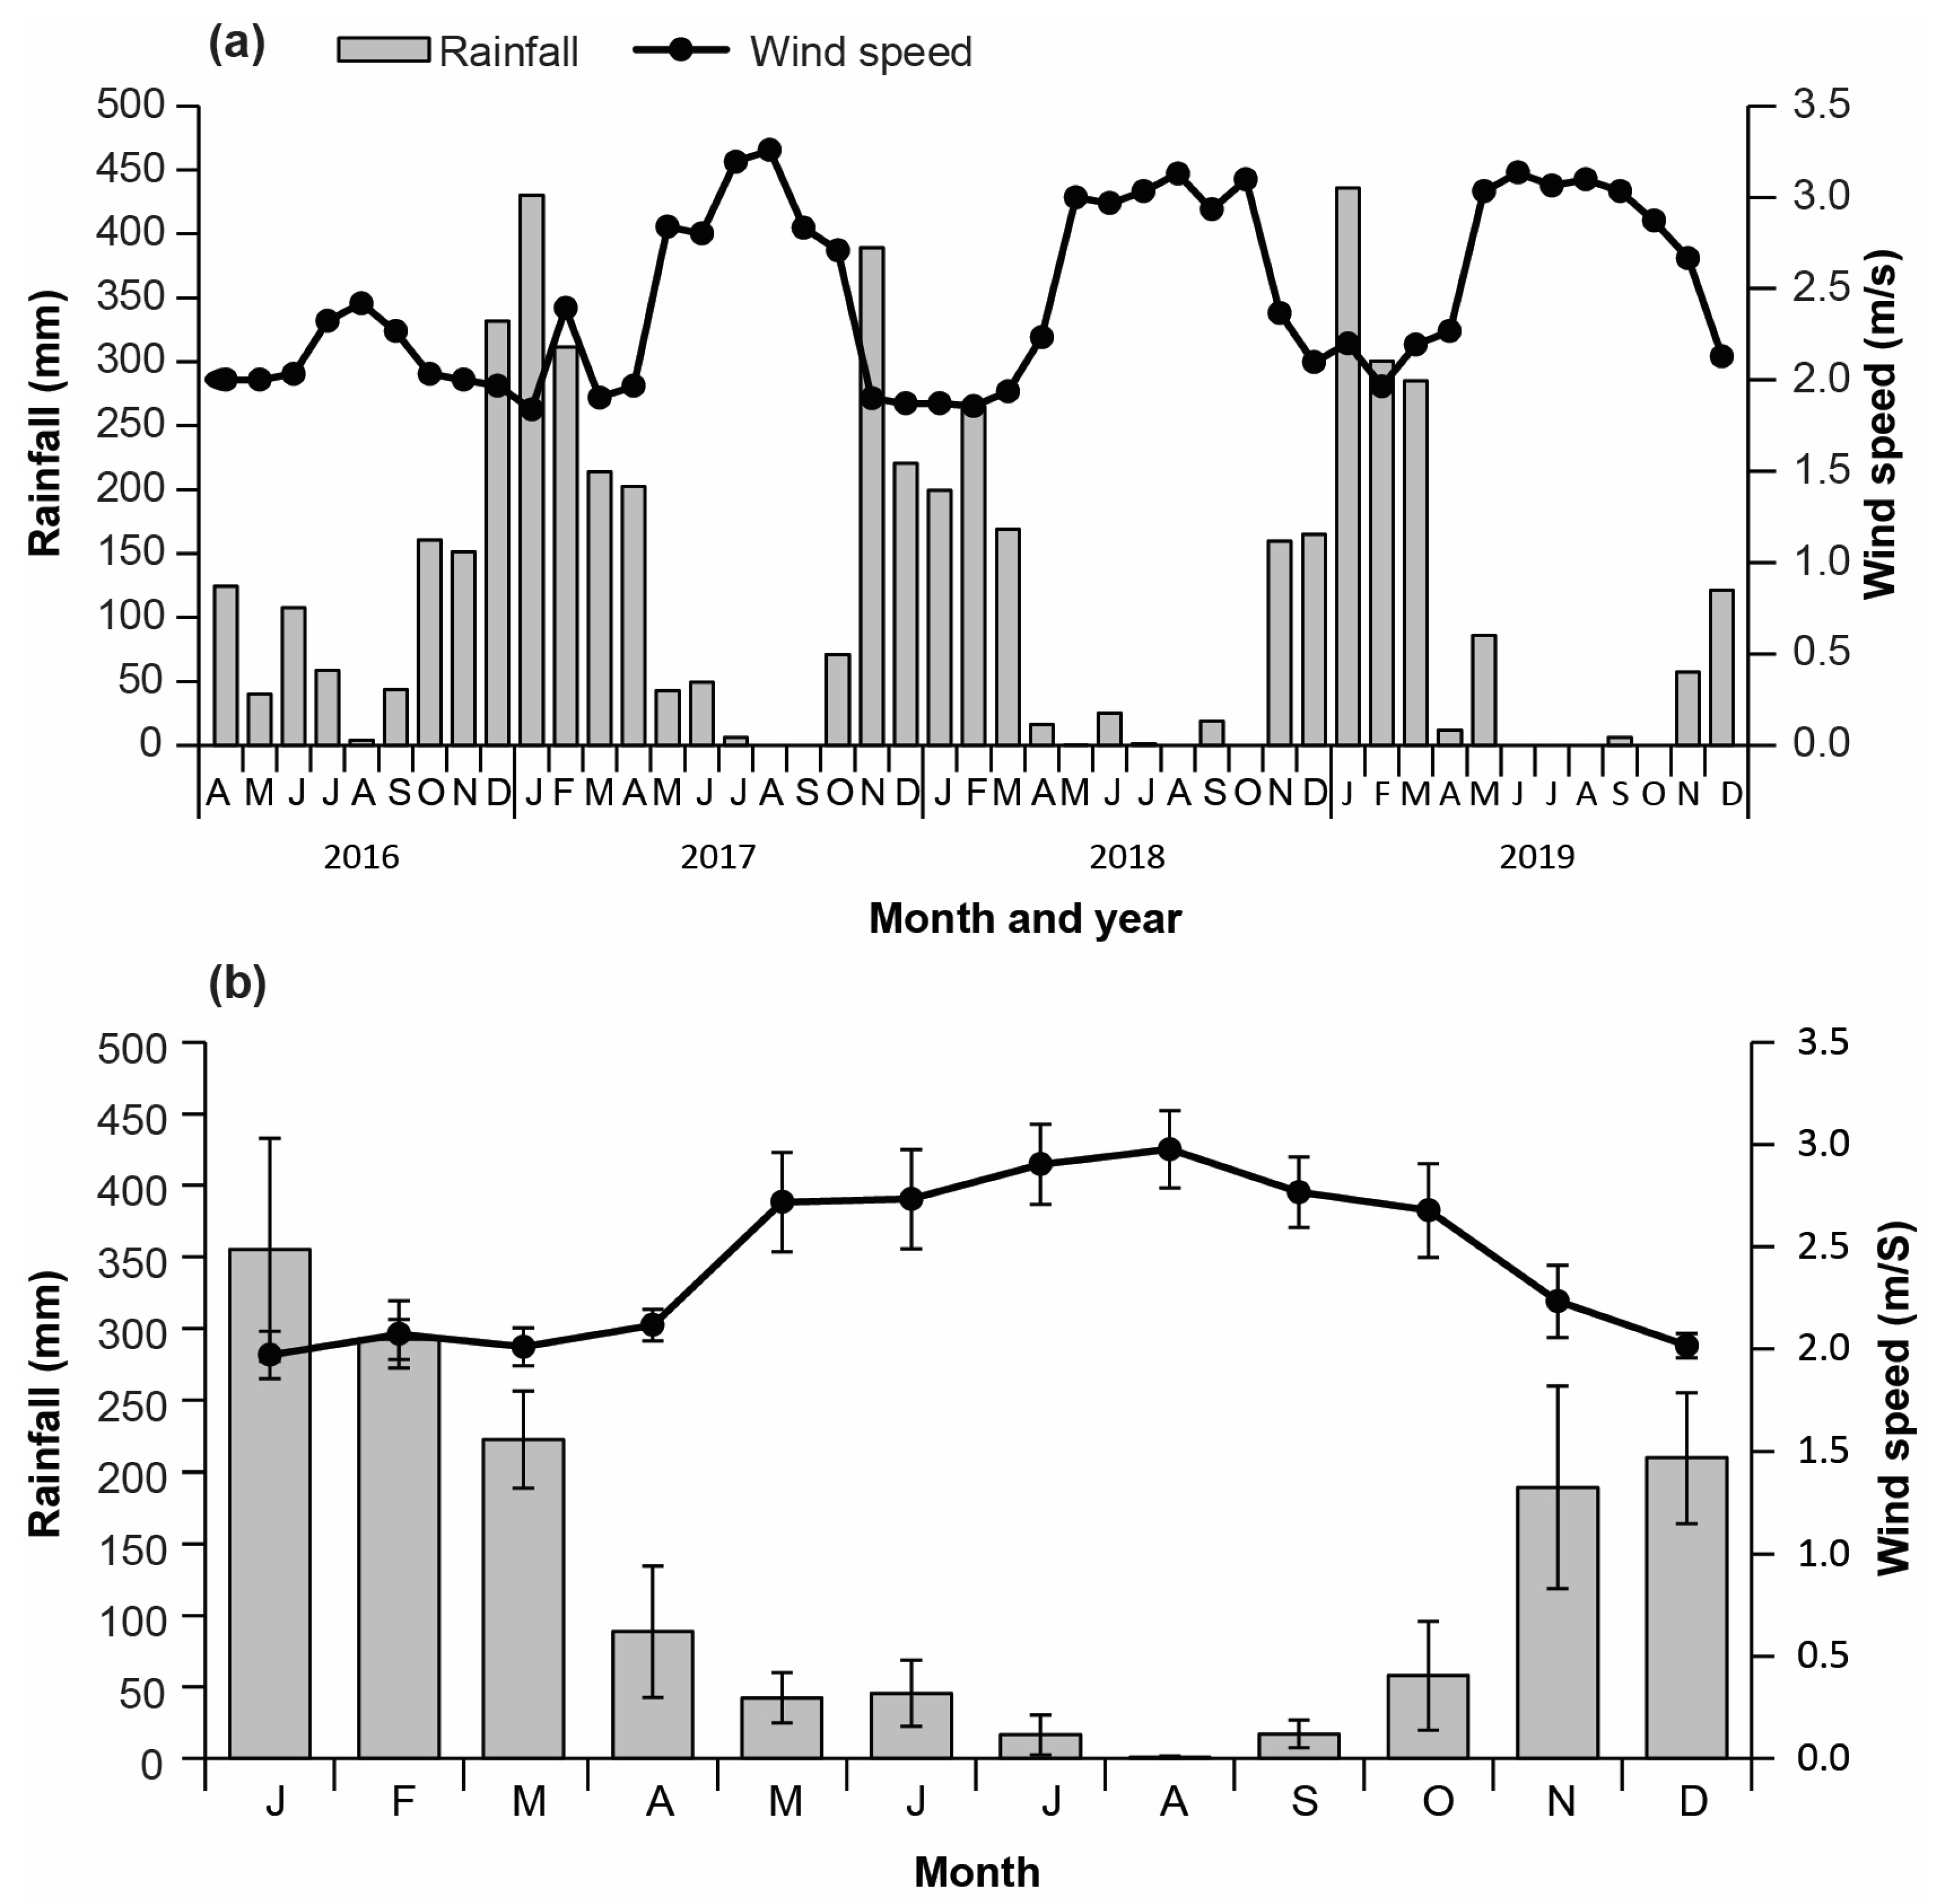
3.1. Climatic Conditions
3.2. Characteristics of Fishing Operations in Saleh Bay
3.2.1. Fishing Boat and Gear Characteristics
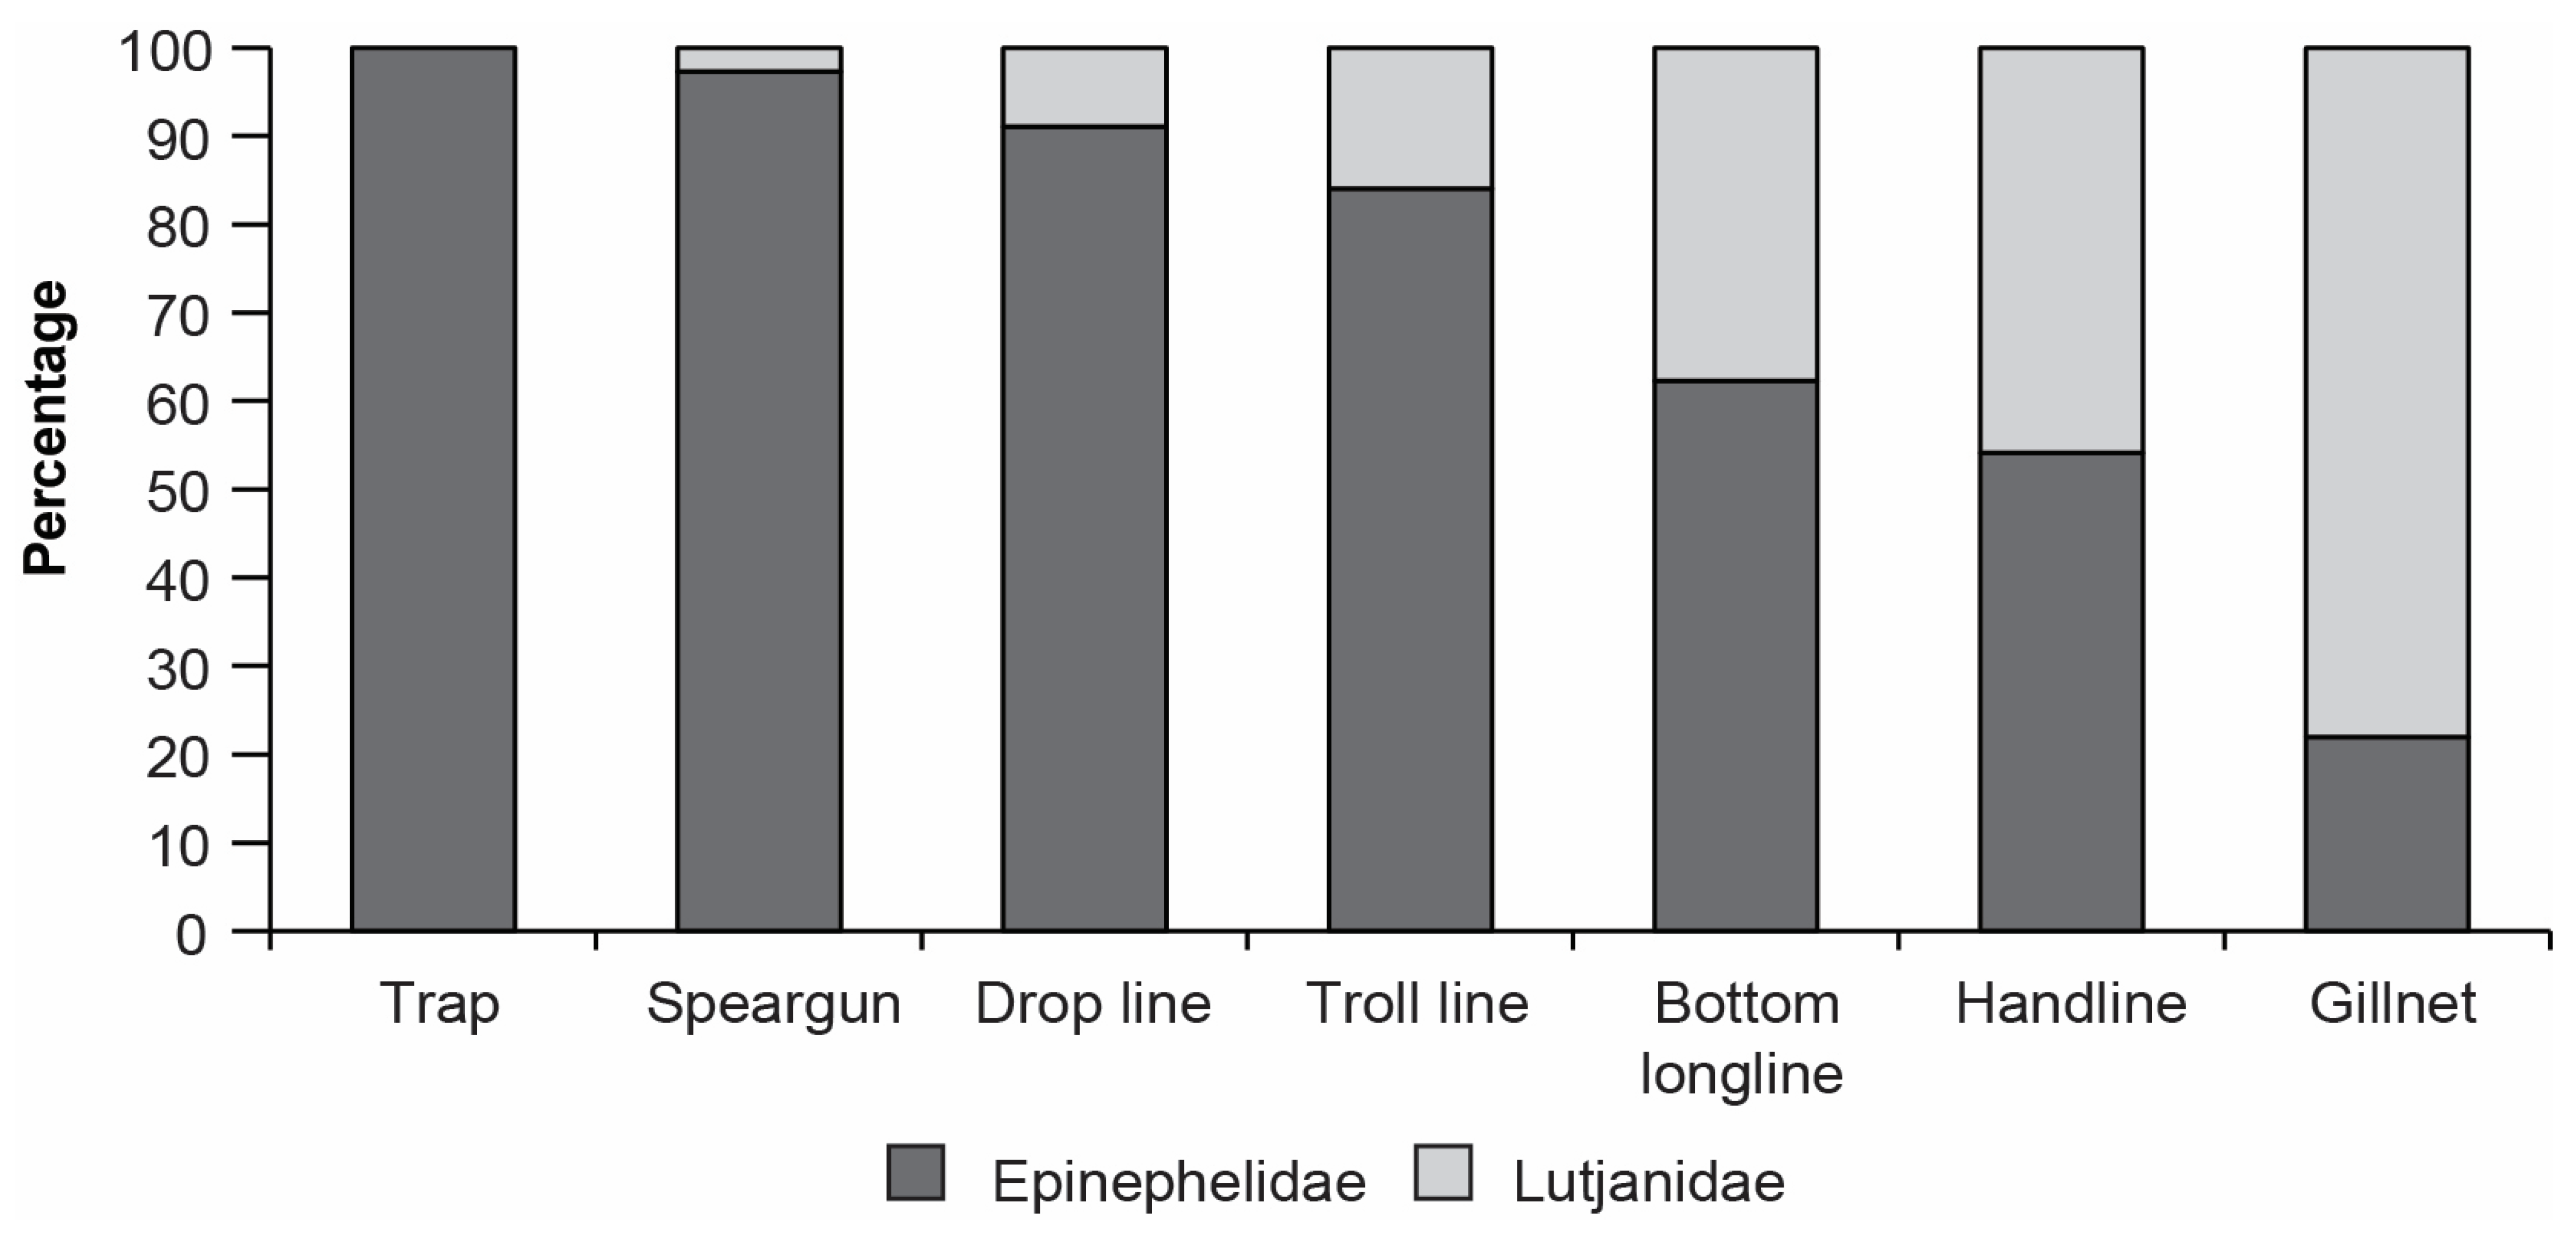
3.2.2. Overall Catch Composition
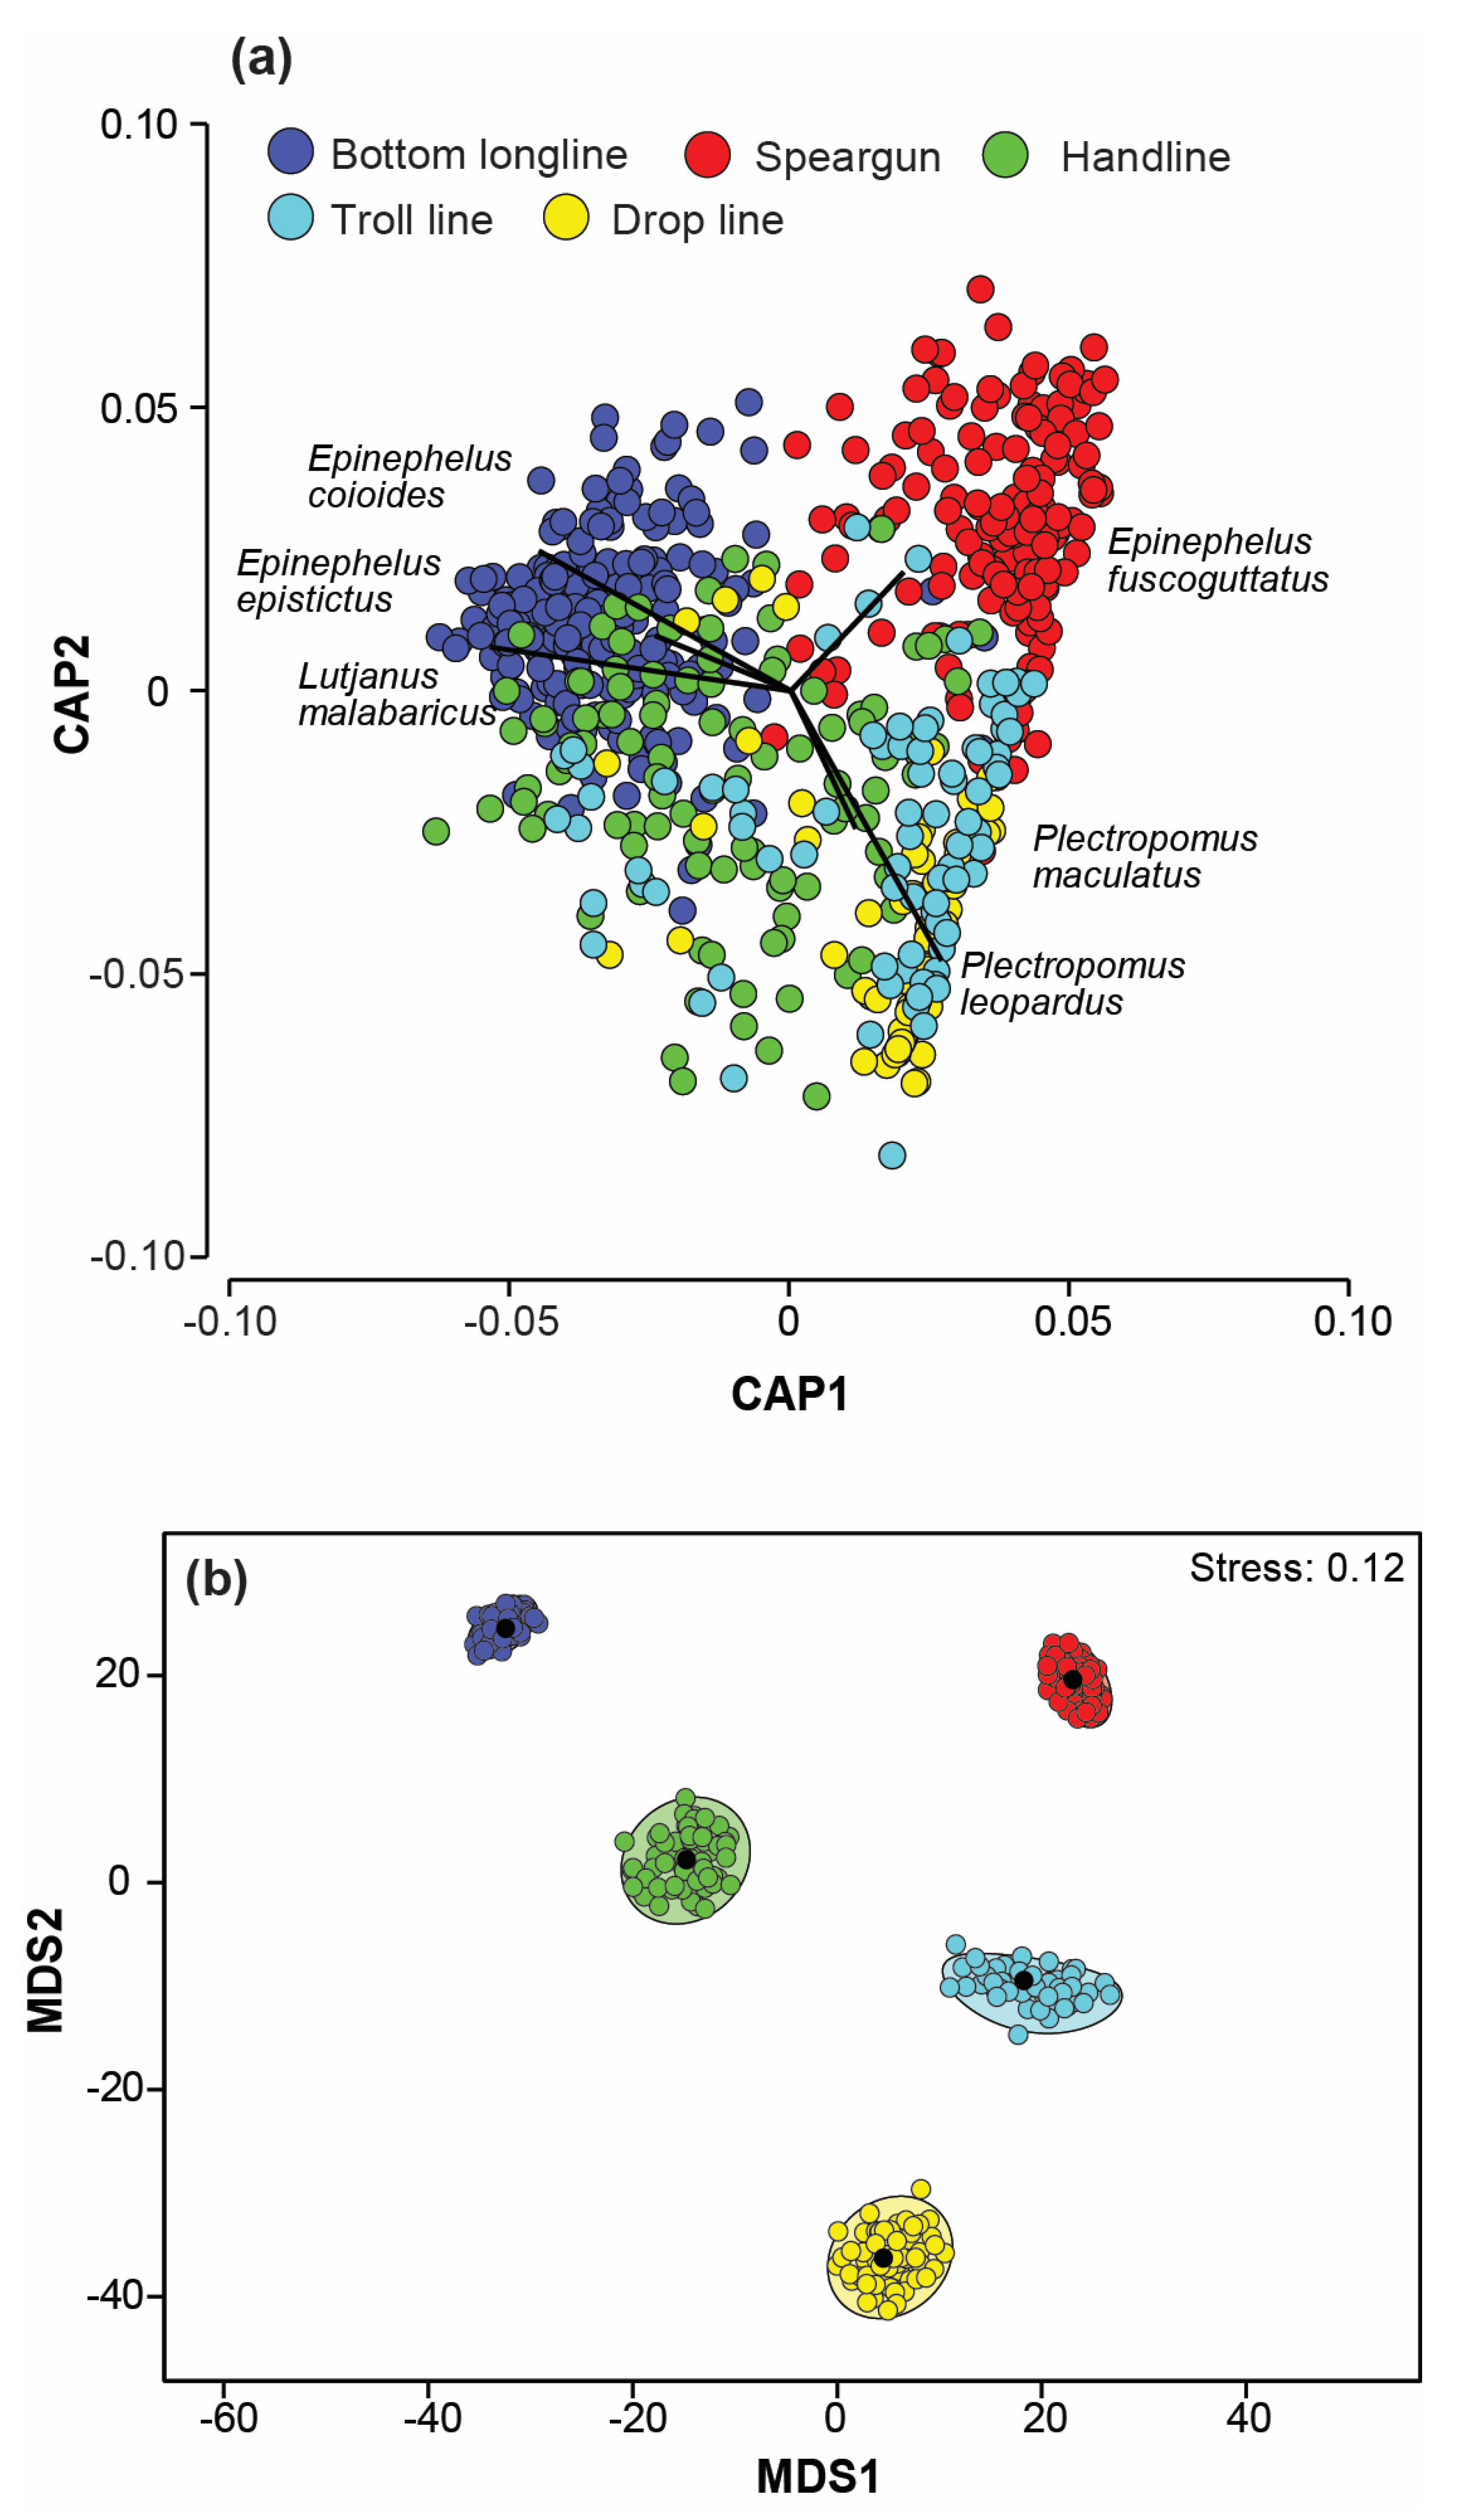
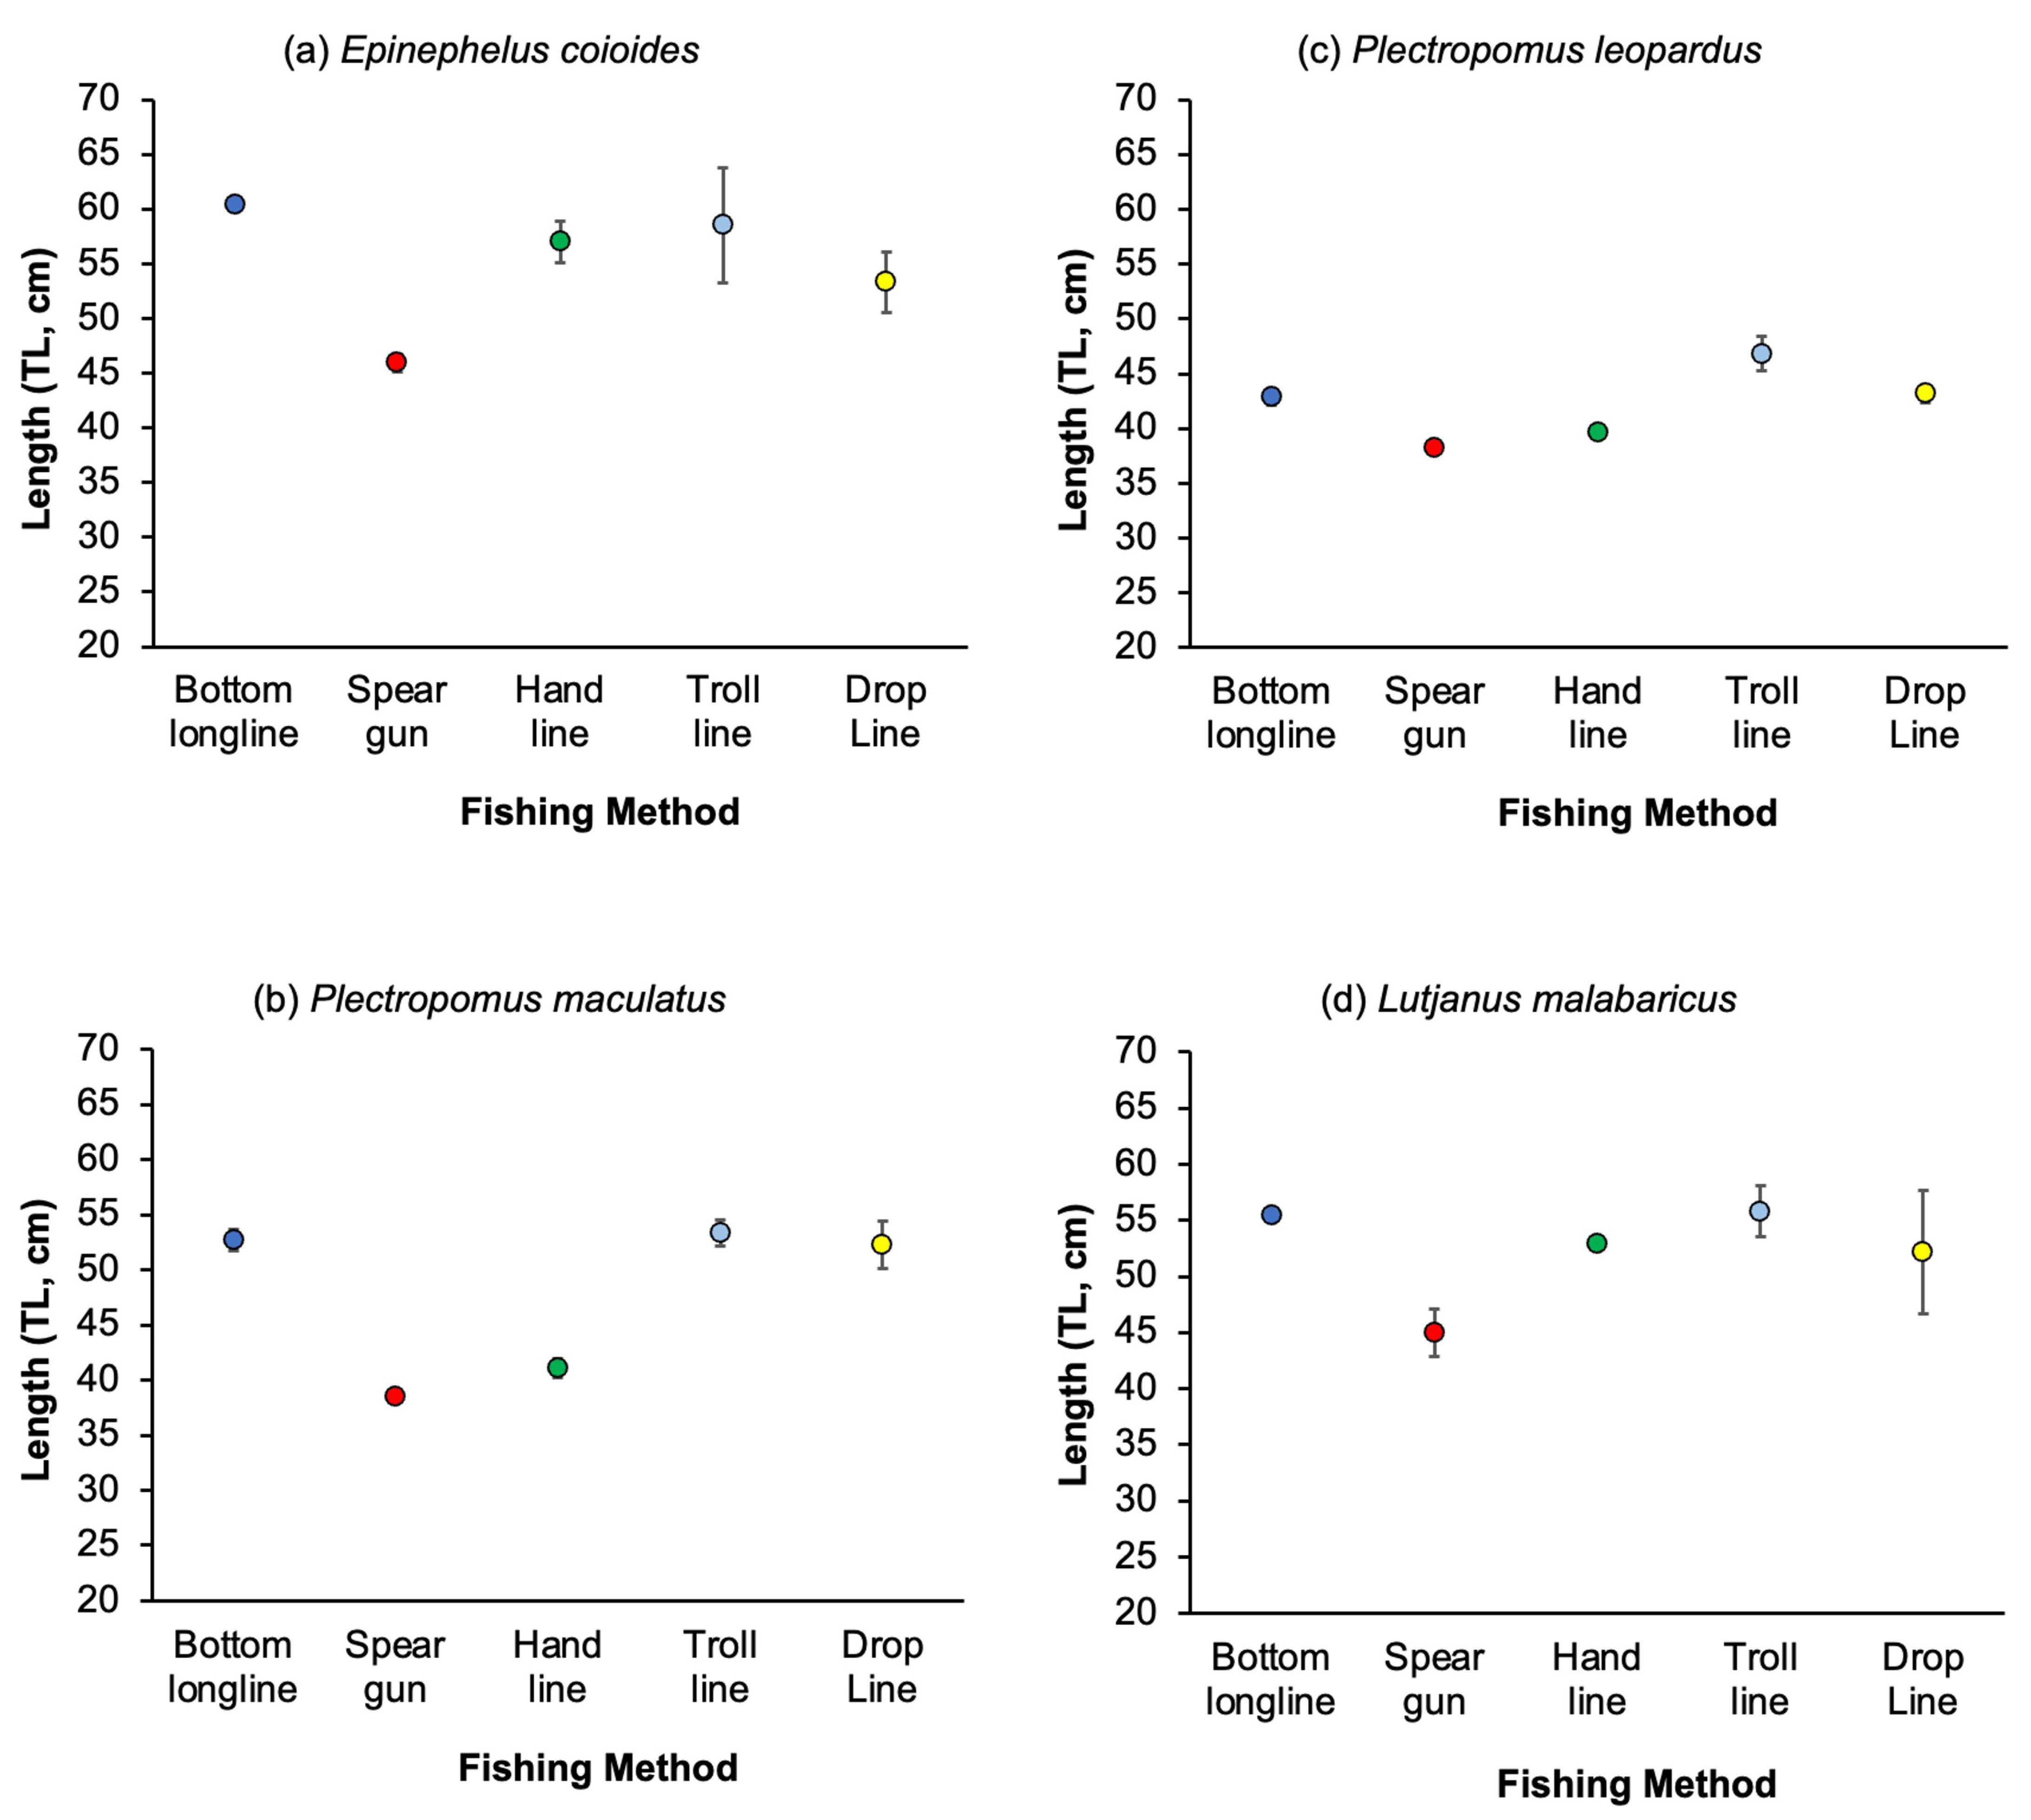
3.3. Variation in Catches among Fishing Methods
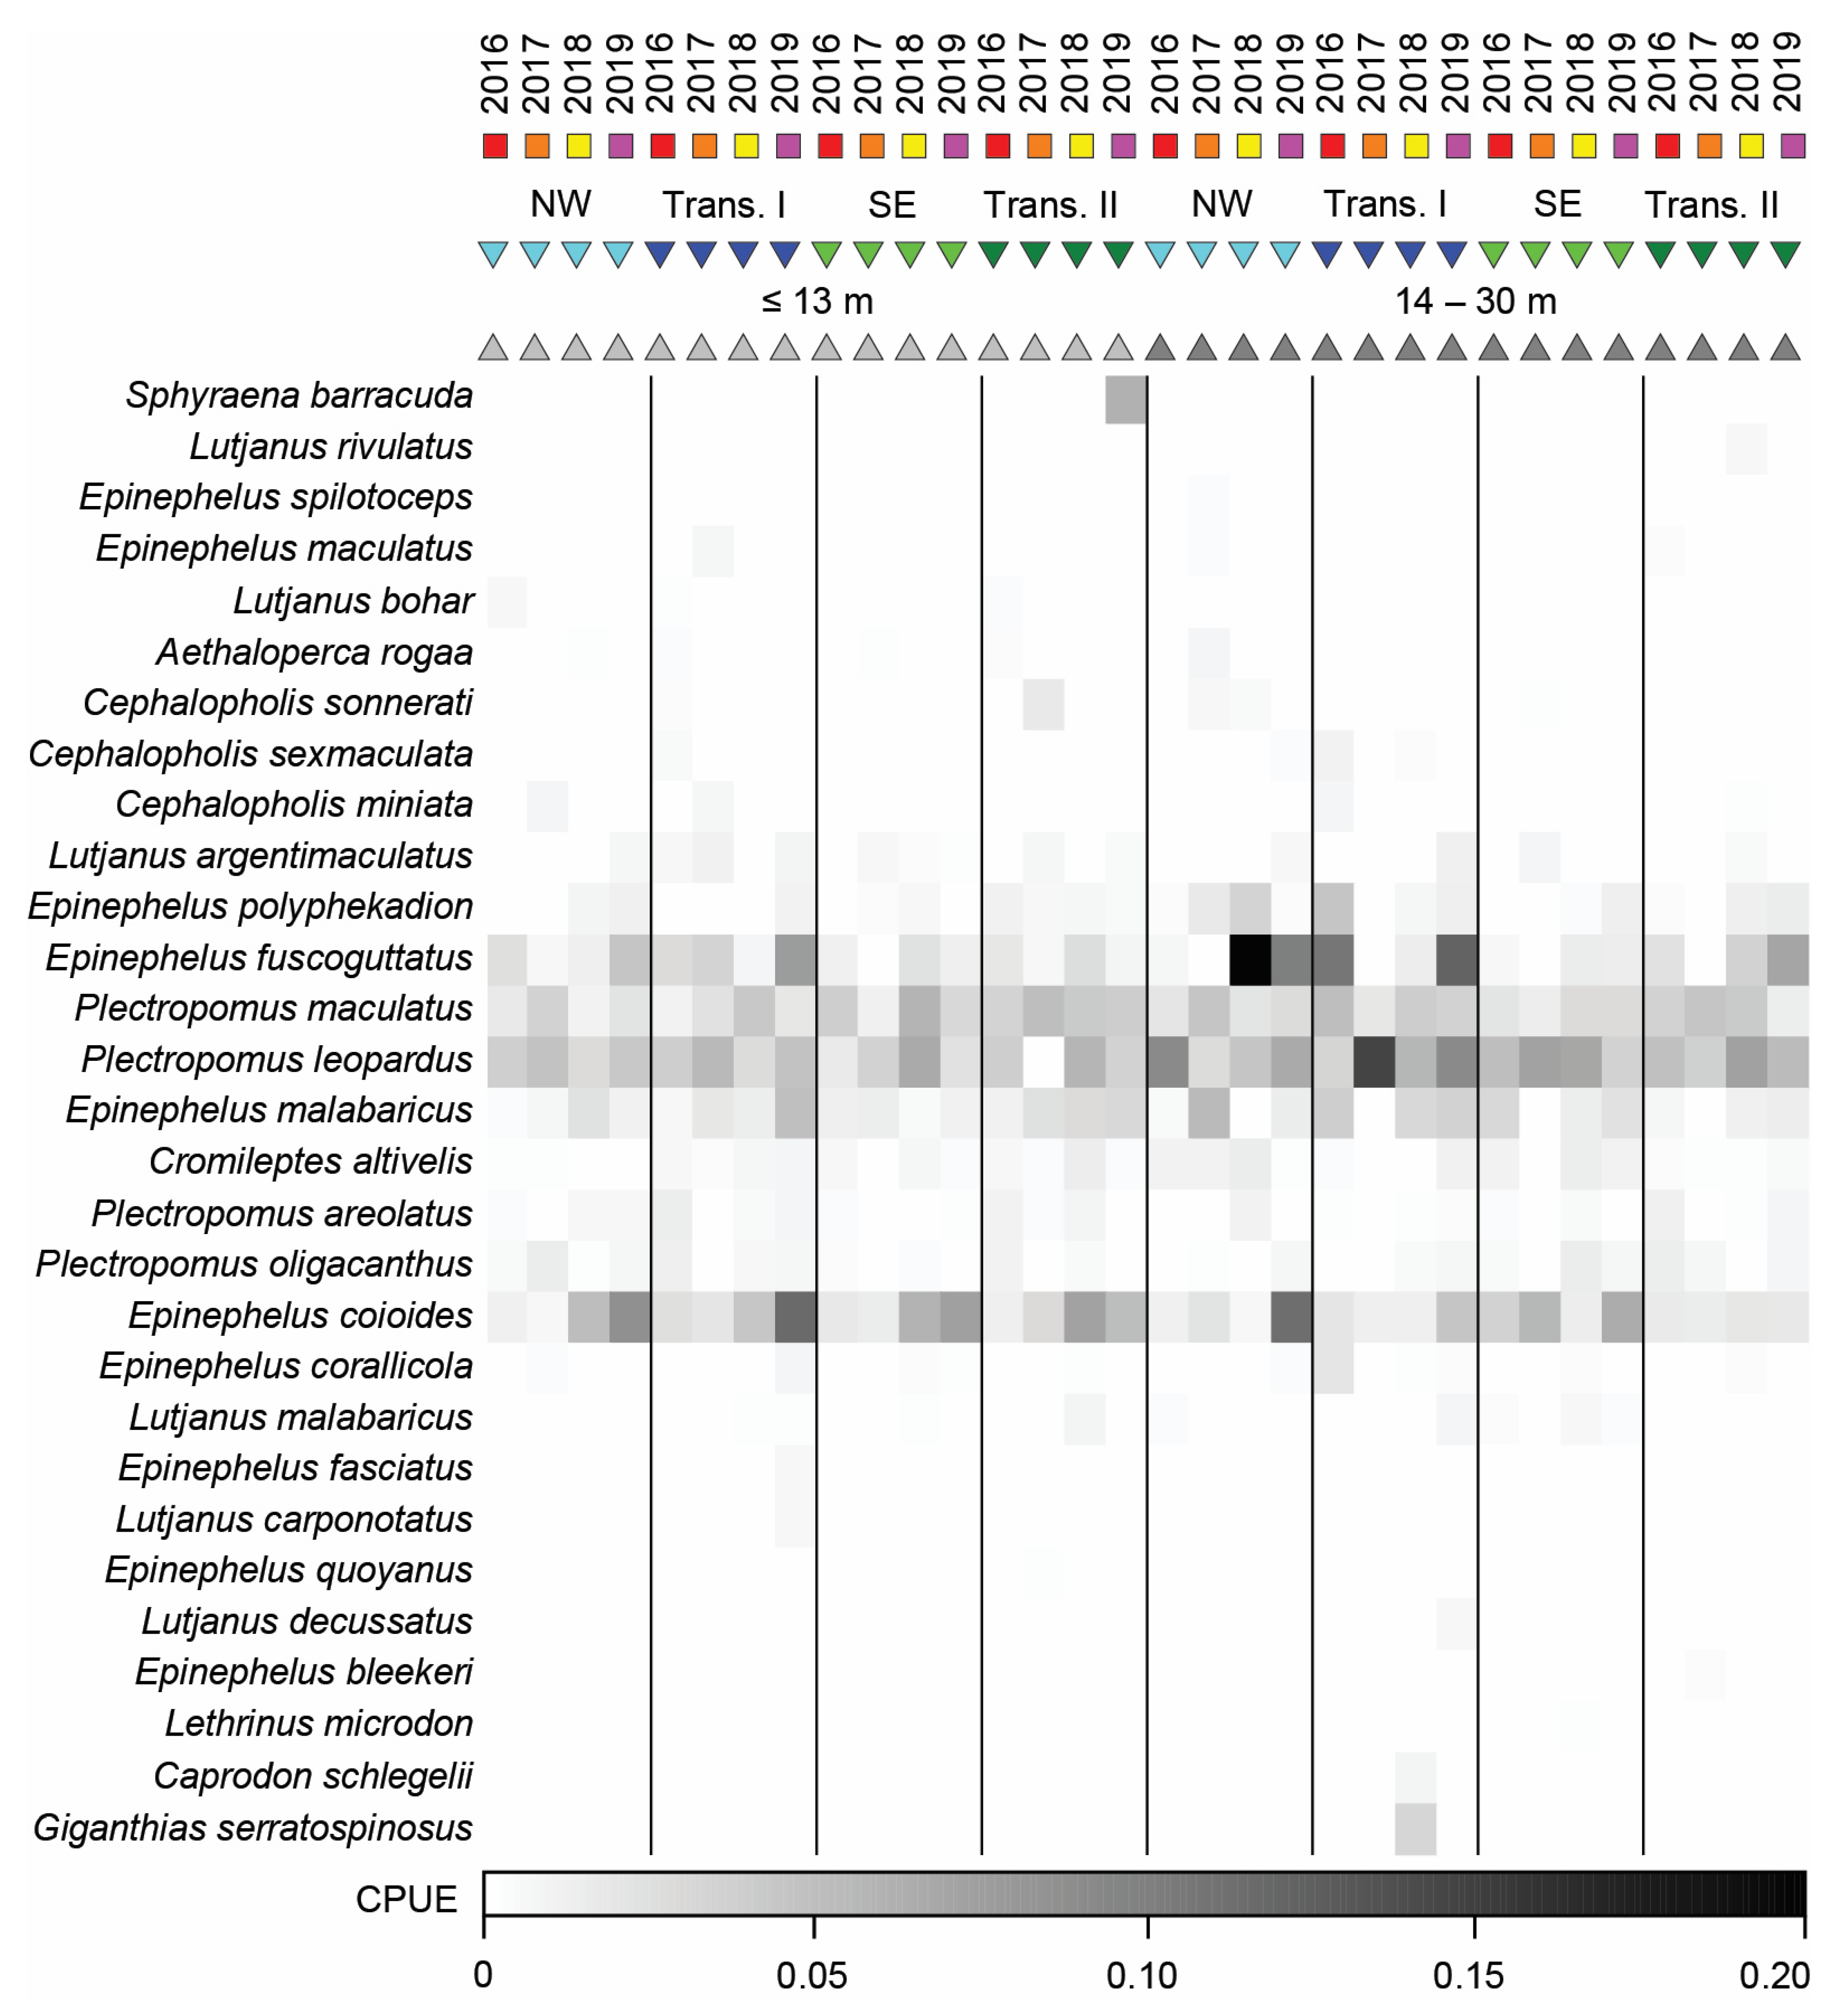
3.4. Variation in Catch Composition among Depths, Seasons, and/or Years
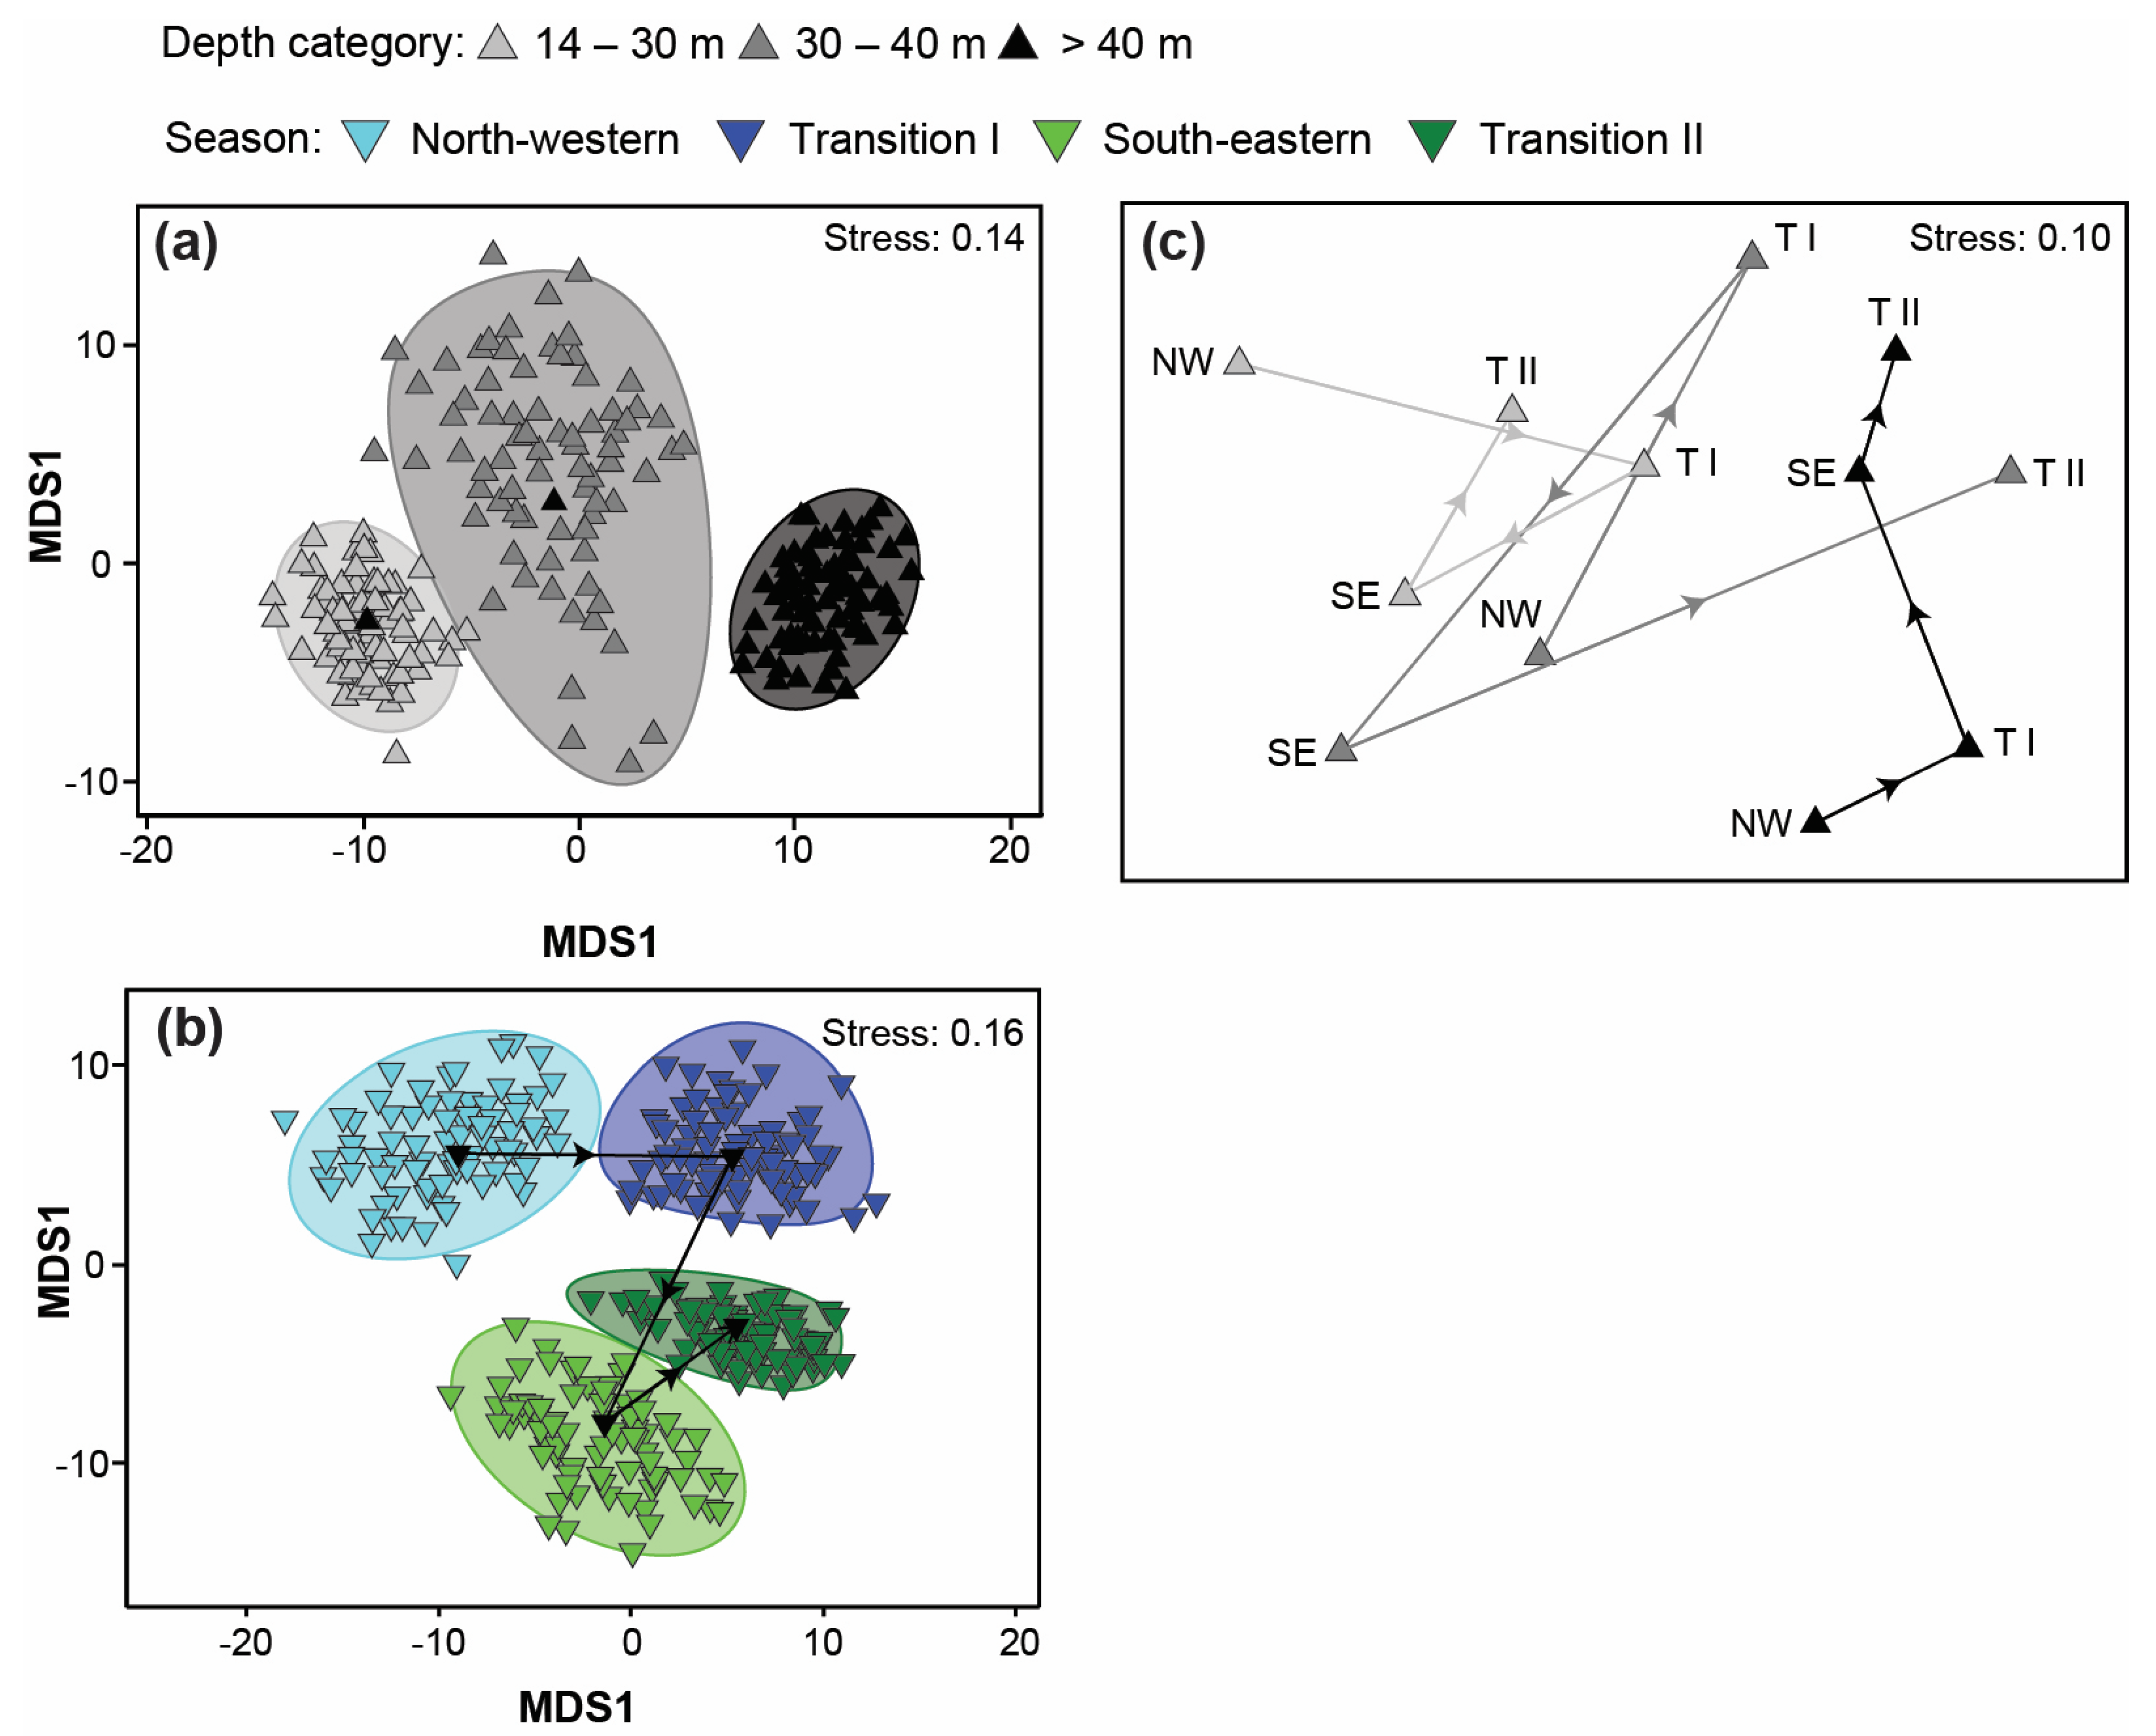
3.4.1. Bottom Longline
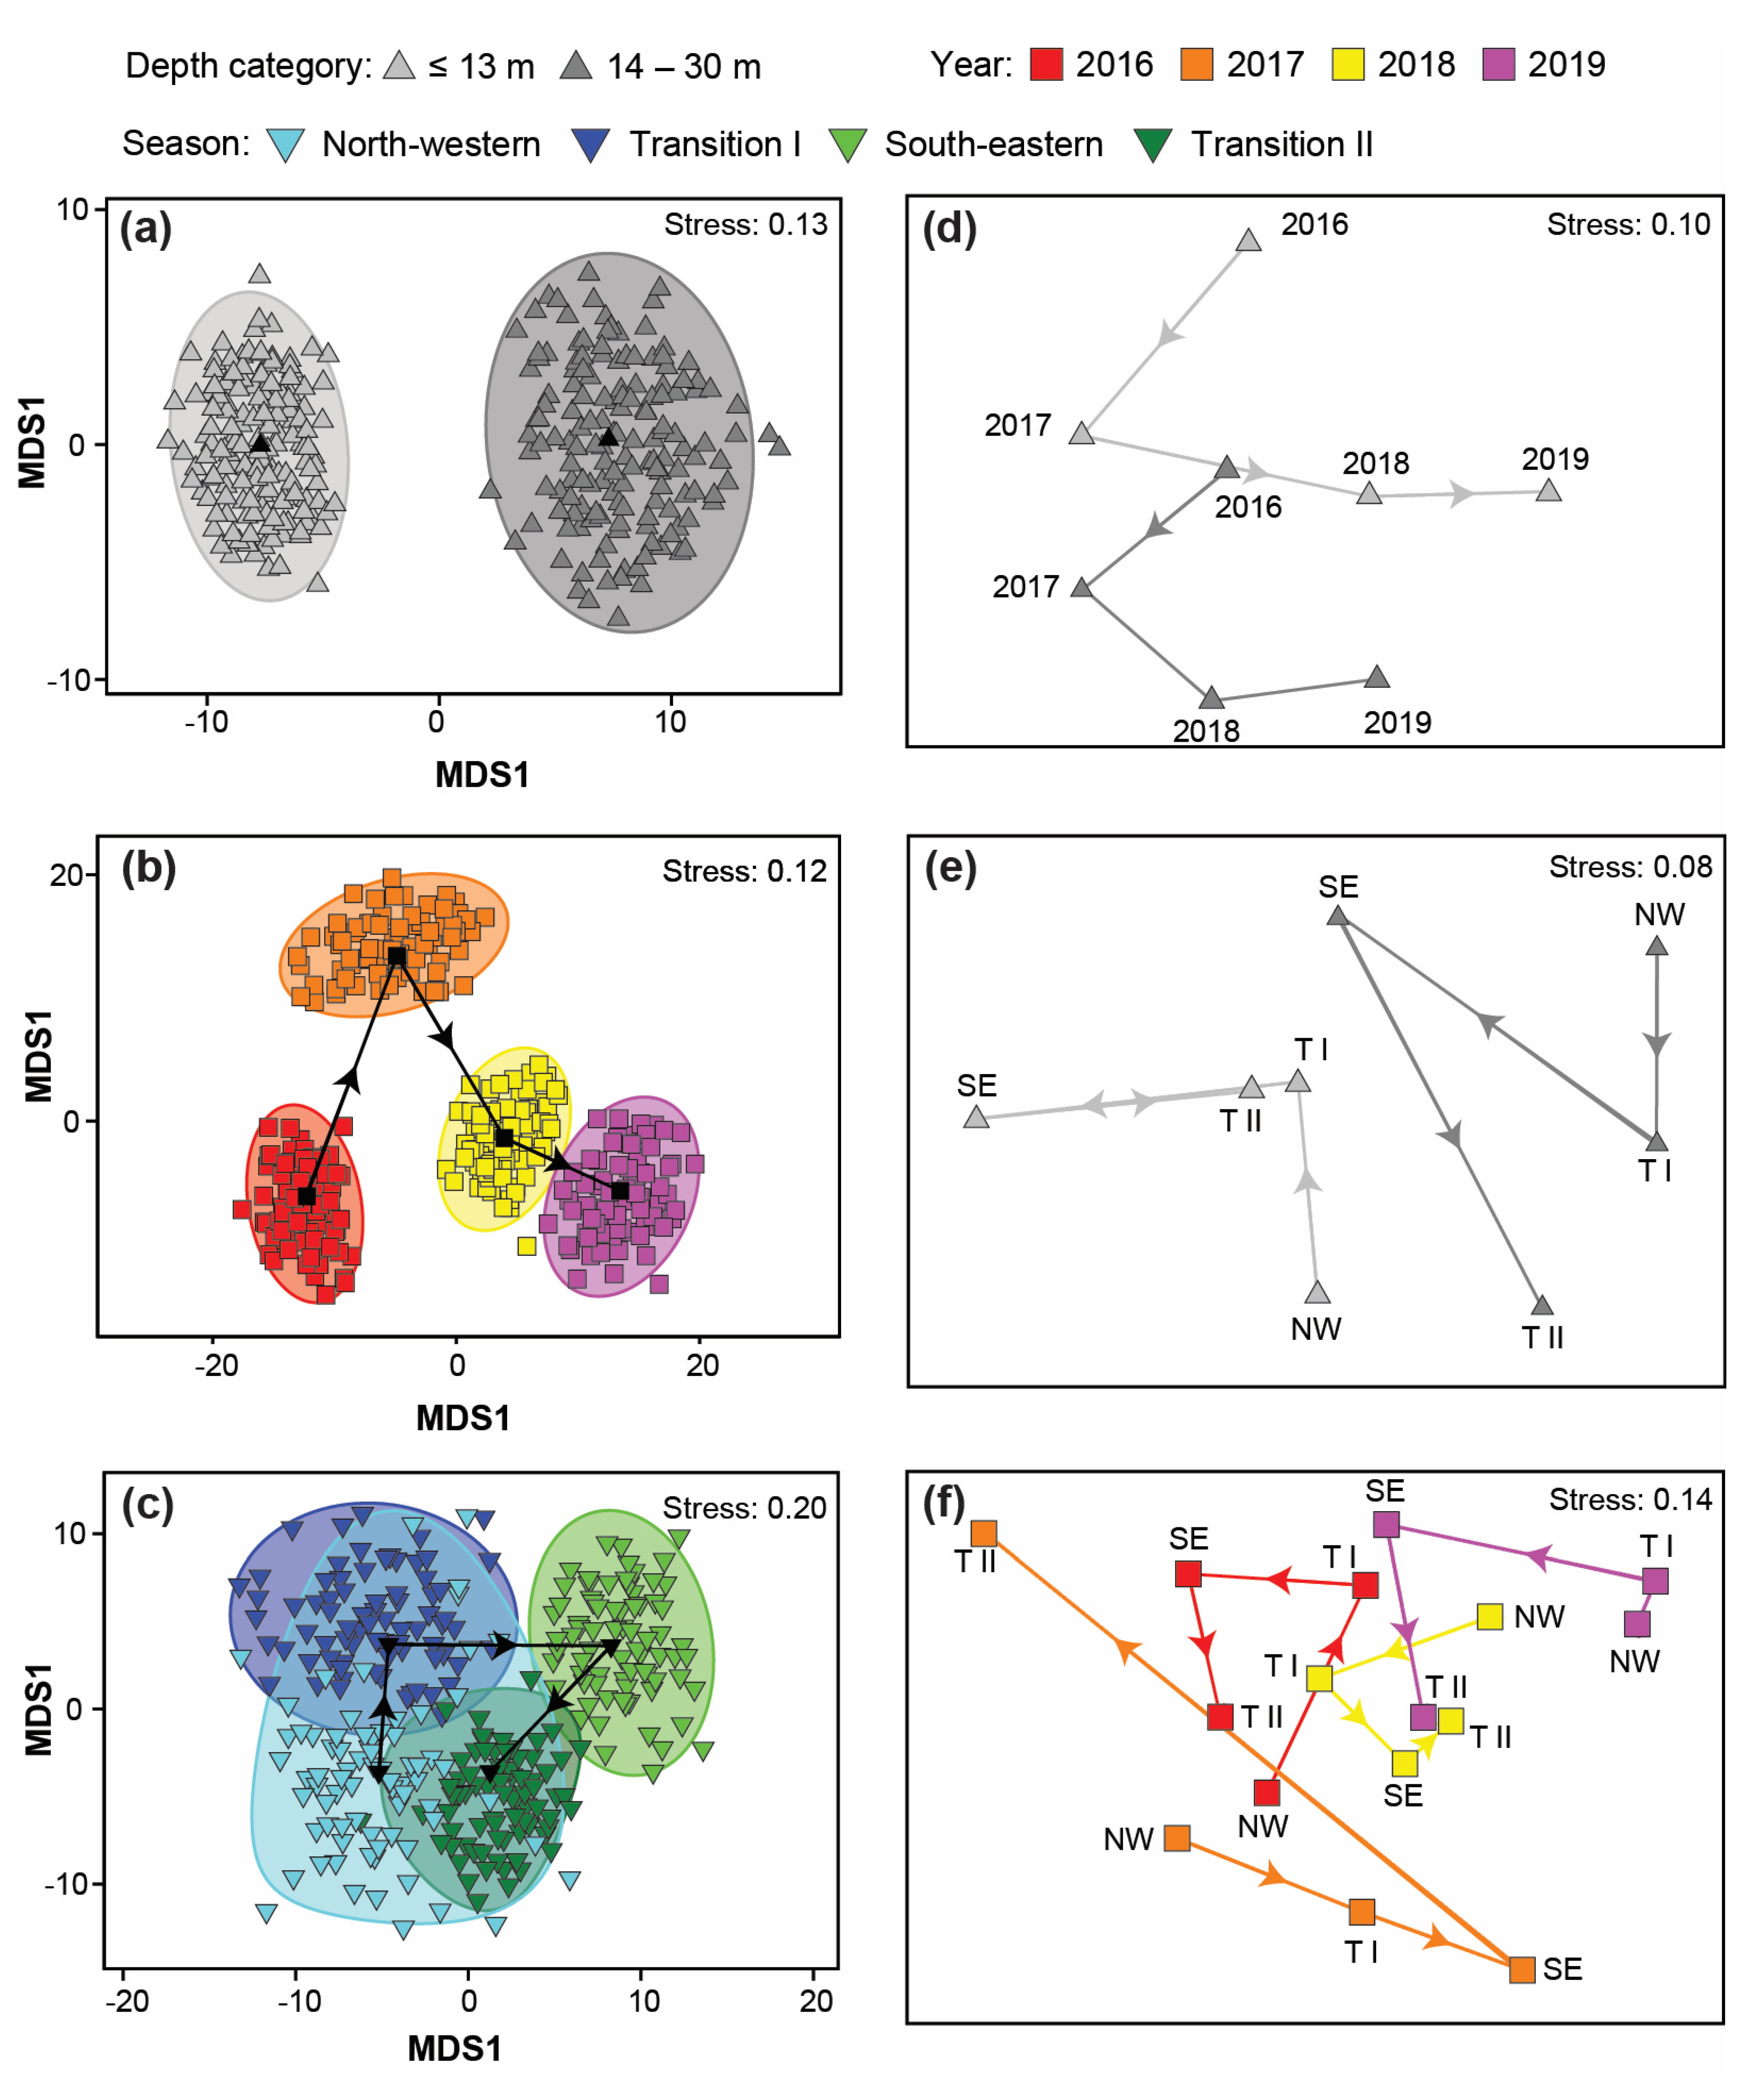
3.4.2. Speargun
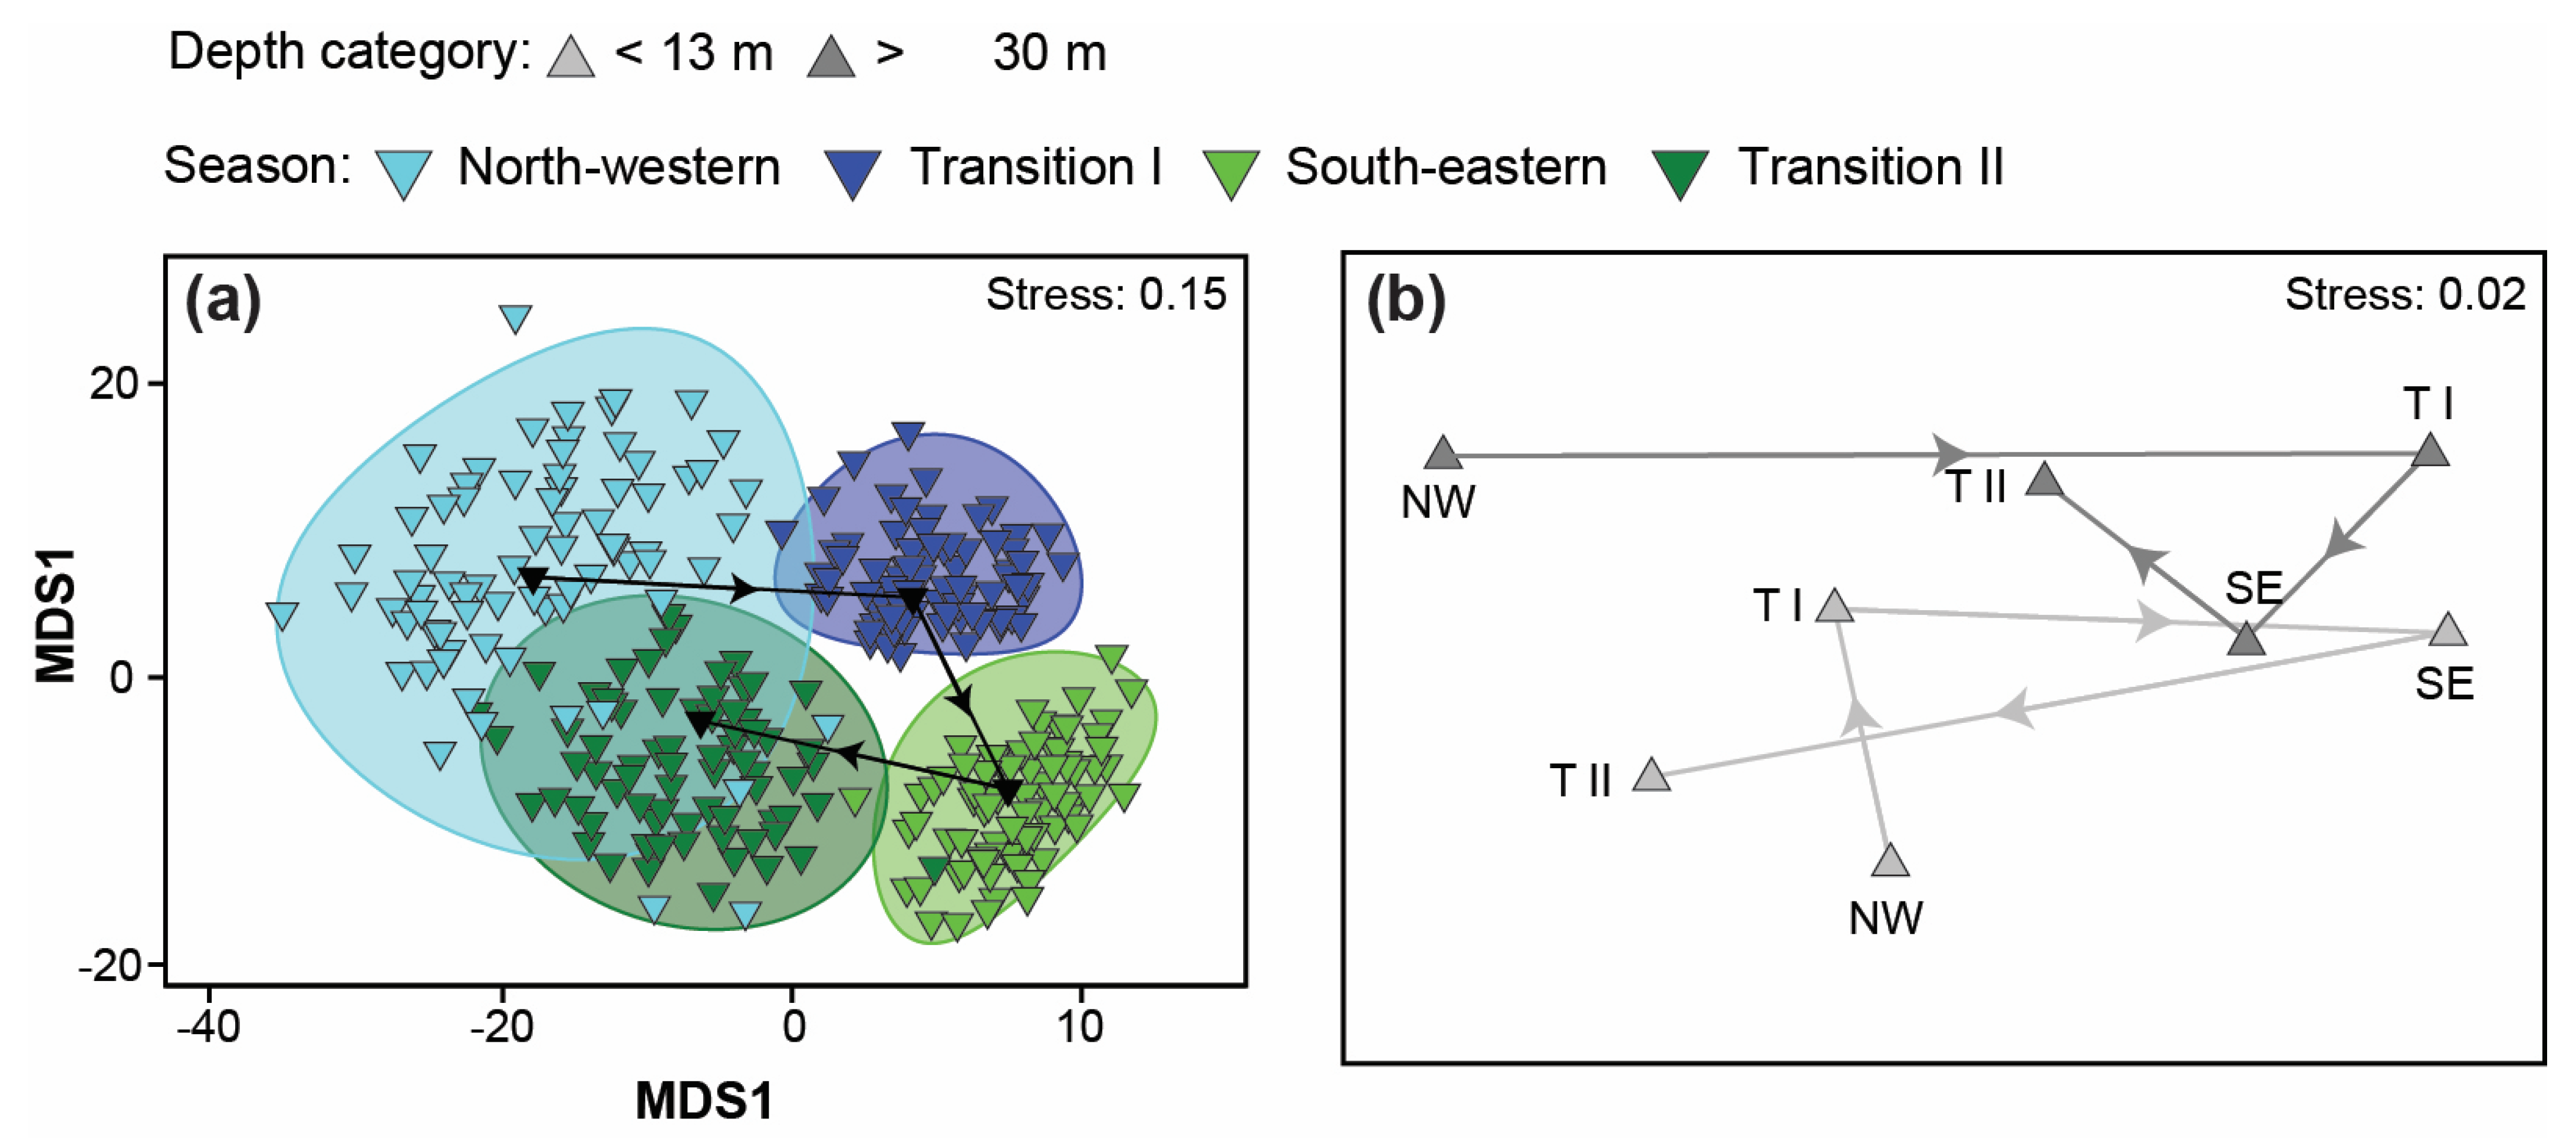
3.4.3. Handline
3.5. Factors Influencing the CPUE of the Four Main Species
4. Discussion
4.1. Fishing Fleet Characteristics
4.2. Variation of Catches among Fishing Methods
4.3. Fishing Tactics
4.4. Variation in Catch Composition among Depths, Season, and/or Years
4.5. Managing Complexity in Saleh Bay
5. Conclusions
Supplementary Materials
Author Contributions
Funding
Institutional Review Board Statement
Data Availability Statement
Acknowledgments
Conflicts of Interest
References
- FAO. The State of World Fisheries and Aquaculture 2020; FAO: Rome, Italy, 2020; ISBN 978-92-5-132692-3. [Google Scholar]
- Béné, C.; Arthur, R.; Norbury, H.; Allison, E.H.; Beveridge, M.; Bush, S.; Campling, L.; Leschen, W.; Little, D.; Squires, D.; et al. Contribution of Fisheries and Aquaculture to Food Security and Poverty Reduction: Assessing the Current Evidence. World Dev. 2016, 79, 177–196. [Google Scholar] [CrossRef]
- The World Bank. Hidden Harvest, the Global Contribution of Capture Fisheries; The World Bank: Washington DC, USA, 2012; p. 69. [Google Scholar]
- Kementerian Kelautan dan Perikanan. Strategi Pemanfaatan Perikanan (Interim Harvest Strategy) Kakap (snapper) di Wilayah Pengelolaan Perikanan Negara Republik Indonesia (WPPNRI) 713; Ditjen Perikanan Tangkap, Kementerian Kelautan dan Perikanan: Jakarta, Indonesia, 2020. [Google Scholar]
- Amorim, P.; Westmeyer, M. Snapper and Grouper: SFP Fisheries Sustainability Overview. 2015. Available online: http://sfpcms.sustainablefish.org.s3.amazonaws.com/2016/03/07/SFP_Sectoral_Report_Snappers_Groupers_Final-99f93c03-d0ade6ae.pdf (accessed on 16 July 2023).
- Rimmer, M.A.; Glamuzina, B. A Review of Grouper (Family Serranidae: Subfamily Epinephelinae) Aquaculture from a Sustainability Science Perspective. Rev. Aquac. 2019, 11, 58–87. [Google Scholar] [CrossRef]
- Amorim, P.; Sousa, P.; Jardim, E.; Menezes, G.M. Sustainability Status of Data-Limited Fisheries: Global Challenges for Snapper and Grouper. Front. Mar. Sci. 2019, 6, 654. [Google Scholar] [CrossRef]
- Halim, A.; Loneragan, N.R.; Wiryawan, B.; Hordyk, A.R.; Sondita, M.F.A.; Yulianto, I. Evaluating Data-Limited Fisheries for Grouper (Serranidae) and Snapper (Lutjanidae) in the Coral Triangle, Eastern Indonesia. Reg. Stud. Mar. Sci. 2020, 38, 101388. [Google Scholar] [CrossRef]
- Huliselan, N.V.; Wawo, M.; Tuapattinaja, M.A.; Sahetapy, D. Present Status of Grouper Fisheries at Waters of Kotania Bay, Western Seram District Maluku Province. IOP Conf. Ser. Earth Environ. Sci. 2017, 89, 012002. [Google Scholar] [CrossRef]
- Dimarchopoulou, D.; Mous, P.J.; Firmana, E.; Wibisono, E.; Coro, G.; Humphries, A.T. Exploring the Status of the Indonesian Deep Demersal Fishery Using Length-Based Stock Assessments. Fish. Res. 2021, 243, 106089. [Google Scholar] [CrossRef]
- Efendi, D.S.; Adrianto, L.; Yonvitner; Wardiatno, Y. An Evaluation of Grouper and Snapper Fisheries Management Policy in Saleh Bay, Indonesia. IOP Conf. Ser. Earth Environ. Sci. 2021, 744, 012013. [Google Scholar] [CrossRef]
- Khasanah, M.; Kadir, N.N.; Jompa, J. Reproductive Biology of Three Important Threatened/Near-Threatened Groupers (Plectropomus leopardus, Epinephelus polyphekadion and Plectropomus areolatus) in Eastern Indonesia and Implications for Management. Animals 2019, 9, 643. [Google Scholar] [CrossRef]
- Adhuri, D.S.; Rachmawati, L.; Sofyanto, H.; Hamilton-Hart, N. Green Market for Small People: Markets and Opportunities for Upgrading in Small-Scale Fisheries in Indonesia. Mar. Policy 2016, 63, 198–205. [Google Scholar] [CrossRef]
- FAO. Report of the Second Session of the Working Party on Small-Scale Fisheries: Bangkok, Thailand, 18–21 November 2003; FAO Fisheries Reports; Food and Agriculture Organization of the United Nations, Advisory Committee on Fisheries Research: Rome, Italy, 2004; ISBN 978-92-5-105099-6. [Google Scholar]
- Halim, A.; Wiryawan, B.; Loneragan, N.R.; Hordyk, A.; Sondita, M.F.A.; White, A.T.; Koeshendrajana, S.; Ruchimat, T.; Pomeroy, R.S.; Yuni, C. Developing a Functional Definition of Small-Scale Fisheries in Support of Marine Capture Fisheries Management in Indonesia. Mar. Policy 2019, 100, 238–248. [Google Scholar] [CrossRef]
- Lindkvist, E.; Wijermans, N.; Daw, T.M.; Gonzalez-Mon, B.; Giron-Nava, A.; Johnson, A.F.; van Putten, I.; Basurto, X.; Schlüter, M. Navigating Complexities: Agent-Based Modeling to Support Research, Governance, and Management in Small-Scale Fisheries. Front. Mar. Sci. 2020, 6, 733. [Google Scholar] [CrossRef]
- Roditi, K.; Vafidis, D. Small-Scale Fisheries in the South Aegean Sea: Métiers and Associated Economics. Ocean Coast. Manag. 2022, 224, 106185. [Google Scholar] [CrossRef]
- Smith, H.; Basurto, X. Defining Small-Scale Fisheries and Examining the Role of Science in Shaping Perceptions of Who and What Counts: A Systematic Review. Front. Mar. Sci. 2019, 6, 236. [Google Scholar] [CrossRef]
- Patrick, W.S.; Link, J.S. Myths That Continue to Impede Progress in Ecosystem-Based Fisheries Management. Fisheries 2015, 40, 155–160. [Google Scholar] [CrossRef]
- Van Putten, I.E.; Kulmala, S.; Thébaud, O.; Dowling, N.; Hamon, K.G.; Hutton, T.; Pascoe, S. Theories and Behavioural Drivers Underlying Fleet Dynamics Models: Theories and Behavioural Drivers. Fish Fish. 2012, 13, 216–235. [Google Scholar] [CrossRef]
- Selgrath, J.C.; Gergel, S.E.; Vincent, A.C.J. Incorporating Spatial Dynamics Greatly Increases Estimates of Long-Term Fishing Effort: A Participatory Mapping Approach. ICES J. Mar. Sci. 2018, 75, 210–220. [Google Scholar] [CrossRef]
- Roditi, K.; Vafidis, D. Net Fisheries’ Métiers in the Eastern Mediterranean: Insights for Small-Scale Fishery Management on Kalymnos Island. Water 2019, 11, 1509. [Google Scholar] [CrossRef]
- Birchenough, S.E.; Cooper, P.A.; Jensen, A.C. Vessel Monitoring Systems as a Tool for Mapping Fishing Effort for a Small Inshore Fishery Operating within a Marine Protected Area. Mar. Policy 2021, 124, 104325. [Google Scholar] [CrossRef]
- Thiault, L.; Collin, A.; Chlous, F.; Gelcich, S.; Claudet, J. Combining Participatory and Socioeconomic Approaches to Map Fishing Effort in Small-Scale Fisheries. PLoS ONE 2017, 12, e0176862. [Google Scholar] [CrossRef]
- Metcalfe, K.; Collins, T.; Abernethy, K.E.; Boumba, R.; Dengui, J.; Miyalou, R.; Parnell, R.J.; Plummer, K.E.; Russell, D.J.F.; Safou, G.K.; et al. Addressing Uncertainty in Marine Resource Management; Combining Community Engagement and Tracking Technology to Characterize Human Behavior. Conserv. Lett. 2017, 10, 460–469. [Google Scholar] [CrossRef]
- Ziegler, P.E. Fishing Tactics and Fleet Structure of the Small-Scale Coastal Scalefish Fishery in Tasmania, Australia. Fish. Res. 2012, 134–136, 52–63. [Google Scholar] [CrossRef]
- Arlinghaus, R.; Alós, J.; Beardmore, B.; Daedlow, K.; Dorow, M.; Fujitani, M.; Hühn, D.; Haider, W.; Hunt, L.M.; Johnson, B.M.; et al. Understanding and Managing Freshwater Recreational Fisheries as Complex Adaptive Social-Ecological Systems. Rev. Fish. Sci. Aquac. 2017, 25, 1–41. [Google Scholar] [CrossRef]
- Ndarathi, J.; Munga, C.; Hugé, J.; Dahdouh-Guebas, F. A Socio-Ecological System Perspective on Trade Interactions within Artisanal Fisheries in Coastal Kenya. West Ind. Oc. J Mar. Sci. 2021, 19, 29–43. [Google Scholar] [CrossRef]
- Obregón, C.; Admiraal, R.; Van Putten, I.; Hughes, M.; Tweedley, J.R.; Loneragan, N.R. Who You Speak to Matters: Information Sharing and the Management of a Small-Scale Fishery. Front. Mar. Sci. 2020, 7, 578014. [Google Scholar] [CrossRef]
- Jentoft, S.; Chuenpagdee, R. Assessing Governability of Small-Scale Fisheries. In Interactive Governance for Small-Scale Fisheries: Global Reflections; MARE Publication Series; Springer International Publishing: Cham, Switzerland, 2015; pp. 17–35. ISBN 978-3-319-17033-6. [Google Scholar]
- Obregón, C.; Tweedley, J.R.; Loneragan, N.R.; Hughes, M. Different but Not Opposed: Perceptions between Fishing Sectors on the Status and Management of a Crab Fishery. ICES J. Mar. Sci. 2020, 77, 2354–2368. [Google Scholar] [CrossRef]
- Salas, S.; Gaertner, D. The Behavioural Dynamics of Fishers: Management Implications. Fish Fish. 2004, 5, 153–167. [Google Scholar] [CrossRef]
- Poos, J.-J.; Rijnsdorp, A.D. An “Experiment” on Effort Allocation of Fishing Vessels: The Role of Interference Competition and Area Specialization. Can. J. Fish. Aquat. Sci. 2007, 64, 304–313. [Google Scholar] [CrossRef]
- Turner, R.A.; Polunin, N.V.C.; Stead, S.M. Social Networks and Fishers’ Behavior: Exploring the Links between Information Flow and Fishing Success in the Northumberland Lobster Fishery. Ecol. Soc. 2014, 19, art38. [Google Scholar] [CrossRef]
- Pelletier, D.; Ferraris, J. A Multivariate Approach for Defining Fishing Tactics from Commercial Catch and Effort Data. Can. J. Fish. Aquat. Sci. 2000, 57, 51–65. [Google Scholar] [CrossRef]
- Christensen, A.-S.; Raakj, J. Fishermen’s Tactical and Strategic Decisions A Case Study of Danish Demersal Fisheries. Fish. Res. 2006, 81, 258–267. [Google Scholar] [CrossRef]
- Kementerian Kelautan dan Perikanan Basis Data Volume Produksi Perikanan Tangkap per Provinsi (Ton). Available online: https://statistik.kkp.go.id/home.php (accessed on 17 October 2023).
- Yulianto, I.; Kartawijaya, T.; Rafandi, M.T.; Agustina, S.; Pingkan, J.; Aminollah; Nurjamil; Sabariyono; Widodo; Ramadhan, S.; et al. Profil Perikanan Tangkap di Teluk Saleh dan Teluk Cempi Provinsi Nusa Tenggara Barat; Dinas Kelautan dan Perikanan Provinsi Nusa Tenggara Barat dan Wildlife Conservation Society: Bogor, Indonesia, 2016. [Google Scholar]
- Retnoningtyas, H.; Yulianto, I.; Soemodinoto, A.; Herdiana, Y.; Kartawijaya, T.; Natsir, M.; Haryanto, J.T. Stakeholder Participation in Management Planning for Grouper and Snapper Fisheries in West Nusa Tenggara Province, Indonesia. Mar. Policy 2021, 128, 104452. [Google Scholar] [CrossRef]
- Herdiana, Y.; Wiryawan, B.; Wisudo, S.H.; Tweedley, J.R.; Yulianto, I.; Natsir, M.; Agustina, S.; Hordyk, A.; Loneragan, N.R. Application of the Method Evaluation and Risk Assessment Tool for a Small-Scale Grouper Fishery in Indonesia. Fishes 2023, 8, 498. [Google Scholar] [CrossRef]
- Yulius, Y.; Ramdhan, M.; Ardiansyah, A. Karakteristik Pasang Surut Dan Gelombang Di Perairan Teluk Saleh, Nusa Tenggara Barat. Segara 2018, 14, 117. [Google Scholar] [CrossRef]
- Badan Meteorologi, Klimatologi, dan Geofisika Data Online, Pusat Database—BMKG 2021. Available online: https://dataonline.bmkg.go.id/home (accessed on 31 December 2021).
- Clarke, K.R.; Gorley, R.N. PRIMER v7: User Manual/Tutorial; PRIMER-E: Plymouth, UK, 2015. [Google Scholar]
- Clarke, K.R.; Gorley, R.N.; Somerfield, P.J.; Warwick, R.M. Change in Marine Communities: An Approach to Statistical Analysis and Interpretation; PRIMER-E: Plymouth, UK, 2014. [Google Scholar]
- Anderson, M.J.; Gorley, R.N.; Clarke, K.R. Guide to Software and Statistical Methods; PRIMER-E: Plymouth, UK, 2008. [Google Scholar]
- Crisp, J.A.; Loneragan, N.R.; Tweedley, J.R.; D’Souza, F.M.L.; Poh, B. Environmental Factors Influencing the Reproduction of an Estuarine Penaeid Population and Implications for Management. Fish. Manag. Ecol. 2018, 25, 203–219. [Google Scholar] [CrossRef]
- Lek, E.; Fairclough, D.V.; Platell, M.E.; Clarke, K.R.; Tweedley, J.R.; Potter, I.C. To What Extent Are the Dietary Compositions of Three Abundant, Co-occurring Labrid Species Different and Related to Latitude, Habitat, Body Size and Season? J. Fish Biol. 2011, 78, 1913–1943. [Google Scholar] [CrossRef] [PubMed]
- Greenwell, C.N.; Tweedley, J.R.; Moore, G.I.; Lenanton, R.C.J.; Dunlop, J.N.; Loneragan, N.R. Feeding Ecology of a Threatened Coastal Seabird across an Inner Shelf Seascape. Estuar. Coast. Shelf Sci. 2021, 263, 107627. [Google Scholar] [CrossRef]
- Clarke, K.; Green, R. Statistical Design and Analysis for a “biological Effects” Study. Mar. Ecol. Prog. Ser. 1988, 46, 213–226. [Google Scholar] [CrossRef]
- Clarke, K.R.; Tweedley, J.R.; Valesini, F.J. Simple Shade Plots Aid Better Long-Term Choices of Data Pre-Treatment in Multivariate Assemblage Studies. J. Mar. Biol. Ass. 2014, 94, 1–16. [Google Scholar] [CrossRef]
- Wood, S.N. Fast Stable Restricted Maximum Likelihood and Marginal Likelihood Estimation of Semiparametric Generalized Linear Models. J. R. Stat. Soc. Ser. B Stat. Methodol. 2011, 73, 3–36. [Google Scholar] [CrossRef]
- Zeileis, A.; Kleiber, C.; Jackman, S. Regression Models for Count Data in R. J. Stat. Soft. 2008, 27, 1–25. [Google Scholar] [CrossRef]
- Zuur, A.F.; Ieno, E.N.; Walker, N.; Saveliev, A.A.; Smith, G.M. Mixed Effects Models and Extensions in Ecology with R; Statistics for Biology and Health; Springer: New York, NY, USA, 2009; ISBN 978-0-387-87457-9. [Google Scholar]
- Agustina, S. Konservasi Alam Nusantara Foundation, Jakarta, Indonesia. Personal Communication. 2023.
- Dudley, R.G.; Tampubolon, G. The Artisanal Seine- and Lift-Net Fisheries of the North Coast of Java. Aquac. Res. 1986, 17, 167–184. [Google Scholar] [CrossRef]
- Wijayanto, D.; Bambang, A.; Kurohman, F. The Predator-Prey Model on Squids and Anchovies Fisheries in Jepara District, Central Java, Indonesia. Biodiversitas 2020, 21, 5697–5702. [Google Scholar] [CrossRef]
- Edrus, I.N.; Suprapto, S. Arah kebijakan pengembangan perikanan tangkap di sekitar Teluk Saleh, Nusa Tenggara Barat. J. Kebijak. Perik. Indones. 2013, 5, 25. [Google Scholar] [CrossRef]
- Kautsari, N.; Riani, E.; TF Lumbanbatu, D.; Hariyadi, S. Sandfish (Holuthuria Scabra) Fisheries in Saleh Bay: Stock Status Based on Fishermen’s Perception and Catches. J. Ilm. Perikan. Kelaut. 2019, 11, 59. [Google Scholar] [CrossRef]
- Rahayu, S.; Diatmika, I.P.G. Analisis Optimalisasi Benefit Aset Keuangan Nelayan Ubur-Ubur dalam Mewujudkan Kesejahteraan. JIA 2021, 6, 181. [Google Scholar] [CrossRef]
- Salas, S.; Chuenpagdee, R.; Seijo, J.C.; Charles, A. Challenges in the Assessment and Management of Small-Scale Fisheries in Latin America and the Caribbean. Fish. Res. 2007, 87, 5–16. [Google Scholar] [CrossRef]
- Darmawan, R.; Wiryawan, B.; Kleinertz, S.; Purbayanto, A.; Yulianto, I. Pemetaan spasial dan temporal status pemanfaatan ikan kerapu di perairan Teluk Saleh, Nusa Tenggara Barat. J. Marfis 2022, 13, 195–205. [Google Scholar] [CrossRef]
- Olopade, O.A.; Sinclair, N.G.; Dienye, H. Fish Catch Composition of Selected Small Scale Fishing Gears Used in the Bonny River, Rivers State, Nigeria. J. Fish. 2017, 5, 455–560. [Google Scholar] [CrossRef]
- Humphries, A.T.; Gorospe, K.D.; Carvalho, P.G.; Yulianto, I.; Kartawijaya, T.; Campbell, S.J. Catch Composition and Selectivity of Fishing Gears in a Multi-Species Indonesian Coral Reef Fishery. Front. Mar. Sci. 2019, 6, 378. [Google Scholar] [CrossRef]
- Khasanah, M.; Nurdin, N.; Sadovy de Mitcheson, Y.; Jompa, J. Management of the Grouper Export Trade in Indonesia. Rev. Fish. Sci. Aquac. 2020, 28, 1–15. [Google Scholar] [CrossRef]
- Darmono, O.P.; Agustina, S.; Herdiana, Y. Rantai pasok produk perikanan kakap merah di Lesser Sunda; Indonesia Climate Change Trust Fund: Jakarta, Indonesia, 2022; p. 49. [Google Scholar]
- Saldaña, A.; Salas, S.; Arce-Ibarra, A.M.; Torres-Irineo, E. Fishing Operations and Adaptive Strategies of Small-Scale Fishers: Insights for Fisheries Management in Data-Poor Situations. Fish. Manag. Ecol. 2017, 24, 19–32. [Google Scholar] [CrossRef]
- Amorim, P.; Sousa, P.; Westmeyer, M.; Menezes, G.M. Generic Knowledge Indicator (GKI): A Tool to Evaluate the State of Knowledge of Fisheries Applied to Snapper and Grouper. Mar. Policy 2018, 89, 40–49. [Google Scholar] [CrossRef]
- Sadovy de Mitcheson, Y.J.; Linardich, C.; Barreiros, J.P.; Ralph, G.M.; Aguilar-Perera, A.; Afonso, P.; Erisman, B.E.; Pollard, D.A.; Fennessy, S.T.; Bertoncini, A.A.; et al. Valuable but Vulnerable: Over-Fishing and under-Management Continue to Threaten Groupers so What Now? Mar. Policy 2020, 116, 103909. [Google Scholar] [CrossRef]
- Bell, R.J.; Richardson, D.E.; Hare, J.A.; Lynch, P.D.; Fratantoni, P.S. Disentangling the Effects of Climate, Abundance, and Size on the Distribution of Marine Fish: An Example Based on Four Stocks from the Northeast US Shelf. ICES J. Mar. Sci. 2015, 72, 1311–1322. [Google Scholar] [CrossRef]
- De Meo, I.; Miglietta, C.; Mutlu, E.; Deval, M.C.; Balaban, C.; Olguner, M.T. Ecological Distribution of Demersal Fish Species in Space and Time on the Shelf of Antalya Gulf, Turkey. Mar. Biodiv. 2018, 48, 2105–2118. [Google Scholar] [CrossRef]
- Kalayci, F.; Yeşilçiçek, T. Influence of Season, Depth and Mesh Size on the Trammel Nets Catch Composition and Discard in the Southern Black Sea, Turkey. Mar. Biol. Res. 2014, 10, 824–832. [Google Scholar] [CrossRef]
- Xu, Q.; Guo, D.; Zhang, P.; Zhang, X.; Li, W.; Wu, Z. Seasonal Variation in Species Composition and Abundance of Demersal Fish and Invertebrates in a Seagrass Natural Reserve on the Eastern Coast of the Shandong Peninsula, China. Chin. J. Ocean. Limnol. 2016, 34, 330–341. [Google Scholar] [CrossRef]
- Hyndes, G.A.; Platell, M.E.; Potter, I.C.; Lenanton, R.C.J. Does the Composition of the Demersal Fish Assemblages in Temperate Coastal Waters Change with Depth and Undergo Consistent Seasonal Changes? Mar. Biol. 1999, 134, 335–352. [Google Scholar] [CrossRef]
- Matley, J.; Heupel, M.; Simpfendorfer, C. Depth and Space Use of Leopard Coralgrouper Plectropomus Leopardus Using Passive Acoustic Tracking. Mar. Ecol. Prog. Ser. 2015, 521, 201–216. [Google Scholar] [CrossRef]
- Rahman, M.S.; Toiba, H.; Huang, W.-C. The Impact of Climate Change Adaptation Strategies on Income and Food Security: Empirical Evidence from Small-Scale Fishers in Indonesia. Sustainability 2021, 13, 7905. [Google Scholar] [CrossRef]
- Setyanto, A.; Sumarno, S.; Wiadnya, D.G.R.; Prayogo, C.; Kusuma, Z.; West, R.J.; Tsamenyi, M. Fishing Methods and Fishing Season of the Tropical Lobster Fisheries of Southern Java, Indonesia. Biodiversitas 2023, 24, 776–783. [Google Scholar] [CrossRef]
- Peterson, N. Breaking the Bounds of Rationality: Values, Relationships, and Decision-Making in Mexican Fishing Communities. Conser. Soc. 2014, 12, 245. [Google Scholar] [CrossRef]
- Efendi, D.S.; Adrianto, L.; Yonvitner; Wardiatno, Y. Spatial Bioeconomic Analysis of Grouper Fishing on the Fisheries Management Framework in Saleh Bay: Analisis Bioekonomi Spasial Perikanan Kerapu Dalam Kerangka Pengelolaan Perikanan Di Teluk Saleh. J. Pengelolaan Sumberd. Alam Lingkung. 2020, 10, 338–351. [Google Scholar] [CrossRef]
- Mustaruddin; Astarini, J.E. Observasi pemanfaatan sumber daya ikan unggulan dan strategi pengembangannya di perairan Kabupaten Bangka Selatan. J. Ilmu Dan Teknol. Kelaut. Trop. 2020, 12, 627–641. [Google Scholar] [CrossRef]
- Mavruk, S.; Saygu, İ.; Bengil, F.; Alan, V.; Azzurro, E. Grouper Fishery in the Northeastern Mediterranean: An Assessment Based on Interviews on Resource Users. Mar. Policy 2018, 87, 141–148. [Google Scholar] [CrossRef]
- Chagaris, D.; Allen, M.; Camp, E. Modeling Temporal Closures in a Multispecies Recreational Fishery Reveals Tradeoffs Associated with Species Seasonality and Angler Effort Dynamics. Fish. Res. 2019, 210, 106–120. [Google Scholar] [CrossRef]


| Data Group | Data | Description | Data Collection Method |
|---|---|---|---|
| Fisher profile | Village | Name of village | interview |
| Home port | Name of fishing port | interview | |
| Landing port | Name of fishing port | interview | |
| Fisher name | - | interview | |
| Fish collector | Name of fish collector | interview | |
| Boat name | - | interview | |
| Boat characteristic | Engine category | (inboard, outboard, no-engine) | interview |
| Engine power | horsepower (HP) | interview | |
| Number of boat crew | - | interview | |
| Boat tonnage | Gross tonnage (GT) | interview | |
| Boat length | meter | d.o./interview | |
| Fishing effort | Date of fishing | - | d.o. |
| Time of fishing | - | d.o. | |
| Date of landing | - | d.o. | |
| Time of landing | - | d.o. | |
| Main fishing gear | - | d.o. | |
| Secondary fishing gear | - | d.o./interview | |
| Additional gear | (e.g., lamp, FAD) | d.o./interview | |
| Fishing depth | meter | interview | |
| Catch | Family | - | d.m. |
| Species | - | d.m. | |
| Common name | Local common name | d.m. | |
| Price per kg | IDR (Indonesian Rupiah) | d.o./interview | |
| Total catch (kg) | kilogram (kg) | d.m. | |
| Total catch (number) | number of individuals | d.m. | |
| Fish total length (TL) | centimeter (cm) | d.m. | |
| Storage | fresh, frozen | d.o./interview |
| Fishing Method | Boat Size (GT) | No. of Crew | Trip Duration (Hour) | Hook Size | Engine Power (HP) | Engine Category | No. of Trips | % Trips |
|---|---|---|---|---|---|---|---|---|
| Bottom longline | 5 (2–9) | 1 (1–6) | 14 (4–63) | 8 (4–13) | 23 (5–48) | inboard & outboard | 1771 | 43.8 |
| Speargun | 2 (1–5) | 3 (1–7) | 14 (5–89) | n/a | 24 (5–30) | non-motorized, inboard & outboard | 1261 | 31.2 |
| Handline | 2 (1–9) | 2 (1–9) | 15 (6–63) | 8 (4–13) | 24 (5–66) | inboard & outboard | 478 | 11.8 |
| Troll line | 2 | 1 | 24 (10–72) | 4 and 7 | 16 (5–24) | inboard & outboard | 192 | 4.7 |
| Drop line | 2 (2–3) | 1 (1–2) | 10 (3–35) | 9 and 10 | 24 (15–26) | inboard | 179 | 4.4 |
| Boat liftnet | 5 (2–9) | 6 (1–9) | 27 (27–28) | n/a | 30 (16–48) | inboard | 108 | 2.7 |
| Gill net | 2 (1–7) | 1 (1–3) | 17 (5–28) | n/a | 24 (13–48) | inboard | 42 | 1.0 |
| Trap | 2 (1–3) | 1 (1–2) | 5 (3–29) | n/a | 24 (6–24) | inboard | 15 | 0.4 |
| Total | 4046 |
| Family | Fishing Gear/Method | |||||||||
| Bottom Longline | Speargun | Handline | Troll Line | Drop Line | Set Gillnet | Trap | Boat Liftnet | Total | ||
| Catch by Weight (kg) | (kg) | % | ||||||||
| Epinephelidae | 4708.3 | 3144.6 | 700.4 | 587.6 | 415.5 | 29.9 | 35.8 | 56.4 | 9678.5 | 40.0 |
| Lutjanidae | 2848.3 | 87.4 | 592.7 | 111.1 | 40.5 | 106.1 | - | 488.9 | 4275.0 | 17.7 |
| Carangidae | 65.0 | - | 7.2 | - | 2.1 | - | - | - | 74.3 | 0.3 |
| Lethrinidae | 32.3 | 10.1 | - | - | 14.7 | 1.3 | - | - | 58.4 | 0.2 |
| Sphyraenidae | - | 38.0 | - | - | - | - | - | - | 38.0 | 0.2 |
| Serranidae | - | 14.7 | - | - | - | - | - | - | 14.7 | 0.1 |
| Scaridae | 1.3 | 9.0 | 1.6 | - | - | - | - | - | 11.9 | 0.0 |
| Haemulidae | 9.0 | - | - | - | - | - | - | - | 9.0 | 0.0 |
| Caesionidae | - | 6.8 | - | - | - | - | - | - | 6.8 | 0.0 |
| Siganidae | - | 4.3 | - | - | - | - | - | - | 4.3 | 0.0 |
| Nemipteridae | 1.9 | - | - | - | - | - | - | - | 1.9 | 0.0 |
| Acanthuridae | - | 1.1 | - | - | - | - | - | - | 1.1 | 0.0 |
| Others * | 473.3 | 6290.4 | 3123.0 | 9.3 | 15.2 | 116.0 | - | - | 10,027.2 | 41.4 |
| Total weight (kg) | 8139.4 | 9606.4 | 4424.9 | 708.0 | 488.0 | 253.3 | 35.8 | 545.3 | 24,201.1 | |
| % all catch by weight | 33.6 | 39.7 | 18.3 | 2.9 | 2.0 | 1.0 | 0.1 | 2.3 | ||
| % of grouper and snapper catch by weight | 92.8 | 33.6 | 29.2 | 98.7 | 93.4 | 53.7 | 100.0 | 100.0 | ||
| Family | Fishing Gear/Method | |||||||||
| Bottom Longline | Speargun | Handline | Troll Line | Drop Line | Set Gillnet | Trap | Boat Liftnet | Total | ||
| Catch by Number | no | % | ||||||||
| Epinephelidae | 1906 | 2760 | 508 | 377 | 354 | 11 | 37 | 22 | 5975 | 23.9 |
| Lutjanidae | 1280 | 87 | 306 | 45 | 13 | 52 | - | 245 | 2028 | 8.1 |
| Carangidae | 14 | - | 6 | - | 1 | - | - | - | 21 | 0.1 |
| Lethrinidae | 43 | 24 | - | - | 6 | 5 | - | - | 78 | 0.3 |
| Sphyraenidae | - | 12 | - | - | - | - | - | - | 12 | 0.0 |
| Serranidae | - | 10 | - | - | - | - | - | - | 10 | 0.0 |
| Scaridae | 1 | 19 | 1 | - | - | - | - | - | 21 | 0.1 |
| Haemulidae | 3 | - | - | - | - | - | - | - | 3 | 0.0 |
| Caesionidae | - | 31 | - | - | - | - | - | - | 31 | 0.1 |
| Siganidae | - | 21 | - | - | - | - | - | - | 21 | 0.1 |
| Nemipteridae | 8 | - | - | - | - | - | - | - | 8 | 0.0 |
| Acanthuridae | - | 1 | - | - | - | - | - | - | 1 | 0.0 |
| Others * | 596 | 4367 | 11,811 | 5 | 2 | 26 | - | - | 16,807 | 67.2 |
| Total number | 3851 | 7332 | 12,632 | 427 | 376 | 94 | 37 | 267 | 25,016 | |
| % all catch by number | 15 | 29 | 50 | 2 | 2 | 0 | 0 | 1 | ||
| % of grouper and snapper catch by number | 82.7 | 38.8 | 6.4 | 98.8 | 97.6 | 67.0 | 100.0 | 100.0 | ||
| Methods | Seasons | |||||||||||
|---|---|---|---|---|---|---|---|---|---|---|---|---|
| NW | Trans. I | SE | Trans. II | |||||||||
| Months | ||||||||||||
| D | J | F | M | A | M | J | J | A | S | O | N | |
| Bottom longline | ||||||||||||
| E coioides | ||||||||||||
| L. malabaricus | ||||||||||||
| Speargun | ||||||||||||
| E coioides | ||||||||||||
| P. leopardus | ||||||||||||
| L. malabaricus | ||||||||||||
| Handline | ||||||||||||
| P. leopardus | ||||||||||||
| L. malabaricus | ||||||||||||
Disclaimer/Publisher’s Note: The statements, opinions and data contained in all publications are solely those of the individual author(s) and contributor(s) and not of MDPI and/or the editor(s). MDPI and/or the editor(s) disclaim responsibility for any injury to people or property resulting from any ideas, methods, instructions or products referred to in the content. |
© 2023 by the authors. Licensee MDPI, Basel, Switzerland. This article is an open access article distributed under the terms and conditions of the Creative Commons Attribution (CC BY) license (https://creativecommons.org/licenses/by/4.0/).
Share and Cite
Herdiana, Y.; Wiryawan, B.; Wisudo, S.H.; Tweedley, J.R.; Yulianto, I.; Retnoningtyas, H.; Loneragan, N.R. Untangling the Complexity of Small-Scale Fisheries: Building an Understanding of Grouper-Snapper Fisheries Dynamics in Saleh Bay, West Nusa Tenggara, Indonesia. Fishes 2024, 9, 2. https://doi.org/10.3390/fishes9010002
Herdiana Y, Wiryawan B, Wisudo SH, Tweedley JR, Yulianto I, Retnoningtyas H, Loneragan NR. Untangling the Complexity of Small-Scale Fisheries: Building an Understanding of Grouper-Snapper Fisheries Dynamics in Saleh Bay, West Nusa Tenggara, Indonesia. Fishes. 2024; 9(1):2. https://doi.org/10.3390/fishes9010002
Chicago/Turabian StyleHerdiana, Yudi, Budy Wiryawan, Sugeng Hari Wisudo, James Richard Tweedley, Irfan Yulianto, Heidi Retnoningtyas, and Neil Randell Loneragan. 2024. "Untangling the Complexity of Small-Scale Fisheries: Building an Understanding of Grouper-Snapper Fisheries Dynamics in Saleh Bay, West Nusa Tenggara, Indonesia" Fishes 9, no. 1: 2. https://doi.org/10.3390/fishes9010002
APA StyleHerdiana, Y., Wiryawan, B., Wisudo, S. H., Tweedley, J. R., Yulianto, I., Retnoningtyas, H., & Loneragan, N. R. (2024). Untangling the Complexity of Small-Scale Fisheries: Building an Understanding of Grouper-Snapper Fisheries Dynamics in Saleh Bay, West Nusa Tenggara, Indonesia. Fishes, 9(1), 2. https://doi.org/10.3390/fishes9010002