Article

Selecting from the Fisheries Managers’ Tool-Box: Recreational Fishers’ Views of Stock Enhancement and Other Management Options

1
School of Environmental and Conservation Sciences and Harry Butler Institute, Murdoch University, 90 South Street, Murdoch, WA 6150, Australia
2
Australian National Centre for Ocean Resources and Security (ANCORS), Faculty of Business and Law, University of Wollongong, Innovation Campus, Building 233 (ITAMS Building), Wollongong, NSW 2522, Australia
*
Author to whom correspondence should be addressed.
Fishes 2023, 8(9), 460; https://doi.org/10.3390/fishes8090460
Submission received: 10 August 2023 / Revised: 10 September 2023 / Accepted: 11 September 2023 / Published: 14 September 2023
(This article belongs to the Special Issue Fisheries Policies and Management)

Abstract

:
As recreational fishers act relatively autonomously, management relies heavily on voluntary compliance. Therefore, understanding fishers’ views on management options can be beneficial. This study used a two-phase approach of face-to-face interviews and subsequent online questionnaires to evaluate recreational fishers’ salient views on issues affecting the Blue Swimmer Crab (Portunus armatus) and Black Bream (Acanthopagrus butcheri) fisheries in Western Australia as well as current and potential management arrangements, including stock enhancement. The strength and heterogeneity of views were also determined. Minimum size limits were mainly considered acceptable or very acceptable, with restricting recreational fishing and spatial closures the least supported management options for both species, in addition to maximum size limits for crabs. These views were not always consistent across fishing locations for each species and among types of crab fishers, indicating heterogeneity in views. Stocking was the most acceptable of the management measures not already utilised for crabs and among the most popular for bream fisheries. Recreational fishers of both species believed stock enhancement could have strong positive outcomes for the abundance of their target species and increase their subsequent catches. They also recognized that some negative outcomes, e.g., increased fishing pressure and environmental issues, might occur but considered them unlikely.
Key Contribution: The level of support from recreational crab and finfish fishers for management options differed markedly, with strong support for existing arrangements (e.g., bag limits, maximum size limits and stocking) and the least for those options that restrict access to the fishery and prevent the capture of trophy-size individuals.

1. Introduction

Fisheries provide nutrition, livelihood, and recreation, but due to increasing human population growth and demand for seafood, together with deleterious anthropogenic influences, such as habitat degradation and eutrophication, management of fish stocks is commonly required to maintain these benefits [1,2]. Fishery management tools generally comprise three categories: (i) input controls, e.g., limited entry (licensing), time restrictions, and gear restrictions; (ii) output controls, e.g., quotas and catch shares; and (iii) technical measures, e.g., size limits, time-area closures, and marine protected areas [3,4]. Such controls seek to limit both the amount of fishing effort and fish harvested and the location where those resources are removed. However, while fishery regulations can benefit the ecology and biology of target species, regulations can also result in significant negative economic and social impacts on fishers and associated communities [5]. Furthermore, regulation relies on effective monitoring of recreational fishers, which can be challenging as fishers act relatively autonomously, often with limited active management or monitoring, and potentially across large geographical areas [6]. Although novel monitoring techniques are being developed, such as cameras and drones (e.g., [7,8]), management often relies heavily on voluntary compliance with regulations [6]. Thus, engaging with fishers is vital when designing and implementing new regulations and policies, and can result in reduced conflict and increased compliance [9,10].
Aquaculture-based enhancement is a fisheries management option offering a different approach [11]. Rather than restricting access to a fishery, aquaculture-based enhancement focusses on releasing hatchery-reared fish or crustaceans into a natural system to increase stocks reduced by fishing activities and can enable fishing to continue without restricting effort. The three types of release programs have been identified based on the status of the stocks: (i) stock enhancement, i.e., the release of hatchery-reared juveniles to improve an already sustainable population; (ii) restocking, i.e., releases of hatchery-reared juveniles to increase severely depleted stocks; and (iii) sea ranching, i.e., releases of hatchery-reared juveniles into a put, grow, and take system [11]. Aquaculture-based enhancement is, however, not a ‘magic bullet’, and there may be some trade-offs relevant to fishers. These can include a reduction in the abundance of wild individuals through competition, reduced growth-rates and increased numbers of smaller individuals as a result of density dependence, as well as increases in fishing effort due to perceptions of more fish to catch and consequently increased pressures on the stocks [12,13]. Despite these potential negative impacts, some studies indicate that stock enhancement and restocking are commonly supported by recreational fishers [14,15].
Estuaries are highly productive ecosystems that generate considerable ecosystem services and are heavily used by humans for a range of purposes, including recreational fishing [16,17]. In a fisheries context, this includes the production of finfish and crustaceans, which can be used for economic or social gain [18]. For example, species that use estuaries for all or part of their life-cycle account for up to 90% of all recreational angling catch in some regions of Australia [19]. Although estuaries in microtidal, south-western Australia are important environments for fisheries species [17], these systems are particularly susceptible to anthropogenic degradation [20]. For example, their limited flushing capacity and highly seasonal rainfall leads to the occurrence of hypoxia and algal blooms and, in some systems, extreme hypersalinity [21,22,23]. These perturbations can have lethal effects on fish and crustaceans, resulting in mass mortality events [24]. Although not as obvious to the public, a range of sublethal effects have been observed in estuaries. Decreased riverine input has expanded hypoxic areas, reducing benthic invertebrate populations and resulting in habitat compression and fish and invertebrates moving away from deeper, hypoxic waters into more well-oxygenated shallower areas. This can result in a slower growth rate and, consequently, longer time taken to reach the minimum legal length for retention [25,26].
Recreational fishing is particularly popular in Western Australia, with an estimated 30% of the state’s population participating in fishing annually [27]. This is substantially greater than the average for Australia (16.8%) [28] and a range of industrialised countries (10.5%) [29]. Among the most-prized recreational species in Western Australia are the Blue Swimmer Crab (Portunus armatus) and the Black Bream (Acanthopagrus butcheri), which are abundant and fished extensively. For example, an estimated 900,000 Blue Swimmer Crabs were caught by recreational boat fishers alone in Western Australia in 2013/14 and 670,000 in 2017/18, ranking 1st and 2nd in terms of number of individuals caught among all species, respectively [30,31]. Recreational crab fishers are strongly consumption-orientated, with over 90% eating their retained catch [32]. In contrast, Black Bream is a trophy fishery where the majority of recreational fishers practice catch-and-release fishing, and some partake in competitions [32].
Understanding stakeholders’ views on management options can be beneficial and boost community support for those measures and, as a result, increase compliance, which is particularly valuable for recreational fishers, who act relatively autonomously, and thus, their management often relies heavily on encouraging voluntary compliance. A previous study found that recreational fishers targeting Blue Swimmer Crab and Black Bream in a range of estuaries and a marine embayment in Western Australia elicited different motivations for fishing, but these were consistent among users of those fisheries and the locations where those species were caught [32]. The current study builds on that work by investigating recreational fishers’ views on the current status of Blue Swimmer Crab and Black Bream fisheries in the same systems. It also examines the social acceptability of a range of current and potential recreational fishery management practices, including stock enhancement in these systems. As fishers’ views can be heterogeneous, the level of consistency of views on fishing for each species was assessed separately among users of each estuary and fishers with similar fishing characteristics [32].

2. Materials and Methods

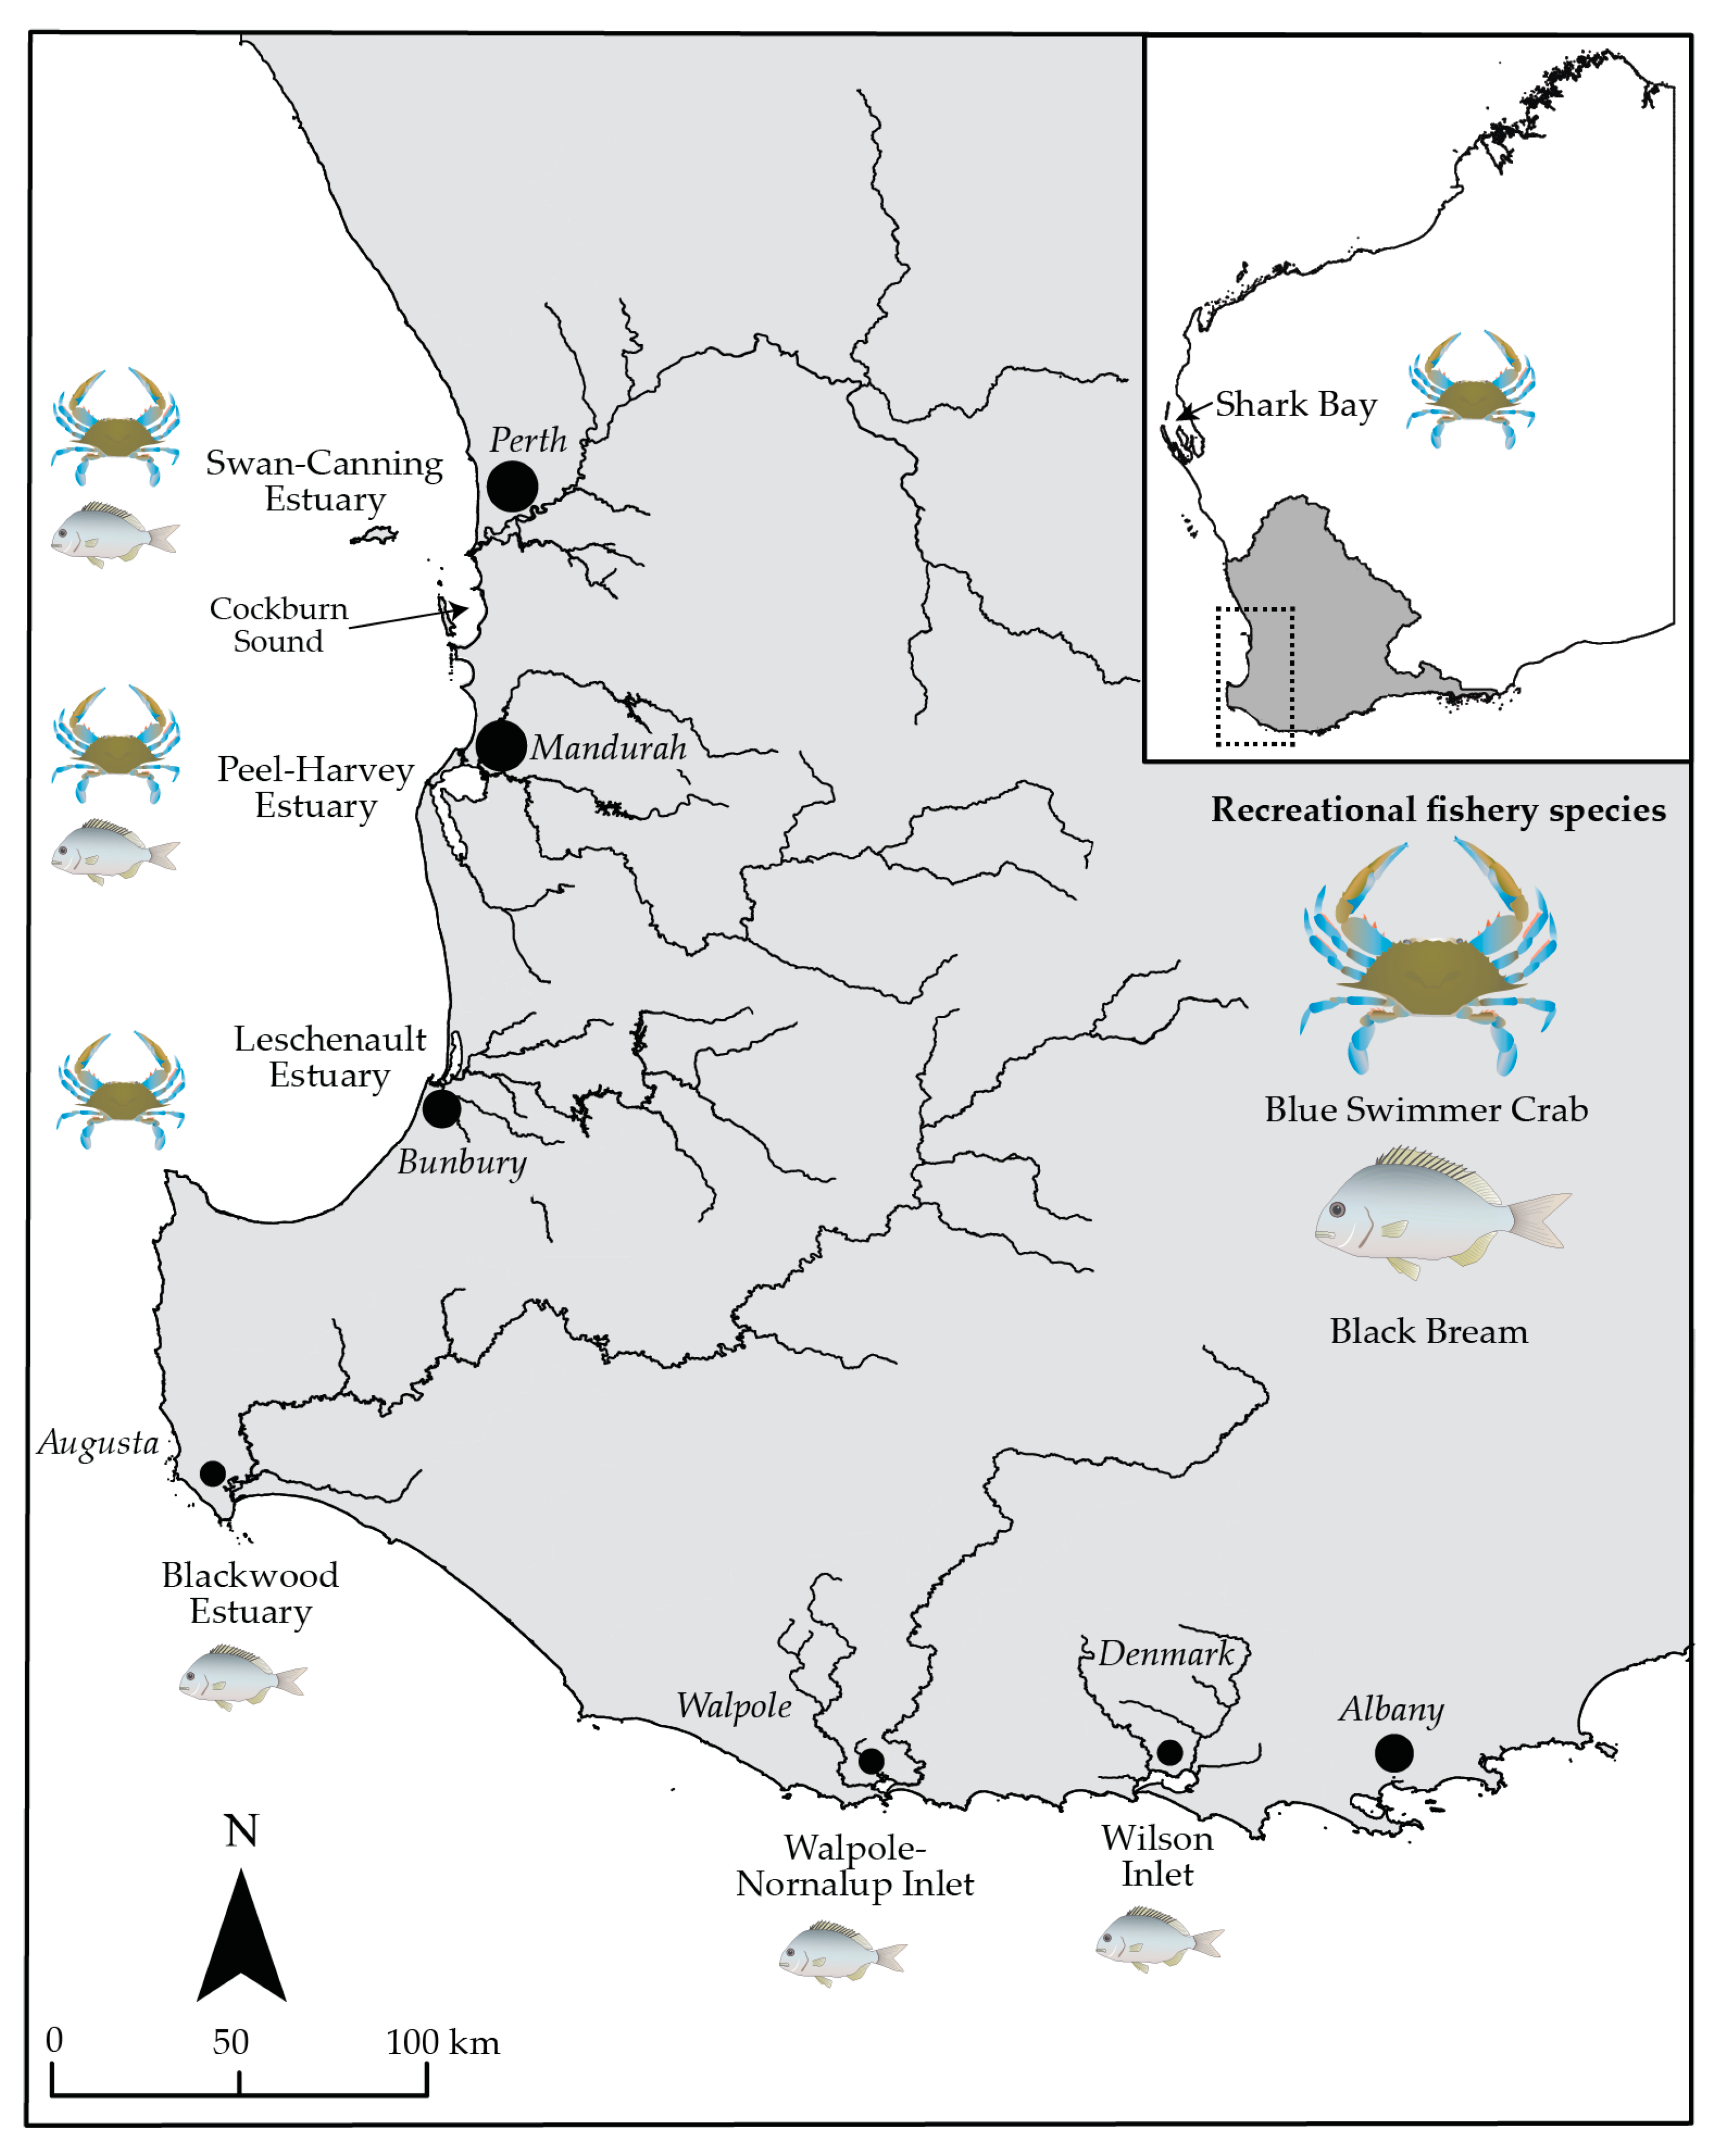
2.1. Study Area and Fisheries

The Blue Swimmer Crab is one of the most targeted recreational species in Western Australia and supports several small-scale commercial fisheries [31,33]. Populations of this species in south-western Australian estuaries are currently regarded as ‘adequate’ [34]; however, recreational fishers have reported a decline in their size in one estuary (the Peel–Harvey) over time [35] and stocks in the marine embayment Cockburn Sound collapsed over a decade ago and have failed to recover [34,36]. An aquaculture-based enhancement program was suggested as a possible solution to restore the Blue Swimmer Crab population in Cockburn Sound, but to date, only experimental scale releases have occurred [37].
Recreational Blue Swimmer Crab fishing mainly occurs in four systems on the west coast of Western Australia, i.e., the temperate Swan–Canning, Peel–Harvey, and Leschenault estuaries and the sub-tropical embayment of Shark Bay (Figure 1). The Swan–Canning Estuary is surrounded by the state capital city of Perth and is highly urbanized. Crabs are caught by a single commercial fisher who deploys gill nets in the lower reaches of this estuary [38]. The Peel–Harvey Estuary is located ~80 km2 south of Perth. This estuary is utilized by both commercial and recreational fishers whose activities have been certified by the Marine Stewardship Council as sustainable [39], albeit the recreational fishery has one of the highest levels of non-compliance in Western Australia [40]. Leschenault Estuary used to support a commercial crab fishery, but it closed in 2001 following community concerns over perceived declining catches. The recreational fishery still operates.
Shark Bay is a world heritage-listed embayment and a popular tourist destination [41]. Commercial fishers target Blue Swimmer Crabs directly using traps, and they are also obtained as by-catch in prawn and scallop trawl fisheries [34]. This was the most productive commercial Blue Swimmer Crab fishery in Western Australia (AUD 4 million) before a marine heatwave in the austral summer of 2010/11 led to a pronounced decline in stocks [42]. The fishery was closed for a period of 18 months in 2012 and 2013 to promote stock recovery and then reopened [34].
Recreational fishers target Blue Swimmer Crabs from a boat and/or the shore (including jetties) using baited traps, scoop nets, wire hooks, and their hands. Retained crabs must be ≥127 mm carapace width (CW), and a daily personal bag of 10 crabs and a boat limit of up to 20 crabs, depending on the number of licensed fishers, applies. Berried females (i.e., those carrying eggs) are not able to be retained, and a temporal closure occurs during the main spawning period [33]. Only boat-based recreational fishers require a license. Compliance is enforced by the State Government Department of Primary Industries and Regional Development, which conducts patrols of waterways [43], and illegal fishing can be reported to a 24 h phoneline “Fishwatch”.
Black Bream are a long-lived sparid that typically resides in the upper riverine reaches of estuaries, particularly amongst woody debris [44]. The species is targeted by recreational fishers throughout southern Australia [45]. A restocking program was initiated as a response to consistently low catches in the Blackwood River Estuary, with the hatchery-reared fish making substantial contributions to egg production (50%) in some years [46,47].
Recreational Black Bream fishing occurs in the Swan–Canning and Peel–Harvey estuaries on the lower-west coast [38,48] and in a suite of systems on the south coast of Western Australia, most notably the Blackwood River Estuary, Walpole–Nornalup Estuary and Wilson Inlet (Figure 1). The Blackwood River Estuary is fished by a single commercial license holder using gill nets, and annual recreational Black Bream fishing tournaments occur [49]. The waters of the Walpole–Nornalup Estuary are listed as a Marine Park, and no commercial fishing is permitted [50]. In contrast, up to 14 commercial fishers use gill nets to target a range of finfish species, including Black Bream in Wilson Inlet [34].
Recreational Black Bream fishing is conducted using rod and line with both bait and lures from the shore, boats, and kayaks. The minimum total length for retention is 250 mm total length, with a bag limit of six fish per day [51]. An additional regulation applies in the Swan–Canning Estuary, with only two of those fish allowed to be >400 mm.

2.2. Surveys of Recreational Fishers

This study used two sequential data collection methods, i.e., (Phase 1) face-to-face semi-structured interviews and (Phase 2) an online questionnaire. The semi-structured interviews were conducted with 94 Blue Swimmer Crab fishers at 18 sites and with 137 Black Bream fishers at 34 sites. Interviews comprised a series of open-ended questions to gather data that informed a subsequent closed-question online survey. Full details of the rationale of this and the methodology employed are given in [32], and thus, only undescribed components are provided below.
Questions in the online survey were designed to determine the ‘possible issues that could affect the Blue Swimmer Crab/Black Bream fishery in the estuary where you fish’, and respondents selected if they agreed, disagreed, or were unsure with issues provided during the face-to-face survey and about the ‘current state of the fishery compared to when you first started fishing’ and whether a range of effects (e.g., the size of their target species) had increased, decreased or remained the same. The next questions addressed the respondents’ thoughts on the current state of fishery management (i.e., agree, disagree, or unsure), the acceptability of various management measures (i.e., very acceptable, acceptable, neutral, unacceptable, very unacceptable), and whether a range of existing management measures (e.g., bag limits) should be increased, decreased, remain the same or unsure. The salient beliefs relating to stock enhancement identified from the face-to-face interviews were presented to respondents as a rating scale and organised into rating pairs [52]. The first scale gave an indication of the strength of belief in the statement, while the second scale indicated the evaluation of the belief. These were followed by a question that was focused on the overall attitude towards the implementation of stock enhancement. Finally, for those fishers using the Blue Swimmer Crab fishery, where the majority of crabs are consumed [32], respondents were asked what they would do if they caught a hatchery-reared crab, e.g., would they eat it, release it, or keep it for a friend/family member. A total of 571 recreational Blue Swimmer Crab and 151 recreational Black Bream fishers completed part of the survey.

2.3. Data Analyses

Dual belief and evaluation coding schemes were recoded to follow Francis et al. [53]. Thus, while the belief strength was measured on 7-point scale from 0 (‘very unlikely’) to +6 (‘very likely’), the accompanying belief evaluation was placed on a scale of −3 (very bad) to +3 (very good). The measures associated with each question were subsequently multiplied together to form a cross-product for each belief, which ranged from −18 (very likely and very bad) to +18 (very likely and very good). The cross-product represents the belief-based attitude, which provides an indication of how strong the belief is and whether the belief is associated with a positive or negative attitude.
The number of respondents (i.e., ‘n’) to each question and for each target species were used to calculate the percentage of respondents that selected each option and used to construct a Bray–Curtis resemblance matrix. This was then subjected to the CLUSTER-SIMPROF routine to determine if the views of respondents utilising the various fishing locations (Figure 1) and fisher groups (Table 1) differed from one another. Full details of the derivation of the fisher groups are given in [32]. A similar approach was used to analyse belief strength, belief evaluation, and belief-based attitude. However, as these response data were numbers rather than percentage composition, a Euclidean distance (instead of Bray–Curtis) was used as the resemblance coefficient. The social acceptability of each of the potential management options was compared by first converting the ranking to a number (i.e., very unacceptable = 1 through to very acceptable = 5). The rating of each management option was compared using an independent-sample Kruskal–Wallis test for each target species separately, using SPSS v24 (IBM, New York, USA). If a significant difference was detected (p < 0.05), pairwise Dunn’s post-hoc tests were used to determine which subsets of data differed significantly.

3. Results

3.1. Demographics

Full demographic details are given in Supplementary Tables S1 and S2. In brief, the recreational Blue Swimmer Crab fishers who completed the online survey were predominantly male (83.9%), between 35 to 44 years old (27.2%), and had fished for more than 10 years (60.4%). Recreational Black Bream survey participants were also overwhelmingly male (93.4%); most were in the 25–34 (24.5%) and 35–44 years old categories (27.4%) and had fished for between 11 and 20 years (28%).

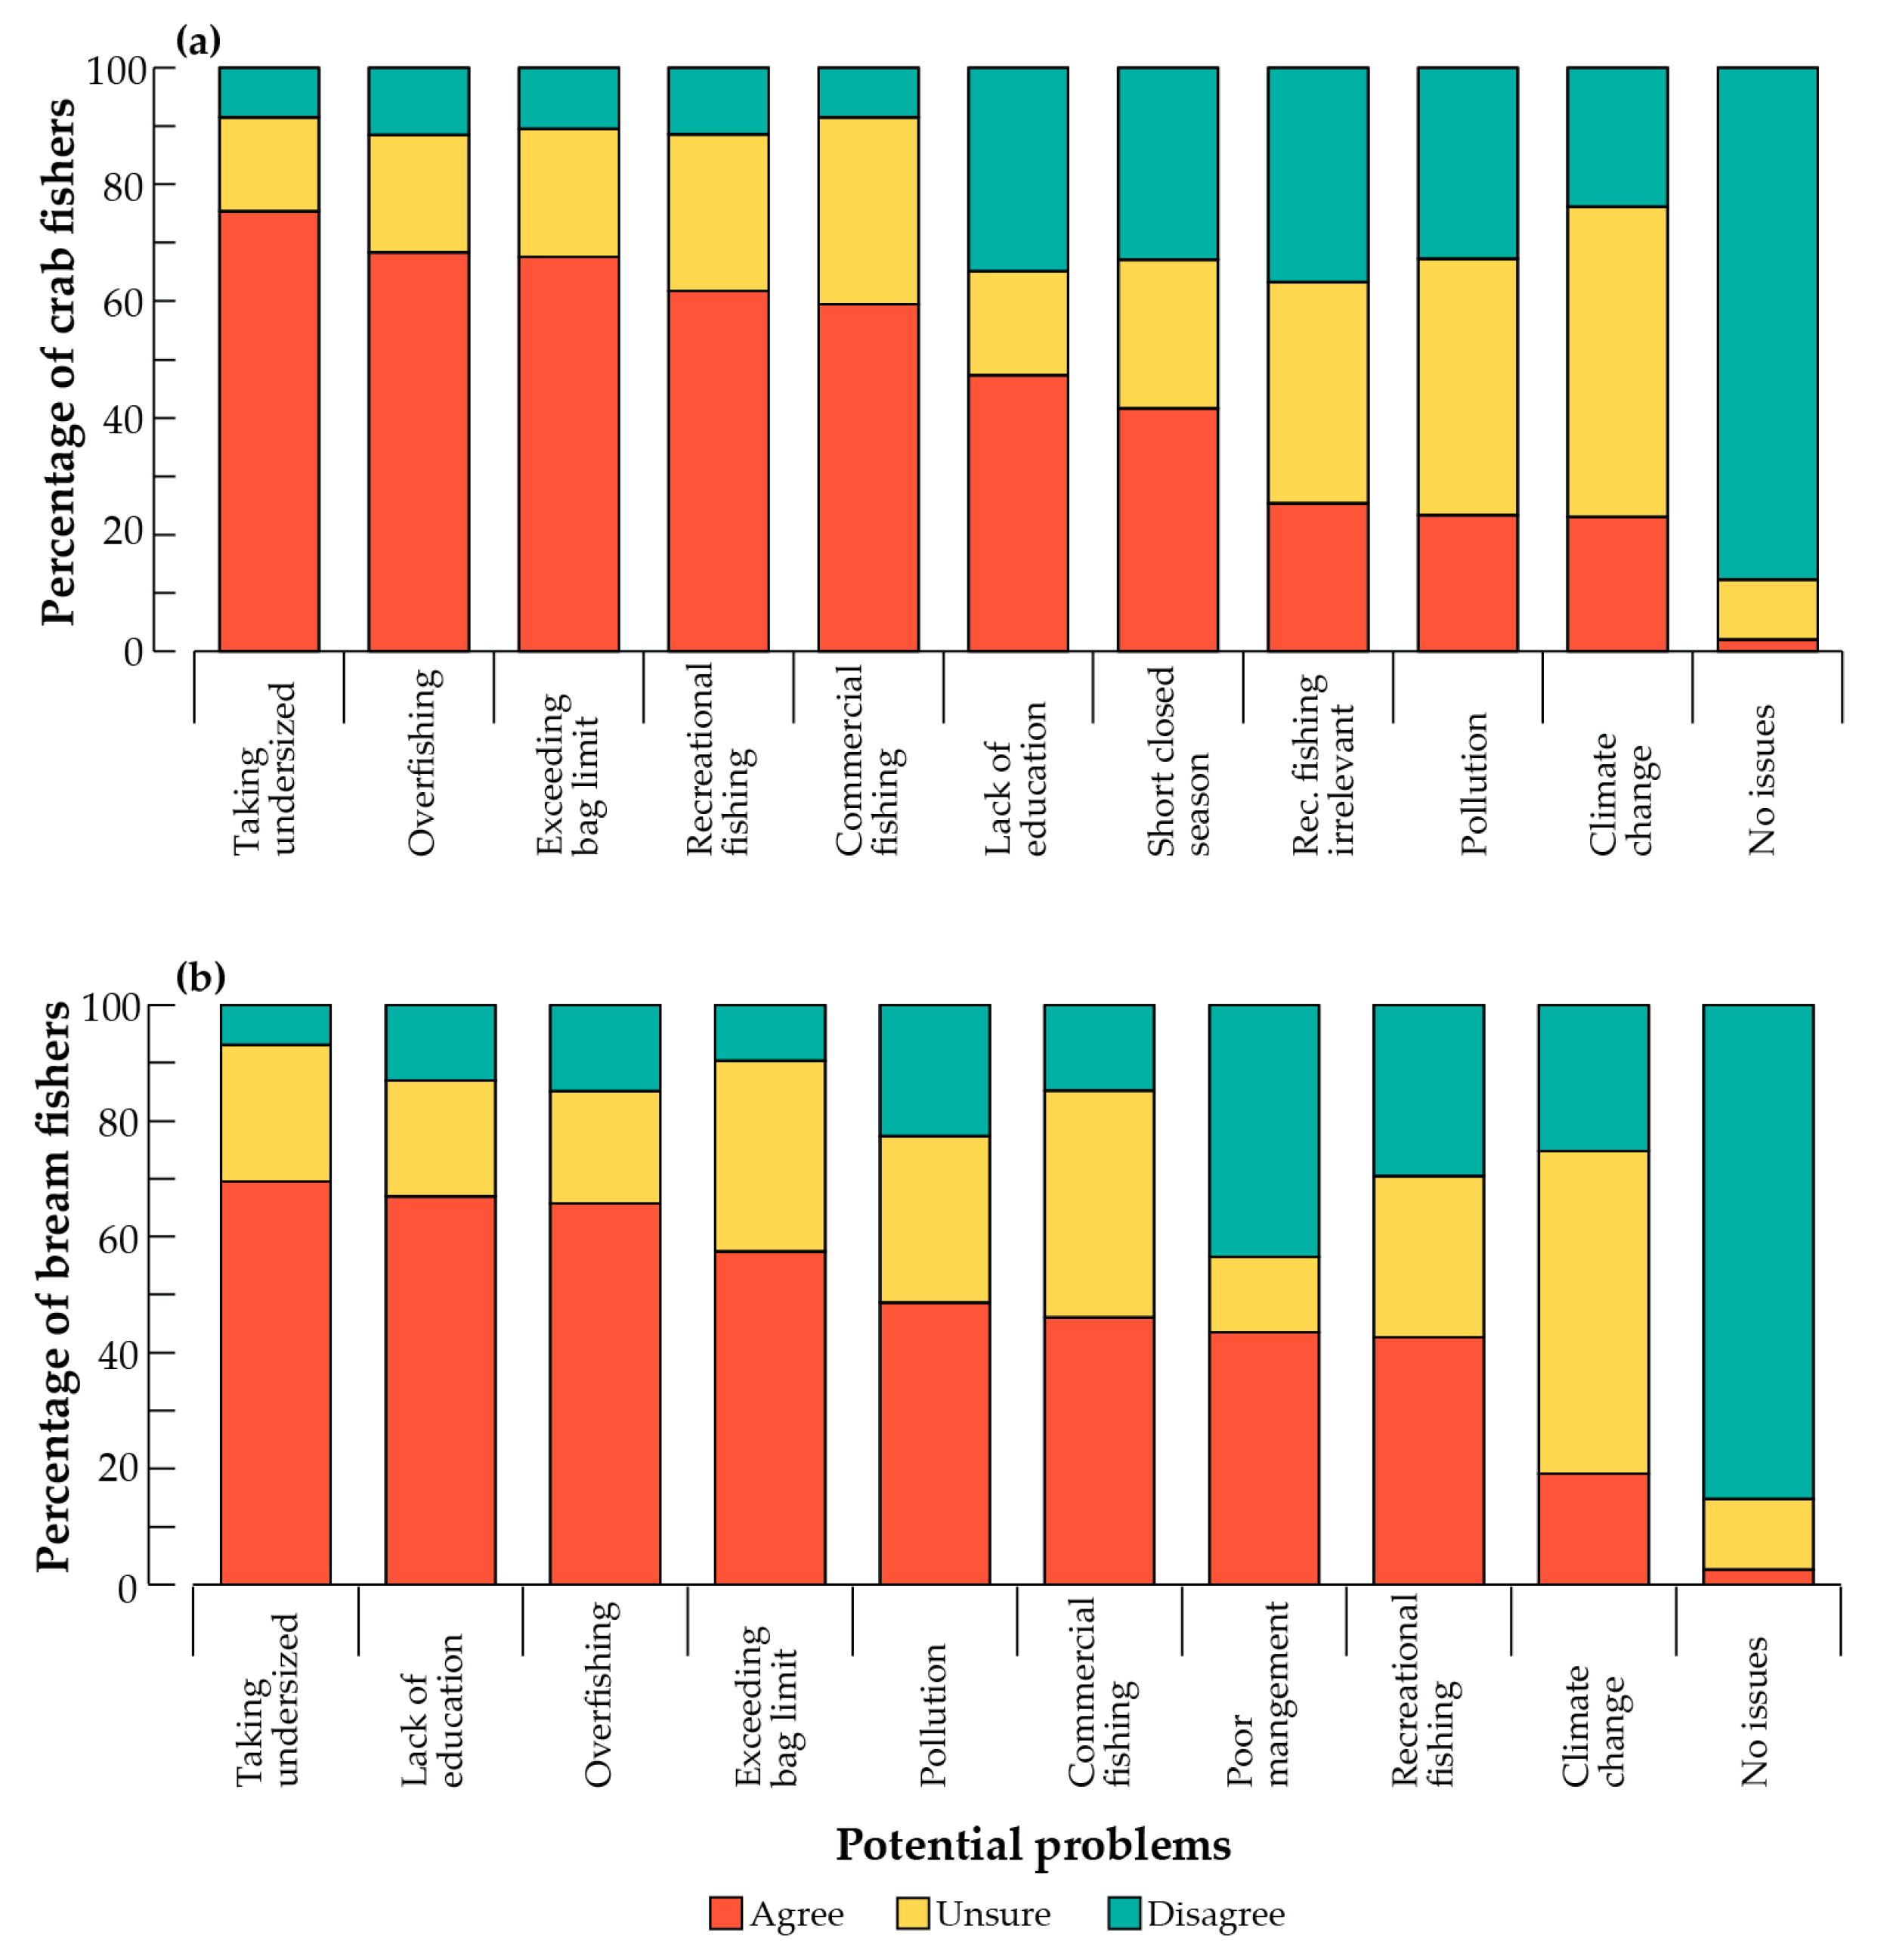
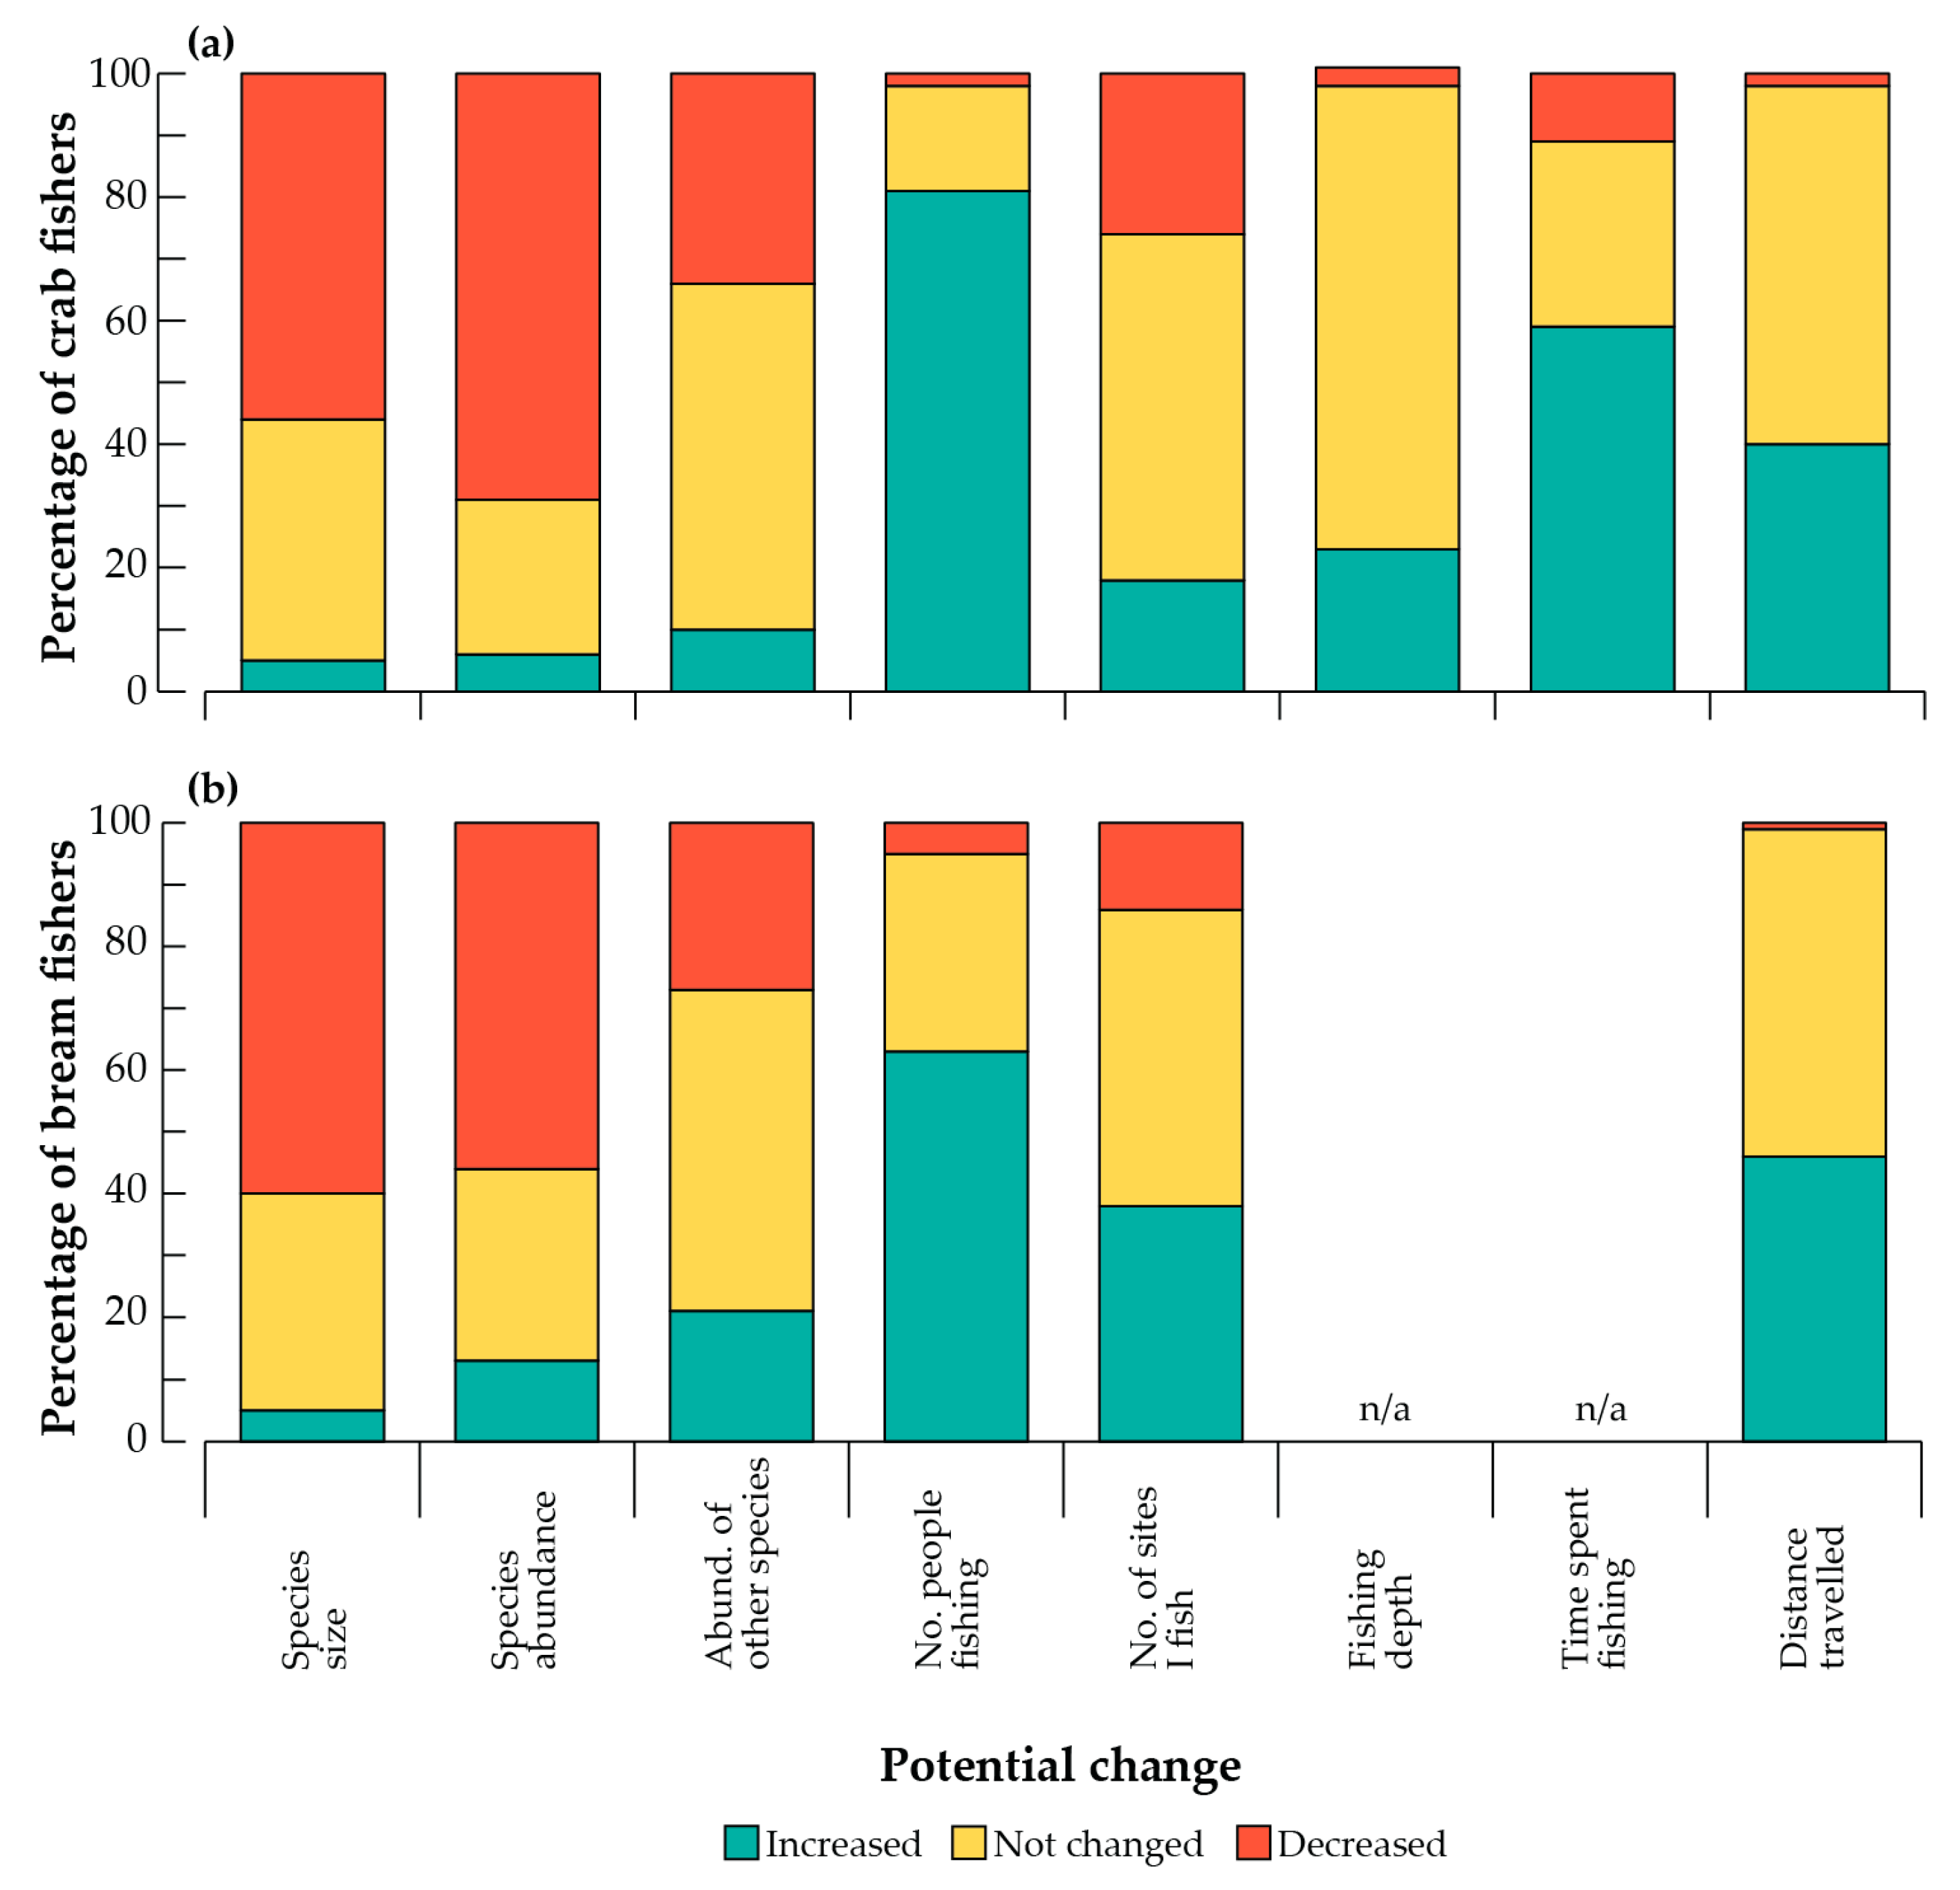
3.2. Perceived Fishery Issues and Effects on Catches

When asked to comment on the potential issues affecting Blue Swimmer Crab fisheries across Western Australia, only 2% of recreational fishers stated there were no issues, with 88% disagreeing with this statement, saying that these fisheries experienced problems (Figure 2a). Of the ten salient issues identified in the face-to-face interviews, between 23 and 75% of respondents in the online survey agreed that all 10 were present. The top five issues related to fishing, i.e., (i) taking of undersized crabs (75% agree), (ii) overfishing (68%), (iii) catches exceeding the bag limit (68%), (iv) recreational fishing (62%), and (v) commercial fishing (59%; Figure 2a). Non-fishing issues, i.e., pollution and climate change, were selected by comparatively few fishers (both 23%). Except for the retention of undersize crab by recreational fishers, which was selected by more fishers utilising the Peel–Harvey (80%) than the Swan–Canning (67%), the views of fishers were relatively consistent between these two adjacent systems (Supplementary Table S3). The views of individuals fishing in Leschenault differed in some cases from those using other estuaries, with proportionally fewer people agreeing that overfishing, commercial fishing, and a lack of education were affecting the fishery but conversely that the taking of undersized crabs and pollution were more important issues.
Like Blue Swimmer Crab fishers, only 3% of recreational Black Bream fishers considered there were no issues affecting the fishery, compared with between 19 and 70% of fishers who agreed with the other issues (Figure 2b). The issues that most fishers agreed to were: (i) the taking of undersized fish (70% agree), (ii) lack of education (67%), (iii) overfishing (66%), and (iv) exceeding the bag limit (57%). Climate change was the least supported issue, with only 19% of Black Bream fishers considering this an issue. The above issues were consistent across estuaries, except for the taking of undersized fish and exceeding the bag limits, which were more prevalent in fishers in the Peel–Harvey and Swan–Canning than in the Blackwood. The reverse was true for their views on climate change (Supplementary Table S4).
Compared to when they started fishing, most recreational fishers stated that the sizes of Blue Swimmer Crabs had declined over time (56% overall), with these trends being stronger in the Leschenault (70%) and Shark Bay (100%) than in the Peel–Harvey and Swan–Canning (57 and 53%, respectively; Figure 3a). The abundance of Blue Swimmer Crabs was said to have declined overall and in each system (69–83%), with around one-third of respondents stating that this decline was also true for the abundance of other species caught. It should be noted, however, that 50–67% of fishers said this has not changed (Supplementary Table S5). Fishers also stated that both the number of people fishing (81%) and the time spent fishing to catch crabs increased (59%); however, most felt that the number of sites (56%), depth of those sites (75%), and the distance they needed to visit to catch crabs (58%) remained similar.
In general, recreational fishers stated that both the size and abundance of Black Bream had declined (60 and 56%, respectively; Figure 3b); however, this varied among estuaries. The greatest perceived decline in size was recorded by fishers in the Blackwood (81%) and Swan–Canning (86%), least in the Wilson (0%), and intermediate in the Peel–Harvey (37%; Supplementary Table S6). The perceived decrease in Black Bream abundance was also greatest in the Blackwood (81%) and least in the Wilson (0%). The proportion of fishers perceiving a decline was greater in the Peel–Harvey (79%) than Swan–Canning (56%).

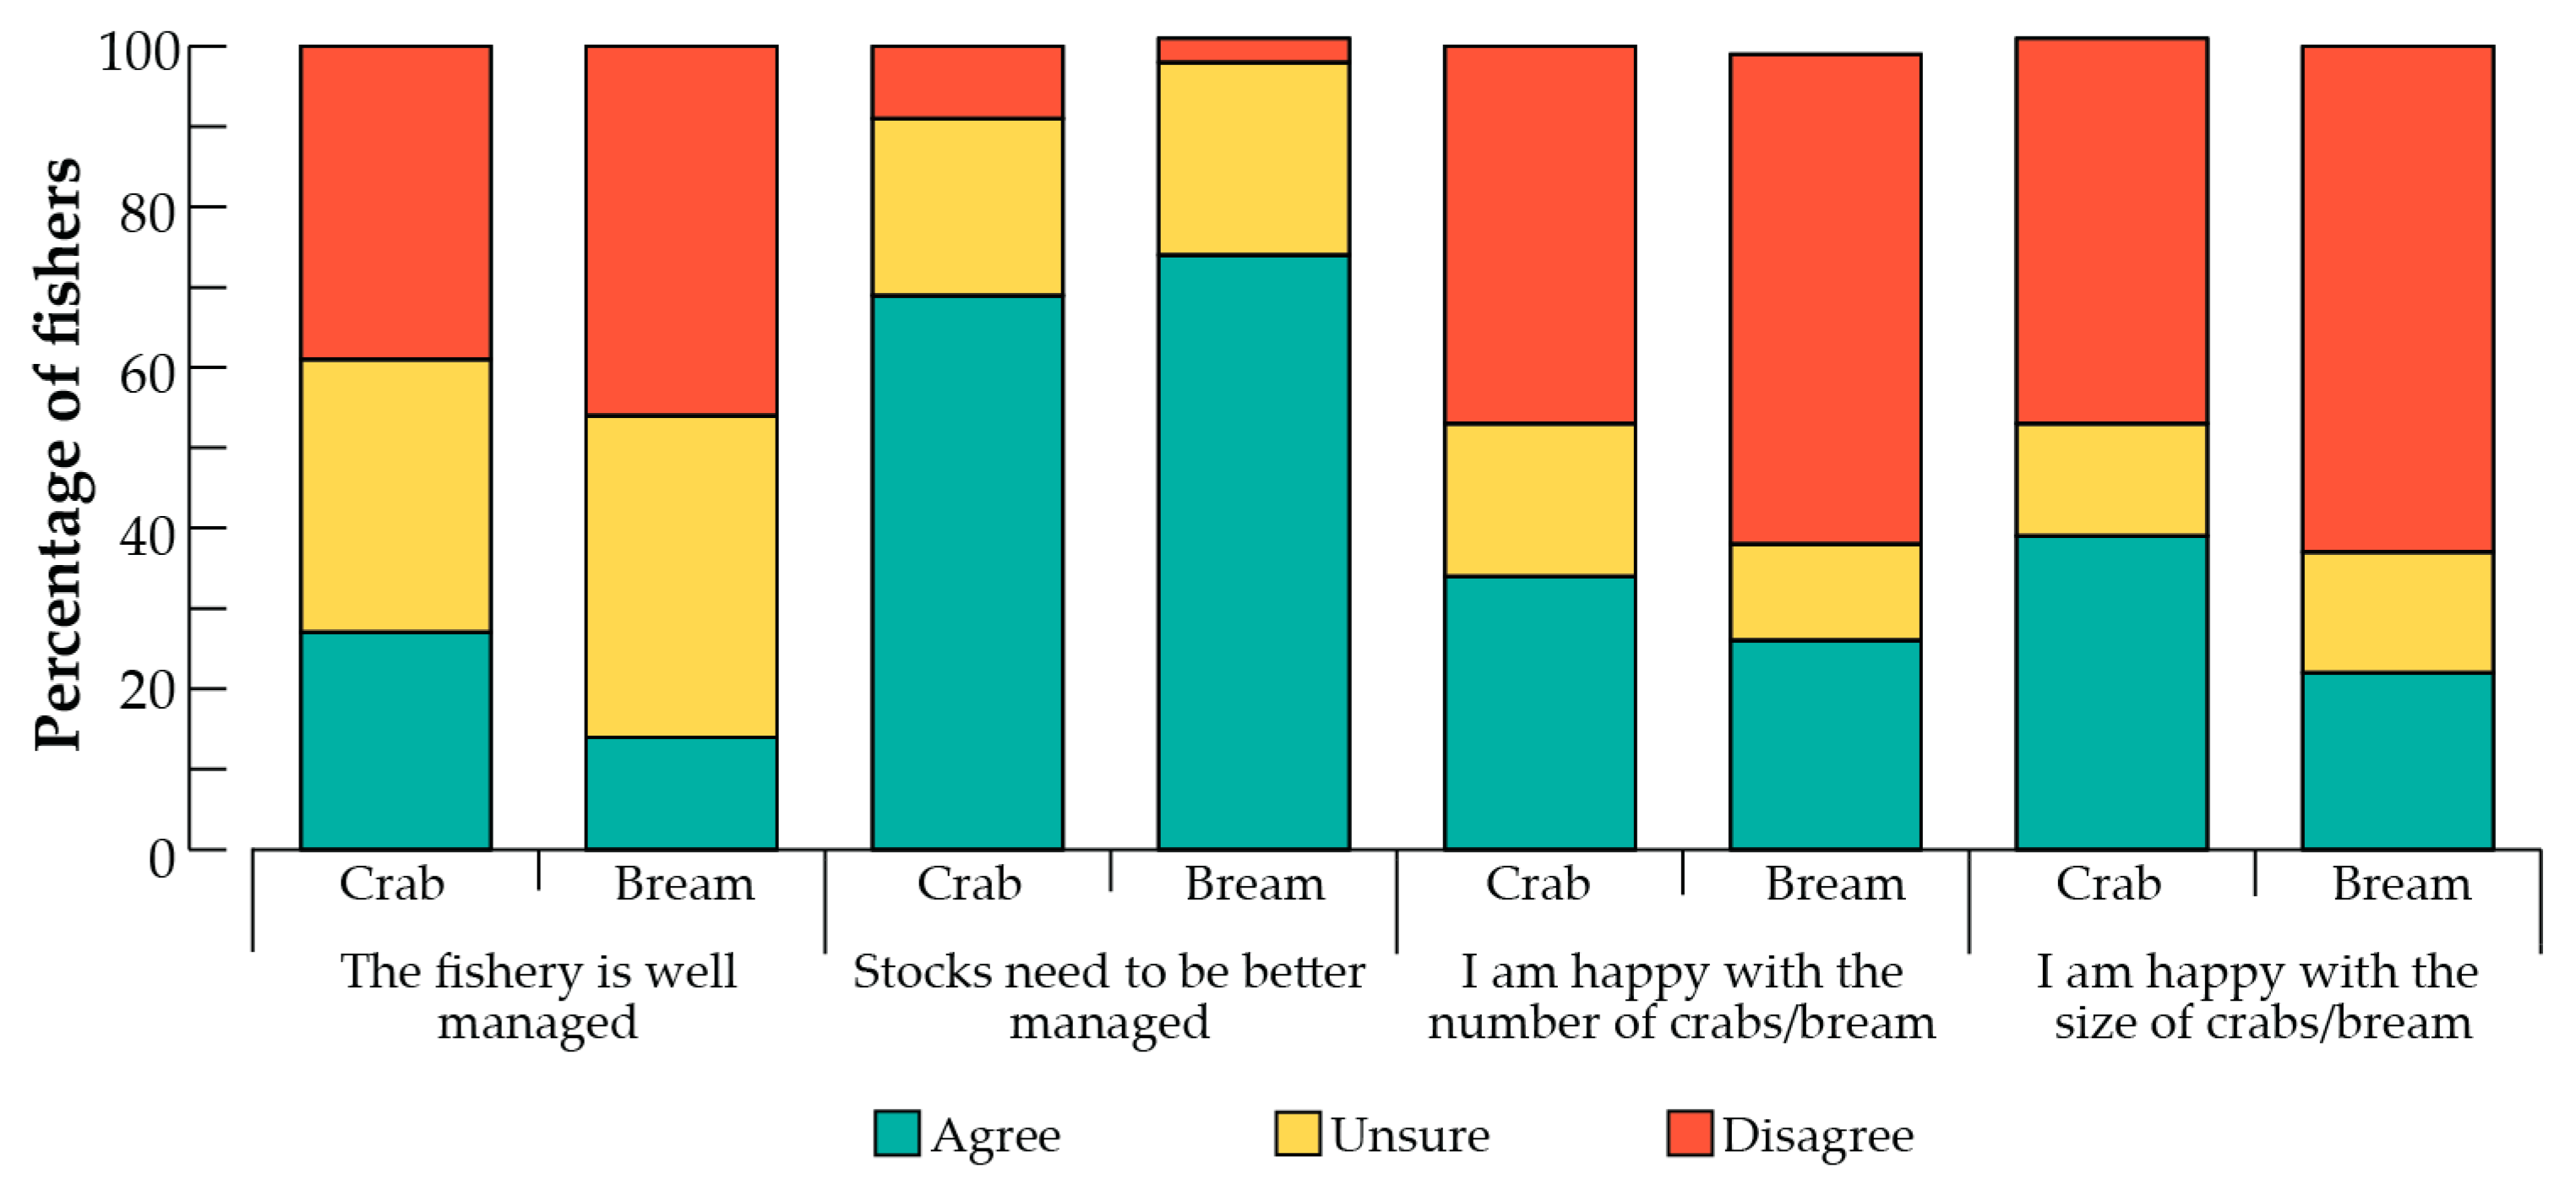
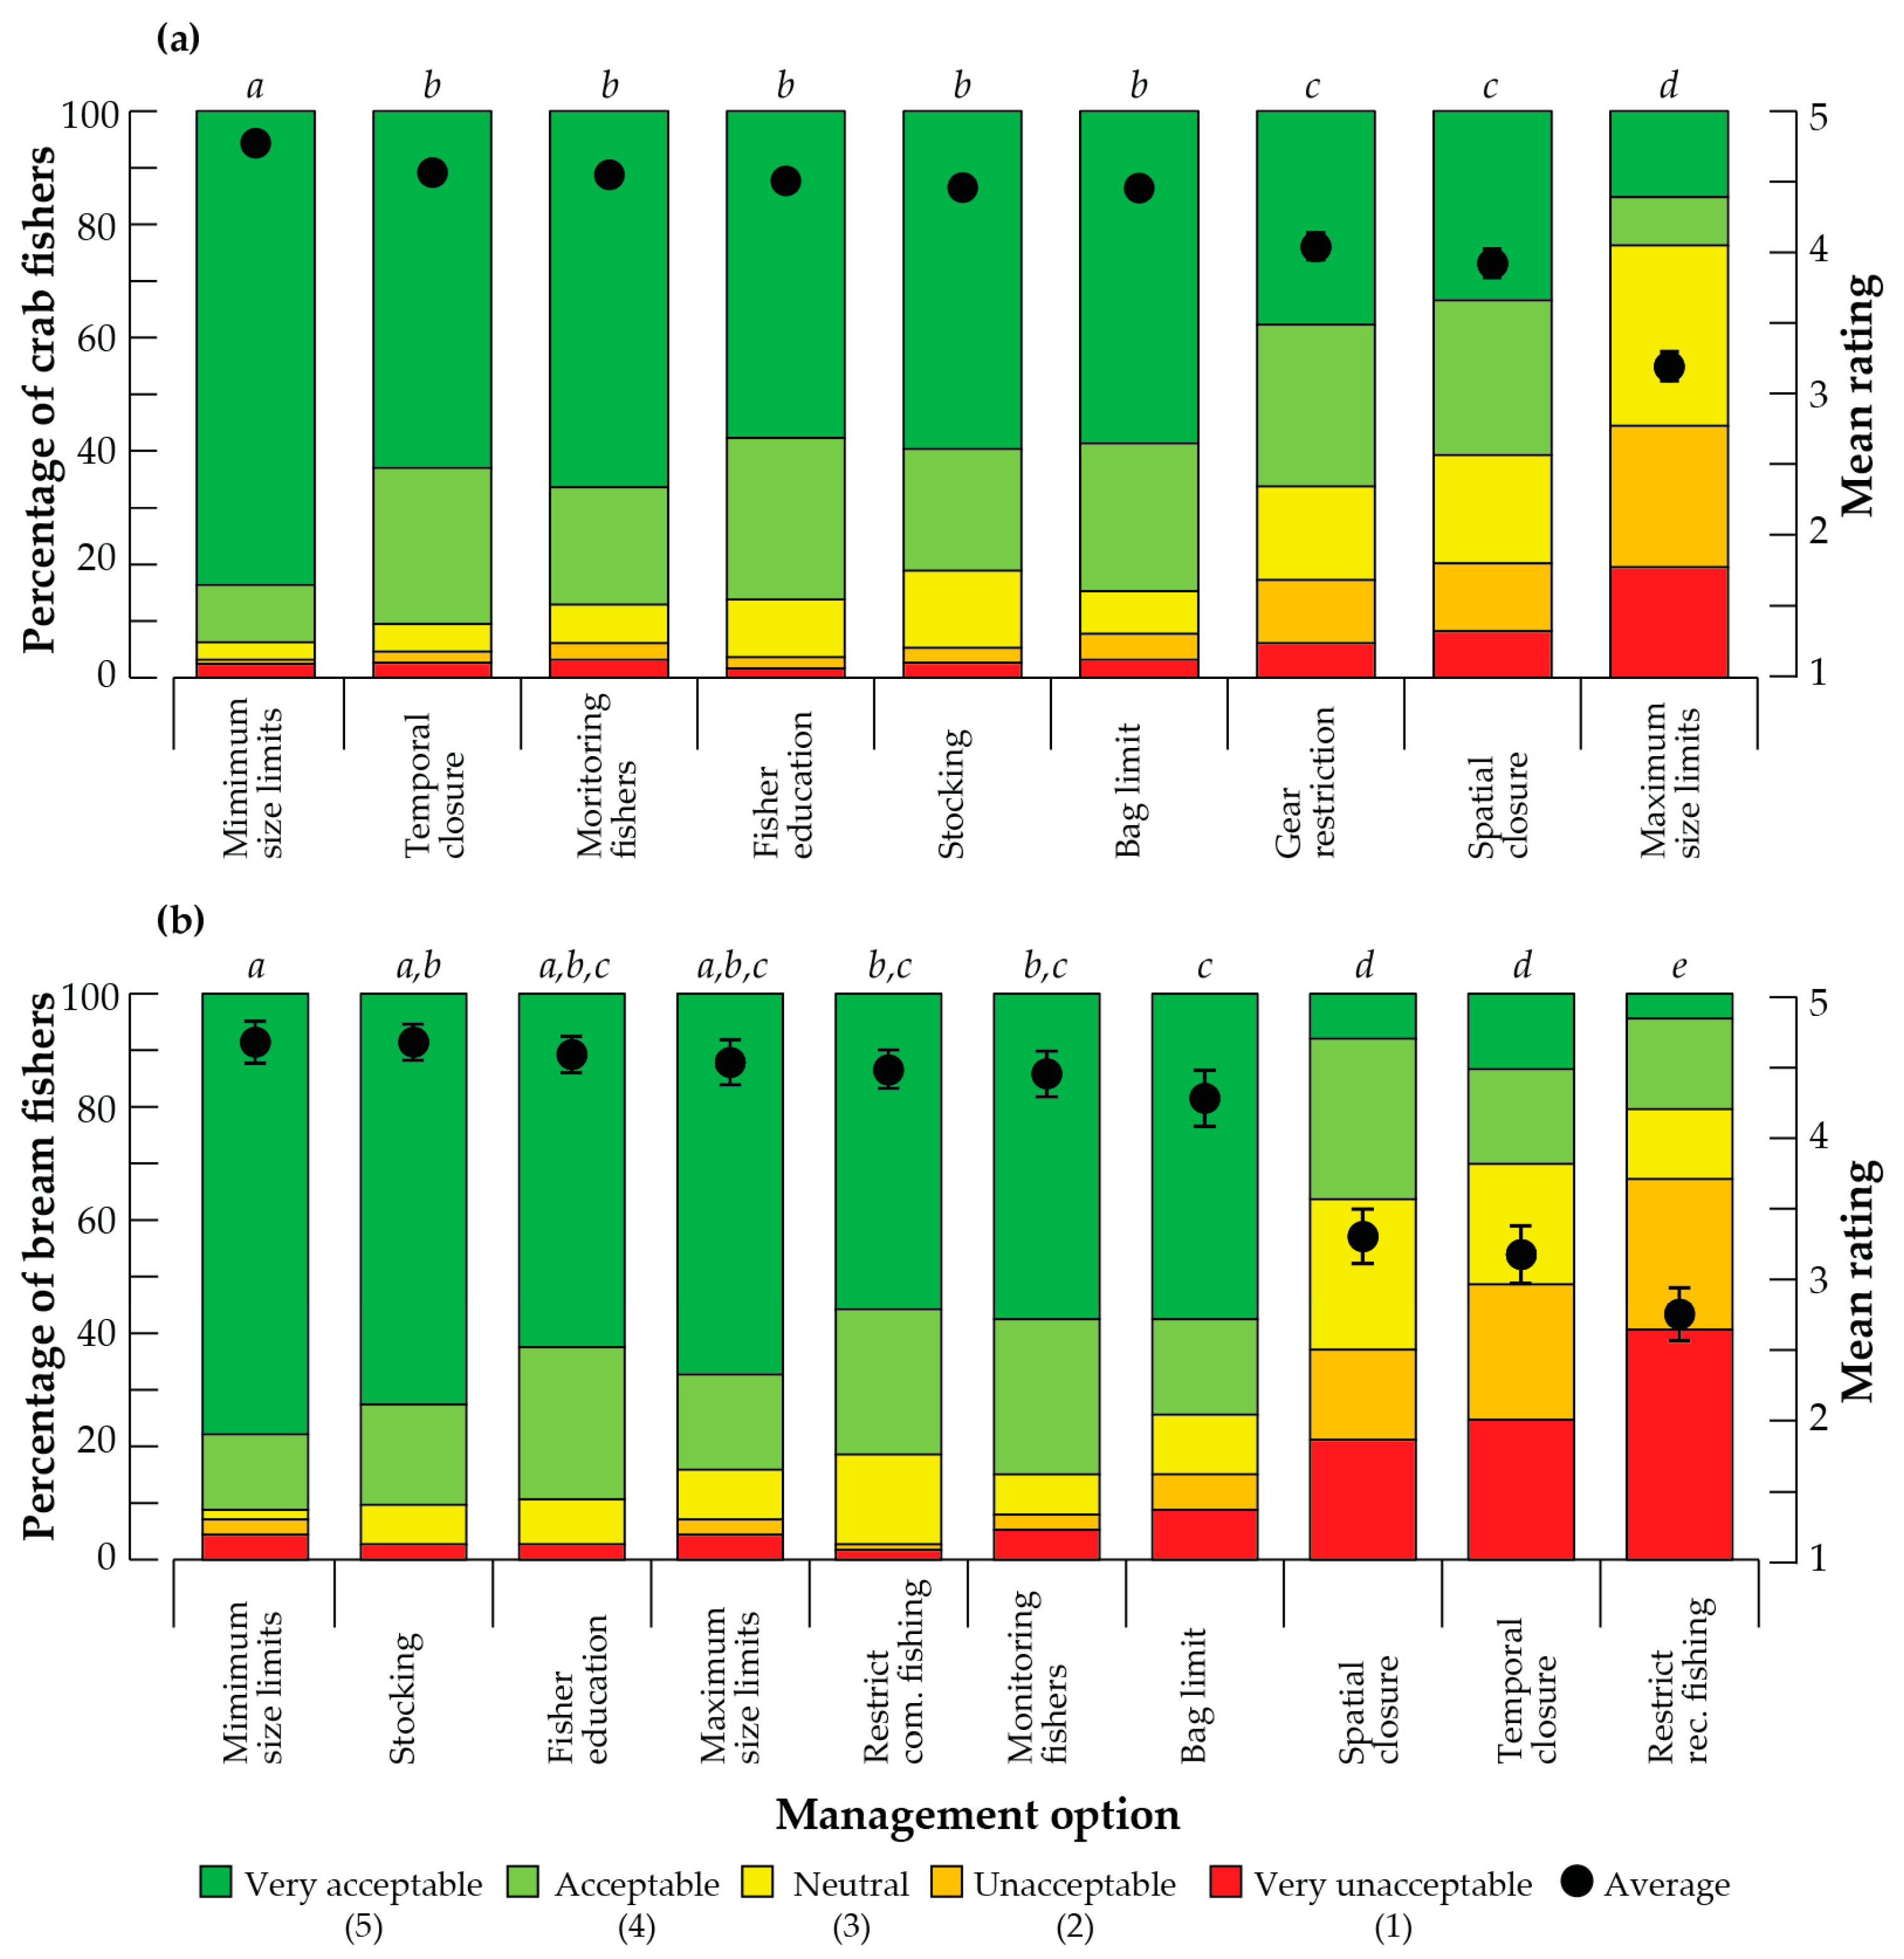
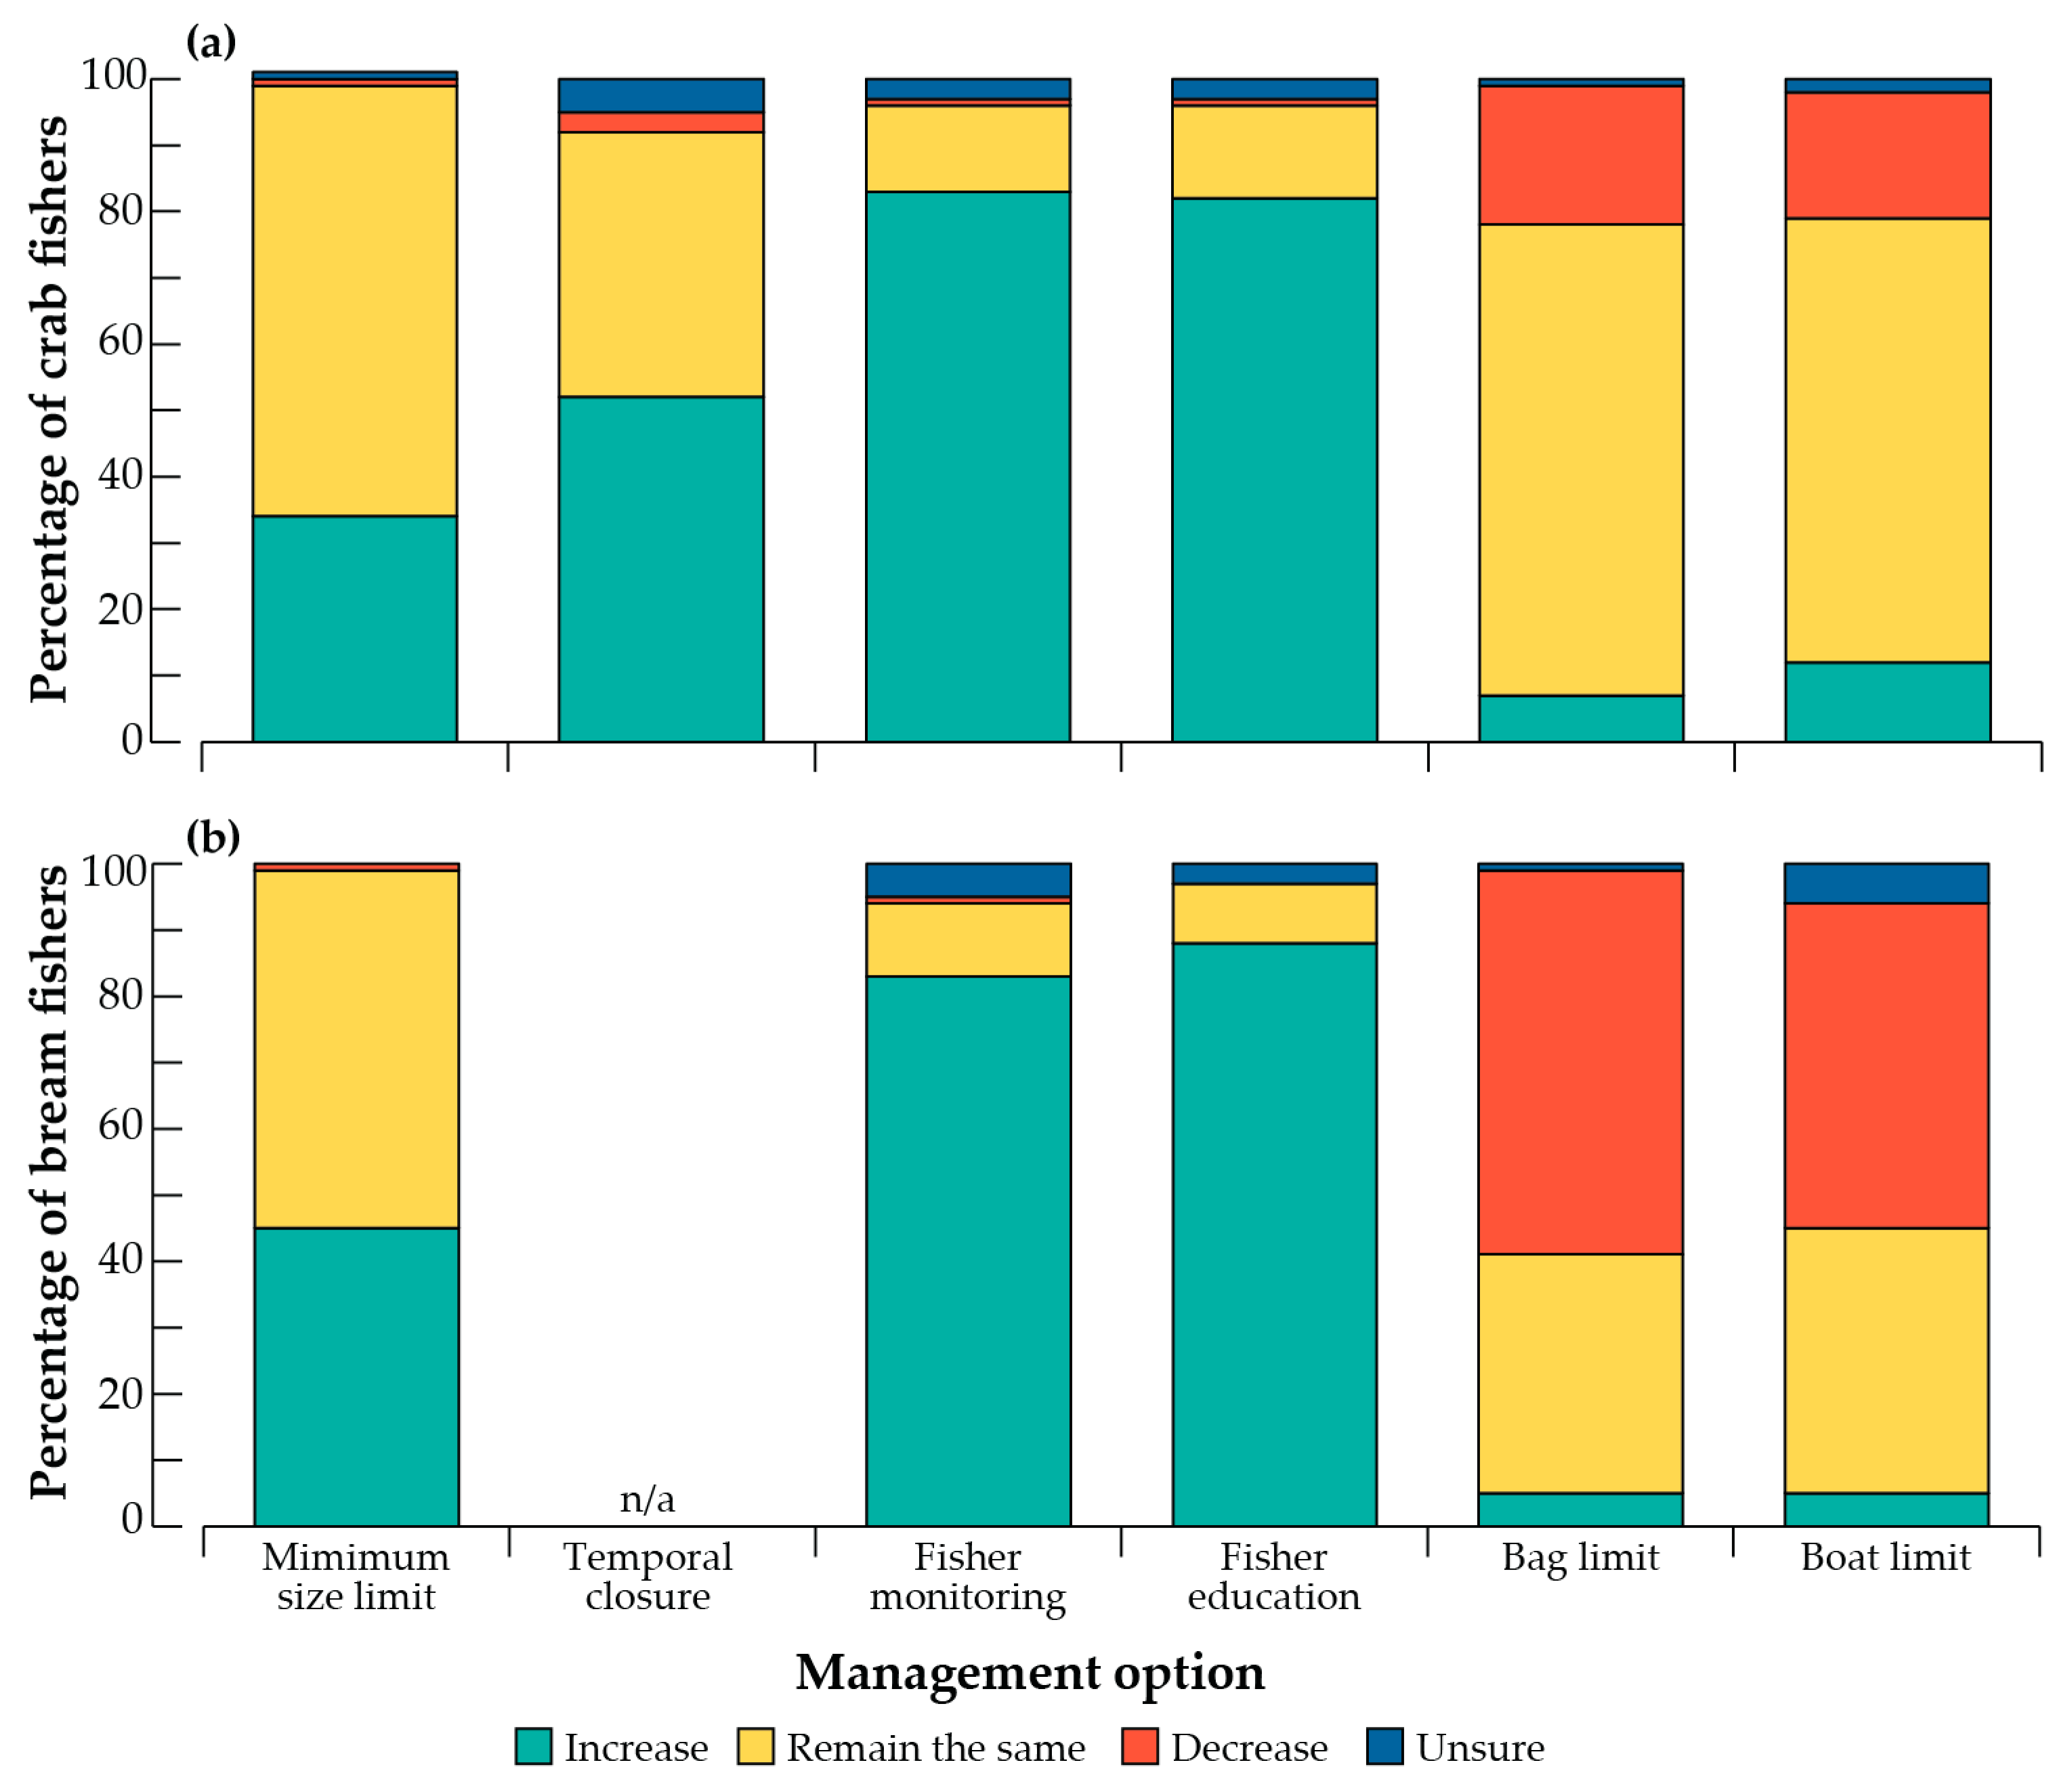
3.3. Views of Current Management and Management Tools

When asked about Blue Swimmer Crab fishery management across Western Australia, 27% of fishers agreed that they were well managed, and 39% disagreed (Figure 4). Fishers using the Swan–Canning were more likely than fishers in other systems to agree that this fishing location was well managed (36% agree and 34% disagree). Fishers in the Leschenault generally disagreed that this location was well managed (0% agree and 50% disagree; Supplementary Table S7). The majority of fishers, overall (69%) and in each location (66–85%), thought that better management of crab stocks was needed, with fishers in the Leschenault and Shark Bay appearing to be the most concerned. Around 50% of all respondents were unsatisfied with both the abundance and size of the Blue Swimmer Crabs (Figure 4), with this proportion increasing significantly in Shark Bay (Supplementary Table S7).
Recreational Black Bream fishers were more likely to disagree (46%) than agree (14%) that the fishery was well-managed (Figure 4). Most (69%) considered that stocks needed to be better managed, and they were unsatisfied with the number (61%) and size (63%) of Black Bream caught (Figure 4). The views of Black Bream fishers were fairly consistent across fishing locations, except that in all cases, fewer fishers that used ‘other’ estuaries were unhappy. Fewer fishers were unhappy with the management of the fishery in the Swan–Canning (38% disagreed with the statement that it was well managed) than the other systems (62% in Blackwood and 79% in Peel–Harvey) (Supplementary Table S8).
When asked about the acceptability of a range of current and potential fishery management options to regulate recreational catches of Blue Swimmer Crabs, those currently in place (except for gear restrictions) were deemed, on average, very acceptable, whereas options that have not been implemented were less popular, except for stocking (Figure 5a). On a scale of 1 (very unacceptable) to 5 (very acceptable), the means for the acceptability of the nine management options ranged from 4.72 (minimum size limits) to 2.75 (maximum size limits; Figure 5a). A Kruskal–Wallis test demonstrated that there was a significant difference among the options (H = 781.9, p < 0.001), with subsequent pairwise tests identifying four groups of options that differed in their acceptability (Figure 5a). The highest mean score for acceptability was 4.72 for minimum size limits, which was significantly greater than those for all other options, with 84% of respondents considering this option very acceptable. The group of the next most acceptable options (mean scores = 4.32–4.46) contained a suite of existing options, i.e., temporal closure, monitoring fishers, education, bag limits, and one possible option, i.e., stocking. These were deemed ‘very acceptable’ by between 58 and 66% of fishers, which rose to 81–90%, including those who also found them ‘acceptable’. Generally, only ~5% of respondents considered these as either ‘unacceptable’ or ‘very unacceptable’. Gear restrictions and spatial closures, however, were less popular (3.81 and 3.66, respectively), with only ~35% of fishers considering them ‘very acceptable’. The least acceptable option, with a mean score of only 2.75, was maximum size limits. Only 24% of fishers considered this either ‘very acceptable’ or ‘acceptable’ compared to 45% who selected unacceptable or very unacceptable (Figure 5a).
The views on managing crab fisheries differed among fisher groups and locations, except for stock enhancement (Supplementary Table S9). Between 50 and 67% of respondents selected stocking as very acceptable, being least for fishers utilising Shark Bay and greatest for fishers in group g (bi-monthly hand fishers). Fishers crabbing in the Peel–Harvey and Swan–Canning had similar views on the acceptability of all measures, and these differed from those of fishers in Leschenault for five of the nine measures and those in Shark Bay for eight of the nine. In general, a smaller proportion of fishers in Leschenault found the measures to be very acceptable, although often more selected ‘acceptable’. The trend for a lower proportion of fishers finding measures very acceptable was even more marked for those utilising Shark Bay (0% for maximum size limits to 50% for minimum size limits). Views towards management measures varied less among respondents in the various fisher groups, with any differences mainly due to a greater proportion of fishers in groups a (very frequent fishers) and g (bi-monthly hand fishers) finding measures very acceptable, proportionally more than in the other groups (Supplementary Table S9).
The acceptability of a range of current and potential fishery management options to regulate the catch of Black Bream ranged from a mean of 4.58 (i.e., the high proportion of very acceptable responses for minimum size limits and stocking) to 2.17 (i.e., the high proportion of unacceptable and very unacceptable, restricting access to recreational fishers; Figure 5b) and differed significantly among management options (Kruskal–Wallis H = 420.2, p < 0.001). Pairwise tests identified five groups of options that differed in their acceptability, although some, e.g., fisher education, were selected in multiple groups (Figure 5b). The options deemed most acceptable were minimum size limits and stocking, with >90% of respondents finding these very acceptable or acceptable (Figure 5b). Fisher education, maximum size limits, restricting commercial fishing, monitoring fishers, and bag limits were all relatively similar in their acceptability, with mean values ranging between 4.46 and 4.08 (Supplementary Table S10). On average, fishers had neutral views towards spatial closures (2.86) and temporal closures (2.70), with few fishers finding these options either very acceptable or acceptable (total 30–36%; Figure 5). The least acceptable measure, with a mean score of only 2.17, was restricting recreational fishing, where only 20% of fishers considered this either very acceptable or acceptable.
As with Blue Swimmer Crabs, recreational Black Bream fishers considered stock enhancement acceptable across all estuaries, with this also being true for fisher education, maximum size limit, spatial closure, and restricting recreational fishing (Supplementary Table S10). Among the measures whose acceptability differed among estuaries, minimum size limits were most acceptable in the Blackwood (92% very acceptable), followed by the Swan–Canning (79%) and then the Peel–Harvey and ‘other’ estuaries (71 and 72% respectively). Both restricting commercial fishing and fisher monitoring were more acceptable to fishers utilising the Peel–Harvey than the other estuaries, but the reverse was true for bag limits.
When asked whether any of the existing management measures for Blue Swimmer Crab fishers should change, the majority of recreational fishers across all locations and representing different fisher groups, considered that the minimum size limit, bag limit and boat limit should remain the same, but that fisher surveillance and education should be increased (Figure 6a; Supplementary Table S11). Marked differences in opinions about temporal closures were found among respondents utilising different locations, with ≥60% of those in the Peel–Harvey and Shark Bay saying the temporal closures should be extended compared to 42 and 45% in the Swan–Canning and Leschenault.
When the same questions were asked of recreational Black Bream fishers, most fishers wanted the minimum size limit to remain the same, particularly those very frequent fishers (group a), although a substantial proportion wanted it to increase. Support was elicited for an increase in fisher education (75–100% of fishers in all locations) and the level of fisher surveillance to increase (Figure 6b; Supplementary Table S12). Fishers’ views towards bag and boat limits were split between those supporting a decrease and those wanting the limits to remain the same. Views towards changes in existing measures were similar among all locations except for increasing fisher education, which was supported by 75% of fishers utilising the Blackwood compared to between 86 and 100% of fishers in the other estuaries.

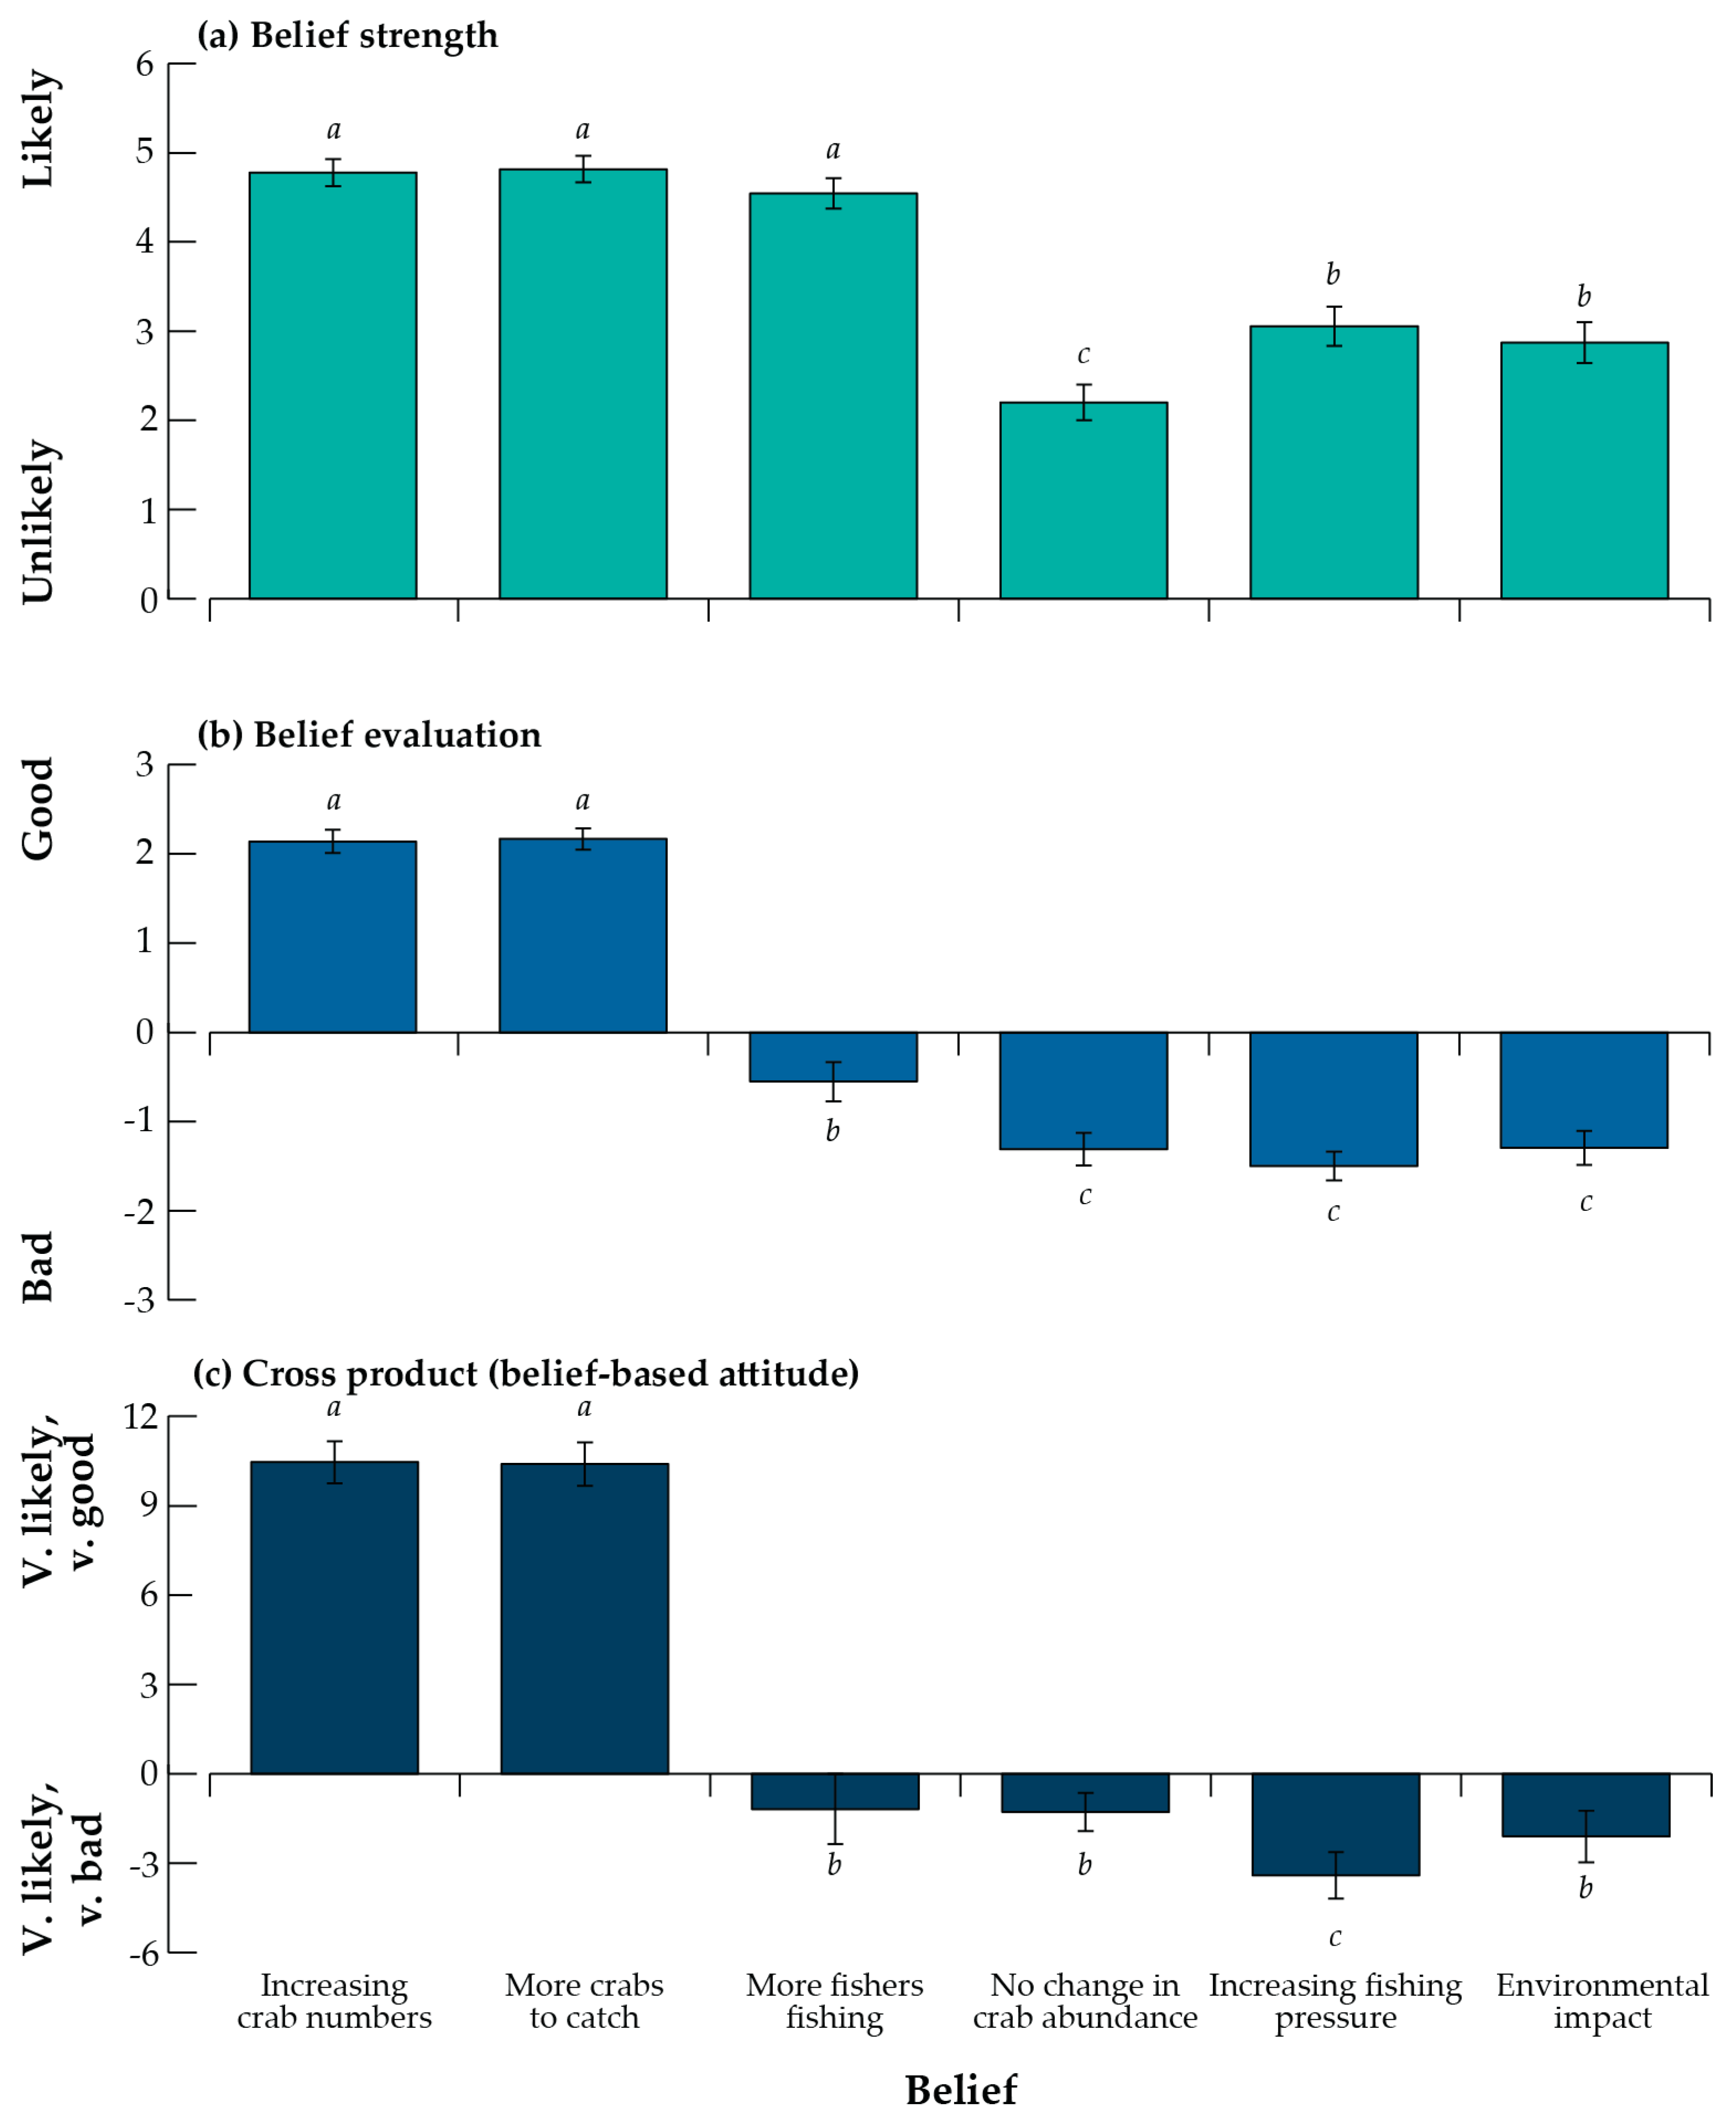
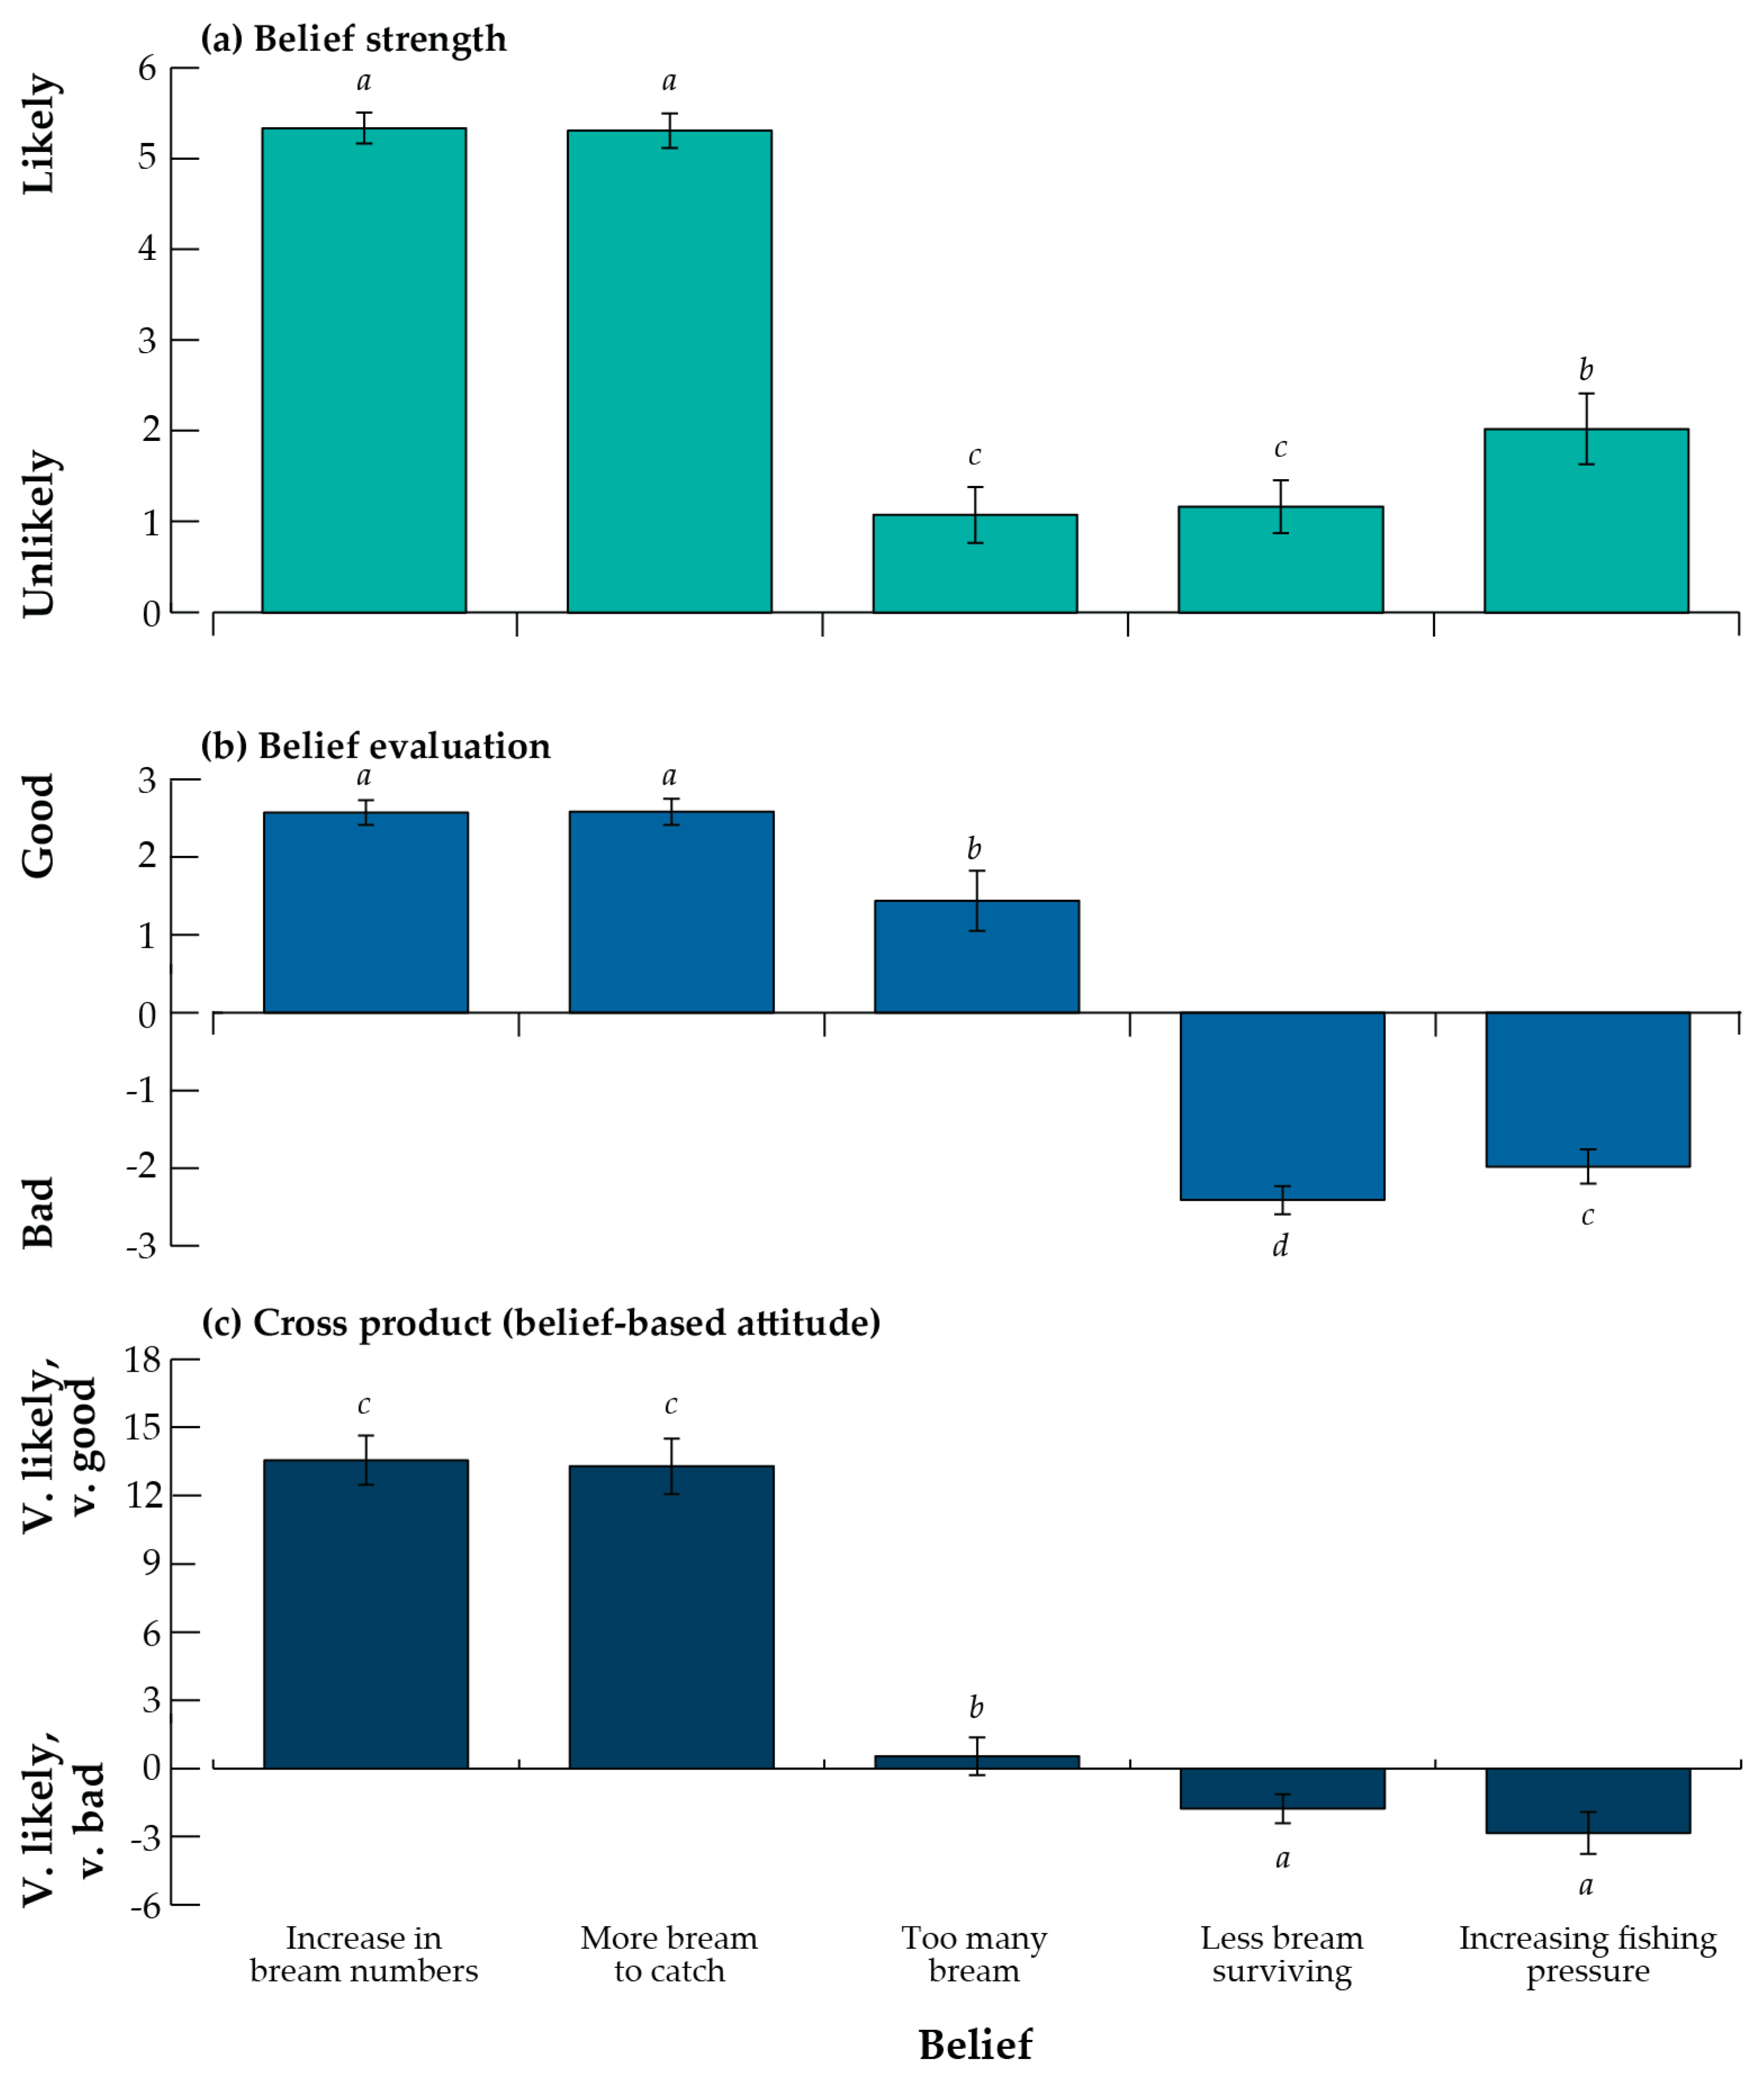
3.4. Beliefs and Attitudes to Stock Enhancement

The mean strength for each of the six behavioural beliefs identified in the face-to-face interviews and rated by recreational crab fishers on the online survey, i.e., the likelihood of each belief to occur if stock enhancement of Blue Swimmer Crabs is implemented, ranged from +4.78 to 2.20 (on a scale of 0 to 6; Supplementary Table S13) and differed significantly (H = 498.5; p < 0.001). Pairwise tests demonstrated that the beliefs fell into three groups (all p < 0.05; Figure 7a): (a) outcomes that were considered likely, i.e., that stock enhancement would result in an ‘increase in the number of crabs’, result in ‘more crabs to catch’ and also ‘more fishers fishing’ for the Blue Swimmer Crabs (4.78–4.54), (b) outcomes where fishers were unsure (i.e., neutral) of what would happen i.e., an ‘increase in fishing pressure’ (3.05) and ‘impact on the environment’ (2.87), and (c) those that were slightly unlikely following stock enhancement, i.e., ‘no change in the abundance of crabs’ (2.20). The views of fishers (overall) were consistent with those for each fishery and each fisher group, except those utilising Shark Bay, where the views in belief group b (increase in fishing pressure and environmental impact) and c (no change in crab abundance) were considered more unlikely (Supplementary Table S13).
The mean evaluation for each behavioural belief, i.e., whether the outcome from any stock enhancement program would be good or bad, ranged from +2.14 to −1.50 (on a scale of −3 to +3) and differed significantly among beliefs (H = 985.5; p < 0.001; Figure 7b). Three different groups of beliefs were identified (p < 0.01; Supplementary Table S13); group a contained two of the outcomes associated with a positive judgement, i.e., ‘increased number of crabs’ and ‘more crabs to catch’ (2.14 and 2.17, respectively), group c beliefs were associated with a negative effect, i.e., ‘increase in fishing pressure’ (−1.50), ‘no change in crab abundance’ (−1.31), and ‘impact on the environment’ (−1.30), while group b contained the neutral/somewhat bad view (−0.55) regarding the potential for ‘more fishers fishing’. The views of fishers were consistent among the various locations but differed between fisher groups (Supplementary Table S13). Generally, the views of fishers in groups b, c, d and f were consistent with the overall Blue Swimmer Crab fishing community. However, those in group a (very frequent fishers) considered ‘no change in crab abundance’ to be a worse outcome than fishers in other groups. Fishers in group e (inexperienced shore-based drop net fishers) were more optimistic that no change in crabs following stock enhancement is not as bad as other groups and were less worried that it would ‘impact on the environment’.
The mean cross-product, i.e., the belief strength × belief evaluation (belief-based attitude), for the six behavioural beliefs of Blue Swimmer Crab fishers to stock enhancement, ranged from +10.45 to −3.41 (on a scale of +18 to −18) and were found to differ significantly (H = 884.2; p < 0.001; Figure 7c). As with the belief evaluation, the cross-product for only an ‘increase in crab number’ (+11.45) and ‘more crabs to catch’ (+10.39) were positive and significantly greater than all other beliefs (p < 0.001;). The beliefs that there will be ‘more fishers fishing’, ‘no change in crab abundance’, and an ‘impact on the environment’, were all negative going from bad but unlikely (−1.18 and −1.28), to likely and somewhat bad (−2.10). The lowest cross-product was for ‘increased fishing pressure (−3.41).
The cross-products of the six beliefs differed significantly among locations and fisher groups (Supplementary Table S13). Fishers in the Leschenault and Shark Bay had a more positive view of more ‘more fishers fishing’ and ‘impact the environment’ compared to fishers in the Peel–Harvey and Swan–Canning. Among fisher groups, those in b, c, d, and f were similar to the overall population of fishers, with those in a and particularly g being more concerned about the impact of ‘increased fishing pressure’ and group g was also more concerned about ‘more fishers fishing’. Fishers in group e (inexperienced shore-based drop net fishers) had positive belief-based attitudes.
The mean strength for each of the five behavioural beliefs identified by recreational Black Bream fishers that could occur if stock enhancement is implemented ranged from +5.34 (increasing number and more bream to catch) to 1.08 (too many bream) and differed significantly (H = 285.2; p < 0.001). Pairwise tests demonstrated that the beliefs fell into three groups (all p < 0.05; Figure 8a). These were (group a) outcomes that were considered very likely, i.e., ‘increase in the number of bream’ and ‘more bream to catch’ (both ~5.3); (group b) outcomes, which fishers thought were somewhat unlikely would happen i.e., an ‘increase in fishing pressure’ (2.02) and (group c) those considered unlikely following stock enhancement, i.e., ‘less bream surviving’ and ‘too many bream’ (~1.1). These views represented all fishers were consistent across all locations and fisher groups, except those utilising Wilson, where almost all beliefs were considered ‘somewhat likely’ to ‘likely’ to occur (Supplementary Table S14).
The mean evaluation for each behavioural belief ranged from +2.58 to −2.41 and differed significantly (H = 317.9; p < 0.001), with pairwise testing identifying four groups of beliefs (Figure 8b). Three of the beliefs were associated with a positive judgement, with ‘increased number of bream’ and ‘more bream to catch’ (2.57 and 2.58, respectively) having significantly higher values than all other beliefs (KW p < 0.001; Supplementary Table S14). The other positive belief was that there would be ‘too many bream’ (1.44). An ‘increase in fishing pressure’ (−1.98) and ‘less bream surviving’ (−2.41) were considered to be the worst beliefs associated with stock enhancement and were significantly lower than all other beliefs (all p < 0.05; Figure 8b). The views of fishers were consistent among the various fisher groups but differed between locations. The fishers’ evaluation of the beliefs were generally fairly consistent except for ‘too many bream’, with those utilising the Blackwood, Peel–Harvey, Swan–Canning considering this to be somewhat good—good (+2.56 and +2.27, respectively), those in the Wilson (0.00) and ‘other’ (+0.59) had a more neutral view (Supplementary Table S14).
The mean cross-product for the six behavioural beliefs of Black Bream fishers to stock enhancement ranged from +13.54 to −2.84 and differed significantly (H = 321.7; p < 0.001; Figure 8c). As with the belief evaluation, both ‘increase in bream numbers’ (+13.45) and ‘more bream to catch’ (+13.28) were strongly positive (i.e., good and likely) and differed from all other beliefs (p < 0.001; Supplementary Table S14). The beliefs that there will be ‘less bream surviving’ and ‘increasing fishing pressure’ were both slightly negative (i.e., −1.77 and −2.84, respectively), meaning they were considered bad but unlikely. Overall, beliefs about their being ‘too many bream’ were neutral (+0.54).
The cross-products of the behavioural beliefs for the fishers of both species revealed similar trends (Figure 7c and Figure 8c), i.e., that stock enhancement would lead to increased numbers of both target species and more individuals to catch, with these being slightly more positive amongst Black Bream fishers (i.e., ~13.5 vs. ~10.5). Moreover, in both species, beliefs relating to the potentially deleterious effects of stock enhancement, i.e., ‘increased fishing pressure’ (both species), ‘environmental impacts’ (Blue Swimmer Crab only), and ‘less bream surviving’ were all regarded as unlikely and only somewhat bad (range = 0.54 to −3.4).
More than 85% of respondents agreed with the statement that stock enhancement of Blue Swimmer Crabs would be a good undertaking, with 45% stating that it would be very good. In contrast, only 4% of fishers thought that it would be a very bad thing to do (Figure 9). The views of these fishers were similar among both locations (H = 4.06; p = 0.254) and fisher groups (H = 9.35; p = 0.156). An even higher percentage of Black Bream fishers considered stock enhancement as a good thing, i.e., 93%, with 63% stating it would be very good. Although these views were consistent among locations (H = 2.15; p = 0.543), they differed significantly among fishers in groups d (inexperienced and intermediate skill fishers) and e (inexperienced but keen fishers), i.e., those with large enough numbers of respondents to provide a rigorous test (H = 7.23; p = 0.007). Both groups were strongly supportive of enhancement; however, a small minority of fishers in group d had negative opinions of this management measure (i.e., 3.7% very bad and 3.7% somewhat bad). In contrast, no respondents from fisher group e selected one of the negative options and, in fact, 82% selected very good and 15% good (Figure 9).

3.5. Implications for Stock Enhancement

If stock enhancement was to occur, 88% of recreational Blue Swimmer Crab fishers and 96% of recreational Black Bream fishers stated they would continue to fish for their target species (Supplementary Table S15). These views were consistent across all crab fishing locations (87–89%; p > 0.05) and fisher groups (82–100%; p > 0.05) except for those fishers utilising Shark Bay and those in group g (bi-monthly hand fishers), where the proportion of fishers who agreed with the statement was less and those that were unsure increased. The views of Black Bream fishers regarding whether they would fish after stock enhancement were homogenous across locations and fisher groups (p > 0.05; Supplementary Table S15).
As the main motivation for recreational fishing for Blue Swimmer Crabs is food [32], fishers were asked a series of questions about what they would do if they caught a hatchery-reared crab. The vast majority (84%) agreed with the statement that they ‘would eat it as if it was wild crab’, with only 3% disagreeing (Figure 10). A similar trend was exhibited by fishers in all locations (81 to 95%) and between all fisher groups (80 to 88%) except a (very frequent fishers) and g (bi-monthly, hand fishers), where a greater proportion of fishers disagreed (20% and 17%, respectively vs. 0–6% for the other groups), although this did not reduce the proportion of those fishers that agreed (Supplementary Table S16). Fishers were generally unsure whether they would prefer aquaculture to wild crabs, with responses spread uniformly amongst the three options but with most (41%) in the ‘don’t know’ category. Most fishers stated that they disagreed with the following statements: ‘I would not eat it myself but would keep it for family/friends’ and ‘I would release after capture, I don’t like aquacultured crabs’ (75 and 64%, respectively), further reinforcing their earlier statement about eating stocked crabs as if they were “wild” crabs.

4. Discussion

Estuaries and their component fisheries are subject to a multitude of pressures, some of which are competing and often require a suite of management measures to maintain or improve sustainability. Engaging fishers and understanding their thoughts on management options can be beneficial and boost community support for those measures and, as a result, increase compliance [9,10,54]. This is particularly valuable for recreational fishers who act relatively autonomously, and thus, their management often relies heavily on encouraging voluntary compliance. This study evaluated the salient views of recreational fishers on issues affecting the Blue Swimmer Crab (Portunus armatus) and Black Bream (Acanthopagrus butcheri) fisheries in Western Australia, current and potential management arrangements for these two species, and how they perceive stock enhancement as a management option.

4.1. Perceived Fishery Issues

The vast majority of recreational crab fishers considered their fisheries to be experiencing problems and elicited ten issues, of which the top five were all catch-related, i.e., taking undersize crabs, overfishing, exceeding the bag limit, and too much commercial and recreational fishing. Similar results were obtained from recreational bream fishers, with the taking of undersized fish, lack of fisher education, overfishing, and exceeding the bag limit as the main issues. The focus of fishers on catch-related issues is not surprising given that the main motivations of crab and bream fishing are catch-orientated, albeit for consumptive and trophy reasons, respectively [32].
Inter-estuarine differences among recreational crab fishers were mainly due to (i) the retention of undersize crabs being raised by more fishers in the Peel–Harvey than the Swan–Canning and (ii) fewer fishers in Leschenault selecting commercial fishing as an issue. It should be noted that in the context of the Peel–Harvey crab fishery has the highest-recorded levels of non-compliance of any fishery in Western Australia, with 20% of all reported enforcement issues along the Western Australian coast being from this estuary [40] and stories of infringements are often reported in print, broadcast and social media. This highlights the issue of non-compliance and raises awareness among fishers and could thus have influenced their views. Commercial crab fishing was occurring in the Swan–Canning and Peel–Harvey estuaries at the time of the surveys, but operations ceased in Leschenault in 2001 [55], explaining the reduced proportion of concerns about this issue in that estuary. For most of the elicited issues, a similar proportion of recreational fishers for both species agreed. However, a greater proportion of crab than bream fishers mentioned exceeding the bag limit, which could reflect the consumption-oriented nature of crab fishing and the fact that most bream fishers release their catches [32].
Non-catch issues such as pollution and climate change were identified by only a small proportion of recreational crab and bream fishers. Although many estuaries globally are focal points for industrial activities [56,57], aside from port facilities at the mouths of the Swan–Canning and Leschenault, there is limited evidence of heavy industrialisation of estuaries in the region [58], and there are no regular signs of contamination, e.g., chemical/oil spills. Furthermore, although many estuaries in south-western Australia suffer from eutrophication [58] until visible micro-and macroalgal blooms and fish kills occur (e.g., [24,59]), the local community may not be aware that such environmental issues exist (e.g., [60]). It is noteworthy that a larger proportion of bream than crab fishers raised pollution as an issue, as typically, algal blooms and fish kills occur in the more upstream reaches of estuaries where Black Bream resides [21,44]. Thus, bream fishers may witness such perturbations more frequently than those fishers targeting crabs in more downstream areas.
A survey by Ryan et al. [61] on recreational fishers in Western Australia demonstrated that most accepted that climate change was occurring, albeit this proportion was less than that for the broader Australian population [62], and 60% had noticed changes in the species caught, for example, finding tropical species in temperate waters (e.g., [63]). To account for the discrepancy in acceptance of climate change between the above two studies, it was suggested that the reduced acceptance of climate change observed among fishers might be due to the potential attribution of changes to a range of factors, e.g., natural variability in abundance, fishing effort, water quality, and habitats and so it is difficult to disentangle the effect of climate change [61]. Moreover, although there is evidence to suggest that the growth rates of Black Bream are slowing due to climate change [25,26], this information is not well-known in the fishing community. Thus, while the presence of fish outside their normal spatial distribution is relatively easy to detect and attribute to climate change, other effects are less obvious, such as reduced dissolved oxygen levels or changes in prey availability [64,65].

4.2. Views of Current Catches and Management

The majority of recreational fishers for both species stated that, in their opinion, both the abundance of crabs and bream and their sizes had decreased and that the number of fishers targeting them had increased. The views of crab fishers in the online survey are consistent with those from separate face-to-face surveys in the Swan–Canning and Peel–Harvey estuaries, with the declines in the size of crabs in the Swan–Canning also supported by scientific monitoring data and those relating to size and abundance in historical newspaper records [35]. The reported reduction in size and abundance of Black Bream is also mirrored by declines in growth and body condition of individuals and a movement from deeper, offshore waters into shallower, nearshore waters due to decreased freshwater flow and an increase in the extent of hypoxia [25,26]. The increase in the number of fishers reported by respondents in the current study reflects the increasing population of Western Australia, which has resulted in the estimated number of recreational fishers more than doubling from 315,000 in 1989/90 to 711,000 25 years later [31] and the iconic nature of these fisheries.
In general, recreational crab fishers perceived crab fisheries as needing better management, with the Swan–Canning Estuary rated as the best managed and Shark Bay as among the worst (i.e., 34% and only 17% of respondents stating the fishery was well-managed, respectively). As crab fishers’ motivations are strongly consumption-orientated, with fishers wanting to ‘catch enough crabs to eat’ and ‘catch big crabs’ [32], it is likely their views are influenced by their catch success. It is thus relevant that fishers perceive crabs from the Swan–Canning as being larger than those from the Peel–Harvey, a view supported by scientific data [35]. Furthermore, high numbers of non-compliant recreational fishers have been apprehended over time in the Peel–Harvey [40], which could influence the views on management for this system compared to the Swan–Canning. In Shark Bay, the relatively negative views on management could have been influenced by the closure of the crab fishery for 18 months in 2012 and 2013 in response to low crab abundance due to a marine heat wave [42].
Recreational bream fishers considered their fisheries to be more poorly managed than crab fishers. This could be linked to the obvious signs of degradation present in the upstream areas of estuaries in the region [21,22]. Additionally, as fishers regard Black Bream as a trophy species [32], declines in growth mean there are fewer larger fish [66], which may have impacted their fishing experience and, thus, perceptions of management. The estuaries where people were most satisfied were in the ‘other’ category, which includes systems such as the Beaufort and Stokes inlets that are located in regional areas and so are less heavily fished [31,45]. Note that this survey was conducted before a major fish kill (including large numbers of Black Bream) occurred in Beaufort Inlet [24].
While fisher’s views on management between species and among fishing locations seem to be related to real-world events, some biases may be present. For example, although Australian fisheries have a reputation of typically being well-managed [67] and the Peel–Harvey Blue Swimmer Crab fishery has Marine Stewardship Council certification [39], recreational fishers may have a tendency to engage with information that states that fisheries are not well managed/could be better managed (i.e., confirmation bias). Additionally, some fishers may hope that their response to a survey will result in a desired outcome, e.g., reduced commercial catch allocation, and therefore, provide answers that may be biased (i.e., response bias).

4.3. Opinions on Management Tools

Existing management measures were the most popular for crab fishers, i.e., minimum size limit, followed by temporal closure, fisher monitoring, fish education, and bag limits. Of the potential management options not currently in use, stock enhancement received the most support (94% ≥ good). These results are consistent with Garlock and Lorenzen [15], who found that marine fishers in Florida showed more support for various restrictive strategies, such as bag limits and minimum size limits, compared to stocking. Similarly, Rubio et al. [68] found that minimum size limits, along with habitat-related management strategies, were the most preferred interventions for coastal recreational fisheries in the USA. This trend may be explained by the familiarity that fishers have with the existing management policies, with fishers potentially preferring those regulations that they currently comply with and understand [69]. For example, when fishers were offered a list of alternative fishery regulations, they commonly selected those that were most similar to existing ones [70,71]. Fishers are familiar with minimum size limits as these are commonly used to manage recreational fisheries [72], easy to interpret, and they comprehend the logic behind them (i.e., protecting fish until they mature) and communicate widely through fishing apps and websites and also interpretative signs at fishing locations. Given the well-publicised level of non-compliance in recreational fisheries, particularly in the Peel–Harvey [40,73], it is not surprising that fisher surveillance and education were strongly supported.
Although bag limits are among the most widely used management tools in recreational fisheries [72], this option ranked low among options evaluated by recreational crab fishers. This likely reflects the consumption-orientated motivation of crab fishers. For example, despite respondents stating that reaching their bag limit of 10 crabs was not among the strongest motivations, 37% admitted having retained more crabs than legally allowed [32]. A previous survey on non-compliance found that 22% of respondents self-reported that their average catch exceeded the bag limit of 10 crabs [43].
The least supported management options were spatial closures and maximum size limits. Previous studies of recreational fishers in Western Australia have shown that attitudes towards no-take zones vary with fishers’ motivations and their specialization [74]. Closed areas have been previously introduced in popular fishing locations for Blue Swimmer Crabs. For example, recreational crabbing was permitted in the nearby marine embayment of Cockburn Sound until 2006, when it was closed and remains closed today, except for a 10-month re-opening in 2009–2010 [36]. Thus, fishers may be worried that if a recreational crab fishery in a location is closed, it will remain closed, thus restricting fisher access. Maximum size limits were the least popular management measure, reflecting the strong primary motivation fishers have for ‘catching big crabs’ [32].
Similar results were obtained from Black Bream fishers, with existing management options (e.g., minimum size limits, education, restricting commercial fishing, fisher monitoring, and bag limits) being the most accepted. Stocking and maximum size limits were the options that rated well but have not been widely employed. The support for stocking reflects the generic support for this option and that it has been used successfully before in the Blackwood River (see below). The support for a maximum size limit is likely related to the trophy nature of the fishery [32]. Given that the highest rated motivation for Black Bream fishing was to ‘catch a big bream (>30 cm)’, the catch and release nature of the fishery, and that the growth rates of this species have declined [25,75] (making larger fish rarer) it seems logical this management option would be well-supported to maintain stocks of larger individuals, despite it not being widely employed in Western Australia [51]. Management options that would limit the opportunity for fishers to catch Black Bream were the least acceptable, i.e., spatial and temporal closures and restricting recreational fishing, a finding also reported for freshwater recreational fisheries in Germany [76]. Spatial and temporal closures were substantially less popular amongst recreational bream than crab fishers. It is relevant that recreational fishing was listed as the eighth biggest issue of the nine identified by bream fishers, with 43% of fishers agreeing and 30% disagreeing); in contrast, it was listed as fourth of ten by crab fishers (62% agree and only 11% disagree). Moreover, most bream fishers reported catch-and-release fishing, whereas crab fishers consumed their legal-sized catch. Based on these results, recreational bream fishers likely feel their fishing has less of an impact on fish stocks, and so management measures that restrict access are not considered acceptable.
Combining their views on the fishery status and the acceptability of various existing and potential management measures, recreational fishers think management needs improving and have identified that the current fishery regulations are relatively socially acceptable. In other words, they support the way the fishery is managed but think it needs to be better managed. Crab fishers advocated for catch-related measures, i.e., size limit and bag and boat limit, to remain the same and fisher education and surveillance to increase. This would allow the stock to be protected by reducing non-compliance without impeding catches reflecting the consumption-orientated nature of the fishery. Among the three estuaries, increases in fisher surveillance were most strongly supported in the Peel–Harvey Estuary, where non-compliance is greatest [40]. Differences in the level of support for temporal closures were detected, with fishers from the Peel–Harvey more supportive than those in the Swan–Canning and Leschenault. At the time of the survey, a temporal closure was only in place for the Peel–Harvey, and thus, the stronger support may reflect fishers’ familiarity with this regulation [70,71].
Except for fisher education (increase) and surveillance (increase), recreational bream fishers were generally split in their opinions on the acceptability of management measures. For example, 58 and 49% overall wanted bag and boat limits to decrease, compared to 36 and 40% who thought they should remain the same. While these views are relatively consistent across estuaries, they differ markedly among fisher groups. This showcases the heterogeneous views of fishery users [6,77], with avid and skilled fishers who fish in competitions wanting these measures to be increased.

4.4. Stocking as a Management Option

Stocking was rated as among the most acceptable of the management options provided and was clearly the most acceptable of those options not currently in use for crabs, a short-lived invertebrate species targeted as a food source, and for bream, a longer-lived finfish species targeted for sport. Thus, despite the differing biological characteristics and motivations for fishing, stocking was a popular management option. Moreover, in comparison to some of the other management options where the level of support differed among systems or among fisher groups (i.e., heterogenous views), the views of fishers on stocking were homogenous. While limited studies of fisher support for stocking have been made in Australia [78], studies in Europe and North America suggest that there is considerable support for such a program [15,79]. Belief elicitation in the current study identified that, regardless of the species (crabs or bream), fishers thought stocking would result in increasing numbers of their target species and, in turn, there would be more to catch. Beliefs that releasing fish leads to improved catches have also been reported for salmonids in Lake Huron [80]. It is likely that fishers prefer this management option over measures that reduce access to fishing (e.g., spatial closures, licenses) and catches. Stocking for Blue Swimmer Crabs has only been trialed at an experimental stage (release of ~3700 individuals) [37,81] in Western Australia, while that for Black Bream has occurred on a relatively large scale (~150,000 individuals) in the Blackwood Estuary [82]. Thus, fishers’ views on stocking Black Bream are likely deep-rooted [83] and/or based on their familiarity with local programs, e.g., for trout in freshwaters [84] and the recently initiated Snapper Guardians program in Cockburn Sound.
Unlike other studies [15,85], a moderate proportion of fishers identified some negative outcomes that may result from a stocking program. These included increased fishing effort [86,87], impacts on genetic diversity and abundance [88], predation and competition between stocked and wild stock, and reducing wild populations [12]. The belief elicitation demonstrated, however, that fishers considered these negative impacts as only fairly likely, at best, and slightly bad. These views could reflect the strong desire for catch-related outcomes from their fishing (i.e., more crabs for consumption or larger bream (trophy-orientated)), and so fishers may downplay the negative impacts associated with this management strategy due to their interest in catching greater numbers of their target species and the belief that stock enhancement will enable this. This is probably due to a cognitive bias that results in a tendency to ignore the possibility of negative effects and produces over-optimism, encouraged by the motivations of the fishers [78].
There is no evidence from our surveys to suggest that any stocking program would deter recreational fishers from fishing. Moreover, the majority of crab fishers would eat a hatchery-reared crab as if it was wild-spawned, and only 3% would release a hatchery-reared crab if it was legal-size. This is relevant as any stocking program would have associated costs, which could, if needed, be recouped from a license fee or through increased recreational expenditure [89]. A study from British Columbia suggested that stocking leads to an increase in participation and license sales [90]. At a local level, anecdotal evidence from the stock enhancement of the Western School Prawn (Metapenaeus dalli) in the Swan–Canning Estuary suggested that recreational effort in this consumption-oriented fishery increased, together with expenditure on fishing gear during the stocking program [91].

5. Conclusions

This study has shown that most recreational fishers consider that Blue Swimmer Crab and Black Bream fisheries in Western Australia suffer from a range of catch-related issues (e.g., retention of undersized individuals and overfishing) and require better management. The acceptability of several management options was evaluated, with the most supported measures being those currently in place, along with stock enhancement, reflecting the consumption-oriented and trophy-oriented motivations of crab and bream fishers, respectively. Fishers considered increased fisher education and surveillance to be important. If successful, these management measures would increase compliance and sustainability of the fisheries without restricting access or catches. As managing recreational fishers relies heavily on encouraging voluntary compliance, involving fishers in the management process (co-management) could be useful. The development of a co-management process could be informed by surveys such as those completed in the current study [92]. Arguably, the generally homogenous views of crab fishers, when compared with bream fishers, may mean that co-management of crab fisheries could be more readily implemented. In contrast, co-management of bream fisheries, associated with more heterogenous views across bream fisher groups, could be more challenging.
Stocking was universally accepted as a viable management option by recreational fishers of both species in all locations and among fisher groups. The support from recreational fishers for stock enhancement was due to their strong beliefs that such programs would increase stocks and catches of their target species. While some fishers considered that stocking may have some negative impacts, they considered these negative impacts to be unlikely. Although autonomous in their individual decision-making and compliance, recreational fishers are a key stakeholder group and, in some areas, can significantly influence decision-making by management authorities [74]. Any co-management would need to balance fisher expectations with the biological impact of hatchery-reared fish on wild stock and increased fishing pressure.

Supplementary Materials

The following supporting information can be downloaded at: https://www.mdpi.com/article/10.3390/fishes8090460/s1. Table S1: Number of responses (n) and the frequency of occurrence (%) of responses about the demographics of Blue Swimmer Crabs and Black Bream fishers; Table S2: Number of responses (n) and the frequency of occurrence (%) of responses about the characteristics of Blue Swimmer Crabs and Black Bream fishers; Table S3: Percentage of recreational Blue Swimmer Crab fishers that agreed, disagreed or were unsure about the effects of potential issues on their chosen fishing location; Table S4: Percentage of recreational Black Bream fishers that agreed, disagreed or were unsure about the effects of potential issues on their chosen fishing location; Table S5: Percentage of recreational Blue Swimmer Crab fishers that considered that measures of their catches and fishing trips had changed; Table S6: Percentage of recreational Black Bream fishers that considered that measures of their catches and fishing trips had changed; Table S7: Percentage of recreational Blue Swimmer Crab fishers that agreed, disagreed or were unsure about aspects of crab fishery management; Table S8: Percentage of recreational Black Bream that fishers agreed, disagreed or were unsure about aspects of fishery management; Table S9: Percentage of recreational Blue Swimmer Crab fishers that chose a management acceptability rating for each of the nine options that currently are or could potentially be used to manage Blue Swimmer Crab fisheries in Western Australia; Table S10: Percentage of recreational Black Bream fishers that chose a management acceptability rating for each of the ten options that currently are or could potentially be used to manage Black Bream fisheries in Western Australia; Table S11: Percentage of recreational Blue Swimmer Crab fishers that chose an option about whether management option should change or remain the same; Table S12: Percentage of recreational Black Bream fishers that chose an option about whether management option should change or remain the same; Table S13: Mean ratings for each Blue Swimmer Crab stock enhancement belief across (a) belief strength, (b) belief evaluation and (c) cross-products; Table S14: Mean ratings for each Black Bream stock enhancement belief across (a) belief strength, (b) belief evaluation and (c) cross-products; Table S15: Percentage of recreational (a) Blue Swimmer Crab and (b) Black Bream fishers that agreed, disagreed or were unsure whether they would continue to fish if the population is stocked; Table S16: Percentage of recreational Blue Swimmer Crab fishers that chose options related to what they would do if they caught a hatchery-reared crab.

Author Contributions

Conceptualization, C.O., M.H., J.R.T. and N.R.L.; methodology, C.O. and M.H.; formal analysis, J.R.T.; investigation, C.O. and S.J.B.; data curation, C.O., J.R.T. and S.J.B.; writing—original draft preparation, J.R.T.; writing—review and editing, C.O., M.H., N.R.L. and S.J.B.; visualization, J.R.T. and C.O.; supervision, M.H., J.R.T. and N.R.L.; project administration, C.O. and J.R.T.; funding acquisition, J.R.T., N.R.L. and M.H. All authors have read and agreed to the published version of the manuscript.

Funding

This study was supported by funding from the FRDC (FRDC 2016/034) on behalf of the Australian Government, by Recfishwest, and the Department of Primary Industries and Regional Development through funding from the Recreational Fishing Initiatives Fund and Murdoch University.

Institutional Review Board Statement

The study was conducted in accordance with the Declaration of Helsinki and approved by the Murdoch University Human Research Ethics Committee (Murdoch University ethics approval number 2017/129, 21 August 2017).

Informed Consent Statement

Informed consent was obtained from all subjects involved in the study.

Data Availability Statement

Anonymised data will be made available on reasonable request.

Acknowledgments

Emily Ogier and Sarah Jennings from the Human Dimension Research subprogram of the Fisheries Research and Development Corporation of Australia (FRDC) are thanked for their useful input, as are Zoe Stewart-Yates, Denis Abagna, and Kurt Krispyn for their help in conducting the surveys.

Conflicts of Interest

The authors declare no conflict of interest. The funders had no role in the design of the study; in the collection, analyses, or interpretation of data; in the writing of the manuscript; or in the decision to publish the results.

References

  1. Allison, E.H.; Ellis, F. The livelihoods approach and management of small-scale fisheries. Mar. Policy 2001, 25, 377–388. [Google Scholar] [CrossRef]
  2. FAO. The State of World Fisheries and Aquaculture: Sustainability in Action; Food and Agriculture Organisation: Rome, Italy, 2020. [Google Scholar]
  3. Sutinen, J.G.; Soboil, M. The performance of fisheries management systems and the ecosystem challenge. In Responsible Fisheries in the Marine Ecosystem; CABI: Wallingford, UK, 2003; p. 291. [Google Scholar]
  4. Selig, E.R.; Kleisner, K.M.; Ahoobim, O.; Arocha, F.; Cruz-Trinidad, A.; Fujita, R.; Hara, M.; Katz, L.; McConney, P.; Ratner, B.D.; et al. A typology of fisheries management tools: Using experience to catalyse greater success. Fish Fish. 2017, 18, 543–570. [Google Scholar] [CrossRef]
  5. Mascia, M.B.; Claus, C.A.; Naidoo, R. Impacts of marine protected areas on fishing communities. Conserv. Biol. 2010, 24, 1424–1429. [Google Scholar] [CrossRef] [PubMed]
  6. Magee, C.; Voyer, M.; McIlgorm, A.; Li, O. Chasing the thrill or just passing the time? Trialing a new mixed methods approach to understanding heterogeneity amongst recreational fishers based on motivations. Fish. Res. 2018, 199, 107–118. [Google Scholar] [CrossRef]
  7. Hartill, B.W.; Taylor, S.M.; Keller, K.; Weltersbach, M.S. Digital camera monitoring of recreational fishing effort: Applications and challenges. Fish Fish. 2020, 21, 204–215. [Google Scholar] [CrossRef]
  8. Provost, E.J.; Butcher, P.A.; Coleman, M.A.; Kelaher, B.P. Assessing the viability of small aerial drones to quantify recreational fishers. Fish. Manag. Ecol. 2020, 27, 615–621. [Google Scholar] [CrossRef]
  9. Fedler, A.J.; Ditton, R.B. Understanding angler motivations in fisheries management. Fisheries 1994, 19, 6–13. [Google Scholar] [CrossRef]
  10. Dimech, M.; Darmanin, M.; Philip Smith, I.; Kaiser, M.J.; Schembri, P.J. Fishers’ perception of a 35-year old exclusive fisheries management zone. Biol. Conserv. 2009, 142, 2691–2702. [Google Scholar] [CrossRef]
  11. Taylor, M.D.; Chick, R.C.; Lorenzen, K.; Agnalt, A.-L.; Leber, K.M.; Blankenship, H.L.; Haegen, G.V.; Loneragan, N.R. Fisheries enhancement and restoration in a changing world. Fish. Res. 2017, 186, 407–412. [Google Scholar] [CrossRef]
  12. Ingram, B.A.; Hayes, B.; Rourke, M.L. Impacts of stock enhancement strategies on the effective population size of Murray cod, Maccullochella peelii, a threatened Australian fish. Fish. Manag. Ecol. 2011, 18, 467–481. [Google Scholar] [CrossRef]
  13. Anderson, J.D.; Cason, P.D. Density-dependent impacts on growth and body condition of Red Drum in stock enhancement rearing ponds. N. Am. J. Aquac. 2015, 77, 491–496. [Google Scholar] [CrossRef]
  14. Arlinghaus, R.; Mehner, T. Management preferences of urban anglers. Fisheries 2003, 28, 10–17. [Google Scholar] [CrossRef]
  15. Garlock, T.M.; Lorenzen, K. Marine angler characteristics and attitudes toward stock enhancement in Florida. Fish. Res. 2017, 186, 439–445. [Google Scholar] [CrossRef]
  16. Costanza, R.; Fisher, B.; Mulder, K.; Liu, S.; Christopher, T. Biodiversity and ecosystem services: A multi-scale empirical study of the relationship between species richness and net primary production. Ecol. Econ. 2007, 61, 478–491. [Google Scholar] [CrossRef]
  17. Tweedley, J.R.; Warwick, R.M.; Potter, I.C. The contrasting ecology of temperate macrotidal and microtidal estuaries. Oceanogr. Mar. Biol. Annu. Rev. 2016, 54, 73–172. [Google Scholar] [CrossRef]
  18. Potter, I.C.; Warwick, R.M.; Hall, N.G.; Tweedley, J.R. The physico-chemical characteristics, biota and fisheries of estuaries. In Freshwater Fisheries Ecology; Craig, J., Ed.; Wiley-Blackwell: Chichester, West Sussex, UK, 2015; pp. 48–79. [Google Scholar]
  19. Creighton, C.; Boon, P.I.; Brookes, J.D.; Sheaves, M. Repairing Australia’s estuaries for improved fisheries production—What benefits, at what cost? Mar. Freshw. Res. 2015, 66, 493–507. [Google Scholar] [CrossRef]
  20. Warwick, R.M.; Tweedley, J.R.; Potter, I.C. Microtidal estuaries warrant special management measures that recognise their critical vulnerability to pollution and climate change. Mar. Pollut. Bull. 2018, 135, 41–46. [Google Scholar] [CrossRef]
  21. Hallett, C.S.; Valesini, F.J.; Clarke, K.R.; Hoeksema, S.D. Effects of a harmful algal bloom on the community ecology, movements and spatial distributions of fishes in a microtidal estuary. Hydrobiologia 2016, 763, 267–284. [Google Scholar] [CrossRef]
  22. Tweedley, J.R.; Hallett, C.S.; Warwick, R.M.; Clarke, K.R.; Potter, I.C. The hypoxia that developed in a microtidal estuary following an extreme storm produced dramatic changes in the benthos. Mar. Freshw. Res. 2016, 67, 327–341. [Google Scholar] [CrossRef]
  23. Tweedley, J.R.; Dittmann, S.R.; Whitfield, A.K.; Withers, K.; Hoeksema, S.D.; Potter, I.C. Hypersalinity: Global distribution, causes, and present and future effects on the biota of estuaries and lagoons. In Coasts and Estuaries; Wolanski, E., Day, J.W., Elliott, M., Ramachandran, R., Eds.; Elsevier: Amsterdam, The Netherlands, 2019; pp. 523–546. [Google Scholar]
  24. Krispyn, K.N.; Loneragan, N.R.; Whitfield, A.K.; Tweedley, J.R. Salted mullet: Protracted occurrence of Mugil cephalus under extreme hypersaline conditions. Estuar. Coast. Shelf Sci. 2021, 261, 107533. [Google Scholar] [CrossRef]
  25. Cottingham, A.; Hesp, S.A.; Hall, N.G.; Hipsey, M.R.; Potter, I.C. Marked deleterious changes in the condition, growth and maturity schedules of Acanthopagrus butcheri (Sparidae) in an estuary reflect environmental degradation. Estuar. Coast. Shelf Sci. 2014, 149, 109–119. [Google Scholar] [CrossRef]
  26. Cottingham, A.; Huang, P.; Hipsey, M.R.; Hall, N.G.; Ashworth, E.; Williams, J.; Potter, I.C. Growth, condition, and maturity schedules of an estuarine fish species change in estuaries following increased hypoxia due to climate change. Ecol. Evol. 2018, 8, 7111–7130. [Google Scholar] [CrossRef] [PubMed]
  27. DPIRD. Annual Report 2018; Department of Primary Industries and Regional Development: Perth, Australia, 2019; p. 248.
  28. Henry, G.W.; Lyle, J.M. The National Recreational and Indigenous Fishing Survey; Fisheries Research and Development Corporation: Cronulla, Australia, 2003. [Google Scholar]
  29. Arlinghaus, R.; Tillner, R.; Bork, M. Explaining participation rates in recreational fishing across industrialised countries. Fish. Manag. Ecol. 2015, 22, 45–55. [Google Scholar] [CrossRef]
  30. Ryan, K.L.; Hall, N.G.; Lai, E.K.; Smallwood, C.B.; Tate, A.; Taylor, S.M.; Wise, B.S. Statewide Survey of Boat-Based Recreational Fishing in Western Australia 2017/18; Department of Primary Industries and Regional Development: Perth, Australia, 2019.
  31. Ryan, K.L.; Hall, N.G.; Lai, E.K.; Smallwood, C.B.; Taylor, S.M.; Wise, B.S. State-Wide Survey of Boat-Based Recreational Fishing in Western Australia 2013/14; Department of Fisheries, Western Australia: Perth, Australia, 2015; p. 208.
  32. Tweedley, J.R.; Obregón, C.; Beukes, S.J.; Loneragan, N.R.; Hughes, M. Differences in recreational fishers’ motivations for utilising two estuarine fisheries. Fishes 2023, 8, 292. [Google Scholar] [CrossRef]
  33. Johnston, D.; Yeoh, D.; Harris, D.; Denham, A.; Fisher, E. Blue Swimmer Crab (Portunus armatus) Resource in the West Coast Bioregion, Western Australia. Part 1: Peel-Harvey Estuary, Cockburn Sound and Swan-Canning Estuary; Department of Primary Indistrues and Regional Development: Perth, Australia, 2020.
  34. Newman, S.J.; Wise, B.S.; Santoro, K.G.; Gaughan, D.J. Status Reports of the Fisheries and Aquatic Resources of Western Australia 2020/21: The State of the Fisheries; Department of Primary Industries and Regional Development: Perth, Australia, 2021.
  35. Obregón, C.; Christensen, J.; Zeller, D.; Hughes, M.; Tweedley, J.R.; Gaynor, A.; Loneragan, N.R. Local fisher knowledge reveals changes in size of blue swimmer crabs in small-scale fisheries. Mar. Policy 2022, 143, 105144. [Google Scholar] [CrossRef]
  36. Johnston, D.; Harris, D.; Caputi, N.; Thomson, A. Decline of a Blue Swimmer Crab (Portunus pelagicus) fishery in Western Australia—History, contributing factors and future management strategy. Fish. Res. 2011, 109, 119–130. [Google Scholar] [CrossRef]
  37. Jenkins, G.; Michael, R.; Tweedley, J.R. Identifying Future Stock Enhancement Options for Blue Swimmer Crabs (Portunus armatus); Project 2015/09; Recreational Fishing Initiatives Fund: Perth, Australia, 2017. [Google Scholar]
  38. Malseed, B.E.; Sumner, N.R. A 12-Month Survey of Recreational Fishing in the Swan-Canning Estuary Basin of Western Australia during 1998-99; Department of Fisheries, Western Australia: Perth, Australia, 2001; p. 44.
  39. Morison, A.; Daume, S.; Gardner, C.; Lack, M. Western Australia Peel Harvey Estuarine Fishery MSC Full Assessment Public Certification Report; SCS Global Services, Sustainable Seafood Program—Australasia: Victoria, Australia, 2016. [Google Scholar]
  40. DPIRD. Protecting Breeding Stock Levels of the Blue Swimmer Crab Resource in the South West; Department of Primary Industries and Regional Development: Perth, Australia, 2018; p. 39.
  41. Christensen, J.; Jones, R. World Heritage and local change: Conflict, transformation and scale at Shark Bay, Western Australia. J. Rural Stud. 2020, 74, 235–243. [Google Scholar] [CrossRef]
  42. Chandrapavan, A.; Caputi, N.; Kangas, M.I. The decline and recovery of a crab population from an extreme marine heatwave and a changing climate. Front. Mar. Sci. 2019, 6, 510. [Google Scholar] [CrossRef]
  43. Lindley, J.; Quinn, L. Perceptions of compliance in recreational fisheries: Case study of the Peel-Harvey blue swimmer crab fishery. Front. Conserv. Sci. 2022, 3, 968518. [Google Scholar] [CrossRef]
  44. Hoeksema, S.D.; Potter, I.C. Diel, seasonal, regional and annual variations in the characteristics of the ichthyofauna of the upper reaches of a large Australian microtidal estuary. Estuar. Coast. Shelf Sci. 2006, 67, 503–520. [Google Scholar] [CrossRef]
  45. Smallwood, C.B.; Sumner, N.R. Twelve-Month Survey of Recreational Estuarine Fishing in the South Coast Bioregion of Western Australia during 2002/03; Department of Fisheries, Western Australia: Perth, Australia, 2007; p. 56.
  46. Cottingham, A.; Hall, N.G.; Potter, I.C. Performance and contribution to commercial catches and egg production by restocked Acanthopagrus butcheri (Sparidae) in an estuary. Estuar. Coast. Shelf Sci. 2015, 164, 194–203. [Google Scholar] [CrossRef]
  47. Cottingham, A.; Hall, N.G.; Loneragan, N.R.; Jenkins, G.I.; Potter, I.C. Efficacy of restocking an estuarine-resident species demonstrated by long-term monitoring of cultured fish with alizarin complexone-stained otoliths. A case study. Fish. Res. 2020, 227, 105556. [Google Scholar] [CrossRef]
  48. Malseed, B.E.; Sumner, N.R. A 12-Month Survey of Recreational Fishing in the Peel-Harvey Estuary of Western Australia during 1998-99; Department of Fisheries, Western Australia: Perth, Australia, 2001; p. 52.
  49. Prior, S.; Beckley, L.E. Characteristics of recreational anglers in the Blackwood Estuary, a popular tourist destination in southwestern Australia. Tour. Mar. Environ. 2007, 4, 15–28. [Google Scholar] [CrossRef]
  50. DEC. Walpole and Nornalup Inlets Marine Park Management Plan 2009–2019; Department of Environment and Conservation: Perth, Australia, 2009.
  51. DPIRD. Recreational Fishing Guide 2022; Department of Primary Industries and Regional Development: Perth, Australia, 2022; p. 64.
  52. Middlestadt, S.E.; Bhattacharyya, K.; Rosenbaum, J.; Fishbein, M.; Shepherd, M. The use of theory based semistructured elicitation questionnaires: Formative research for CDS’s prevention marketing initiative. Public Health Rep. 1996, 111, 18–27. [Google Scholar] [PubMed]
  53. Francis, J.; Eccles, M.; Johnston, M.; Walker, A.; Grimshaw, J.; Foy, R.; Kaner, E.; Smith, L.; Bonetti, D.; Francis, J.; et al. Constructing Questionnaires Based on the Theory of Planned Behaviour: A Manual for Health Services Researchers; Centre for Health Services Research, University of Newcastle upon Tyne: Newcastle-upon-Tyne, UK, 2004. [Google Scholar]
  54. Obregón, C.; Admiraal, R.; van Putten, I.; Hughes, M.; Tweedley, J.R.; Loneragan, N.R. Who you speak to matters: Information sharing and the management of a small-scale fishery. Front. Mar. Sci. 2020, 7, 578014. [Google Scholar] [CrossRef]
  55. Johnston, D.; Harris, D.; Yeoh, D. Blue Swimmer Crab (Portunus armatus) Resource in the West Coast Bioregion, Western Australia Part 2: Warnbro Sound, Comet Bay, Mandurah to Bunbury, Leschenault Estuary, Geographe Bay and Hardy Inlet; Department of Primary Indistrues and Regional Development: Perth, Australia, 2020.
  56. Kennish, M.J. Environmental threats and environmental future of estuaries. Environ. Conserv. 2002, 29, 78–107. [Google Scholar] [CrossRef]
  57. Tweedley, J.R.; Warwick, R.M.; Potter, I.C. Can biotic indicators distinguish between natural and anthropogenic environmental stress in estuaries? J. Sea Res. 2015, 102, 10–21. [Google Scholar] [CrossRef]
  58. Brearley, A. Ernest Hodgkin’s Swanland, 1st ed.; University of Western Australia Press: Perth, Australia, 2005; p. 550. [Google Scholar]
  59. Potter, I.C.; Rose, T.H.; Huisman, J.M.; Hall, N.G.; Denham, A.; Tweedley, J.R. Large variations in eutrophication among estuaries reflect massive differences in composition and biomass of macroalgal drift. Mar. Pollut. Bull. 2021, 167, 112330. [Google Scholar] [CrossRef]
  60. Lepesteur, M.; Wegner, A.; Moore, S.A.; McComb, A. Importance of public information and perception for managing recreational activities in the Peel-Harvey estuary, Western Australia. J. Environ. Manag. 2008, 87, 389–395. [Google Scholar] [CrossRef]
  61. Ryan, K.L.; Shaw, J.; Tracey, S.R.; Lyle, J.M. Recreational fishers’ perceptions of climate change. ICES J. Mar. Sci. 2021, 79, 540–551. [Google Scholar] [CrossRef]
  62. Leviston, Z.; Greenhill, M.; Walker, I. Australians Attitudes to Climate Change and Adaptation: 2010–2014; CSIRO: Canberra, Australia, 2015.
  63. Coulson, P.G.; Leary, T.; Chandrapavan, A.; Wakefield, C.B.; Newman, S.J. Going with the flow: The case of three tropical reef fish transported to cool temperate waters following an extreme marine heatwave. Reg. Stud. Mar. Sci. 2023, 61, 102856. [Google Scholar] [CrossRef]
  64. Pauly, D. The gill-oxygen limitation theory (GOLT) and its critics. Sci. Adv. 2021, 7, eabc6050. [Google Scholar] [CrossRef] [PubMed]
  65. Asch, R.G.; Stock, C.A.; Sarmiento, J.L. Climate change impacts on mismatches between phytoplankton blooms and fish spawning phenology. Glob. Change Biol. 2019, 25, 2544–2559. [Google Scholar] [CrossRef] [PubMed]
  66. Valesini, F.J.; Cottingham, A.; Hallett, C.S.; Clarke, K.R. Interdecadal changes in the community, population and individual levels of the fish fauna of an extensively modified estuary. J. Fish Biol. 2017, 90, 1734–1767. [Google Scholar] [CrossRef]
  67. Elliott, M.; Houde, E.D.; Lamberth, S.J.; Lonsdale, J.-A.; Tweedley, J.R. Management of fishes and fisheries in estuaries. Fish Fish. Estuaries 2022, 2, 706–797. [Google Scholar]
  68. Rubio, G.; Brinson, A.; Wallmo, K. Attitudes and Preferences of Saltwater Recreational Anglers: Report from the 2013 National Saltwater Angler Survey, Volume II Regional Analysis; National Oceanic and Atmospheric Administration: Washington, DC, USA, 2014; p. 115.
  69. Wilde, G.R.; Ditton, R.B. Diversity among anglers in support for fisheries management tools. In Proceedings of the Warmwater Fisheries Symposium 1, Scottsdale, Arizona, 4–8 June 1991; pp. 329–335. [Google Scholar]
  70. Renyard, T.S.; Hilborn, R. Sports angler preferences for alternative regulatory methods. Can. J. Fish. Aquat. Sci. 1986, 43, 240–242. [Google Scholar] [CrossRef]
  71. Helfrich, L.; Chipman, B.; Kauffman, J. Profiles of Shenandoah River anglers fishing under three Black Bass length limit regulations. Proc. Annu. Conf. Southeast. Assoc. Fish Wildl. Agencies 1987, 41, 178–186. [Google Scholar]
  72. FAO. Recreational Fisheries; Food and Agriculture Organization of the United Nations: Rome, Italy, 2012; p. 176. [Google Scholar]
  73. Lindley, J.; Quinn, L. Compliance in recreational fisheries: Case study of two blue swimmer crab fisheries. PLoS ONE 2023, 18, e0279600. [Google Scholar] [CrossRef]
  74. McNeill, A.; Clifton, J.; Harvey, E.S. Specialised recreational fishers reject sanctuary zones and favour fisheries management. Mar. Policy 2019, 107, 103592. [Google Scholar] [CrossRef]
  75. Cottingham, A.; Hall, N.G.; Hesp, S.A.; Potter, I.C. Differential changes in production measures for an estuarine-resident sparid in deep and shallow waters following increases in hypoxia. Estuar. Coast. Shelf Sci. 2018, 202, 155–163. [Google Scholar] [CrossRef]
  76. Klefoth, T.; Wegener, N.; Meyerhoff, J.; Arlinghaus, R. Do anglers and managers think similarly about stocking, habitat management and harvest regulations? Implications for the management of community-governed recreational fisheries. Fish. Res. 2023, 260, 106589. [Google Scholar] [CrossRef]
  77. Muthén, B.; Muthén, L.K. Integrating person-centered and variable-centered analyses: Growth mixture modeling with latent trajectory classes. Alcohol Clin. Exp. Res. 2000, 24, 882–891. [Google Scholar] [CrossRef] [PubMed]
  78. Obregón, C.; Hughes, M.; Loneragan, N.R.; Poulton, S.J.; Tweedley, J.R. A two-phase approach to elicit and measure beliefs on management strategies: Fishers supportive and aware of trade-offs associated with stock enhancement. Ambio 2020, 49, 640–649. [Google Scholar] [CrossRef]
  79. Arlinghaus, R. Overcoming human obstacles to conservation of recreational fishery resources, with emphasis on central Europe. Environ. Conserv. 2006, 33, 46–59. [Google Scholar] [CrossRef]
  80. Hunt, L.M.; Gonder, D.; Haider, W. Hearing voices from the silent majority: A comparison of preferred fish stocking outcomes for Lake Huron by anglers from representative and convenience samples. Hum. Dimens. Wildl. 2010, 15, 27–44. [Google Scholar] [CrossRef]
  81. Jenkins, G.I.; Michael, R.; Tweedley, J.R.; Oberstein, D.; Loneragan, N.R.; Johnston, D.J. Blue Swimmer Crab (Portunus armatus) Stocking Trial: Reducing Costs and Increasing Survival; Project 2016/03; Recreational Fishing Initiatives Fund: Perth, Australia, 2018. [Google Scholar]
  82. Jenkins, G.I.; French, D.J.W.; Potter, I.C.; de Lestang, S.; Hall, N.G.; Partridge, G.J.; Hesp, S.A.; Sarre, G.A. Restocking the Blackwood River Estuary with the Black Bream Acanthopagrus butcheri; Fisheries Research and Development: Perth, Australia, 2006. [Google Scholar]
  83. Arlinghaus, R.; Beardmore, B.; Riepe, C.; Meyerhoff, J.; Pagel, T. Species-specific preferences of German recreational anglers for freshwater fishing experiences, with emphasis on the intrinsic utilities of fish stocking and wild fishes. J. Fish Biol. 2014, 85, 1843–1867. [Google Scholar] [CrossRef] [PubMed]
  84. Molony, B. Environmental Requirements and Tolerances of Rainbow Trout (Oncorhynchus mykiss) and Brown Trout (Salmo trutta) with Special Reference to Western Australia: A Review; Department of Fisheries, Western Australia: Perth, Australia, 2001; p. 28.
  85. van Poorten, B.T.; Arlinghaus, R.; Daedlow, K.; Haertel-Borer, S.S. Social-ecological interactions, management panaceas, and the future of wild fish populations. Proc. Natl. Acad. Sci. USA 2011, 108, 12554–12559. [Google Scholar] [CrossRef]
  86. Hilborn, R. The economic performance of marine stock enhancement projects. Bull. Mar. Sci. 1998, 62, 661–674. [Google Scholar]
  87. Camp, E.V.; Larkin, S.L.; Ahrens, R.N.M.; Lorenzen, K. Trade-offs between socioeconomic and conservation management objectives in stock enhancement of marine recreational fisheries. Fish. Res. 2017, 186, 446–459. [Google Scholar] [CrossRef]
  88. Lorenzen, K.; Beveridge, M.C.M.; Mangel, M. Cultured fish: Integrative biology and management of domestication and interactions with wild fish. Biol. Rev. 2012, 87, 639–660. [Google Scholar] [CrossRef]
  89. Tweedley, J.R.; Obregón, C.; Hughes, M.; Loneragan, N.R.; Cottingham, A.; Abagna, D.; Tull, M.; Beukes, S.J.; Garnett, A.M. Golden Fish: Evaluating and Optimising the Biological, Social and Economic Returns of Small-Scale Fisheries; Murdoch University: Perth, Australia, 2023. [Google Scholar]
  90. Dabrowska, K.; Haider, W.; Hunt, L. Examining the impact of fisheries resources and quality on licence sales. J. Outdoor Recreat. Tour. 2014, 5–6, 58–67. [Google Scholar] [CrossRef]
  91. Tweedley, J.R.; Loneragan, N.R.; Crisp, J.A.; Poh, B.; Broadley, A.D.; Bennett, A.L.; Hodson, K.P.; Trayler, K.M.; Jenkins, G.I.; Chaplin, J.A. Stock Enhancement of the Western School Prawn (Metapenaeus dalli) in the Swan-Canning Estuary; Evaluating Recruitment Limitation, Environment and Release Strategies; Murdoch University: Perth, Australia, 2017. [Google Scholar]
  92. Salas, S.; Gaertner, D. The behavioural dynamics of fishers: Management implications. Fish Fish. 2004, 5, 153–167. [Google Scholar] [CrossRef]
Figure 1. Main estuaries where recreational Blue Swimmer Crab and Black Bream fishing occurs in south-western Australia. Inset show the location of this area in Western Australia and also the location of Shark Bay. Black circles denote cities and towns shown in italics.
Fishes 08 00460 g001
Figure 2. Percentage of recreational (a) Blue Swimmer Crab (n = 434) and (b) Black Bream (n = 115) fishers that agreed, disagreed, or were unsure about the effects of potential issues on their chosen fishery. Issues ranked by the percentage of respondents who agreed with the issue.
Fishes 08 00460 g002
Figure 3. Percentage of recreational (a) Blue Swimmer Crab (n = 363) and (b) Black Bream (n = 120) fishers that considered that measures of their catches and fishing trips had changed. Note Black Bream fishers were not asked questions about fishing depth and time spent fishing (n/a).
Fishes 08 00460 g003
Figure 4. Percentage of recreational Blue Swimmer Crab (n = 421) and Black Bream (n = 115) fishers that agreed, disagreed, or were unsure about aspects of the management of their fisheries.
Fishes 08 00460 g004
Figure 5. Mean ratings (±95% confidence limits) and percentage of fishers that chose a management acceptability rating for each of the management options that currently are or could potentially be used to manage (a) Blue Swimmer Crab (n = 411) and (b) Black Bream (n = 113) fisheries, respectively. Management options are ordered by mean rating (i.e., acceptability). Letters in italics above columns indicate significant differences between management options as determined by pairwise Kruskal–Wallis tests.
Fishes 08 00460 g005
Figure 6. Percentage of recreational (a) Blue Swimmer Crab (n = 394) and (b) Black Bream (n = 111) fishers that chose an option about whether management option should change or remain the same. Note Black Bream fishers were not asked questions about temporal closures (n/a).
Fishes 08 00460 g006
Figure 7. Mean ratings (±95% confidence limits) for each stock enhancement belief across (a) belief strength, (b) belief evaluation, and (c) cross-products for stock enhancement of Blue Swimmer Crabs (n = 352). Letters in italics above or below columns indicate significant differences determined by pairwise Kruskal–Wallis tests.
Fishes 08 00460 g007
Figure 8. Mean ratings (±95% confidence limits) for each stock enhancement belief across (a) belief strength, (b) belief evaluation, and (c) cross-products for stock enhancement of Black Bream (n = 102). Letters in italics above or below columns indicate significant differences as determined by pairwise Kruskal–Wallis tests.
Fishes 08 00460 g008
Figure 9. Mean ratings (±95% confidence limits) and percentage of recreational fishers that selected each attitude category for the question ‘Overall, I think using stock enhancement as a management option is’ for all Blue Swimmer Crab (n = 323) and Black Bream (n = 98) fishers and those bream fishers in groups d (inexperienced intermediate skilled fishers) and e (inexperienced but keen fishers).
Fishes 08 00460 g009
Figure 10. Percentage of Blue Swimmer Crab fishers (n = 367) that chose options related to what they would do if they caught a hatchery-reared crab.
Fishes 08 00460 g010
Table 1. Description of the typical characteristics exhibited by members of each group of (a) Blue Swimmer Crab and (b) Black Bream fishers identified by Tweedley et al. [32].
Fisher GroupNameDescription
(a) Blue Swimmer Crab
aVery frequent fishersFishers that fish > 150 times per year and of intermediate/expert skill level
bExperienced boat-based fishersFishers that have fished for >40 years, primarily from a boat using drop nets
cInexperienced boat-based fishersFishers that have fished for ~10 years, primarily from a boat using drop nets
dRelatively experienced, expert shore-based fishers Expert fishers that have fished for ~25 years, primarily from the shore, using a range of methods
eInexperienced shore-based drop net fishersFishers that have fished for ~7 years, primarily from a shore using drop nets
fInexperienced, shore-based novice fishersNovice fishers that have fished for <10 years, primarily from a shore, using a range of methods
gBi-monthly, hand fishersFishers that fish every two months and catch their crabs by hand
(b) Black Bream
aVery frequent fishersFishers that fish >150 times per year and of intermediate skill level
bVery frequent, expert lure fishersFishers that fish >150 times per year are of expert skill level; they use expensive fishing gear and lures and fish in competitions
cExperienced fishersFishers that have fished for ~40 years, primarily from a kayak/boat and of intermediate/expert skill, some of whom fish in competitions
dInexperienced intermediate-skilled fishersIntermediate skills fishers that have fished for <10 years, primarily from a kayak using relatively cheap gear, and who do not enter competitions
eInexperienced but keen fishersIntermediate/expert fishers who have fished for <10 years, use expensive gear, and fish in competitions
Disclaimer/Publisher’s Note: The statements, opinions and data contained in all publications are solely those of the individual author(s) and contributor(s) and not of MDPI and/or the editor(s). MDPI and/or the editor(s) disclaim responsibility for any injury to people or property resulting from any ideas, methods, instructions or products referred to in the content.

