Article

Productivity of Fish and Crop Growth and Characteristics of Bacterial Communities in the FLOCponics System

1
Advanced Aquaculture Research Center, National Institute of Fisheries Science, Changwon 51688, Republic of Korea
2
Aquaculture Research Division, National Institute of Fisheries Science, Busan 48513, Republic of Korea
3
Department of Biology and Chemistry, Changwon National University, Changwon 51140, Republic of Korea
*
Author to whom correspondence should be addressed.
Fishes 2023, 8(8), 422; https://doi.org/10.3390/fishes8080422
Submission received: 12 June 2023 / Revised: 4 August 2023 / Accepted: 11 August 2023 / Published: 18 August 2023

Abstract

:
Aquaponics (AP) and biofloc technology (BFT) systems rely heavily on bacterial communities to break down organic matter and cycle nutrients that are essential for fish and plant growth. The functional roles of bacterial communities in aquaculture systems are critical to their sustainable operation. Currently, the research on the combination of BFT and AP systems called FLOCponics (FP) is lacking, thereby hindering our ability to optimize their performance. Here, several characteristics (productivity of fish and crops, physicochemical properties of water, and bacterial community) in FP systems cultivating Japanese eel (Anguilla japonica) and leaf lettuce Caipira (Lactuca sativa) were compared to those in the BFT system. Additionally, the effect of fish density on the FP system was investigated. The results indicated that the FP system was more productive than the BFT system. Fish growth rate was highest in the FP system (52.6%), and the average body weight of eels was 168.2 ± 26.8 g in the FP system compared to 140.3 ± 27.0 g in the control (BFT, 5 kg/m2). However, increasing fish density resulted in lower growth rates, with a growth rate of 20.6% observed in the high-density (20 kg/m2) experimental group. The bacterial composition was also significantly different between the systems and fish densities, suggesting that bacterial communities may be closely related to the performance of the aquaponics system.
Key Contribution: The FLOCponics system was more productive than the BFT system, with higher growth rates observed in both fish and crops and distinctive bacterial composition.

1. Introduction

Aquaculture is a rapidly growing global industry and an essential source of food and economic development. However, intensive aquaculture has resulted in considerable environmental problems, including the accumulation of waste and the depletion of water resources [1,2]. Biofloc technology (BFT) systems have the potential to reduce water consumption and eliminate waste products using beneficial bacteria, microalgae, and other microorganisms to convert waste into usable nutrients or non-toxic molecules, while also providing nutrient-rich water for fish growth. On the other hand, aquaponics (AP) is another sustainable and integrated system that combines aquaculture and hydroponics, where nutrient-rich water from fish culture is used as a fertilizer for plant growth [3]. AP can be designed in various configurations with different components such as fish tanks, biofilters, and plant-growing beds. One of the most popular designs is the media-based aquaponics system, where plant roots grow in a substrate such as gravel or clay pebbles, and water is circulated from the fish tank to the plant growing beds through a biofilter. In this biofilter, often called a biological filter, the conversion of ammonia (excreted by fish) into nitrate (a form of nitrogen used by plants) occurs and is mediated by beneficial bacteria. Another possibility for sustainable aquaculture is the combination of the BFT and AP systems, coined as FLOCponics (FP), to harness the synergistic benefits and address some of the limitations associated with each system individually [4]. FP system aims to optimize nutrient recycling, enhance productivity, and improve water quality through the coexistence of BFT and AP components [5,6,7,8,9,10,11]. Thus, the integration of these two systems is a promising approach for increasing food production in a sustainable and environmentally friendly manner.
Microbial communities associated with aquaculture systems play critical roles in maintaining the health and performance of these systems [12]. Microbes are involved in the breakdown of organic matter, the cycling of nutrients, and the removal of toxins from water, all of which are essential for the growth and survival of fish and other aquatic organisms [13]. Additionally, some microbial communities can act as probiotics, promoting fish health and disease resistance by enhancing the immune system and inhibiting the growth of pathogenic bacteria [14,15]. Microorganisms are also involved in the production of important biomolecules, such as enzymes and bioactive compounds, that can be used in aquaculture. Furthermore, microorganisms play a critical role in the development and stability of BFT and AP systems—they facilitate the conversion of waste into a usable food source for plants while providing nutrient-rich water for fish growth [12,16]. Overall, the functional role of microbial communities in aquaculture systems is multifaceted and critical for sustainable operation.
BFT and AP systems rely heavily on the microbial communities that inhabit them [12,16]. These communities play a critical role in breaking down organic matter and cycling nutrients that are essential for the growth of fish and plants. Despite the importance of these microbial communities, there is a lack of research on the combination of BFT and AP systems. Most studies have focused on one system or another; however, little is known about how the two systems interact and affect each other’s microbial communities. This knowledge gap hinders our ability to optimize the performance of these systems and develop a more holistic understanding of how they operate. Therefore, more research is needed to explore the microbial ecology of FP systems when integrated and to identify the key microbial players that contribute to their successful functioning. Such knowledge will be valuable for improving the sustainability and productivity of these systems and advancing our understanding of microbial ecology in complex systems.
This study aimed to (1) compare several characteristics (productivity of fish and crops, physicochemical properties of water, concentration of nutrient mineral elements, and microbial community) between the FP system and the BFT system, and (2) investigate the effect of fish density on the performance and bacterial communities in the FP system. Specifically, we measured the growth rate of fish and crops, physicochemical properties of water, and concentration of nutrient mineral elements. Also, bacterial communities were analyzed from the water from FP and BFT systems using a metabarcoding approach and were compared in terms of the relative abundance and diversity of different bacterial taxa. Our findings will provide insights into the microbial ecology of FP systems and will support the development of sustainable and efficient aquaculture practices.

2. Materials and Methods

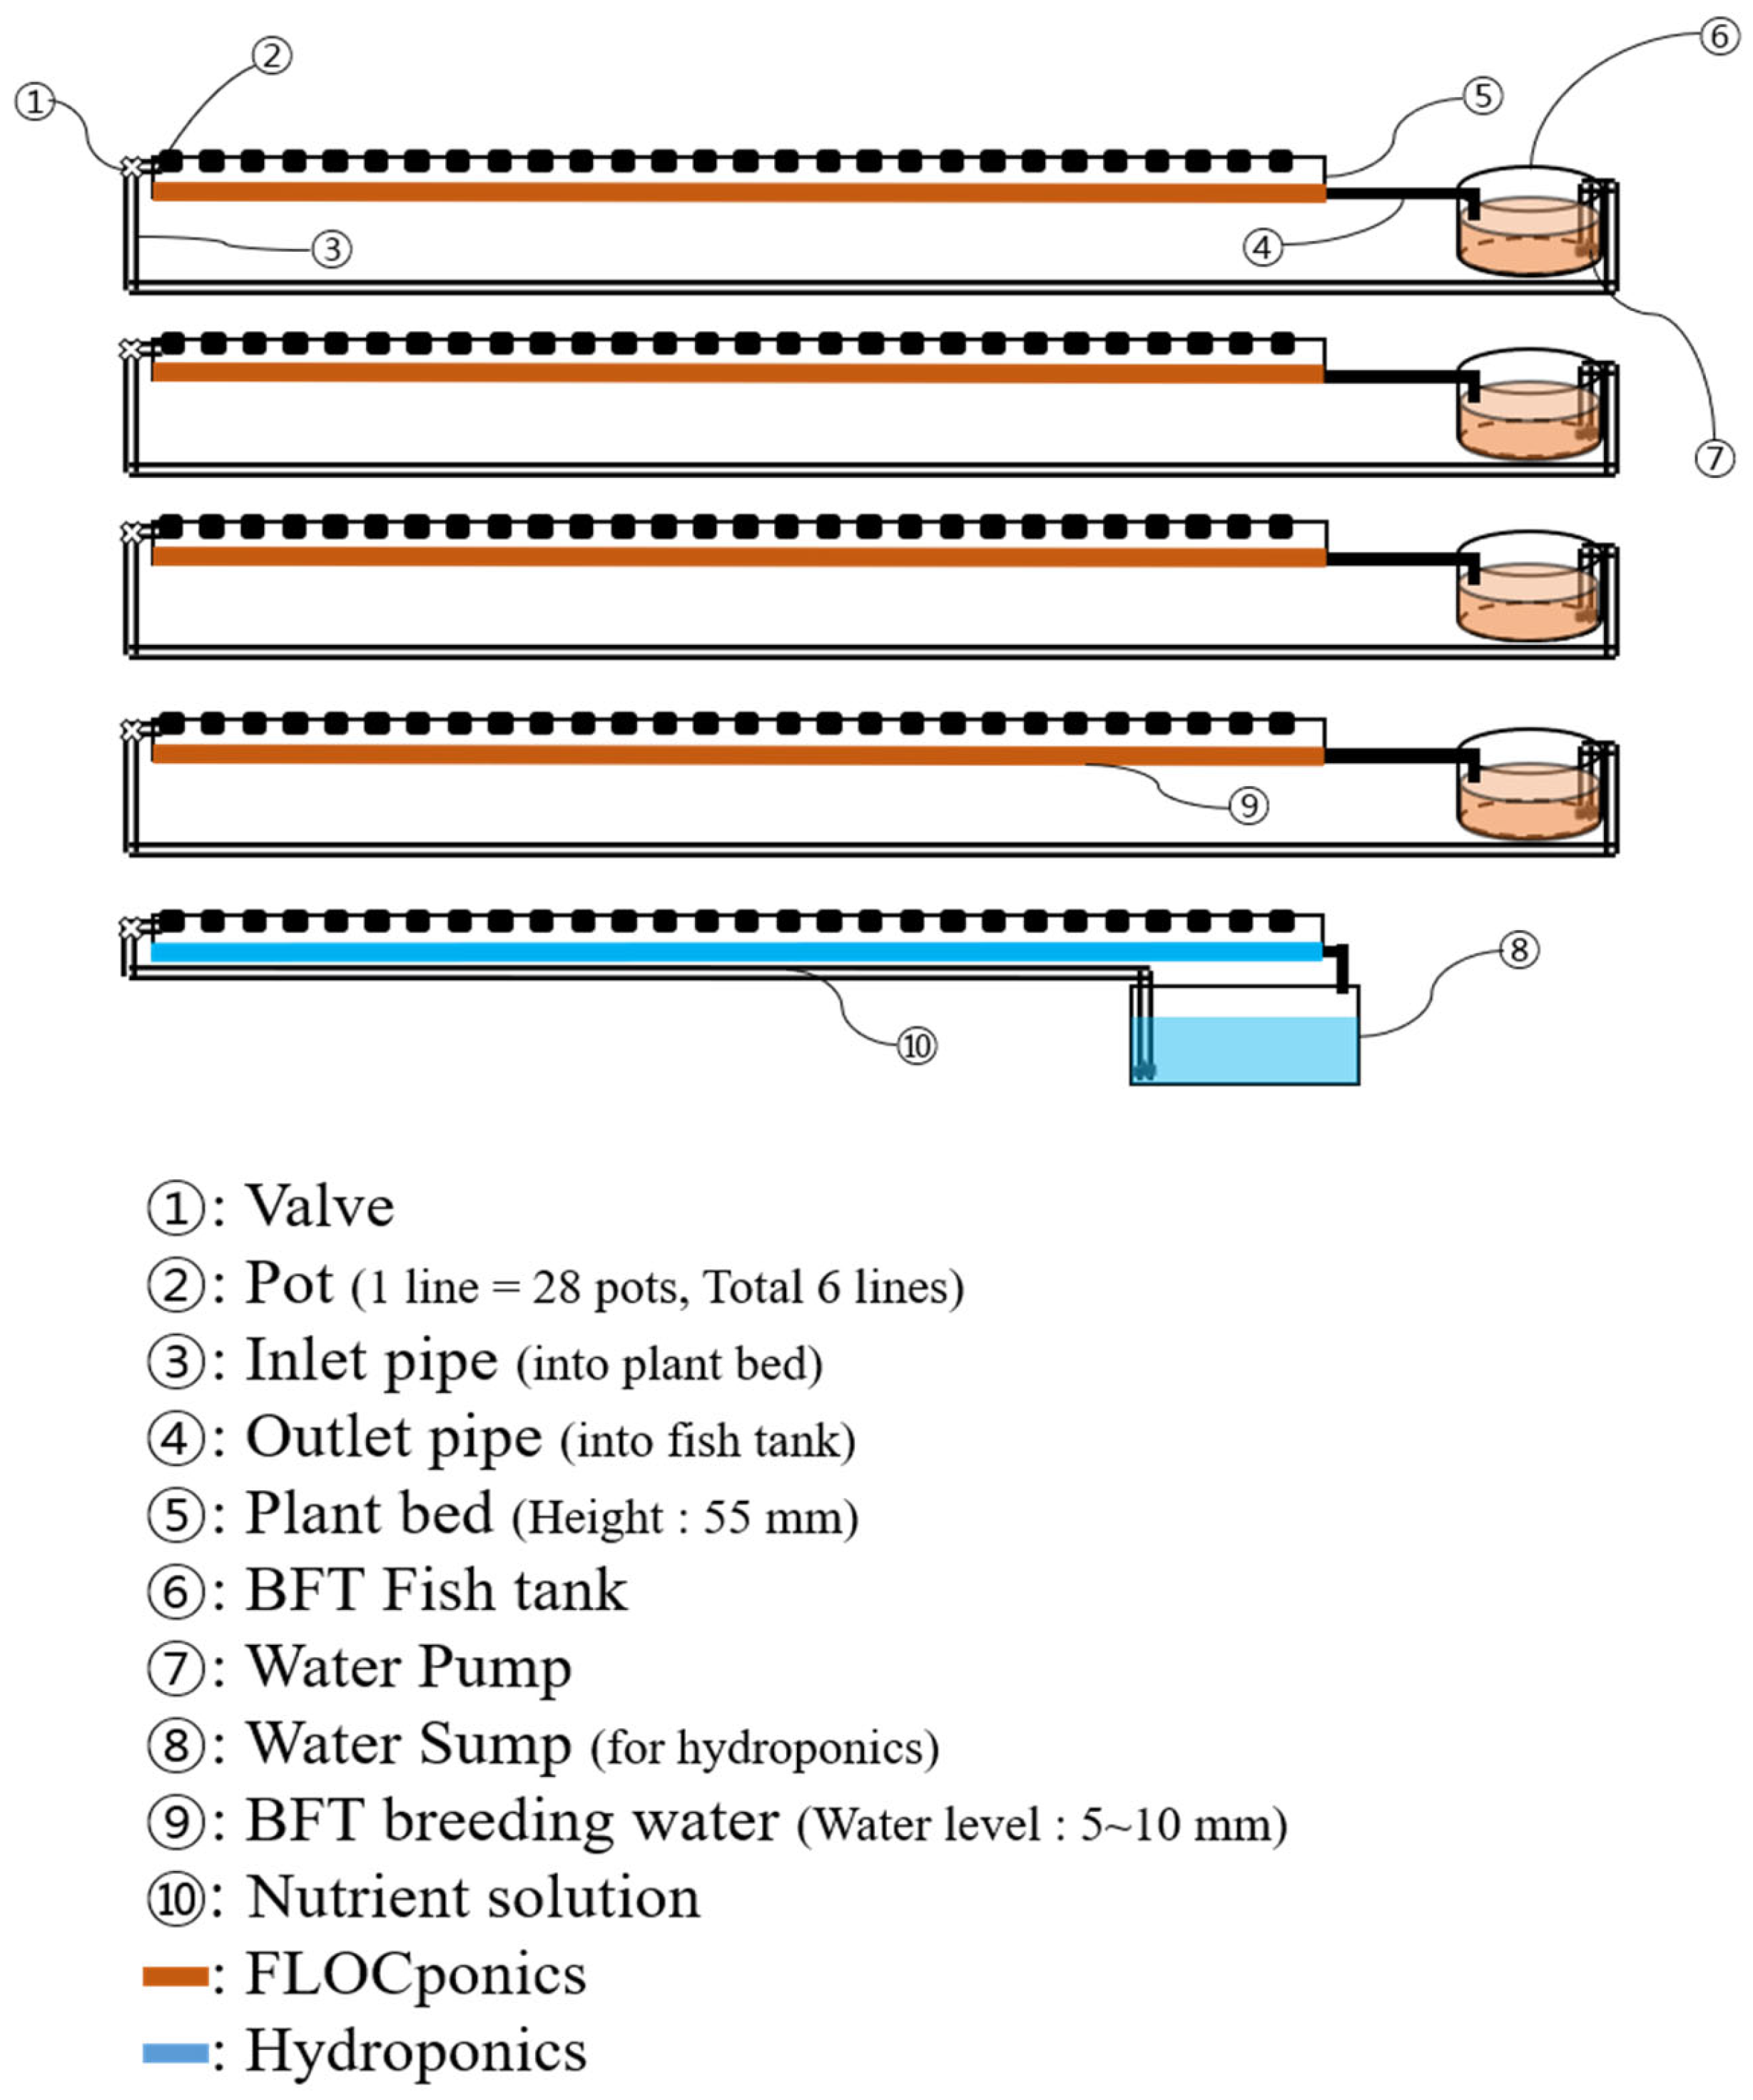
2.1. Experimental Design of BFT and Coupled FP Systems

The system used to grow the eels and plants is shown in Figure 1. For eel breeding, six circular fiber-reinforced plastic (FRP) tanks (∅ 1.2 m × H 1.0 m) were used; we set up two control (BFT) tanks, one hydroponics tank, and four FP tanks, while one of the BFT tanks were not used for analysis. FP used in this study was a coupled system in which the BFT breeding tank and the plant bed were circulated. The beds for plant cultivation had a thin film type (NFT, nutrient film technique) for each experimental zone. For eel breeding, a pump (30 W) was installed in each tank to circulate water to the plant beds, and LED lights were installed for light supply. The plant cultivation bed consisted of 28 porters per bed, with a total of 168 plantations. During the experiment period, artificial light was irradiated for 14 h/d, with a daily average of ≥6000 lux supplied, and the temperature was maintained at 24 ± 1.0 °C. We prepared the experiment according to the procedure of the previous study [17]; it confirmed that ammonia and nitrite were stable at ≤1 mg/L during the fourth week of water making, and eels were stocked and allowed to acclimatize for a week before being used in the experiment. Mulfure-siriz nutrient solution no. 1 (liquid A and B) (Daeyu business limited, Seoul, Republic of Korea) was supplied at a concentration of 1 to 3 L/100 m2 to the experimental zone for hydroponics.
The Japanese eel (Anguilla japonica), which was used as an experimental fish, was purchased from a general farm (Gagok-ri, Eunsan-myeon, Buyeo-gun, Chungcheongnam-do 33108, Republic of Korea) during eel season. Individuals weighing an average of 80–120 g were selected from individuals that were bred and managed at the Advanced Aquaculture Research Center, National Institute of Fisheries Science (Changwon, Republic of Korea) and placed in a FRP circular tank (1 ton). The breeding experiment was conducted with a control group (BFT, 5 kg/m2) and the FP system. For the FP systems, four density groups (5, 10, 15, and 20 kg/m2) were reared for 4 weeks to compare growth, and one tank was used for each group. Density was determined by referring to the standard guidelines for eel farming published by the National Institute of Fisheries Science [18]. In a standard farm, the stocking density for eels weighing between 50 and 100 g is set at 4.95 kg/m2.
Pro-eel F-GR feed (Purina fish feed, Cheongju, Republic of Korea) (dry matter 94.8, protein 55.8%, lipids 7.8%, and ash 13.8%) was used as the experimental feed for eel breeding. A total of 1–2% fish body weight was supplied twice daily for 4 weeks. The water temperature was maintained at 26 °C using a 1 kW heater (OKE-HE-100, Sewon OKE, Busan, Republic of Korea), and dissolved oxygen (DO) was maintained at 10 mg/L using an oxygen supply system (KMOS-40R, Kumho, Busan, Republic of Korea).
Leaf lettuce Caipira (Lactuca sativa), a leafy vegetable, was selected as the cultivated crop, and the seedlings used in the experiment were germinated in the germination room of the Advanced Aquaculture Research Center. Planting was performed using an NFT system, and growth was observed. Coated seeds of Caipira lettuce (Enza zaden, Enkhuizen, Netherlands) were individually planted in each media, watered until sprouting and developing cotyledons. A total of 210 seedlings were planted in each system group, with the seedlings having an average total length of 45.7 ± 6.75 mm and a total wet weight of 2.0 ± 0.47 g. The room temperature was maintained at 24 °C using an air conditioner, and the plants were exposed to 6000 lux of light in a 12 h day and 12 h night cycle (12 D: 12 L).
The total weight of each experimental group of eels was measured at the end of the 4-week experiment. Thirty eels were randomly selected, and the average weight and total length were measured. After anesthetizing the eel using 100 mg/kg anesthetic (MS-222, Sigma-Aldrich, St. Louis, MO, USA), the weight was measured using an electronic balance (MW-200; CAS, Seoul, Republic of Korea). The weights at the start and end of the experiment were analyzed to determine the growth rate and feed efficiency (feed coefficient, FC). Twenty Caipira lettuce heads were sampled from each group, and electronic scales (MW-200, CAS, Seoul, Republic of Korea) were used for measuring the total weight and shoot weight; Mitutoyo electronic Vernier calipers (Kawasaki, Japan) were used for measuring the total length, shoot length and leaf length were measured by Mitutoyo electronic Vernier calipers (Kawasaki, Japan) equipped with a Vernier scale that was accurate to 0.01 mm, and the number of leaves was measured. As statistical tests, ANOVA and Tukey’s test were conducted using SPSS v. 5.5 (SPSS Inc., Chicago, IL, USA).

2.2. Measurements of Water Properties

To measure the water quality of the breeding water, DO, pH, water temperature, and electrical conductivity (EC) were measured for a week using a multi-item water quality meter (YSI-650 Inc., Yellow Spring Instruments, Yellow Springs, OH, USA). Ammonia (NH4+-N), nitrite nitrogen (NO2-N), and nitrate nitrogen (NO3-N) were sampled before feeding and analyzed using an absorbance photometer (Merck KGaA, Darmstadt, Germany) and an analytical reagent kit (Merck KGaA, Darmstadt, Germany) using a colorimetric method. Samples for analysis were collected and measured in triplicate from different points in one tank. Twelve nutrient mineral elements were analyzed from water in FP and BFT systems. For Total-N, Total-P, K, Ca, Mg, Fe, Cu, Zn, and Si were measured using an inductively coupled plasma spectrophotometer (ICP-OES Optima 8300, Perkin Elmer Co., Waltham, MA, USA), and Cl and SO4 were analyzed using ion chromatography (930 Comact IC Flex, Metrohm Co., Herisau, Switzerland). Samples were collected in triplicate from different points in one tank and were merged to one sample for measurement of 12 nutrient mineral elements. Statistical tests were performed in the same way as for the fish and plant growth data mentioned above.

2.3. DNA Extraction, PCR Amplification, and NGS Sequencing

Water samples (1 L) were collected from each tank and filtered with a membrane filter (pore size of 0.22 µm, Hyundai Micro, Seoul, Republic of Korea) using a Vaccuum Membrane Filter Holder (AccuResearch Korea Inc., Seoul, Republic of Korea). Genomic DNA was extracted from filter samples using a PowerSoil DNA extraction kit (MoBio, Carlsbad, CA, USA), following the manufacturer’s instructions. Bacterial nuclear ribosomal 16S rRNA regions were amplified using primers 341F and 785R [19] with Illumina adaptors. PCR amplifications were performed using a SimpliAmp™ Thermal Cycler (Applied Biosystems, Waltham, MA, USA) and AccuPower PCR premix (Bioneer, Daejeon, Republic of Korea) as follows: 94 °C for 5 min, 35 cycles at 94 °C for 30 s, 55 °C for 30 s, 72 °C for 40 s, and final extension at 72 °C for 10 min. The final PCR reaction volume was 20 μL, composed of 10 pmol of each primer and 1 μL of genomic DNA. The PCR products were monitored using gel electrophoresis on a 1% agarose gel and purified using the ExpinTM PCR Purification Kit (GeneAll Biotechnology, Seoul, Republic of Korea). To minimize stochastic PCR bias, each sample was triplicated and pooled into a single sample. DNA sequencing was performed using an Illumina MiSeq platform (Macrogen, Seoul, Republic of Korea). All sequences generated in this study were archived at the NCBI Sequence Read Archive (SRA) under project number PRJNA965928.

2.4. Bioinformatic Analysis

The raw sequence data were processed using QIIME 2 [20]. The paired sequences were denoised and merged using the DADA2 pipeline [21] by filtering low-quality sequences. Amplicon sequence variants (ASVs) were generated using denoised sequences and identified using a naïve Bayesian classifier [22] against the EzBioCloud database [23]. A phylogenetic tree of ASV was constructed using FastTree [24] after the alignment of the sequences with MAFFT [25]. Before further analysis, all samples were normalized to the minimum sequence number (32,000 reads) to avoid technical bias due to differences in the number of sequences. Alpha diversity and community analyses were conducted using the pyloseq [26] and vegan [27] packages in R v.4.1.2 [28]. Diversity indices (Chao1 richness, Shannon’s diversity and evenness, and Faith’s phylogenetic diversity) were calculated in QIIME 2 and compared with R using a t-test for systems or ANOVA for cultivation periods and stocking densities. Community structures were compared using non-metric multidimensional scaling (NMDS) analysis based on weighted UniFrac distance. The significance of community differences was examined using PERMANOVA with 999 permutations, using adonis in the vegan package.

3. Results

3.1. Growth of Fish and Crops

The breeding experiments of eels (A. japonica) for 4 weeks according to density (5, 10, 15, 20 kg/m2) revealed that the average body weight was 140.26 ± 27.0 g in the control (BFT, 5 kg/m2), and was the highest at 168.19 ± 26.8 g. The growth rate (52.6%) and feed coefficient (0.85) were also the highest in the FP system (Table 1). Upon comparison of all the experimental systems, the lower the density, the better the growth. In the high-density (20 kg/m2) experimental group, the growth rate was 20.6%, which was lower than that of the control group (27.3%). However, the growth rate of all aquaponics applied to eels, except for the 20 kg/m2 experimental group, was higher than that of the control group. At the end of the experiment, the survival rate was maintained at >90% in all groups. Table 2 shows the growth results of plants in the FP system. After 4 weeks, the number of leaves was the highest in the FP experimental group stocked with 15 kg/m2 eels, and the total weight and upper layer weight were stocked with 5 kg/m2 (Table 2).

3.2. Physicochemical Properties of Water in BFT and FP Systems

The physical properties of water (DO, pH, temperature, and EC) were measured and compared between the aquaculture systems and cultivation densities (Table 3). During the 4 weeks of the experiment, the water temperature of the BFT system was maintained at 25–26 °C, and DO was maintained at 6–7 mg/L. The pH decreased as the experiment progressed and was 5.62 and 5.32 in the third and fourth weeks, respectively. For the FP system, the water temperature was maintained at 25–26 °C, and the pH differed based on fish density from the second week of the experiment. In the fourth week, density was maintained at 4.5–4.6, except in the 5 kg/m2 tanks. For EC, the higher the fish density, the longer the breeding period, and the higher the trend. In the fourth week of the experiment, the EC of the 5 kg/m2 experimental group showed a tendency to increase by 0.543 μS/cm, and the 20 kg/m2 experimental group by 1.29 μS/cm, in terms of total dissolved solids (TDS). Also, the 5 kg/m2 group was 0.35 g/L, and the 20 kg/m2 group was 0.84 g/L, showing a tendency to increase according to stocking density and breeding period.
Table 4 shows the concentrations of the nutrient minerals in each experimental group. Most elements required for plant growth showed a lower content in the experimental group (5 kg/m2) than in the control group (BFT, 5 kg/m2). Total-N was 25.41 mg/L and 15.39 mg/L, NH4+-N was 0.12 ± 0.06 mg/L and 0.41 ± 0.39 mg/L, NO2-N was 0.24 ± 0.16 mg/L and 0.23 ± 0.10 mg/L, NO3-N was 17.18 ± 7.85 mg/L and 20.24 ± 7.17 mg/L, Total-P was 7.79 mg/L and 15.39 mg/L, Na was 66.15 mg/L and 60.90 mg/L, K was 14.20 mg/L and 3.10 mg/L, Ca was 38.50 mg/L and 31.40 mg/L, and Mg was 8.55 mg/L and 6.40 mg/L for BFT and FP (5 kg/m2), respectively. For N, P, Na, Ca, and Mg, the mineral content was higher in the experimental groups (15 kg/m2 and 20 kg/m2) with high eel stocking density than that of the control group. For NO3-N, in the fourth week of the experiment, the control group was 30.3 mg/L. In the 5 kg/m2 and 10 kg/m2 experimental groups treated with AP, NO3-N was 23 mg/L and 24.6 mg/L, respectively, lower than that of the control group. However, in the 15 kg/m2 and 20 kg/m2 experimental groups with relatively high stocking densities, NO3-N demonstrated a high tendency of 45.9 mg/L and 46.0 mg/L, respectively.

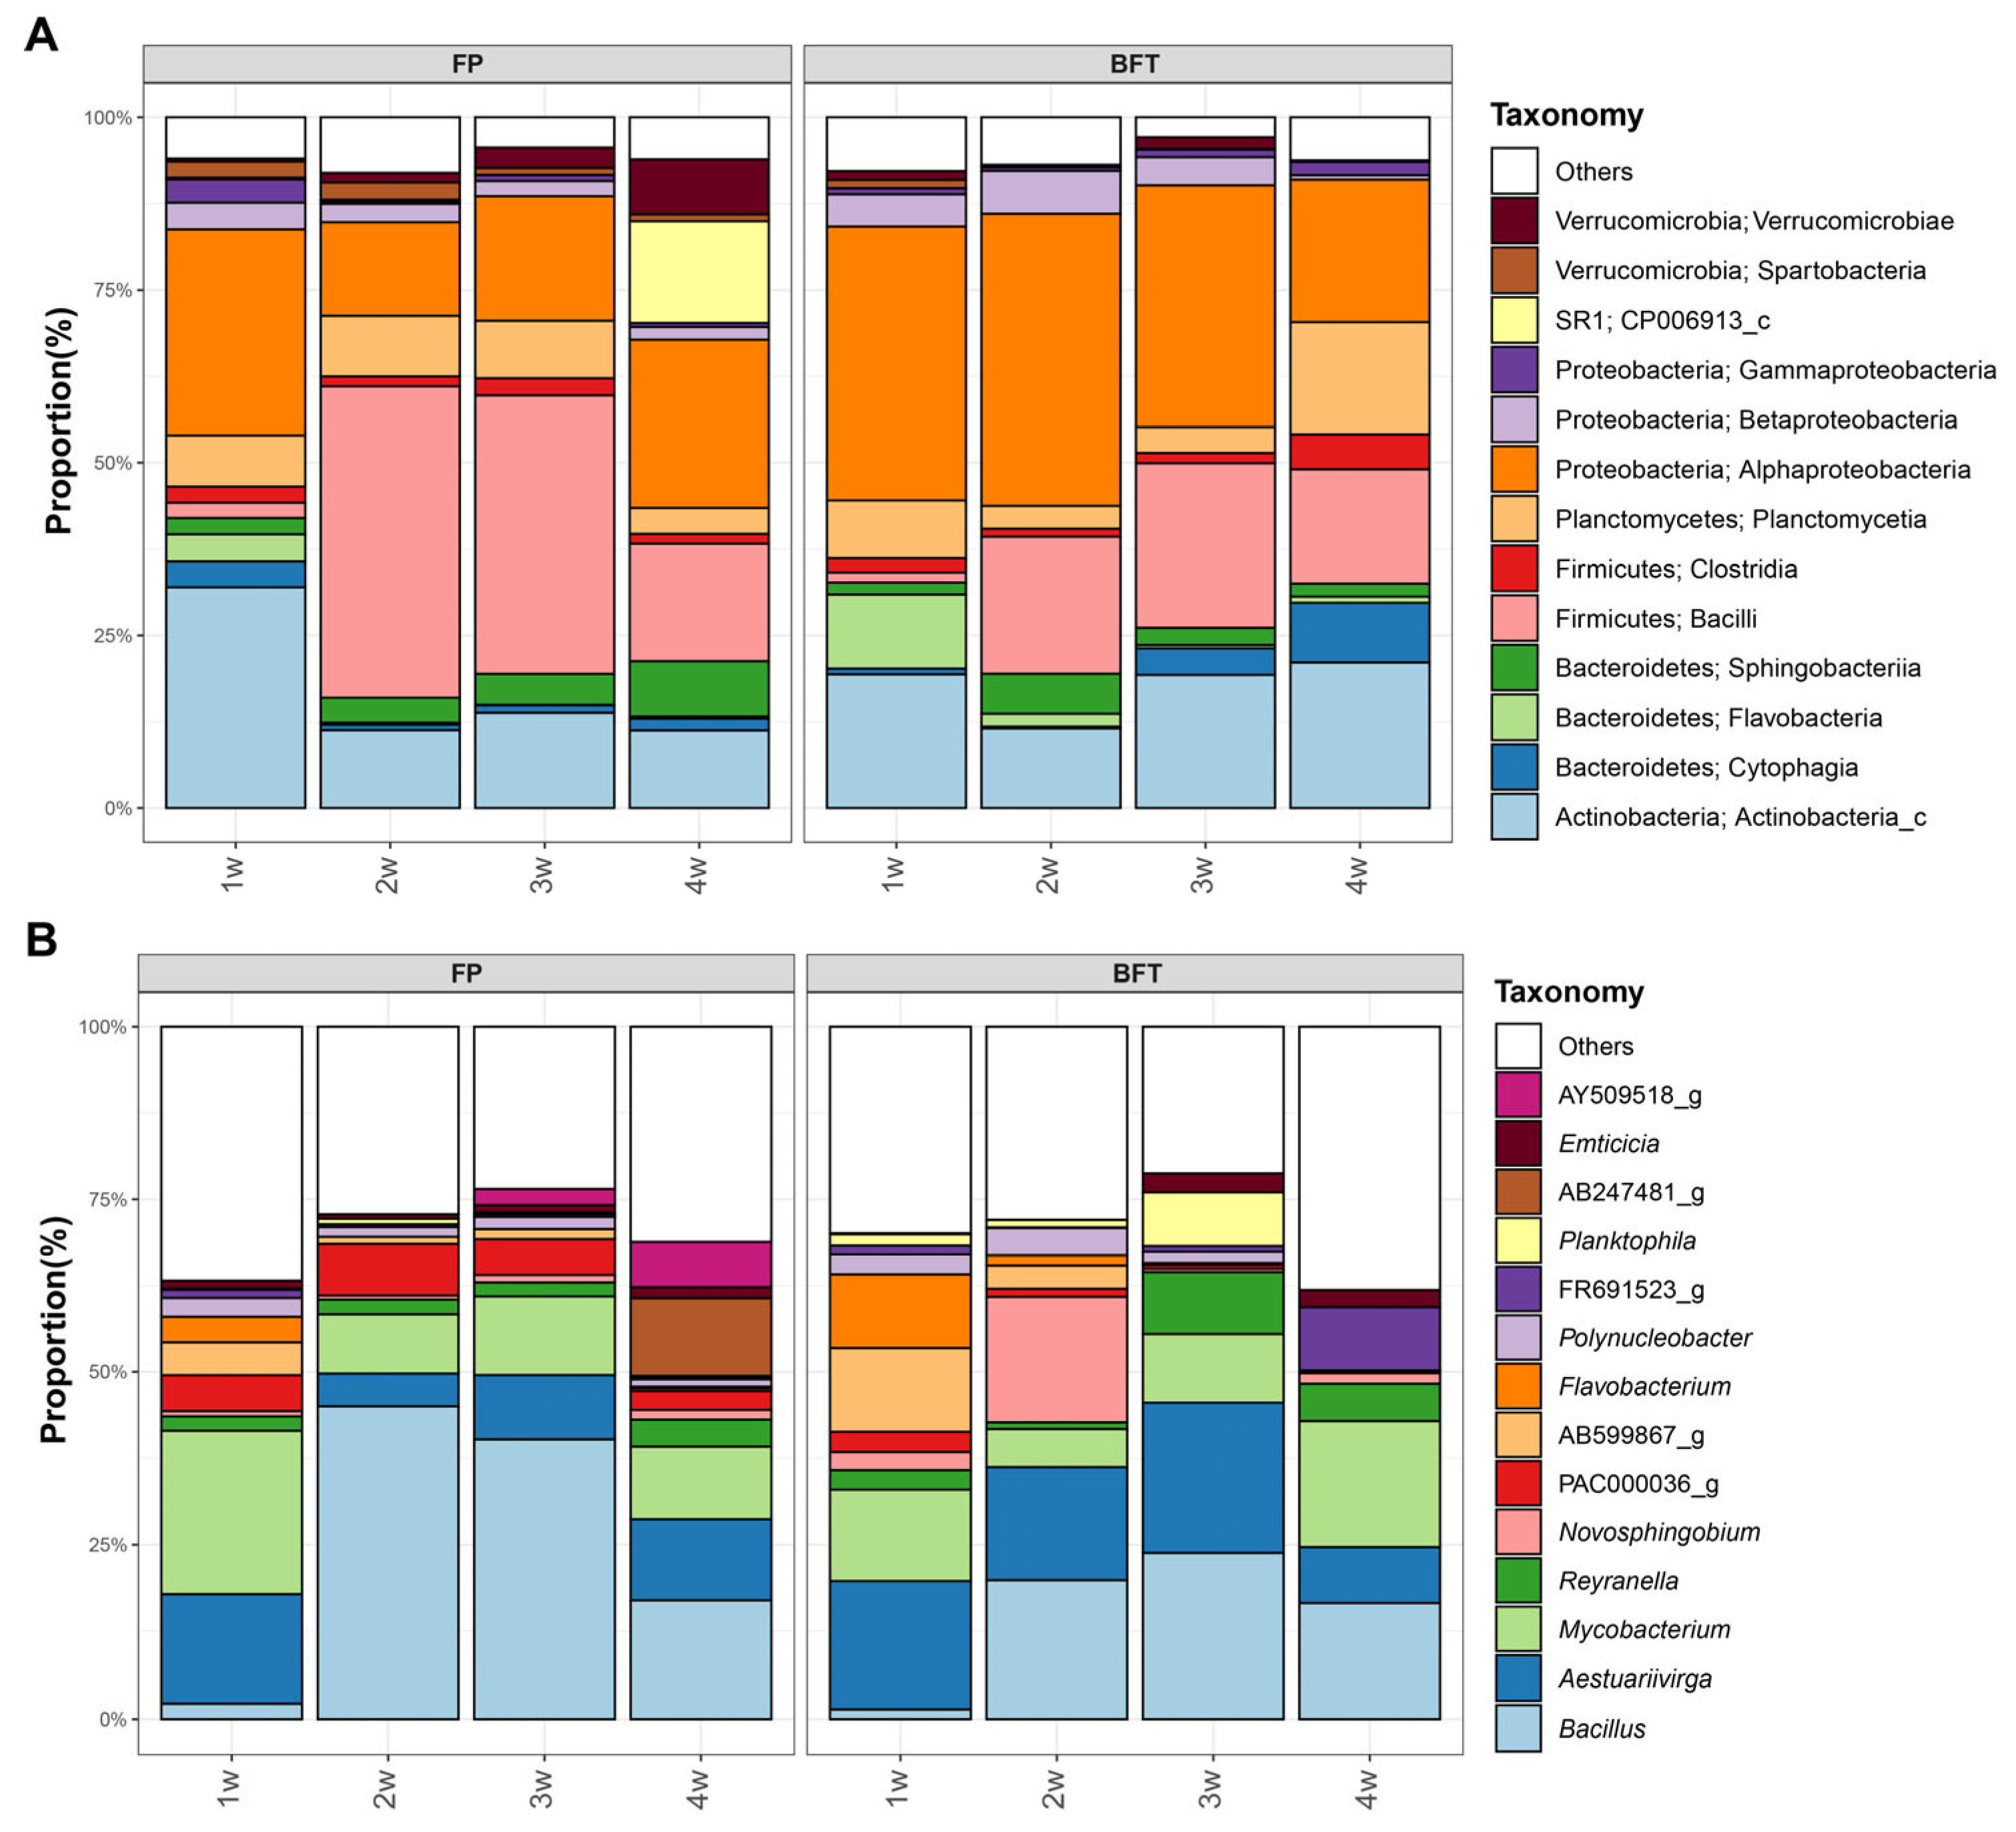
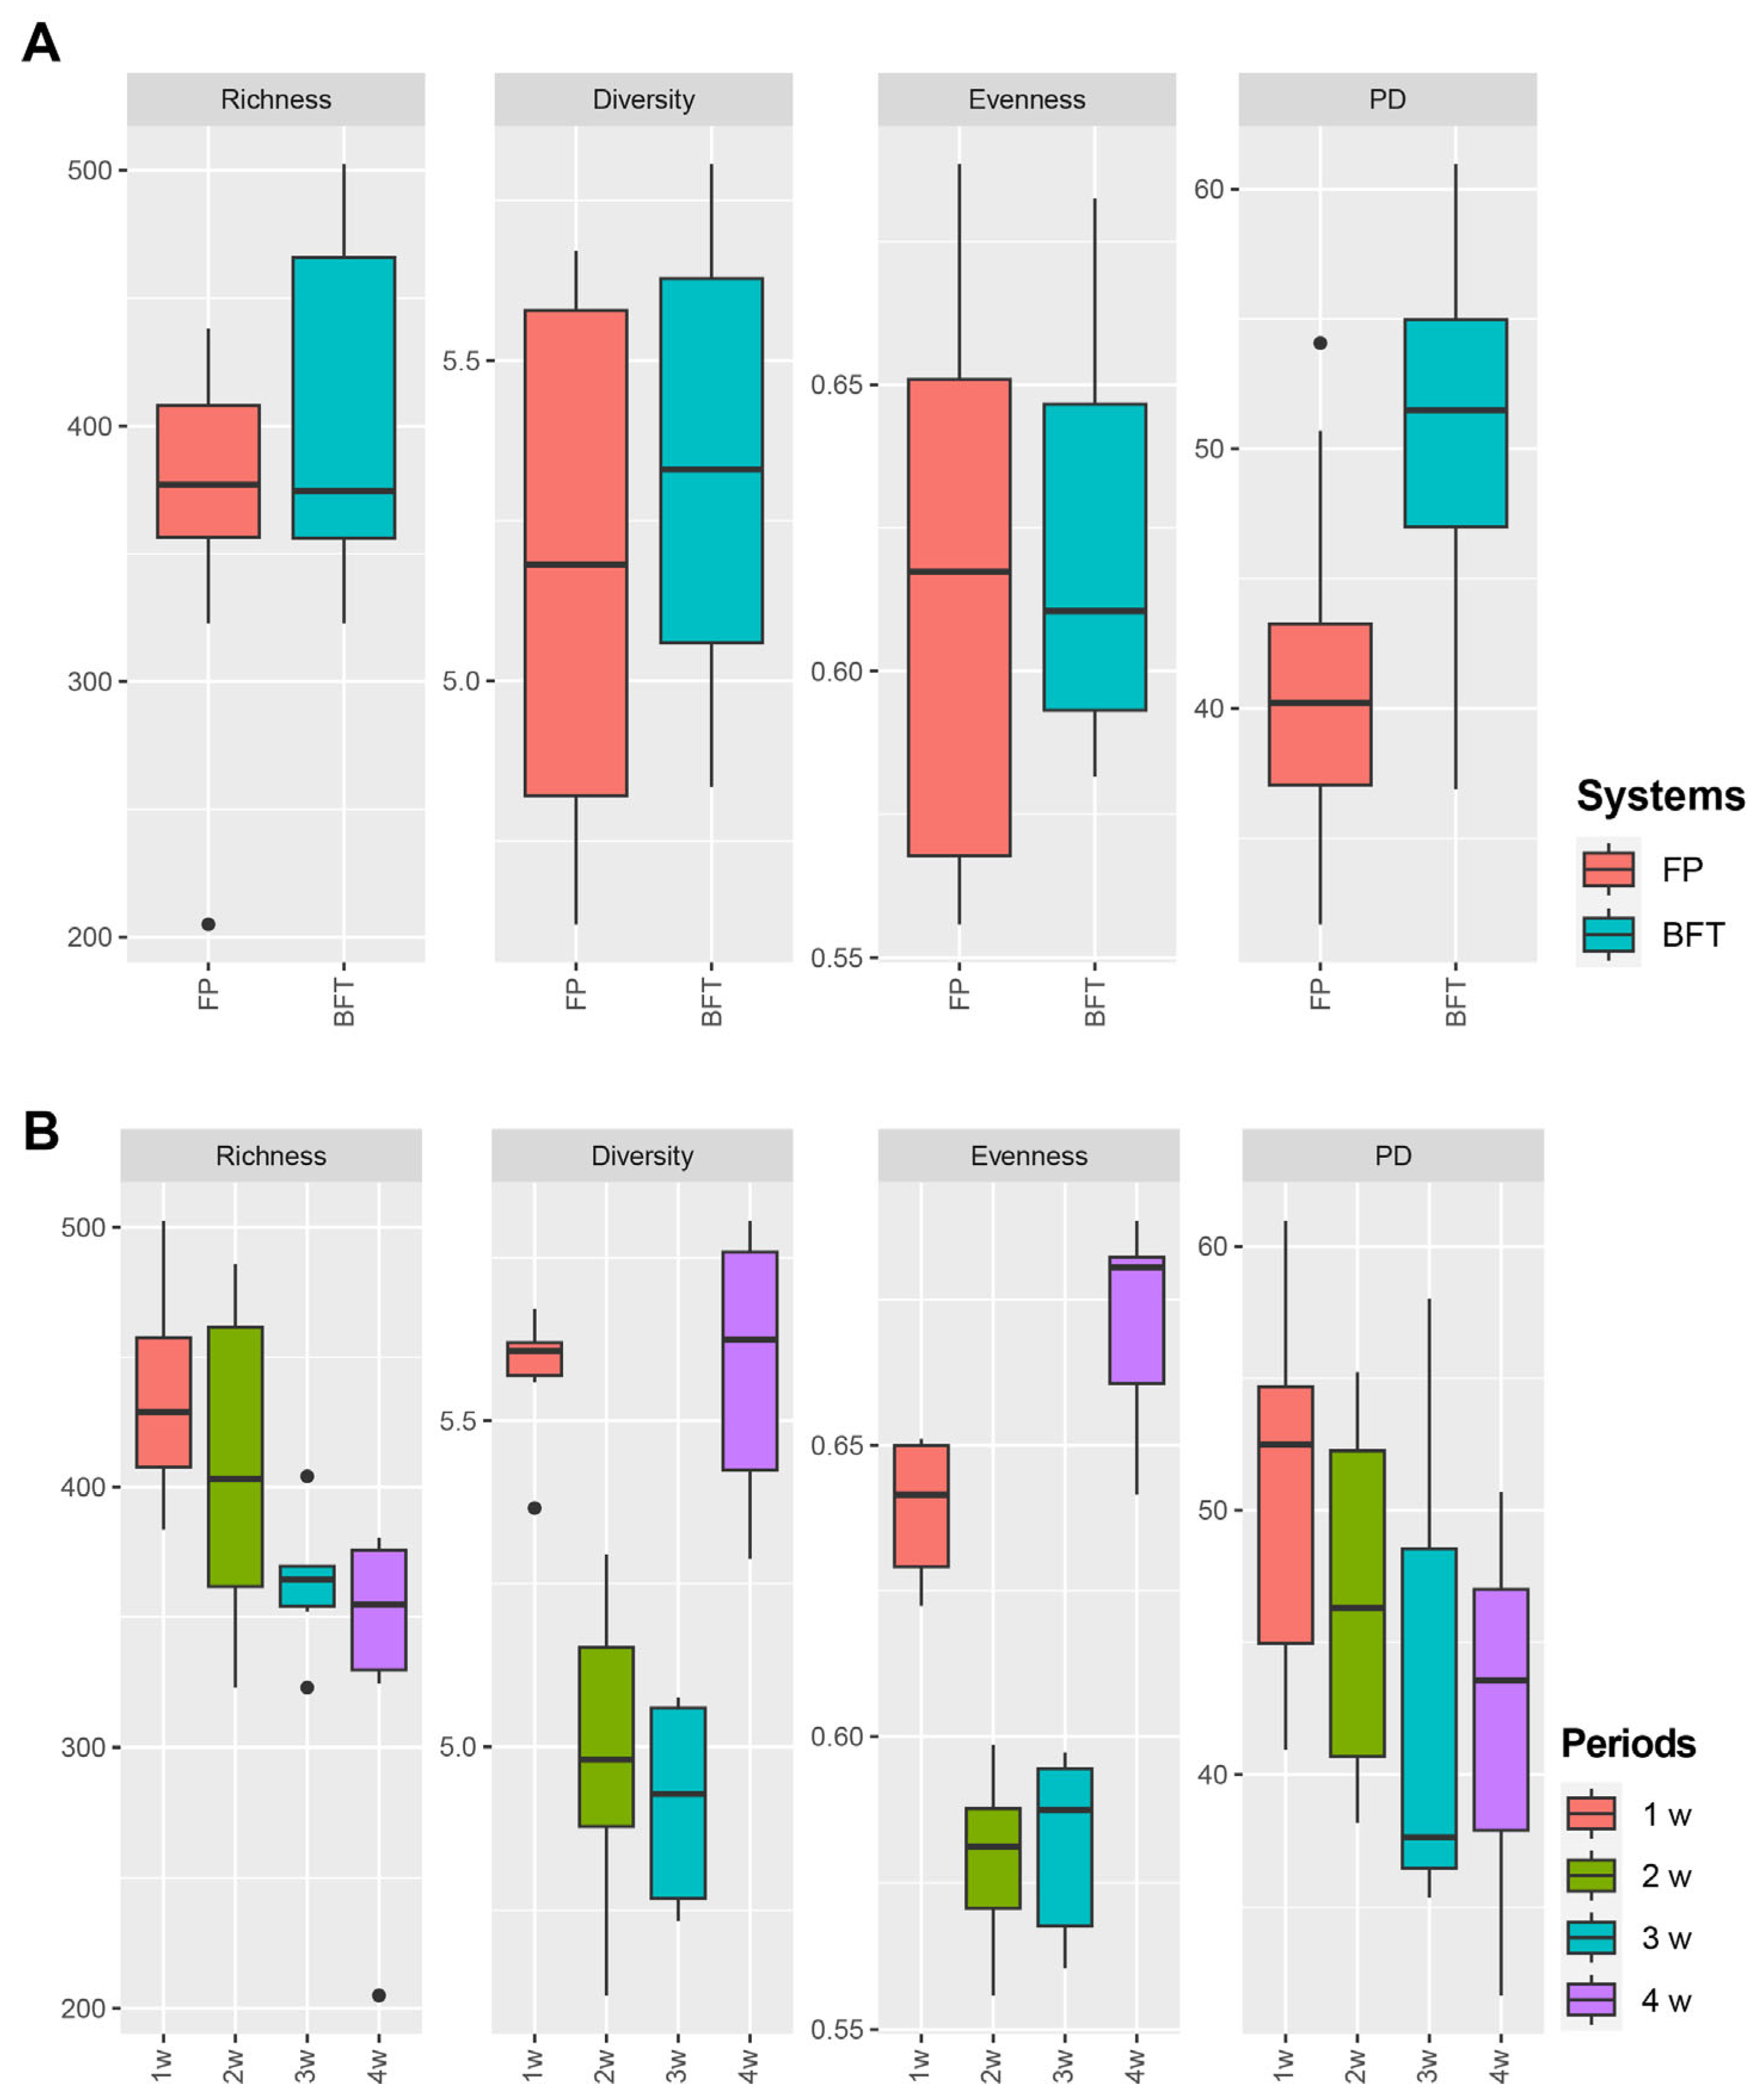
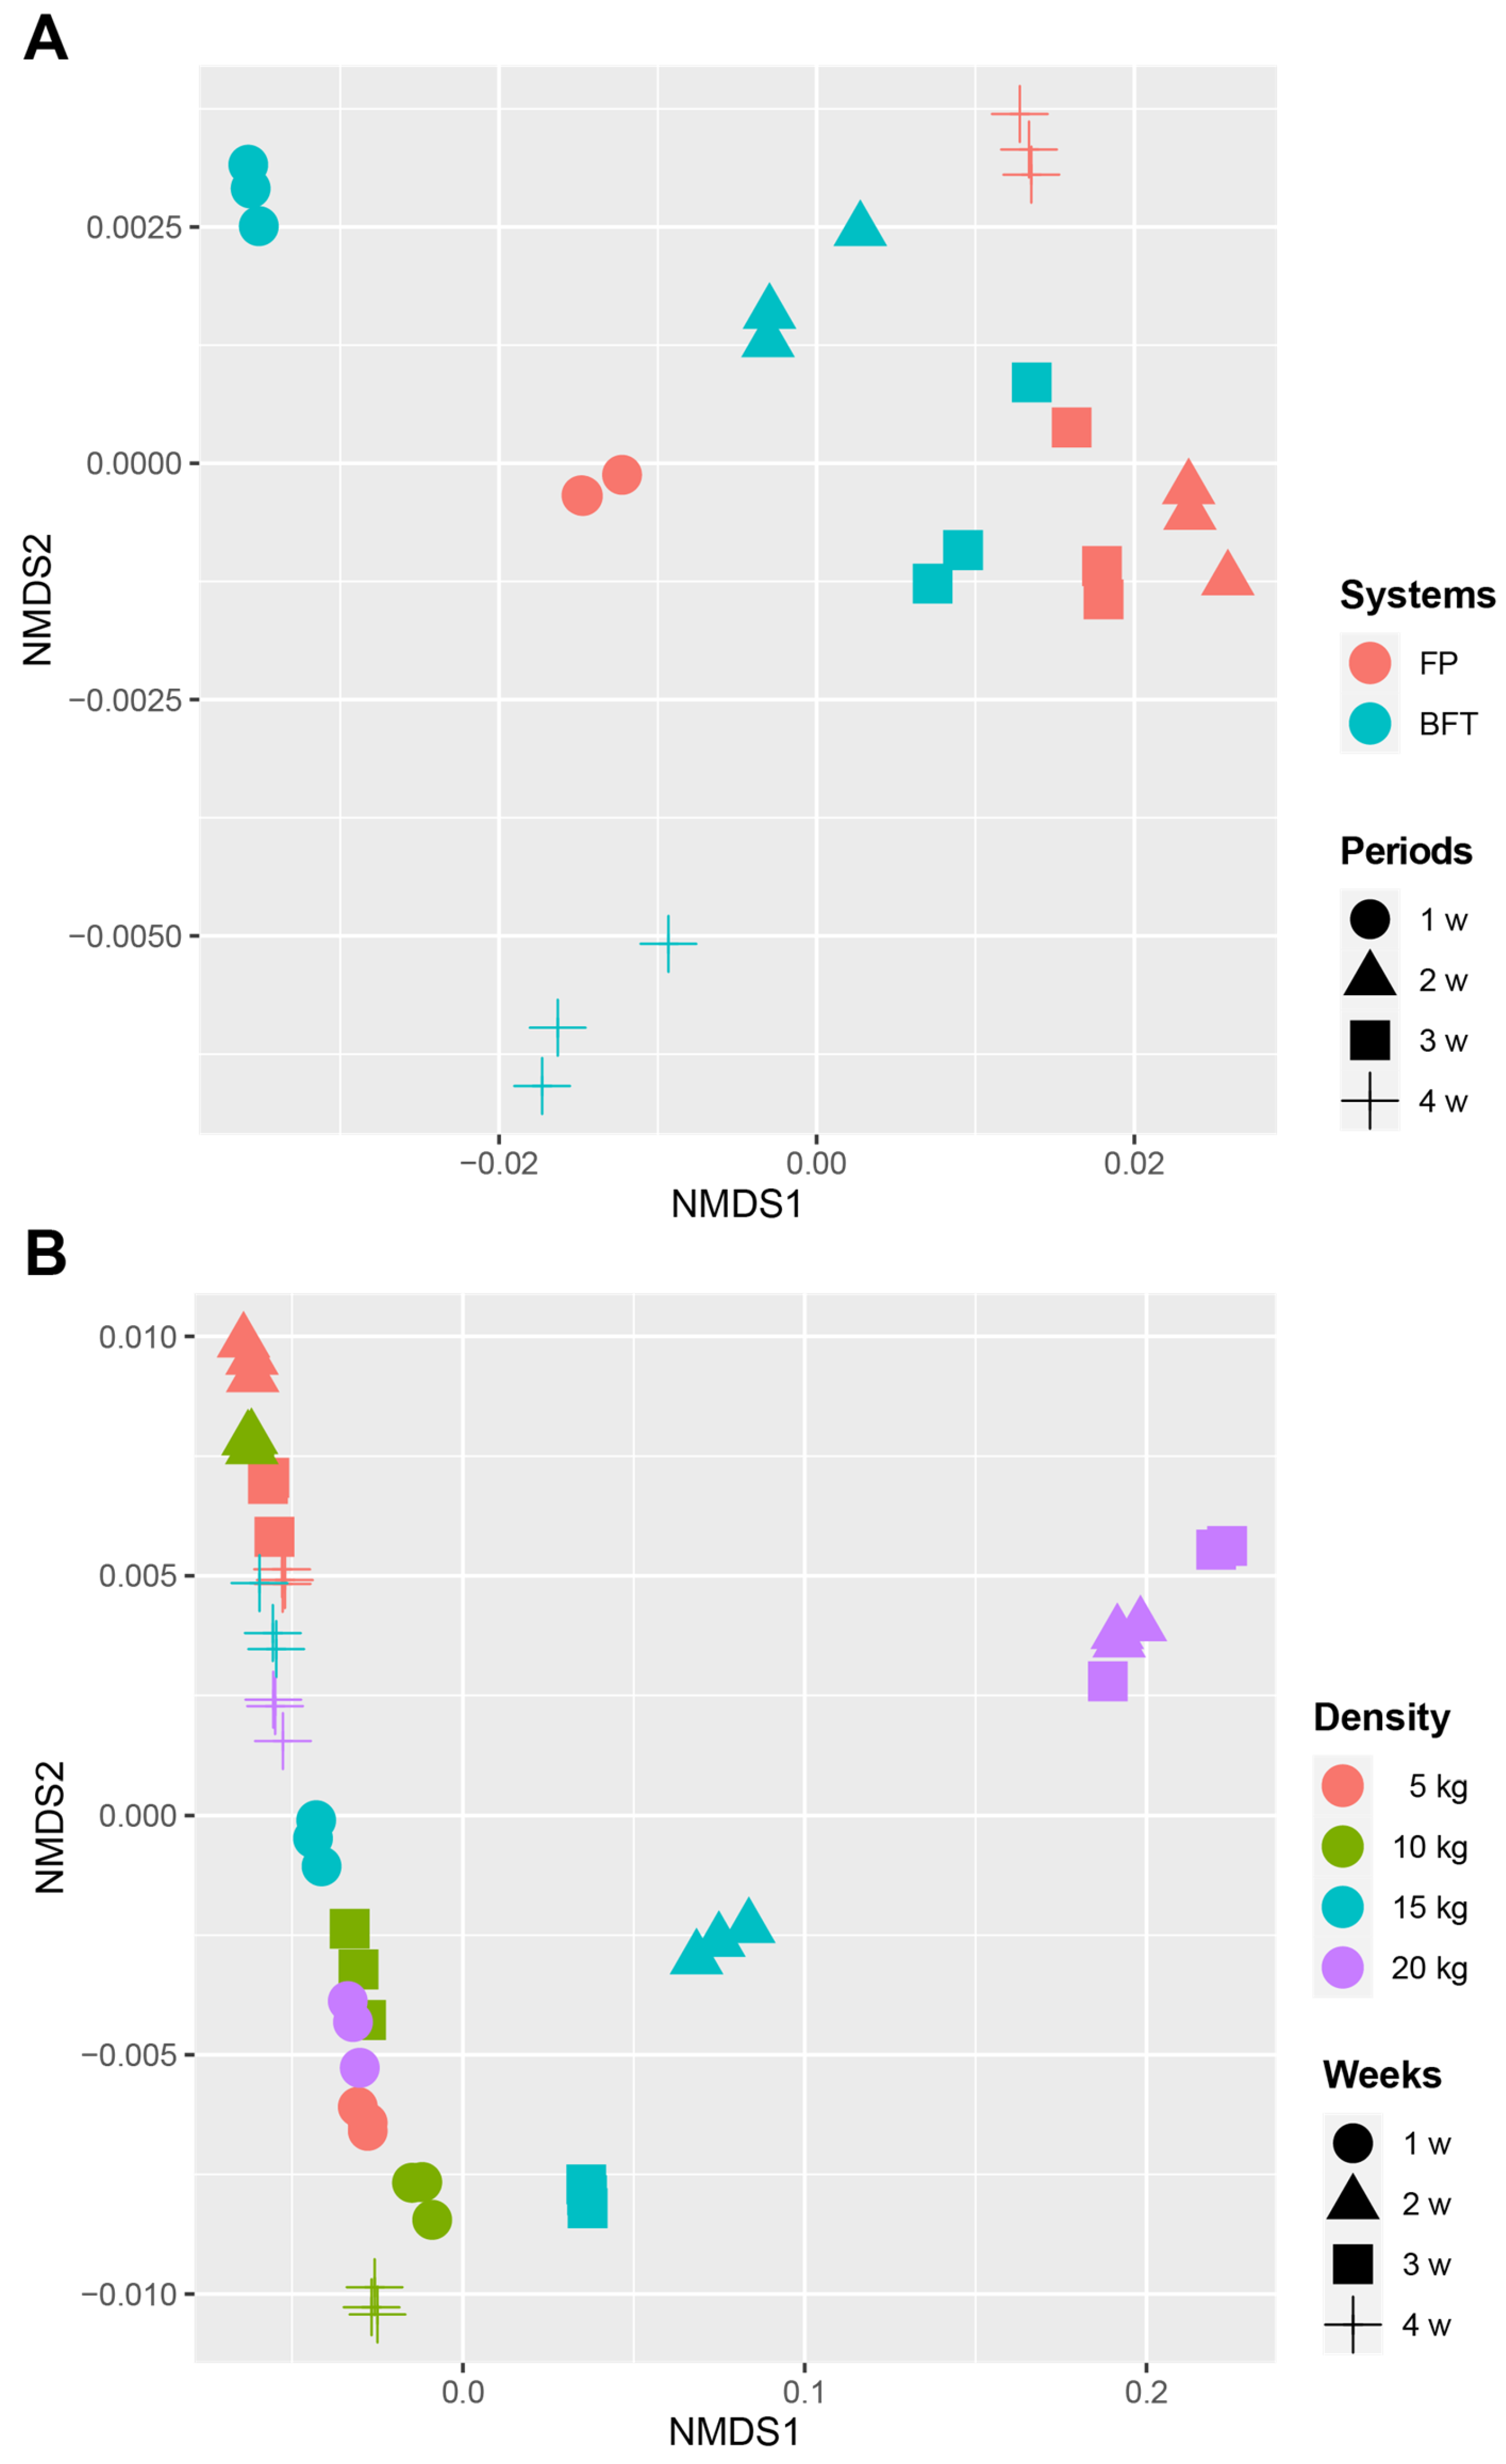
3.3. Difference of Bacterial Communities between FP and BFT Systems

A total of 3,996,753 sequences were obtained from Illumina MiSeq sequencing after filtering for low-quality or nonbacterial sequences. All samples showed high sequencing coverage values (goods coverage: 0.9998–0.9999) with a sufficient number of sequences for analysis. In total, 4629 ASVs belonged to 33 phyla, 80 classes, 125 orders, 258 families, and 608 genera.
Bacterial communities were compared between the FP and BFT (5 kg/m2) systems. A total of 29 phyla, 64 classes, 107 orders, 207 families, 385 genera, and 1568 ASVs were detected in the FP system, whereas 28 phyla, 66 classes, 111 orders, 211 families, 371 genera, and 1532 ASVs were detected in the BFT system. Alpha diversity indices were calculated from the bacterial communities in the FP and BFT systems and compared between the systems and weeks using ANOVA (Figure 2). Shannon’s diversity (p = 0.008) and Faith’s phylogenetic diversity (p = 0.003) indices were significantly higher in the BFT system than in the FP system. Except for phylogenetic diversity, all alpha diversities were significantly different between the cultivation periods (richness: p = 0.019; Shannon’s diversity, p < 0.001; evenness: p < 0.001). Richness and phylogenetic diversity decreased over time. Richness in the first week was significantly higher than that in the fourth week. In contrast, Shannon’s diversity and evenness decreased from the first week to the second week, then increased in the fourth week; the indices were significantly higher in the first week than those in the fourth week (Figure 2B).
The bacterial community structures based on weighted UniFrac distances were significantly different between the systems (R2 = 0.281, p = 0.001) (Figure 3A). At the phylum level, the FP and BFT systems showed similar compositions; Proteobacteria (FP: 26.4%; BFT: 39.9%) was the most abundant, followed by Firmicutes (FP: 28.1%; BFT: 17.9%) and Actinobacteria (FP: 18.7%; BFT: 18.8%) (Figure 4A). At the class level, Bacilli (26.2%) were the most abundant, followed by Alphaproteobacteria (21.4%) and Actinomycetia (17.1%) in the FP system, whereas Alphaproteobacteria (34.4%) was the most abundant, followed by Actinomycetia (17.8%) and Bacilli (15.4%) in the BFT system (Figure 4A). At the genus level, Bacillus (26.1%) was the most abundant, followed by Mycobacterium (13.5%) and Aestuariivirga (10.3%), whereas Aestuariivirga (16.2%) was the most abundant, followed by Bacillus (15.4%) and Mycobacterium (11.7%) in the BFT system (Figure 4B). Trends in composition changes in bacterial communities over time were different between the FP and BFT systems (R2 = 0.631, p = 0.001) (Figure 3A). In the FP systems, Actinomycetia were reduced from the first week to the second week, and Bacilli increased from the first week to the second week and subsequently decreased in the fourth week, whereas in the BFT system, Bacilli decreased from the first week to the second week, and Plantomycetia increased from the third week to the fourth week (Figure 4A). At the genus level, Bacillus showed a high abundance (>30%) in the second and third weeks in the FP system; however, it occupied <25% in the BFT systems (Figure 4B). For Aestuariivirga, the proportion was relatively constant in the BFT systems compared with that in the FP systems. PAC000036_g was relatively stable and abundant in the FP system; however, Novosphingobium showed a characteristic distribution in the second week in BFT systems.

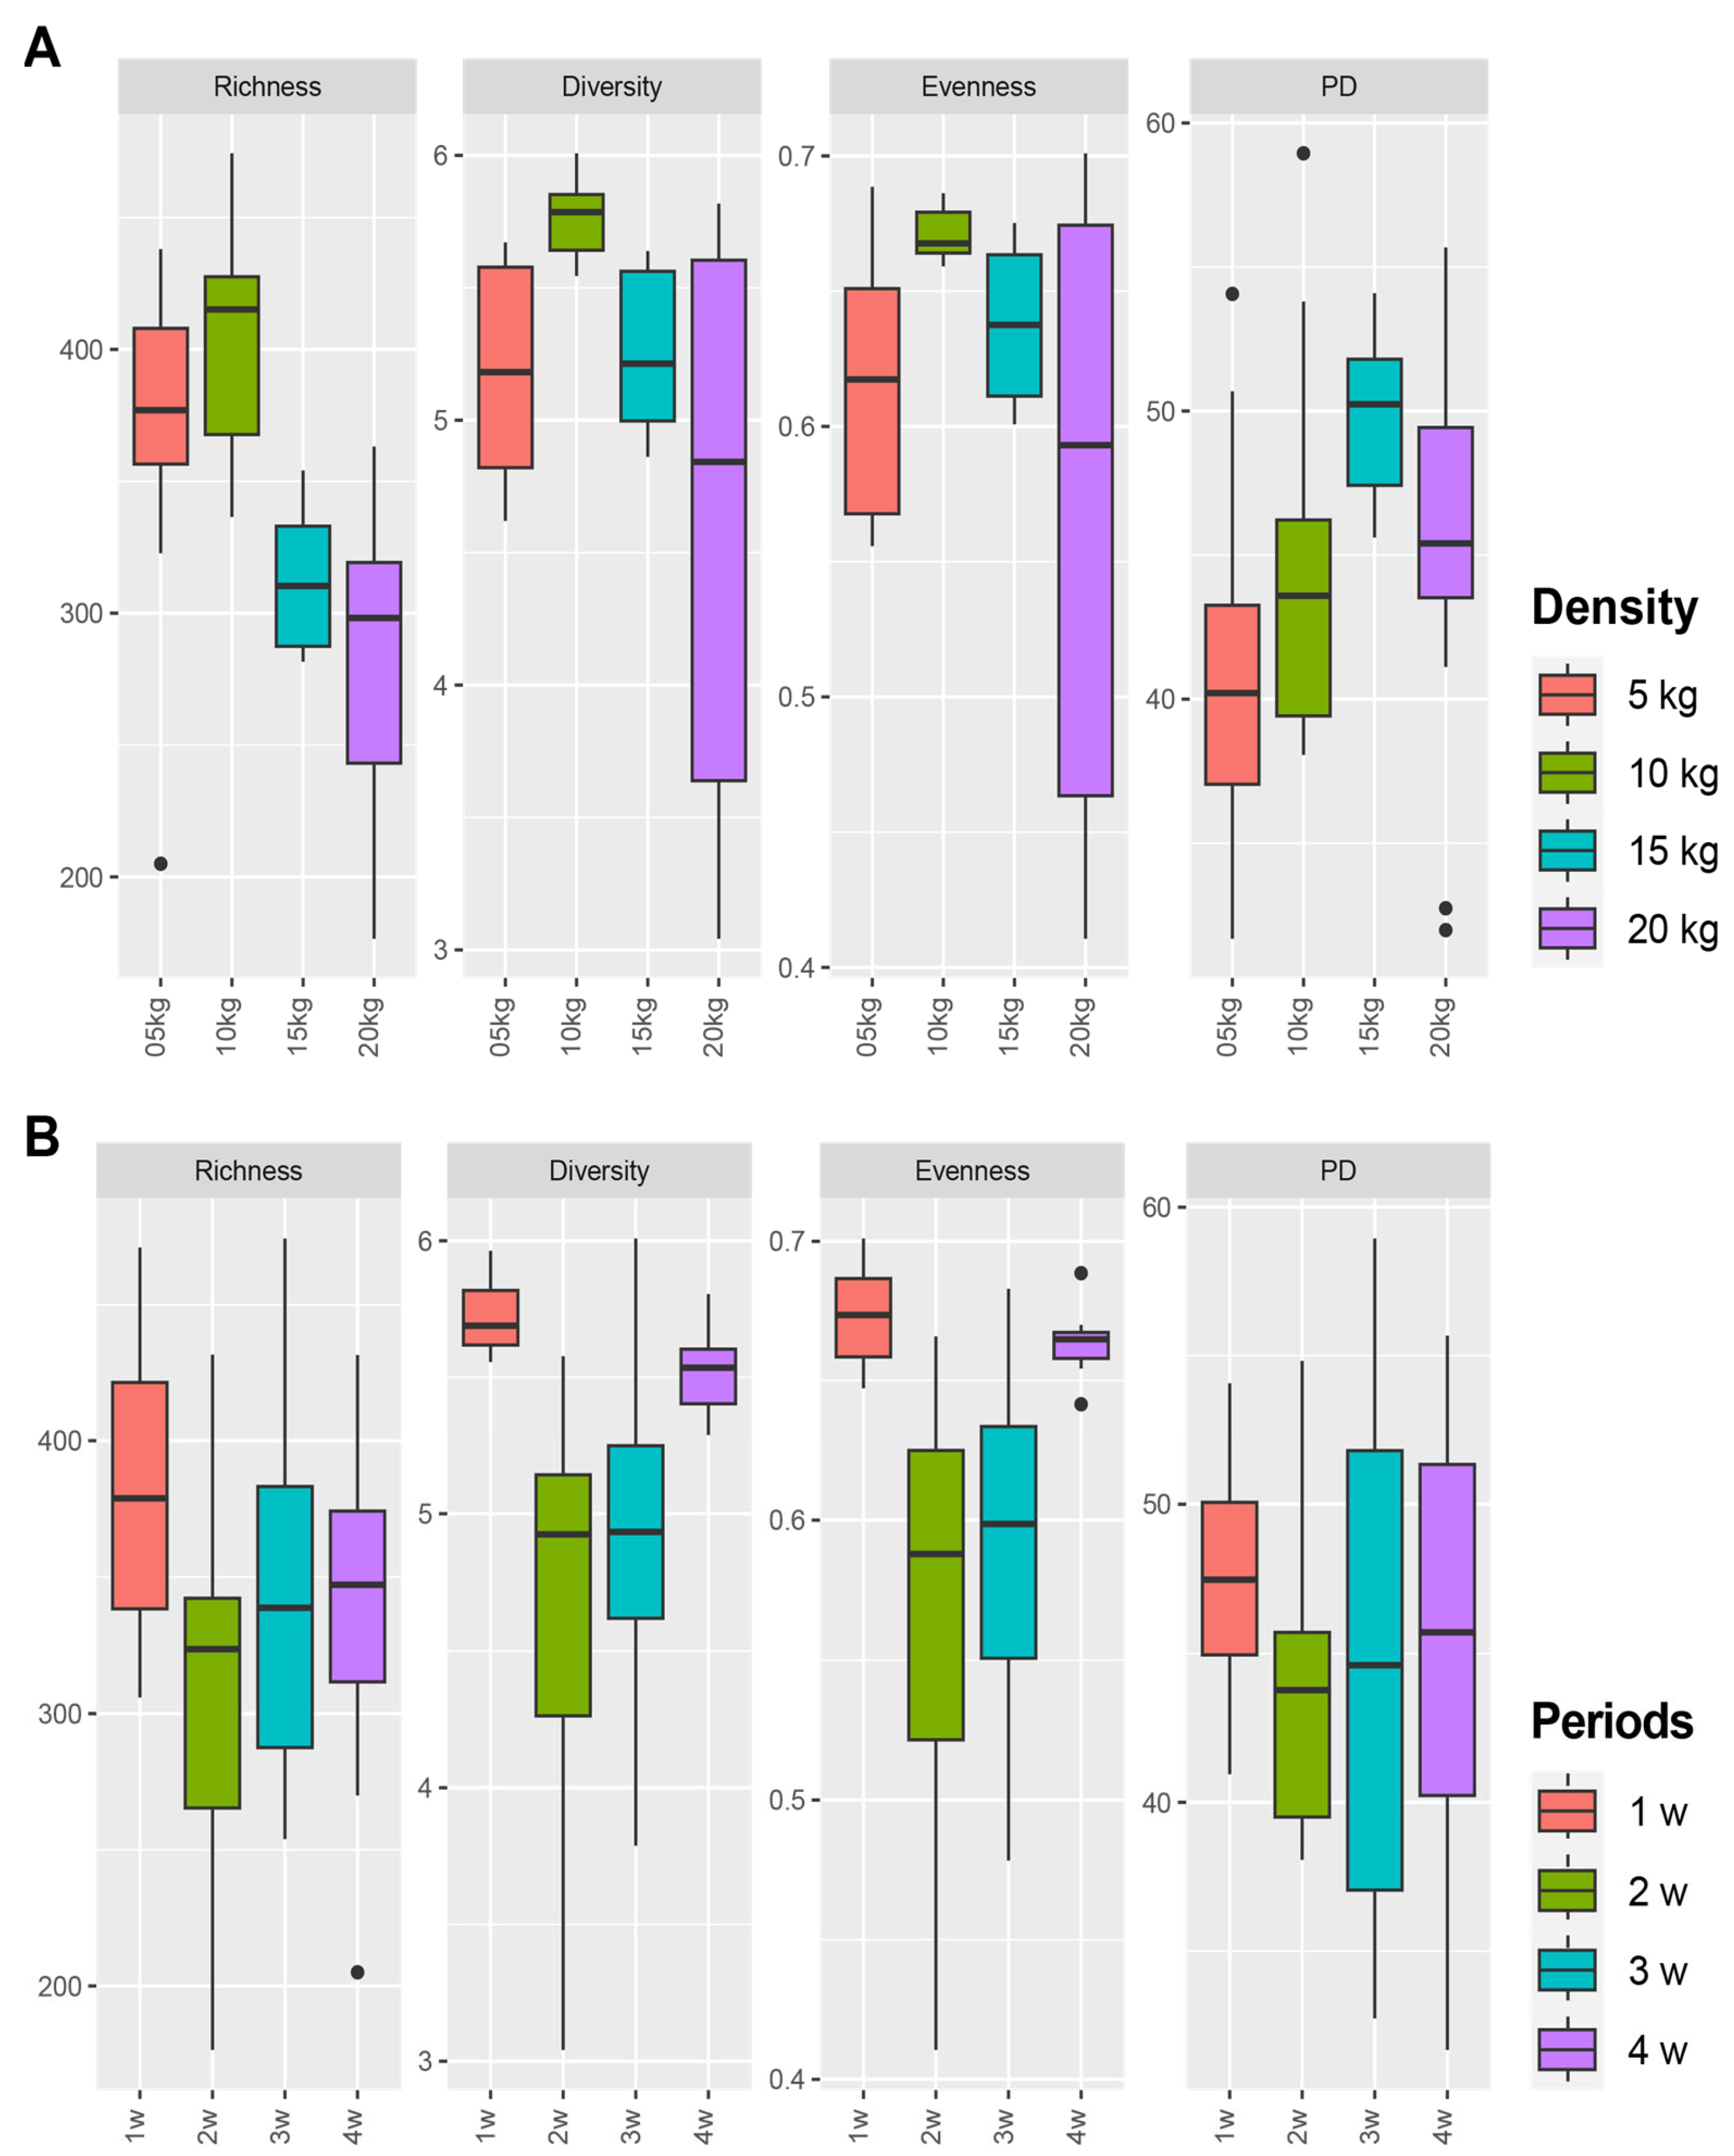
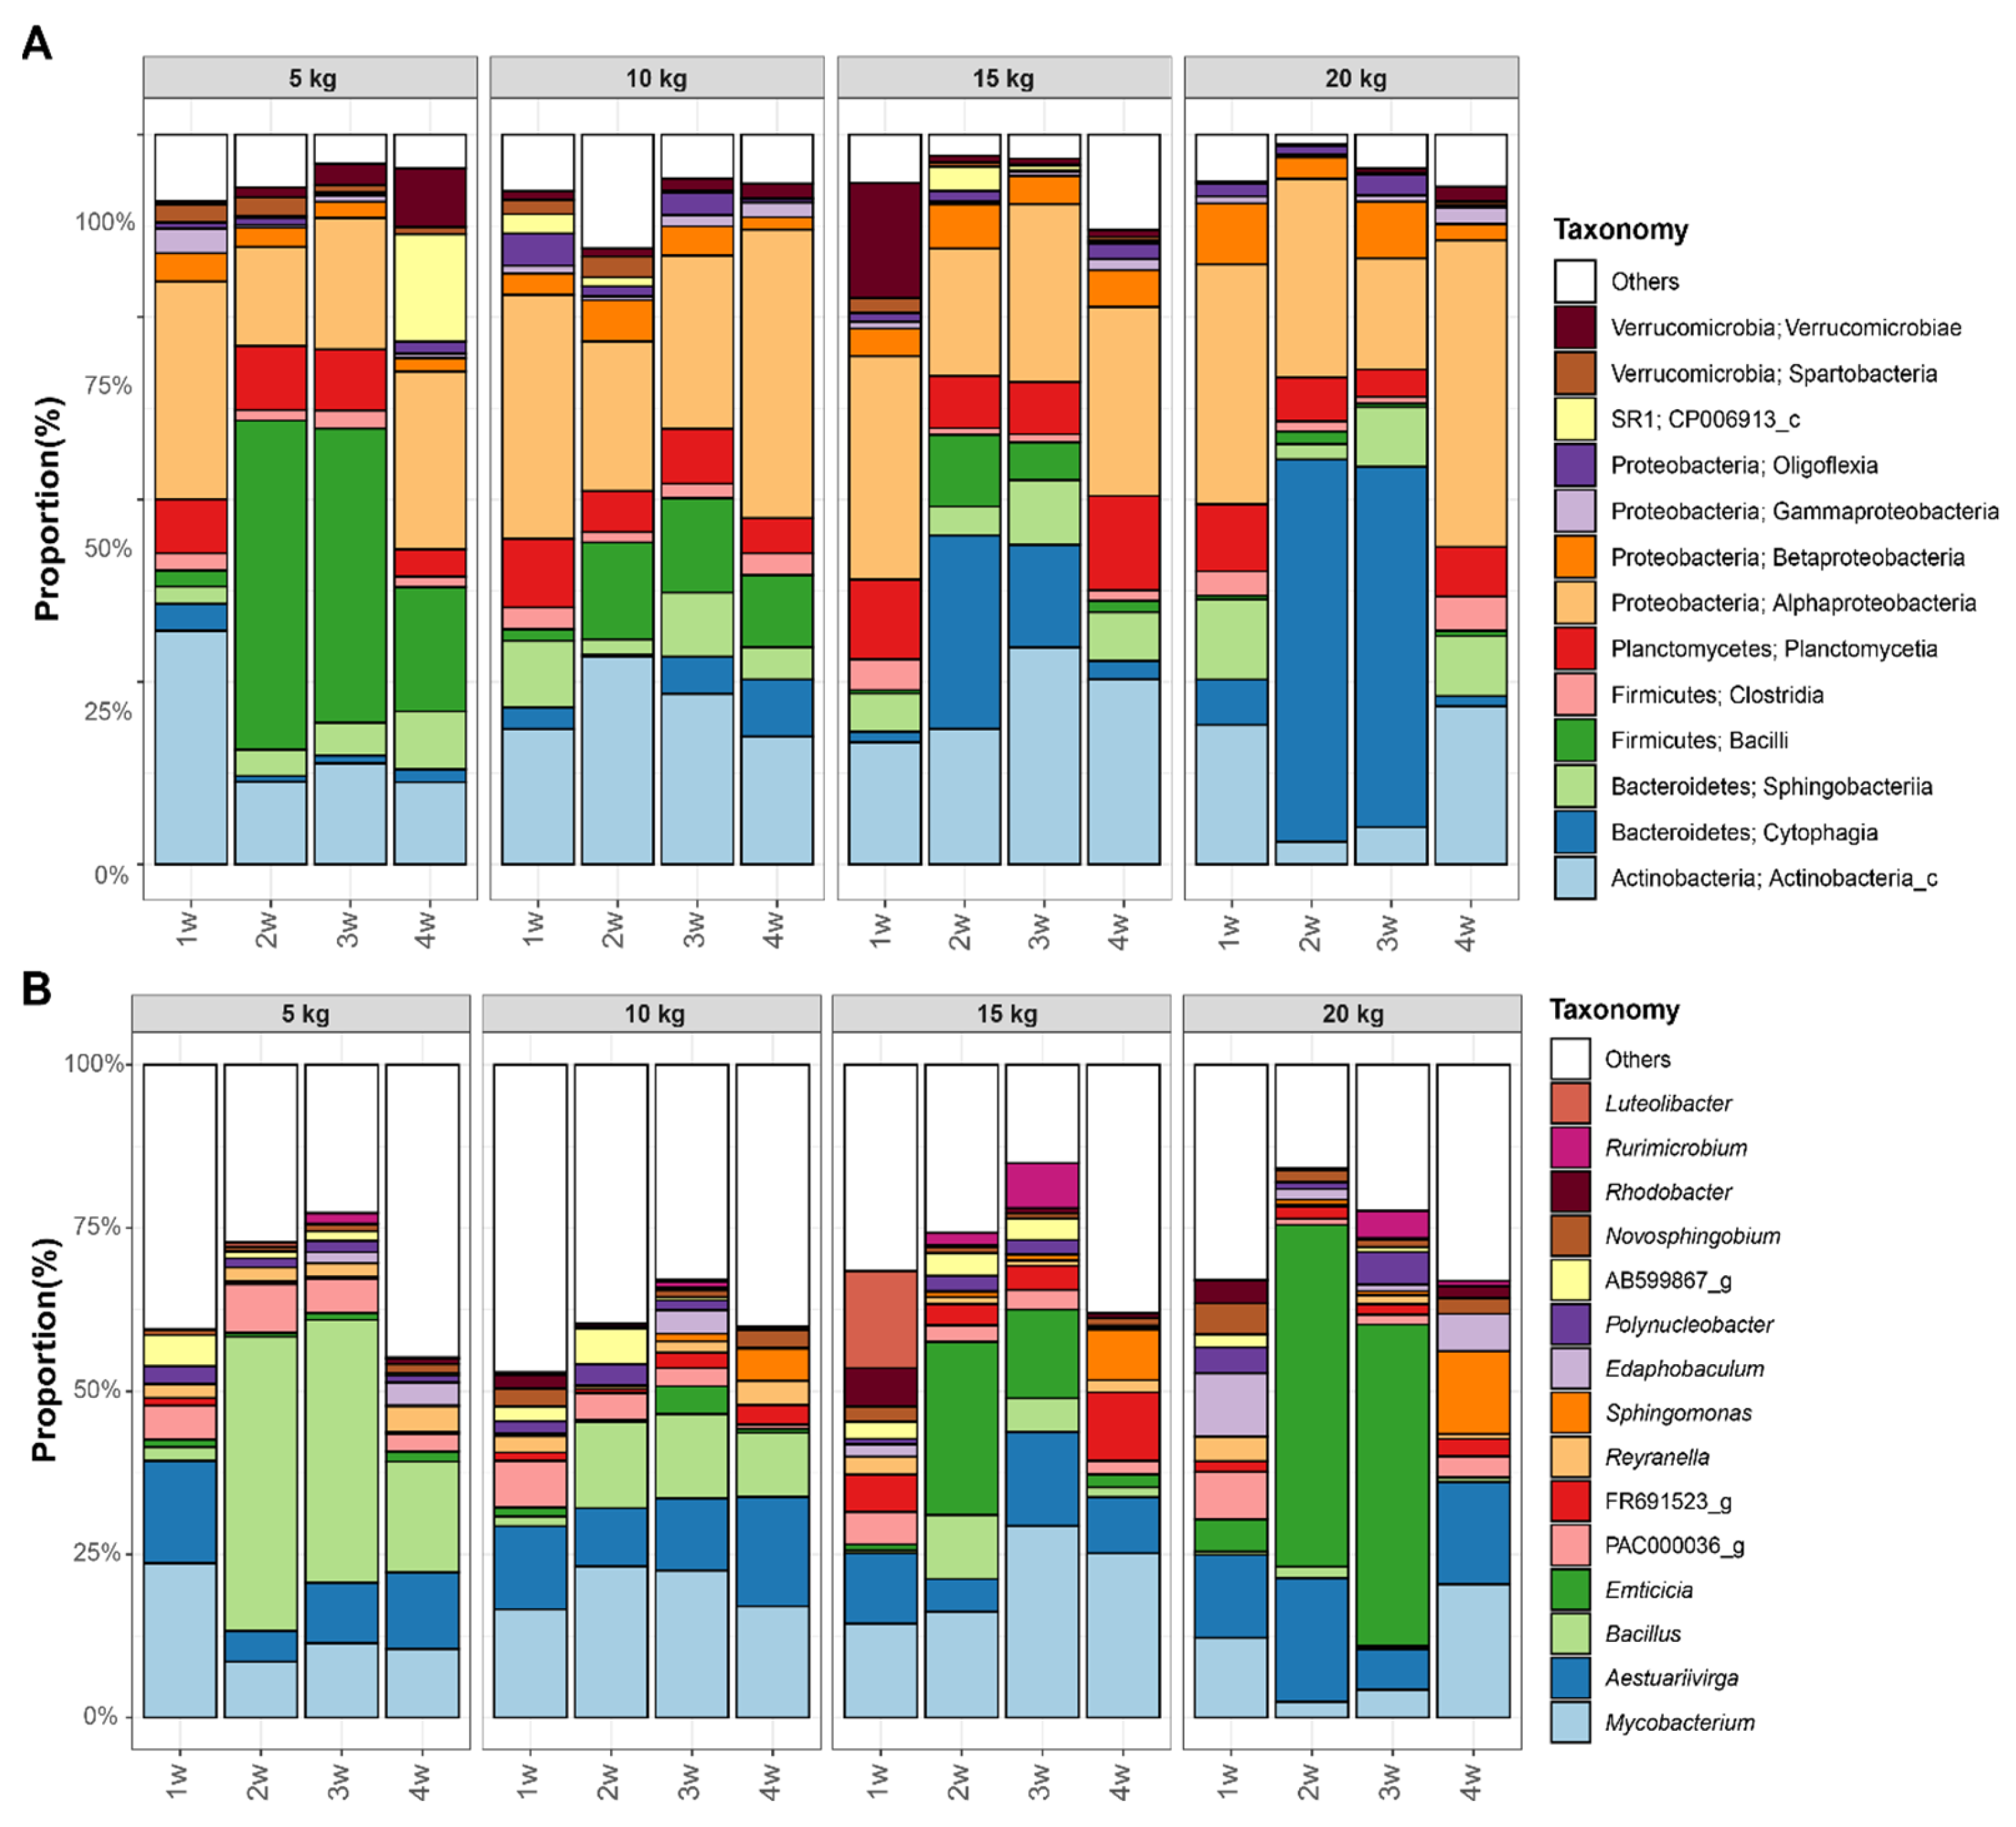
3.4. Difference of Bacterial Communities between Fish Density in FP Systems

Bacterial communities were compared among breeding densities (5, 10, 15, and 20 kg/m2) within the FP systems. All alpha diversity indices were significantly different between breeding densities (p < 0.001, PD: p = 0.017) (Figure 5A). Richness was significantly higher in 5–10 kg/m2 than in 15–20 kg/m2. Shannon’s diversity and evenness were the highest at 10 kg/m2. In contrast, phylogenetic diversity increased as breeding density increased. Alpha diversity was significantly different between weeks (p < 0.001), except for phylogenetic diversity (Figure 5B). Richness, Shannon’s diversity, and evenness significantly decreased from the first week to the second week, then increased in the fourth week as the breeding period increased.
Bacterial communities differed significantly between breeding densities (R2 = 0.346, p = 0.001) (Figure 3B). Actinobacteria and Proteobacteria were highly abundant in all FP samples (Figure 6A). However, Bacteroidetes and Firmicutes showed different distributions between breeding densities: Bacteroidetes were abundant in the 5–10 kg/m2 tanks, whereas Firmicutes were abundant in the 15–20 kg/m2 tanks. At the class level, Actinomycetia and Alphaproteobacteria were highly abundant in all FP samples (Figure 6A). The abundance of Bacilli decreased; however, the abundance of Cytophagia increased as the breeding density increased. The bacterial genus composition showed a pattern similar to that of the class composition, in that Aestuariivirga and Mycobacterium showed high abundance in all samples; Bacillus and Emticicia showed the opposite trend with increasing breeding density (Figure 6B). Bacterial communities were significantly different between breeding periods (R2 = 0.210, p = 0.001), and their trends were significantly different between breeding densities (R2 = 0.442, p = 0.001) (Figure 3B). Actinobacteria and Proteobacteria were the highest in the first week in the 5 and 20 kg/m2 tanks (Figure 6A). In addition, Firmicutes were higher in the second to third weeks for the 5 and 10 kg/m2 tanks. Bacteroidetes, however, were higher in the second to third weeks in the 15 and 20 kg/m2 tanks. At the genus level, Bacillus (class Bacilli) in 5–15 kg/m2 tanks increased in the second to fourth weeks compared to the first week; however, for 15–20 kg/m2, Emticicia (class Cytophagia) showed an increase in the second to third weeks (Figure 6B).

4. Discussion

In this study, we aimed to compare the growth productivity, physicochemical properties of water, and bacterial communities in a FP system to those in a BFT system, as well as to investigate the effect of increasing fish density on several characteristics of the FP system. Before an in-depth discussion, it is essential to underscore the inherent constraints present in this study. The key limitation of the study is the absence of replication on the systems, which can impact the robustness and reliability of the findings. In the absence of replication, the generalizability of the conclusions may be limited, and it becomes challenging to draw definitive conclusions about the broader applicability of FP technology. However, despite the limitation of missing replication, this study also presents significant advantages. It offers valuable insights into the potential benefits of FP, showcasing the enhanced growth rates of fish and crops and distinctive microbial community structure compared to the BFT system. The findings demonstrate the improved feed coefficient and increased productivity, which highlights the potential of FP as a sustainable and efficient aquaculture system. Additionally, the examination of physicochemical properties, nutrient mineral elements, and microbial communities in different experimental groups provides valuable information for optimizing FP performance under varying fish densities.
Our study demonstrated that the FP system was superior in productivity to the BFT system (Table 1 and Table 2). The growth rates of both fish and crops were significantly higher in the FP system, which can be attributed to the presence of plants in the aquaponics system that act as bio-filters and promote the growth of beneficial bacteria. All factors for the fish growth, except for survival rate, showed significantly higher values in FP system compared to it in BFT systems (Table 1). Especially, the lower value of F.C. in the FP system indicated the higher efficiency of the FP system by combination of plant cultivation. Plants may help the nutrient balance or assist in the reduction of toxic materials. Moreover, the leaf number of lettuce was higher in FP than in hydroponics, while these systems did not show a difference statistically for the other plant factors (weight of total and shoot and length of shoot and leaf). In previous studies, some results showed higher performance on animal productivity in the FP system, while another did not [6,9]; the same is true for the previous results on plant growth [10,29,30]. Thus, the influence of the FP system on the productivity of animals and plants is believed to different according to the design of systems and the species of animal and plant. Additionally, the FP system had lower levels of DO and TDS (Table 3), which are critical factors for fish growth and survival. Furthermore, the nutrient mineral elements in the FP system were found at lower concentrations than those in the BFT system, except for sulfur and silicon, which were higher (Table 4). In BFT, fish excrete nitrogenous waste (e.g., ammonia), which is converted into less toxic nitrite-N by heterotrophic bacteria and subsequently converted to nitrate by nitrifying bacteria [31,32]. Nitrate is an important nutrient for plant growth and is taken up by plants as a source of nitrogen [33]. The higher levels of nutrient mineral elements in the BFT system suggested the consumption of nutrients (e.g., nitrogen and phosphorus) by plant crops in the FP system. This indicated that the FP system is more balanced and sustainable and has the potential to be an effective and sustainable method for aquaculture, with benefits for both fish and crop production. However, contrary to expectations, ammonium and nitrate were higher in the FP system than in the BFT system (Table 4). Although there is a case for the higher nitrite value in (multitrophic) FP system compared to BFT systems [9], it is difficult to interpret the cause of the opposite results, and further research is needed to confirm the influence of various conditions.
The bacterial characteristics of the FP system may be related to higher productivity. Our study found that the bacterial diversity was lower in the FP system than in the BFT system (Figure 2), with similar dominant taxa of Bacilli, Actinobacteria, and Alphaproteobacteria present in both systems (Figure 4). The high abundance of Proteobacteria in bacterial communities in AP systems is similar to our results; however, Bacteroidetes was abundant in the AP system, and Actinobacteria was abundant in our FP systems [16,34]. At the genus level, the bacterial composition differed, with Bacillus and PAC000036_g being more abundant in the FP system, whereas Aestuariivirga and Novosphingobium were more abundant in the BFT system. Bacillus species are known to have several beneficial functions such as promoting plant growth, improving soil fertility, enhancing disease resistance in plants, and enhancing water quality [35,36]. In contrast, PAC000036_g, which is an unculturable Planctomycetes bacterium, has not been well characterized but has been previously found to be abundant in the rhizosphere environment [37]. The higher abundance of Bacillus and PAC000036_g in the FP system may have contributed to the better growth rates observed in crops and fish in this system. Aestuariivirga and Novosphingobium, on the other hand, have been found in water-associated environments [38,39] and have plant growth-promoting effects [40,41], which could not determine their effect on the growth of crops and fish. Overall, these findings suggest that the bacterial composition of the FP system, particularly the abundance of Bacillus and PAC000036_g, may have contributed to the higher productivity observed in this system. However, further research is required to fully understand the relationship between bacterial composition and productivity in aquaponics systems.
In addition to comparing the productivity and bacterial diversity between the BFT and FP systems, this study also investigated the effect of increasing fish density following the cultivation period on the productivity of fish and crops and water quality parameters in the FP systems (Table 1, Table 2, Table 3 and Table 4). The results showed that increasing fish density negatively affected the growth rate of both fish and crops, which agrees with previous studies, possibly because of the decreased availability of oxygen and nutrients and increased production of waste [42,43]. This was supported by the water quality parameters; as the levels of EC and TDS increased, a decrease in water quality was indicated (Table 3). In addition, the concentrations of mineral nutrients increased with increasing fish density (Table 4).
Bacterial composition is closely related to the performance of the aquaponics system. This study also explored the bacterial characteristics in response to increasing fish density in FP systems. The results showed that bacterial diversity decreased with increasing fish density (Figure 5), which may have contributed to the decrease in productivity. Actinobacteria and Proteobacteria were the dominant phyla; however, the relative abundances of other phyla changed with increasing fish density (Figure 6). At lower fish densities, Firmicutes (e.g., Bacillus) were dominant, whereas at higher fish densities, Bacteroidetes (e.g., Emticicia) were abundant. This indicated that the bacterial community composition is strongly influenced by fish density in the FP system, which can have implications for nutrient cycling and water quality. These findings suggested that maintaining optimal fish density can help maintain a balanced bacterial community and high productivity in FP systems. Bacillus seemed to play the same positive role mentioned above, dominating low-density tanks with high productivity for the growth of fish and crops. In contrast, Emticicia is a genus of bacteria within the phylum Bacteroidetes, which was found to be abundant in the bacterial community in FP systems with high fish density, which resulted in decreased productivity and poor water quality. Emticicia are often found in water-related environments [44]; however, their function in the environment has not been well studied. Thus, understanding the function of these bacteria is important for the aquaculture industry.

5. Conclusions

In conclusion, this study provides valuable insights into the bacterial community composition and water quality parameters of two Aquaponics systems, FP and BFT. These results indicated that the FP system was more productive than the BFT system, with higher growth rates observed in both fish and crops. In addition, the characteristics of bacterial communities were significantly different between systems and density conditions, suggesting that bacterial communities can influence productivity and water quality in aquaculture systems. Overall, these findings suggest that maintaining an optimal fish density and monitoring bacterial community composition are critical for the successful operation of FP systems. Further research is required to understand the mechanisms underlying the observed bacterial community dynamics and their impact on the overall performance of FP systems.

Author Contributions

Conceptualization, J.-A.H., H.K. and S.-Y.O.; formal analysis, J.-A.H., J.S.P., H.S.J. and S.-Y.O.; investigation, J.-A.H., J.S.P., H.K. and S.-Y.O.; resources, J.-A.H., J.S.P., H.S.J., H.K. and S.-Y.O.; data curation, J.-A.H. and S.-Y.O.; writing—original draft preparation, J.-A.H. and S.-Y.O.; writing—review and editing, J.-A.H., J.S.P., H.S.J., H.K. and S.-Y.O.; visualization, S.-Y.O.; project administration, J.-A.H., H.K. and S.-Y.O. All authors have read and agreed to the published version of the manuscript.

Funding

This study was supported by the National Institute of Fisheries Science, Ministry of Oceans and Fisheries, Republic of Korea (grant number: R2023032).

Institutional Review Board Statement

The animal study protocol was approved by the Ethics Committee of National Institute of Fisheries Science (NIFS-2023-25).

Data Availability Statement

The data supporting the information in this study can be found in the NCBI and can be accessed using the BioProject accession number: PRJNA965928.

Conflicts of Interest

The authors declare no conflict of interest.

References

  1. Boyd, C.E.; McNevin, A.A.; Clay, J.; Johnson, H.M. Certification Issues for Some Common Aquaculture Species. Rev. Fish. Sci. 2005, 13, 231–279. [Google Scholar] [CrossRef]
  2. Ciji, A.; Akhtar, M.S. Nitrite Implications and Its Management Strategies in Aquaculture: A Review. Rev. Aquac. 2020, 12, 878–908. [Google Scholar] [CrossRef]
  3. Baganz, G.F.M.; Junge, R.; Portella, M.C.; Goddek, S.; Keesman, K.J.; Baganz, D.; Staaks, G.; Shaw, C.; Lohrberg, F.; Kloas, W. The Aquaponic Principle—It Is All about Coupling. Rev. Aquac. 2022, 14, 252–264. [Google Scholar] [CrossRef]
  4. Pinho, S.M.; de Lima, J.P.; David, L.H.; Emerenciano, M.G.C.; Goddek, S.; Verdegem, M.C.J.; Keesman, K.J.; Portella, M.C. FLOCponics: The Integration of Biofloc Technology with Plant Production. Rev. Aquac. 2022, 14, 647–675. [Google Scholar] [CrossRef]
  5. Martinez-Cordova, L.R.; López-Elías, J.; Martinez-Porchas, M.; Bringas Burgos, B.; Naranjo-Paramo, J. A Preliminary Evaluation of an Integrated Aquaculture-Agriculture Systems (Tilapia and Peppers) at Mesocosm Scale. J. Aquac. Mar. Biol. 2020, 9, 19–22. [Google Scholar] [CrossRef]
  6. Pinheiro, I.; Arantes, R.; do Espírito Santo, C.M.; do Nascimento Vieira, F.; Lapa, K.R.; Gonzaga, L.V.; Fett, R.; Barcelos-Oliveira, J.L.; Seiffert, W.Q. Production of the Halophyte Sarcocornia Ambigua and Pacific White Shrimp in an Aquaponic System with Biofloc Technology. Ecol. Eng. 2017, 100, 261–267. [Google Scholar] [CrossRef]
  7. Pinho, S.M.; Molinari, D.; de Mello, G.L.; Fitzsimmons, K.M.; Coelho Emerenciano, M.G. Effluent from a Biofloc Technology (BFT) Tilapia Culture on the Aquaponics Production of Different Lettuce Varieties. Ecol. Eng. 2017, 103, 146–153. [Google Scholar] [CrossRef]
  8. Pinho, S.M.; David, L.H.C.; Goddek, S.; Emerenciano, M.G.C.; Portella, M.C. Integrated Production of Nile Tilapia Juveniles and Lettuce Using Biofloc Technology. Aquac. Int. 2021, 29, 37–56. [Google Scholar] [CrossRef]
  9. Poli, M.A.; Legarda, E.C.; de Lorenzo, M.A.; Pinheiro, I.; Martins, M.A.; Seiffert, W.Q.; do Nascimento Vieira, F. Integrated Multitrophic Aquaculture Applied to Shrimp Rearing in a Biofloc System. Aquaculture 2019, 511, 734274. [Google Scholar] [CrossRef]
  10. Da Rocha, A.F.; Filho, M.L.B.; Stech, M.R.; da Silva, R.P. Lettuce production in aquaponic and biofloc systems with silver catfish Rhamdia quelen. Bol. Inst. Pesca 2017, 43, 64–73. [Google Scholar] [CrossRef]
  11. Pinho, S.M.; de Lima, J.P.; Tarigan, N.B.; David, L.H.; Portella, M.C.; Keesman, K.J. Modelling FLOCponics Systems: Towards Improved Water and Nitrogen Use Efficiency in Biofloc-Based Fish Culture. Biosyst. Eng. 2023, 229, 96–115. [Google Scholar] [CrossRef]
  12. Dauda, A.B. Biofloc Technology: A Review on the Microbial Interactions, Operational Parameters and Implications to Disease and Health Management of Cultured Aquatic Animals. Rev. Aquac. 2020, 12, 1193–1210. [Google Scholar] [CrossRef]
  13. Faizullah, M.M.; Rajagopalsamy, C.; Ahilan, B.; Daniel, N. Application of Biofloc Technology (BFT) in the Aquaculture System. J. Entomol. Zool. Stud. 2019, 7, 204–212. [Google Scholar]
  14. Balcázar, J.L.; de Blas, I.; Ruiz-Zarzuela, I.; Cunningham, D.; Vendrell, D.; Múzquiz, J.L. The Role of Probiotics in Aquaculture. Vet. Microbiol. 2006, 114, 173–186. [Google Scholar] [CrossRef] [PubMed]
  15. El-Saadony, M.T.; Alagawany, M.; Patra, A.K.; Kar, I.; Tiwari, R.; Dawood, M.A.O.; Dhama, K.; Abdel-Latif, H.M.R. The Functionality of Probiotics in Aquaculture: An Overview. Fish Shellfish Immunol. 2021, 117, 36–52. [Google Scholar] [CrossRef]
  16. Eck, M.; Sare, A.R.; Massart, S.; Schmautz, Z.; Junge, R.; Smits, T.H.M.; Jijakli, M.H. Exploring Bacterial Communities in Aquaponic Systems. Water 2019, 11, 260. [Google Scholar] [CrossRef]
  17. Choi, J.Y.; Park, J.S.; Kim, H.; Hwang, J.; Lee, D.; Lee, J.-H. Assessment of Water Quality Parameters During a Course of Applying Biofloc Technology (BFT). J. Fishries Mar. Sci. Educ. 2020, 32, 1632–1638. [Google Scholar] [CrossRef]
  18. National Institute of Fisheries Science (NIFS). Standard Manual of Eel (Anguilla Japonica) Aquaculture; National Institute of Fisheries Science (NIFS): Busan, Republic of Korea, 2009. [Google Scholar]
  19. Klindworth, A.; Pruesse, E.; Schweer, T.; Peplies, J.; Quast, C.; Horn, M.; Glöckner, F.O. Evaluation of General 16S Ribosomal RNA Gene PCR Primers for Classical and Next-Generation Sequencing-Based Diversity Studies. Nucleic Acids Res. 2013, 41, e1. [Google Scholar] [CrossRef]
  20. Bolyen, E.; Rideout, J.R.; Dillon, M.R.; Bokulich, N.A.; Abnet, C.C.; Al-Ghalith, G.A.; Alexander, H.; Alm, E.J.; Arumugam, M.; Asnicar, F.; et al. Reproducible, Interactive, Scalable and Extensible Microbiome Data Science Using QIIME 2. Nat. Biotechnol. 2019, 37, 852–857. [Google Scholar] [CrossRef]
  21. Callahan, B.J.; McMurdie, P.J.; Rosen, M.J.; Han, A.W.; Johnson, A.J.A.; Holmes, S.P. DADA2: High-Resolution Sample Inference from Illumina Amplicon Data. Nat. Methods 2016, 13, 581–583. [Google Scholar] [CrossRef]
  22. Bokulich, N.A.; Kaehler, B.D.; Rideout, J.R.; Dillon, M.; Bolyen, E.; Knight, R.; Huttley, G.A.; Caporaso, J.G. Optimizing Taxonomic Classification of Marker-Gene Amplicon Sequences with QIIME 2’s Q2-Feature-Classifier Plugin. Microbiome 2018, 6, 90. [Google Scholar] [CrossRef]
  23. Yoon, S.-H.; Ha, S.-M.; Kwon, S.; Lim, J.; Kim, Y.; Seo, H.; Chun, J. Introducing EzBioCloud: A Taxonomically United Database of 16S RRNA Gene Sequences and Whole-Genome Assemblies. Int. J. Syst. Evol. Microbiol. 2017, 67, 1613–1617. [Google Scholar] [CrossRef]
  24. Price, M.N.; Dehal, P.S.; Arkin, A.P. FastTree: Computing Large Minimum Evolution Trees with Profiles Instead of a Distance Matrix. Mol. Biol. Evol. 2009, 26, 1641–1650. [Google Scholar] [CrossRef]
  25. Katoh, K.; Standley, D.M. MAFFT Multiple Sequence Alignment Software Version 7: Improvements in Performance and Usability. Mol. Biol. Evol. 2013, 30, 772–780. [Google Scholar] [CrossRef] [PubMed]
  26. McMurdie, P.J.; Holmes, S. Phyloseq: An R Package for Reproducible Interactive Analysis and Graphics of Microbiome Census Data. PLoS ONE 2013, 8, e61217. [Google Scholar] [CrossRef] [PubMed]
  27. Oksanen, J.; Blanchet, F.G.; Friendly, M.; Kindt, R.; Legendre, P.; McGlinn, D.; Minchin, P.R.; O’Hara, R.B.; Simpson, G.L.; Solymos, P.; et al. Vegan: Community Ecology Package; Version 2.6-4; R Development Core Team: Vienna, Austria, 2022; Available online: https://CRAN.R-project.org/package=vegan (accessed on 20 March 2023).
  28. R Core Team. R: A Language and Environment for Statistical Computing; R Foundation for Statistical Computing: Vienna, Austria, 2021. [Google Scholar]
  29. Pickens, J.M.; Danaher, J.J.; Sibley, J.L.; Chappell, J.A.; Hanson, T.R. Integrating Greenhouse Cherry Tomato Production with Biofloc Tilapia Production. Horticulturae 2020, 6, 44. [Google Scholar] [CrossRef]
  30. Fimbres-Acedo, Y.E.; Servín-Villegas, R.; Garza-Torres, R.; Endo, M.; Fitzsimmons, K.M.; Emerenciano, M.G.C.; Magallón-Servín, P.; López-Vela, M.; Magallón-Barajas, F.J. Hydroponic Horticulture Using Residual Waters from Oreochromis Niloticus Aquaculture with Biofloc Technology in Photoautotrophic Conditions with Chlorella Microalgae. Aquac. Res. 2020, 51, 4340–4360. [Google Scholar] [CrossRef]
  31. Avnimelech, Y. Carbon/Nitrogen Ratio as a Control Element in Aquaculture Systems. Aquaculture 1999, 176, 227–235. [Google Scholar] [CrossRef]
  32. Ebeling, J.M.; Timmons, M.B.; Bisogni, J.J. Engineering Analysis of the Stoichiometry of Photoautotrophic, Autotrophic, and Heterotrophic Removal of Ammonia–Nitrogen in Aquaculture Systems. Aquaculture 2006, 257, 346–358. [Google Scholar] [CrossRef]
  33. Hu, Z.; Lee, J.W.; Chandran, K.; Kim, S.; Brotto, A.C.; Khanal, S.K. Effect of Plant Species on Nitrogen Recovery in Aquaponics. Bioresour. Technol. 2015, 188, 92–98. [Google Scholar] [CrossRef]
  34. Schmautz, Z.; Graber, A.; Jaenicke, S.; Goesmann, A.; Junge, R.; Smits, T.H.M. Microbial Diversity in Different Compartments of an Aquaponics System. Arch. Microbiol. 2017, 199, 613–620. [Google Scholar] [CrossRef] [PubMed]
  35. Radhakrishnan, R.; Hashem, A.; Abd_Allah, E.F. Bacillus: A Biological Tool for Crop Improvement through Bio-Molecular Changes in Adverse Environments. Front. Physiol. 2017, 8, 667. [Google Scholar] [CrossRef] [PubMed]
  36. Hlordzi, V.; Kuebutornye, F.K.A.; Afriyie, G.; Abarike, E.D.; Lu, Y.; Chi, S.; Anokyewaa, M.A. The Use of Bacillus Species in Maintenance of Water Quality in Aquaculture: A Review. Aquac. Rep. 2020, 18, 100503. [Google Scholar] [CrossRef]
  37. Kalu, C.M.; Ogola, H.J.O.; Selvarajan, R.; Tekere, M.; Ntushelo, K. Correlations Between Root Metabolomics and Bacterial Community Structures in the Phragmites Australis Under Acid Mine Drainage-Polluted Wetland Ecosystem. Curr. Microbiol. 2021, 79, 34. [Google Scholar] [CrossRef] [PubMed]
  38. Chen, W.-M.; Cai, C.-Y.; Sheu, D.-S.; Tsai, J.-M.; Sheu, S.-Y. Novosphingobium ovatum Sp. Nov., Isolated from a Freshwater Mesocosm. Int. J. Syst. Evol. Microbiol. 2020, 70, 5243–5254. [Google Scholar] [CrossRef]
  39. Li, X.; Salam, N.; Li, J.-L.; Chen, Y.-M.; Yang, Z.-W.; Han, M.-X.; Mou, X.; Xiao, M.; Li, W.-J. Aestuariivirga litoralis Gen. Nov., Sp. Nov., a Proteobacterium Isolated from a Water Sample, and Proposal of Aestuariivirgaceae Fam. Nov. Int. J. Syst. Evol. Microbiol. 2019, 69, 299–306. [Google Scholar] [CrossRef]
  40. Addison, S.L.; Foote, S.M.; Reid, N.M.; Lloyd-Jones, G. Novosphingobium nitrogenifigens Sp. Nov., a Polyhydroxyalkanoate-Accumulating Diazotroph Isolated from a New Zealand Pulp and Paper Wastewater. Int. J. Syst. Evol. Microbiol. 2007, 57, 2467–2471. [Google Scholar] [CrossRef]
  41. Rangjaroen, C.; Rerkasem, B.; Teaumroong, N.; Noisangiam, R.; Lumyong, S. Promoting Plant Growth in a Commercial Rice Cultivar by Endophytic Diazotrophic Bacteria Isolated from Rice Landraces. Ann. Microbiol. 2015, 65, 253–266. [Google Scholar] [CrossRef]
  42. Rahmatullah, R.; Das, M.; Rahmatullah, S.M. Suitable Stocking Density of Tilapia in an Aquaponic System. Bangladesh J. Fish. Res. 2010, 14, 29–35. [Google Scholar]
  43. Ani, J.S.; Manyala, J.O.; Masese, F.O.; Fitzsimmons, K. Effect of Stocking Density on Growth Performance of Monosex Nile Tilapia (Oreochromis niloticus) in the Aquaponic System Integrated with Lettuce (Lactuca sativa). Aquac. Fish. 2022, 7, 328–335. [Google Scholar] [CrossRef]
  44. Nam, G.G.; Joung, Y.; Song, J.; Lim, Y.; Cho, J.-C. Emticicia fontis Sp. Nov., Isolated from a Freshwater Pond. Int. J. Syst. Evol. Microbiol. 2016, 66, 5161–5166. [Google Scholar] [CrossRef] [PubMed]
Figure 1. The schematic diagram of BFT and coupled FP systems. Orange: breeding water for FP systems; blue: nutrient solution water for hydroponics.
Fishes 08 00422 g001
Figure 2. Alpha diversity of bacterial communities for (A) FP and BFT systems and (B) cultivation periods. The black dots positioned outside the whiskers denotes an outlier data point, exceeding a distance of 1.5 times the interquartile range as measured from the upper or lower quartile.
Fishes 08 00422 g002
Figure 3. NMDS plot for bacterial communities for (A) FP and BFT systems and (B) fish density.
Fishes 08 00422 g003
Figure 4. Major taxonomic composition of bacterial communities for (A) class and (B) genus levels.
Fishes 08 00422 g004
Figure 5. Alpha diversity of bacterial communities in FP systems for (A) fish density and (B) cultivation periods. The black dots positioned outside the whiskers denotes an outlier data point, exceeding a distance of 1.5 times the interquartile range as measured from the upper or lower quartile.
Fishes 08 00422 g005
Figure 6. Major taxonomic composition of bacterial communities for different fish densities in the FP system. (A) Class and (B) genus levels.
Fishes 08 00422 g006
Table 1. The growth performance of Anguilla japonica in BFT and FP systems after 4 weeks. Data presented as the mean ± S.D. The data in rows denoted with different letters were statically different (p < 0.05).
GroupTotal Length (mm)Body Weight (g)F.C. 1Individual Growth Rate (%) 2Survival Rate (%) 3
BFT457.9 ± 25.8 b140.3 ±27.0 b1.627.3100
5 kg/m2479.7 ± 31.3 a168.2 ± 26.8 a0.952.691.6
10 kg/m2473.8 ± 21.2 ab153.6 ± 24.7 ab1.039.497.8
15 kg/m2458.7 ± 17.5 b143.8 ± 16.0 b1.630.597.8
20 kg/m2456.2 ± 15.1 b132.9 ± 20.0 b3.020.699.4
1 Feed coefficient (F.C.): (total mass of feed input)/(total mass of Anguilla japonica). 2 Individual growth rate (%): (final total biomass − initial total biomass)/(initial total biomass) × 100. 3 Survival rate (%): (initial individuals − final individuals)/(initial individuals) × 100.
Table 2. The growth of lettuce Caipira (Lactuca sativa) in FP systems after 4 weeks. Data presented as the mean ± S.D. The data in rows denoted with different letters were statically different (p < 0.05); ns, not significant.
GroupTotal Weight (g)Shoot Weight (g)Shoot Length (mm)Leaf Length (mm)No. of Leaves
Hydroponics103.0 ± 17.2 ns78.0 ± 19.6 ns199.0 ± 20.1 ns154.0 ± 4.2 ns15.6 ± 2.4 b
5 kg/m2104.0 ± 13.485.0 ± 8.7199.0 ± 25.6158.0 ± 17.516.0 ± 1.4 b
10 kg/m2101.0 ± 4.275.0 ± 14.1192.0 ± 14.8160.0 ± 14.617.0 ± 3.6 ab
15 kg/m2100.0 ± 13.779.0 ± 14.3220.0 ± 20.9177.0 ± 16.422.4 ± 3.9 a
20 kg/m296.0 ± 4.273.0 ± 6.7206.0 ± 20.7162.0 ± 24.920.6 ± 1.8 a
Table 3. Physical parameters of water quality in BFT and FP systems after 4 weeks. Data presented as the mean ± S.D. The data in rows denoted with different letters were statically different (p < 0.05); ns, not significant.
Temp 1 (°C)DO 2 (mg/L)pH (mV)EC 3 (mS/cm)TDS 4 (g/L)
BFT25.7 ± 0.3 ns6.9 ± 0.5 a6.4 ± 0.9 ns0.5 ± 0.2 ns0.3 ± 0.1 ns
5 kg/m225.7 ± 0.56.0 ± 0.4 ab6.4 ± 0.80.4 ± 0.10.3 ± 0.1
10 kg/m225.9 ± 0.56.2 ± 0.5 ab5.9 ± 1.20.6 ± 0.20.4 ± 0.1
15 kg/m225.8 ± 0.78.4 ± 2.2 c5.7 ± 1.00.7 ± 0.30.5 ± 0.2
20 kg/m226.1 ± 0.87.0 ± 1.0 a5.8 ± 0.90.9 ± 0.40.6 ± 0.3
1 Temp: temperature, 2 DO: dissolved oxygen, 3 EC: electrical conductivity, 4 TDS: total dissolved solids.
Table 4. Nutrient mineral element concentrations in BFT and FP after 4 weeks. Data presented as the mean ± S.D. The data in rows denoted with different letters were statically different (p < 0.05); ns, not significant.
Nutrients
(mg/L)
Experimental Groups
BFT5 kg/m210 kg/m215 kg/m220 kg/m2
Total-N25.415.423.557.515.7
NH4+-N0.1 ± 0.1 a0.4 ± 0.4 a0.9 ± 0.7 b0.8 ± 0.7 b1.7 ± 0.7 c
NO2-N0.2 ± 0.2 ns0.2 ± 0.10.3 ± 0.20.5 ± 0.30.7 ± 0.5
NO3-N17.2 ± 7.9 ns20.2 ± 7.227.5 ± 10.624.9 ± 12.534.1 ± 14.5
Total-P7.795.6413.8030.5017.70
Na66.1560.9076.5081.8071.70
K14.203.103.106.704.30
Ca38.5031.4049.7080.5056.70
Mg8.556.408.1011.609.10
Fe0.160.160.160.180.15
Zn0.090.060.130.220.15
Cu0.010.010.060.090.05
S33.2540.5032.1065.5017.20
Cl25.3524.3020.0036.2012.10
Si12.0513.5313.8714.7813.89
Disclaimer/Publisher’s Note: The statements, opinions and data contained in all publications are solely those of the individual author(s) and contributor(s) and not of MDPI and/or the editor(s). MDPI and/or the editor(s) disclaim responsibility for any injury to people or property resulting from any ideas, methods, instructions or products referred to in the content.

