Article

Spawning Migrations of the Atlantic Goliath Grouper along the Florida Atlantic Coast

by
Robert D. Ellis
1,*,
Christopher C. Koenig
2,
James V. Locascio
3,
Christopher R. Malinowski
4 and
Felicia C. Coleman
2
1
Fish and Wildlife Research Institute, Florida Fish and Wildlife Conservation Commission, 100 8th Ave SE, St. Petersburg, FL 33701, USA
2
Coastal and Marine Laboratory, Florida State University, 3618 Coastal Highway, St. Theresa, FL 32358, USA
3
Mote Marine Laboratory, Sarasota, FL 34236, USA
4
Ocean First Institute, Key Largo, FL 33037, USA
*
Author to whom correspondence should be addressed.
Fishes 2023, 8(8), 398; https://doi.org/10.3390/fishes8080398
Submission received: 10 June 2023 / Revised: 19 July 2023 / Accepted: 21 July 2023 / Published: 1 August 2023
(This article belongs to the Special Issue Advances in Atlantic Goliath Grouper Research)

Abstract

:
Atlantic goliath grouper (Epinephelus itajara), the largest reef fish in the Western Atlantic, exhibit high site fidelity to home reefs but also undertake annual migrations to distant spawning sites. Once relatively common throughout Florida and the Caribbean, the species; is now considered vulnerable (i.e., threatened with extinction) due to overfishing and loss of juvenile mangrove habitat. Goliath grouper in the southeastern US form annual spawning aggregations on high-relief reefs located offshore of both the Gulf and Atlantic coasts of Florida, US. To determine spawning site fidelity and describe migration patterns to aggregations, we implanted 50 adult goliath grouper with acoustic transmitter tags from 2010 to 2013. Fish were tagged at known spawning sites off the Florida Atlantic coast and tracked as they moved through the FACT Network array of acoustic receivers. From 2010 to 2020, we collected ~7 million detections from tagged goliath grouper at 153 sites along the southeastern US Atlantic coast. Results of this long-term tracking indicate that adult goliath grouper are relatively sedentary during non-spawning months (Nov to June) but move significantly more prior to, during, and immediately after spawning (July to Oct). Inter-annual spawning site fidelity was high: between 80–93% of tagged fish returned to the same spawning sites each year. Arrival timing at spawning sites coincided with the August new moon, with males arriving earlier than females. Some individuals migrated distances greater than 400-km per year, with observed migration rates of up to 44-km per day prior to spawning. Long-term tagging data are critical for understanding movement patterns and developing management strategies for this species of special conservation concern.
Key Contribution: Atlantic goliath grouper show high site fidelity to spawning aggregation sites; with some individuals tracked making long distance migrations of over 400 km to attend spawning events that occur during the new moon during late summer and early fall. The catchment area for goliath grouper spawning aggregations located along the central Florida Atlantic coast expands over 500 km; including nearly the entire Florida peninsular coast and into southern Georgia.

Graphical Abstract

1. Introduction

Atlantic goliath grouper, Epinephelus itajara (Lichtenstein 1822), exhibit restricted home ranges and high site fidelity, but also form annual spawning aggregations [1,2,3,4,5]. Adult goliath groupers form predictable, repeated concentrations of individuals gathered to spawn at densities far greater than found outside aggregations [5,6]. Fish spawning aggregations (hereafter, “FSAs”), such as those formed by goliath grouper, produce a mass point source of offspring that supports population persistence [6,7]. However, species that form FSAs are highly vulnerable to fishing due to the predictable nature of aggregations in time and space [7,8,9]. Indeed, FSAs of many fish species have been severely disrupted by overexploitation, in some cases (e.g., Nassau grouper E. striatus) to the point where aggregations have disappeared completely [10]. Importantly, the predictability in aggregating behaviors also provides unique opportunities to fishery managers who can employ tools such as time and/or spatial closures to provide protection of reproductive individuals from harvest [9,11]. However, there remain significant knowledge gaps regarding the spatial and temporal patterns of FSAs, both in general and for goliath grouper specifically, that could provide information necessary to best manage aggregating species [8,11].
In the southeastern United States (US), goliath grouper form predictable spawning aggregations at offshore, high-relief habitats in the late summer to early fall each year in the eastern Gulf of Mexico and along the central Florida Atlantic coast [3,5]. Peak spawning by goliath grouper occurs primarily around the new moons of August and September, based on the collection of hydrated oocytes and/or post-ovulatory follicles from fish captured on-site, collection of fertilized eggs, recording of spawning sounds, and/or observations of aggregations during evening dives [5,12]. Dark night spawning has been observed in a wide range of marine animals, including corals and other fish species, and has been hypothesized to maximize fertilization success, reduce the risk of predation on eggs and newly hatched larvae, maximize growth during critical periods of larval development, and match the timing of larval settlement to favorable conditions [13,14,15]. Goliath grouper at FSAs have often been observed surrounded by small planktivorous fishes, thus dark night spawning would presumably reduce predation on eggs and newly hatched larvae [16]. Furthermore, the estimated larval duration of goliath grouper (30 to 80 days) allows the larvae to be subject to peak “king” tides that occur in south Florida during the fall, enhancing access to the mangrove leaf litter where larval goliath grouper settle [17,18]. Following settlement, juvenile goliath grouper remain in the mangrove nursery habitats for 3 to 5 years before undergoing an ontogenetic shift to near and offshore reef habitats [2,19].
Despite advances in knowledge of goliath grouper early life history, substantial questions remain regarding adult life history that are needed to manage vulnerable populations. In the US, the goliath grouper population experienced significant declines due to intense fishing pressure during the latter part of the 20th century [3,20]. After the implementation of a total harvest moratorium in 1990, the goliath grouper population in US waters showed strong signs of recovery [3]. However, the extent of this recovery and the current stock status of goliath grouper in the US remains unknown, in part due to the difficulty of collecting relevant data (e.g., age and size distributions) from a closed fishery [21,22]. Advances in genetic data analysis [23] (Tringali; this issue), and aging of fish using non-lethal sampling methods [24,25] (Carroll et al.; Murie et al.; both this issue), however, have proceeded thanks to ongoing targeted sampling programs and previously collected specimens available from Florida State University, the Florida Fish and Wildlife Conservation Commission (FWC), and elsewhere [23,24,25].
Related to reproduction and spawning, gaps in life history information needed to develop a sustainable management plan for goliath grouper, include: (1) movement patterns linking resident sites where individuals spend most of the year to spawning sites where they may spend only a few weeks to months, (2) distances traveled between resident and spawning sites; (3) differences in individual behaviors between resident and spawning sites; (4) estimates of spawning aggregation size (in terms of both number of individuals and number of aggregations); and (5) the size of catchment areas—the areal extent of home ranges and migration routes of a spawning population sensu Nemeth 2012—from which spawning fish migrate [9]. Fortunately, many of these data can be collected using passive acoustic telemetry. For species that migrate, either in search of seasonal resources or spawning sites, the use of acoustic telemetry has improved the ability of researchers to determine spatial linkages between home ranges and spawning sites and to define migration corridors. This technology has been particularly useful in describing the behaviors of multiple grouper species both related to spawning and otherwise [26,27,28,29].
Instrumental to data collection on the movement patterns of goliath grouper is an extensive network of acoustic telemetry receivers deployed by members of the FACT Network (https://secoora.org/fact/, accessed on 19 May 2023), a grassroots cooperative of researchers who use compatible telemetry hardware and share detection data [30]. Cooperative networks such as the FACT Network, iTAG in the Gulf of Mexico, and the Atlantic Cooperative Telemetry Network (ACT) along the US mid-Atlantic coast, allow member researchers to track their study animals over longer durations and greater distances than is possible within the scope of most single telemetry studies [30,31,32]. For the present study, membership in the FACT Network enabled the monitoring of movements of individual goliath grouper between resident and spawning sites—a tremendous advantage in terms of the overall spatial and temporal coverage of detection data that were available to us.
In this study, we addressed some of these outstanding gaps in our understanding of goliath grouper spawning behaviors. Specifically, we aimed to quantify fidelity to FSA sites, describe behaviors at spawning sites during and outside of the spawning season, and define the catchment area of FSAs. Further, we investigated whether these patterns and behaviors varied across age, size, or sex. To that end, we tagged goliath groupers with acoustic transmitters which were tracked through FACT Network member arrays of stationary acoustic receivers. This allowed us to describe the spawning migrations of goliath grouper along the Florida Atlantic coast between residence and spawning sites, as well as the finer scale movements made by individuals while present on spawning sites.

2. Materials and Methods

2.1. Fish Tagging

Starting in fall of 2010, we tagged adult goliath grouper at three suspected spawning sites with acoustic transmitter tags (InnovaSea Systems, Inc., Halifax, NS, Canada [formerly Vemco], model V16-6H). Tags were set to produce a uniquely coded acoustic signal at 69 kHz randomly once every 60 to 180 s (nominal delay = 120 s) and had an expected battery life of 3033 days (8.3 y). The detection range for these tags as estimated in previous studies was 250 to 750 m from the receiver [33]. Fish were captured using hook-and-line gear, and once landed, each fish was strapped onto a stretcher frame modified with nylon tie-down straps to minimize fish movement on deck. Once immobilized, a hose with running seawater was placed in the mouth to irrigate the gills, a wet towel covered the eyes to protect them from direct sunlight damage, and the swim bladder was vented with a stainless-steel trocar and canula. Fish were measured for total length (TL) to the nearest cm and the soft dorsal fin rays (numbered 6 and 7 counting from anterior to posterior) were removed for aging [25]. Fin ray samples were subsampled to provide a small part of fin tissue for genetic analysis (see Tringali, this issue) and muscle tissue for stable isotope analysis [23]. Sex was determined by visual examination of the vent region and a gonad biopsy was collected using a flexible plastic catheter attached to a hand-operated vacuum pump. Fish were tagged internally with a PIT (passive integrated transponder; Biomark, Inc., Merck Animal Health, Boise, ID, USA) tag injected into the dorsal musculature just below the juncture of the spinous and soft dorsal fins and externally with a cattle tag clipped into the base of the posterior part of the anal fin. Finally, an acoustic transmitter tag was implanted into the abdominal region by making a small incision anterior and dorsal of the vent, inserting the tag into the peritoneal cavity, and closing the wound with 3 to 4 surgical staples or interrupted sutures. After surgery, fish were released at the site of capture using descending devices to ensure released fish descended rapidly. From fall 2010 through spring 2013, 45 individual goliath groupers were captured and tagged via these methods.
Additionally, in 2013 we tested an in situ method of having an experienced diver externally attach acoustic tags to each fish using a speargun. A stainless-steel T-bar anchor was attached to each of five acoustic tags with 136 kg test monofilament. Tags were mounted to a specially modified spear tip designed to implant the anchor about 10 cm into the dorsal musculature when shot from a posterior position. At impact, the T-bar anchor would release from the spear, allowing the fish to swim away and the diver to collect the spear for further tagging. Five individuals were tagged at one active spawning aggregation site in August 2013 using this method. Size and sex information was not available for these five individuals due to the tagging method.

2.2. Acoustic Tracking and Monitoring

We deployed Innovasea VR2W 69 kHz receivers to detect tagged fish at suspected spawning aggregation sites. Receivers were mounted to a 3/8″ (9.5 mm) diameter stainless cable that was anchored to the bottom (Figure 1). From January 2011 to July 2015, we deployed single acoustic receivers at 14 unique sites located offshore of Palm Beach and Martin counties in southeastern Florida where we suspected spawning may occur. Two receivers were lost during the study, either due to structural failure of the mount or theft. These losses occurred before we could recover data from the receivers, so these sites were not included in any analyses. Sites monitored were high relief natural reefs (n = 6) or artificial reefs (n = 8) between 10 to 40 m depth, where local fishers or divers had reported the presence of goliath groupers. Receiver-monitored sites were visited twice annually in the spring and fall to download data, replace batteries (once annually during the fall), and to check the integrity of the mooring system.
In addition to our monitored sites, we also received detection data from receivers maintained by other members of the FACT Network [30]. At present, FACT Network members maintain receivers at over 1000 sites along more than 1000 km of the Atlantic coast from Ossabaw Sound, Georgia (31°52′ N), to Riley’s Hump in the Dry Tortugas National Park (24°30′ N), in addition to sites in the Gulf of Mexico, Bahamas, and US Virgin Islands. FACT Network receivers were deployed among coastal habitats from freshwater estuaries to marine waters of the adjacent continental shelf, including high relief natural and artificial reef sites preferred by goliath grouper [3,4,5].

2.3. Data Analysis

Detection data from our receivers were downloaded via the Innovasea VUE program (version 2.X) and output files were uploaded to the FACT Network data node [30]. Matched detection files containing all reported detections of our tagged fish from within the FACT Network array were downloaded into R for analysis [34]. To validate detection data, we applied a false-detection filter that removed any single detections not associated with a second detection at the same location within one hour [35]. From the validated detection data, we calculated the number of days with at least one valid detection for each tagged fish, hereafter “detection days” (DD). Tagged fish were sometimes detected at more than one site on a given day, in which case DD was equal to the sum of sites with valid detections per 24 h. Thus, a tagged fish that moved between sites on the same day could have a DD > 1, while a fish that was detected only at a single site would have a DD = 1 for a given day and a fish with no detections would be assigned a DD = 0.
To maintain a consistent detection probability for the analysis of FSA fidelity and aggregation behaviors, we separated the validated detection data into two groups: data collected between 1 January 2011 and 31 December 2014, encompassing the period when we had receivers deployed at FSA sites; and data collected after 1 January 2015. Our monitoring efforts of the goliath grouper FSA sites concluded in July 2015; thus, data collected after July 2015 did not have the same probability of detecting tagged goliath grouper at FSAs compared to the dataset collected earlier. Detection data collected between January 2015 through July 2020 were used for analysis of long-range movements and catchment area, while the validated detection data collected during the 2011–2014 spawning seasons were also used to calculate goliath grouper site fidelity to FSA sites. During the study period, we confirmed spawning activity at six of the FSA sites that we monitored; however, we were unable to confirm that one of the three tagging sites (“Gulfland”) functioned as a spawning site [5]. During the initial analysis of the detection data, we noticed that some fish visited multiple spawning aggregation sites within a single spawning season, so we defined FSA site fidelity as the validated detection of a tagged goliath grouper at any one of the six sites where we confirmed spawning occurred [5]. These six sites were located in close proximity to one another, and we detected tagged goliath grouper moving between sites, thus we defined site fidelity based on tagged individuals returning to the broader FSA area rather than to a specific FSA site. We defined the spawning season as extending from 1 July through 31 October each year in order to capture information on movements related to peak spawning that occurs during the August through October new moons, as well as pre-spawning movements that correlated with the July full moons [5]. We also determined the date of arrival for each tagged fish detected at one of the six spawning sites for each year from 2011–2014.
Estimates of cumulative and maximum distance moved were calculated to quantify goliath grouper movement behavior. Cumulative distance moved was defined as the sum of distances between all sites with sequential detections for monthly and yearly periods. Maximum distance moved was defined as the maximum single distance between all sites with valid detections during a given period. In both cases, these metrics underestimate the actual distance moved by individuals as long as fish deviate from linear paths during movements between sites. We tested for differences in spawning site fidelity, number of spawning sites visited each year, arrival date to spawning aggregation sites, and movements (cumulative and maximum distance) based on fish size and sex with simple linear regressions and t-tests, respectively. Fish size was based on the measured total length (TL cm) at the time of capture, and estimated for subsequent years for each individual using a growth curve generated from the von Bertalanffy growth function,
Lt = L [1 − e^(−K(t − t0))]
where L is the asymptotic length (222.1 cm); t0 is the theoretical age at a length of zero (0.67); and K is the growth parameter (0.0937), as reported in the most recently completed stock assessment for goliath grouper [22]. Fish sex was assigned based on visual examination of the gonopore at the time of tagging and later confirmed or corrected by the results of histological examination of gonad samples [25].
We estimated the relative likelihood of detecting a goliath grouper at a given latitude across each year of the study using kernel density estimation (KDE). As above, we split each calendar year into spawning months (July to October) and non-spawning months (November to June). Then we used the computed DD data to develop annual probability density functions of tagged fish locations for spawning versus non-spawning months. KDEs were calculated with a gaussian smoothing kernel, the bandwidth set to equal the standard deviation of the smoothing kernel and visualized using the tidyverse and ggplot2 packages for R [36,37].

3. Results

3.1. Fish Capture and Tagging

Between 4 September 2010 and 6 September 2013, we tagged 50 goliath groupers with acoustic transmitter tags at three sites suspected of being aggregation sites: Zion Train (artificial reef, n = 30), Three Holes (natural reef, n = 10), and Gulfland (artificial reef, n = 10; Figure 2). The bulk of our tagging effort occurred in fall of 2010 when we captured and tagged 38 fish (Table S1). Two fish were captured and tagged in May 2011 and five additional fish in September 2012. The final five fish were tagged externally by an experienced spearfisher (Capt. D. Demaria) at the Three Holes site on 6 September 2013.
Tagged goliath grouper ranged in size from 104 to 205 cm TL (x= 160.9 ± 3.7). Sex was determined for 43 fish, including 22 females, 18 males, and 3 juveniles (Table S1). Sex could not be determined for two of the fish tagged onboard or for the five fish tagged in situ. These seven individuals were excluded from analyses that compared movement patterns by sex. We confirmed spawning occurred at two of the three sites where we tagged fish—Zion Train and Three Holes—during the study period by one of the following: collection of hydrated oocytes or post-ovulatory follicles from fish captured on-site, collection of fertilized goliath grouper eggs, recording of spawning sounds, and/or observations of aggregations during evening dives [5,38]. Despite detecting tagged goliath grouper at the Gulfland site throughout the study period, we did not collect any other evidence of spawning at this site.

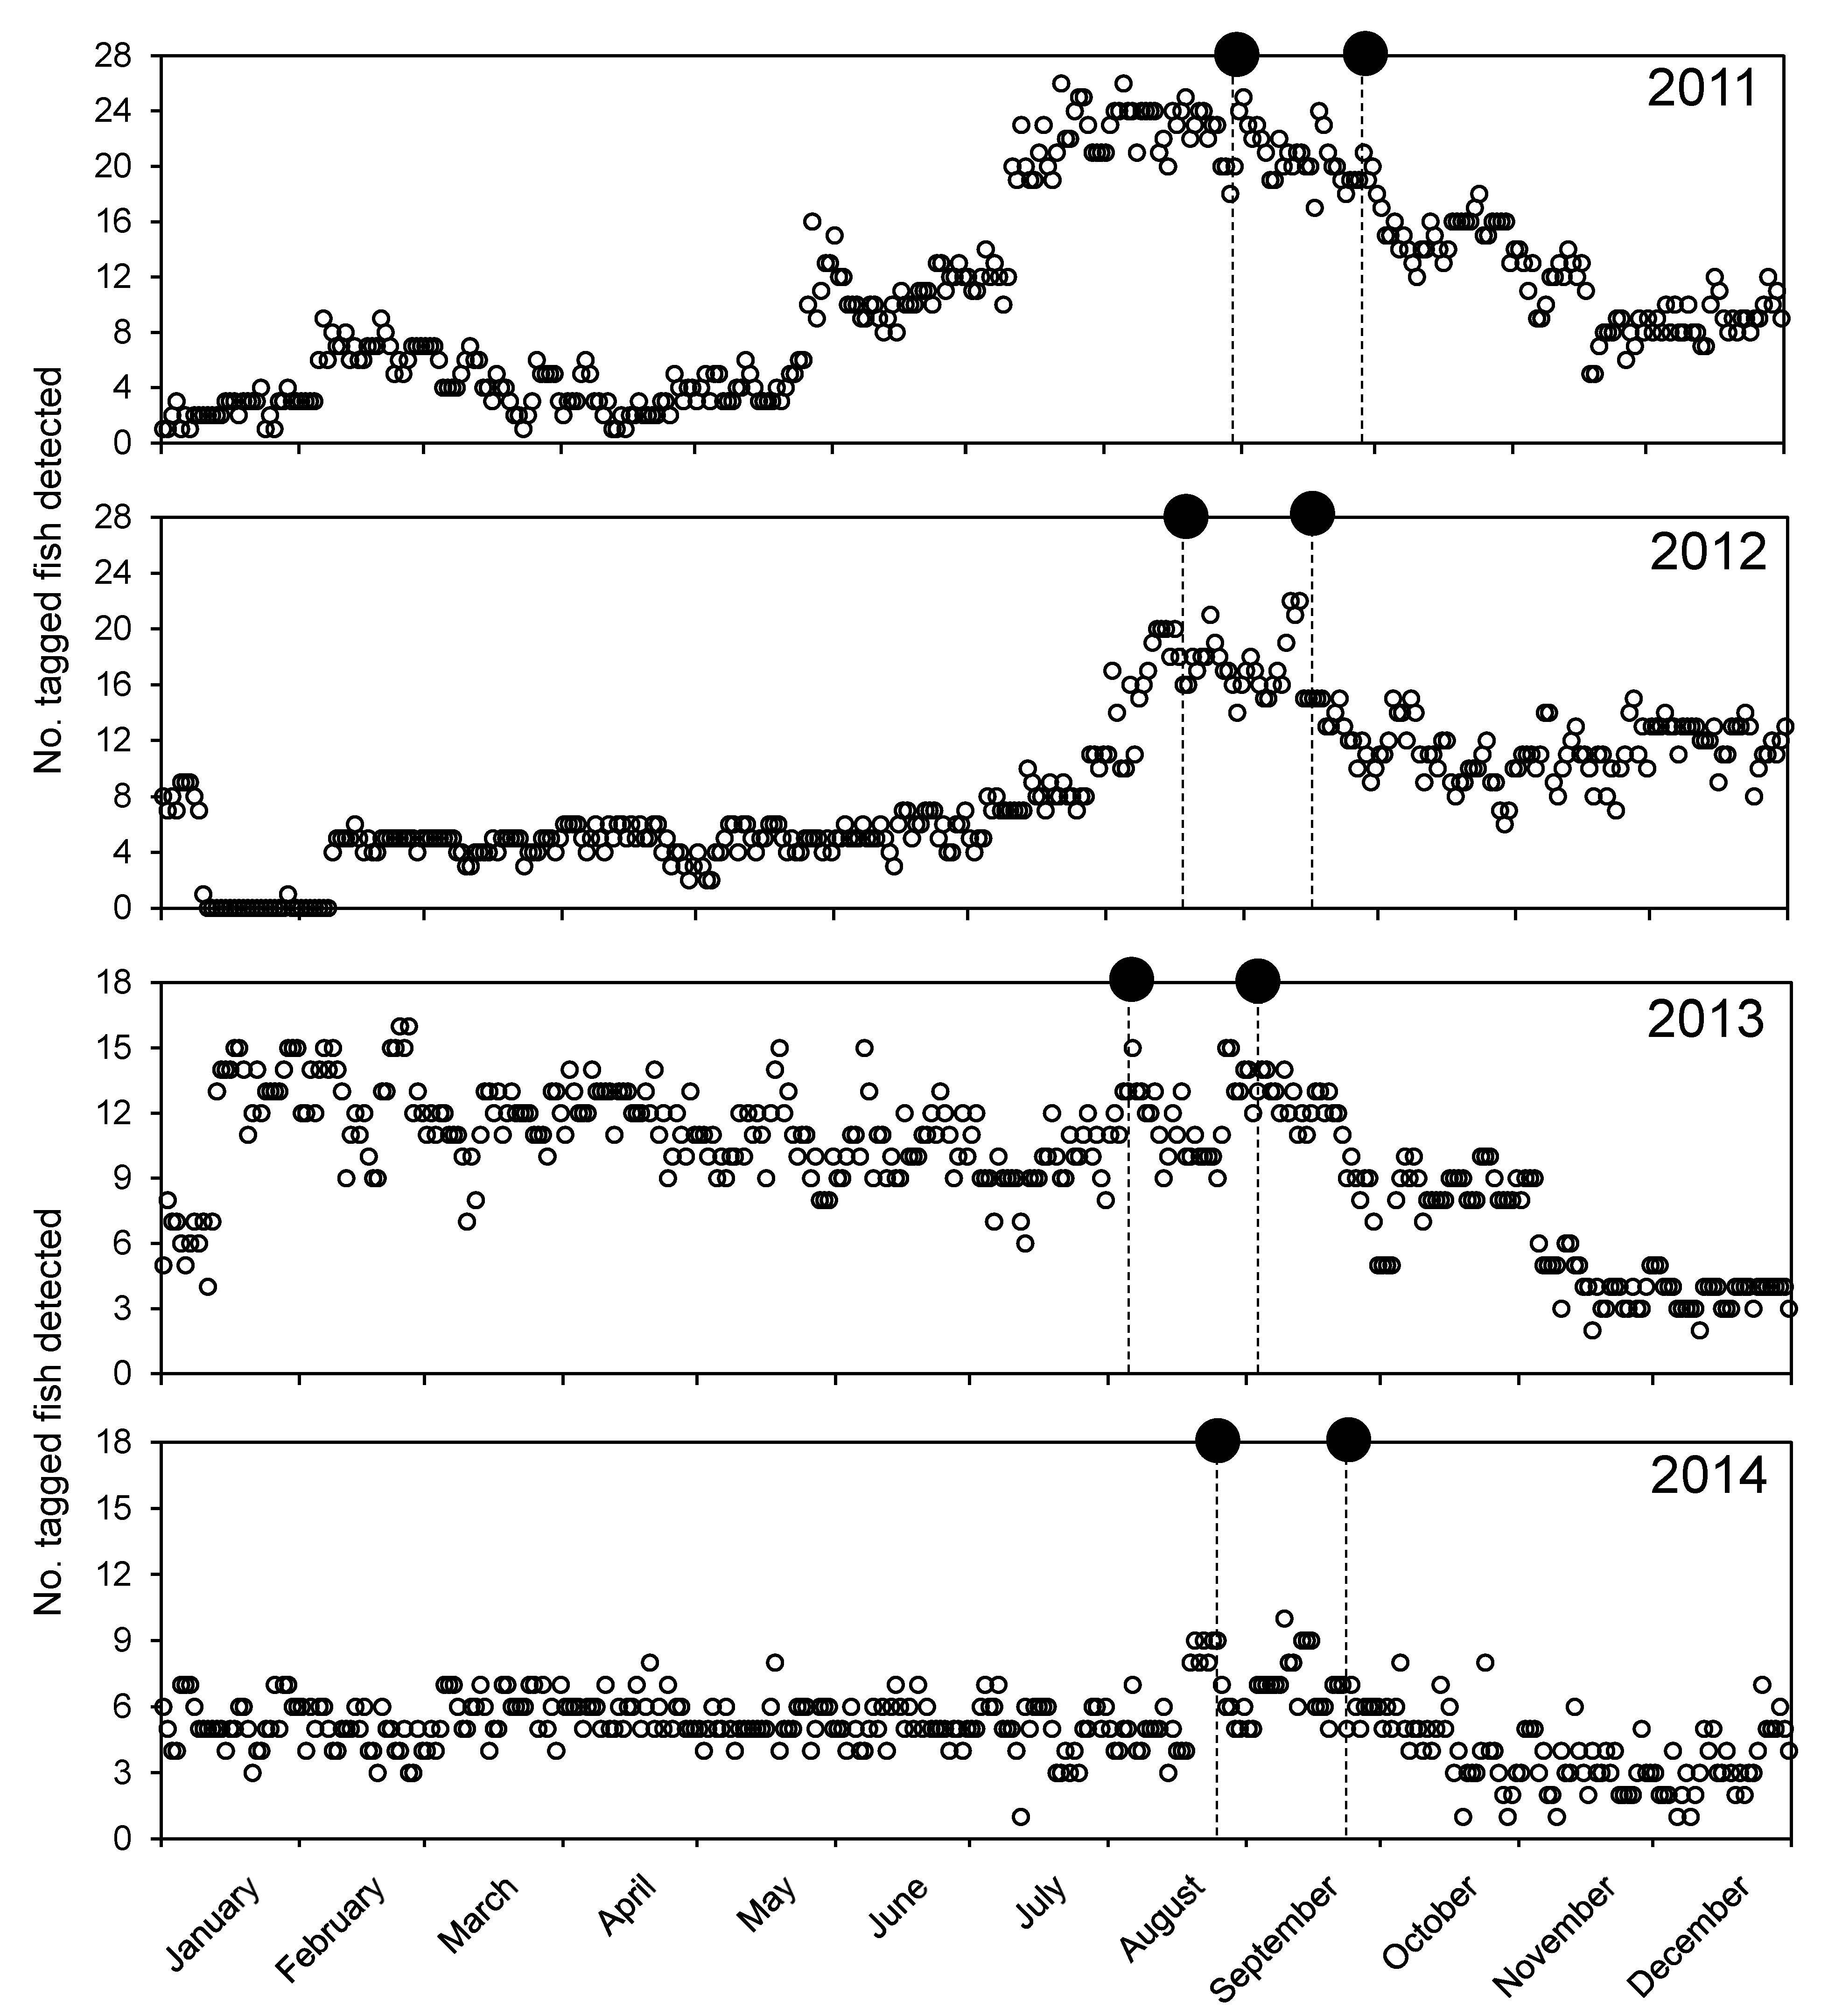
3.2. General Detection Patterns

The validated detection dataset contained a total of 7,084,867 detections from all 50 tagged goliath groupers at 153 unique sites, including the 12 sites monitored by us, 139 sites monitored by FACT Network members, and a glider that detected tagged goliath groupers in 2017 and 2018 (see Supplementary Figure S1). On average tagged goliath grouper were detected across 1160 ± 105 days (days at large, DAL; Table S1). Both the total number of detections and the proportion of tagged goliath groupers detected declined each year of the study: in 2011, 36 of the 40 tagged fish (90.0%) were detected within the array; in 2012, 39 of the 45 tagged fish (86.7%) were detected in the array; in 2013, 38 of the 50 tagged fish (76.0%) were detected in the array; and in 2014 only 18 of the 50 tagged fish (36.0%) were detected in the array (see Supplementary Figure S2). By 2018, when the first tags deployed started to expire, four of the 50 (8.0%) tagged goliath groupers were detected and just one tagged fish was detected in 2020, the final year when tags may have still been active. Overall, 95.5% of all detections were recorded from 2010 through 2014, the period when we were monitoring the FSA sites, with 4.5% of the total detections recorded from 2015–2020. Because the observed tag attrition rate was quite rapid during parts of the study, we conducted a post hoc analysis to determine if the rate of tag loss exceeded the expected attrition rate due to natural mortality, see Appendix A.
A seasonal pattern in the number of tagged goliath grouper detected daily was evident in both 2011 and 2012, and less obvious in 2013 and 2014 (Figure 3). During the first two years of the study, the number of fish detected each day began to increase in early June and peaked in 2011 on 5 August (26 fish detected), and on 12 September (22 fish detected) in 2012. In 2013, the highest number of goliath grouper detected during a single day occurred much earlier in the year, on 25 February (16 fish detected), followed by a second peak later in the year on 28 August (15 fish detected). In 2014 the maximum number of fish detected daily occurred on 9 September (10 fish detected), on the same day as the September new moon.
We examined patterns in detections of tagged goliath grouper with the calculated DD data, where first we summed the number of sites where each fish was detected each month of the study from 2011 to 2014 (Figure 4). This value varied between zero, when a fish was not detected during a given month (multiple fish) to a maximum of 12 sites for fish #045 (189 cm TL, female) in August 2011. The number of fish detected each month varied both seasonally and across years throughout the study period, so we limited the dataset to only fish that were detected each month; thus, the sites per month per fish parameter had a minimum value of 1 (fish was only detected at a single site during a given month). During most of the year, tagged fish remained at one or a few nearby sites, but on average fish were detected at more sites during peak spawning in August and September. From 2011 to 2014, tagged goliath grouper were detected at 1.6 ± 0.05 sites per month, (range = 1, 2.58). We also determined how many unique sites were visited annually by each tagged goliath grouper, again using the calculated DD data, limited to the 2011—2014 period, and we found it did not vary significantly across years (d.f. = 130, F = 2.67, p = 0.37). When expanded to include the entire time range of DDs for each tagged fish, on average tagged goliath groupers were detected at 16.2 (±2.5) unique sites per fish. Again, this varied across individuals and ranged from one fish that was only detected at a single site with valid detections, to one individual that was detected at 80 unique sites, fish #439, a 177 cm TL female.
In general, tagged goliath grouper did not move very often: over 90% of all detections occurred at the same location as the previous detection. When tagged fish did move, they did not move far: 70.6% of all movements between sites were less than 5 km, while 85.9% of all movements were less than 10 km. However, tagged goliath grouper were also detected at sites spanning over 500 km of the Florida and Georgia coasts and, although rare at just 1.4% of all recorded movements, we documented multiple movements of more than 100 km between sites. A few of these long-distance movements by tagged goliath groupers were particularly noteworthy:
(1)
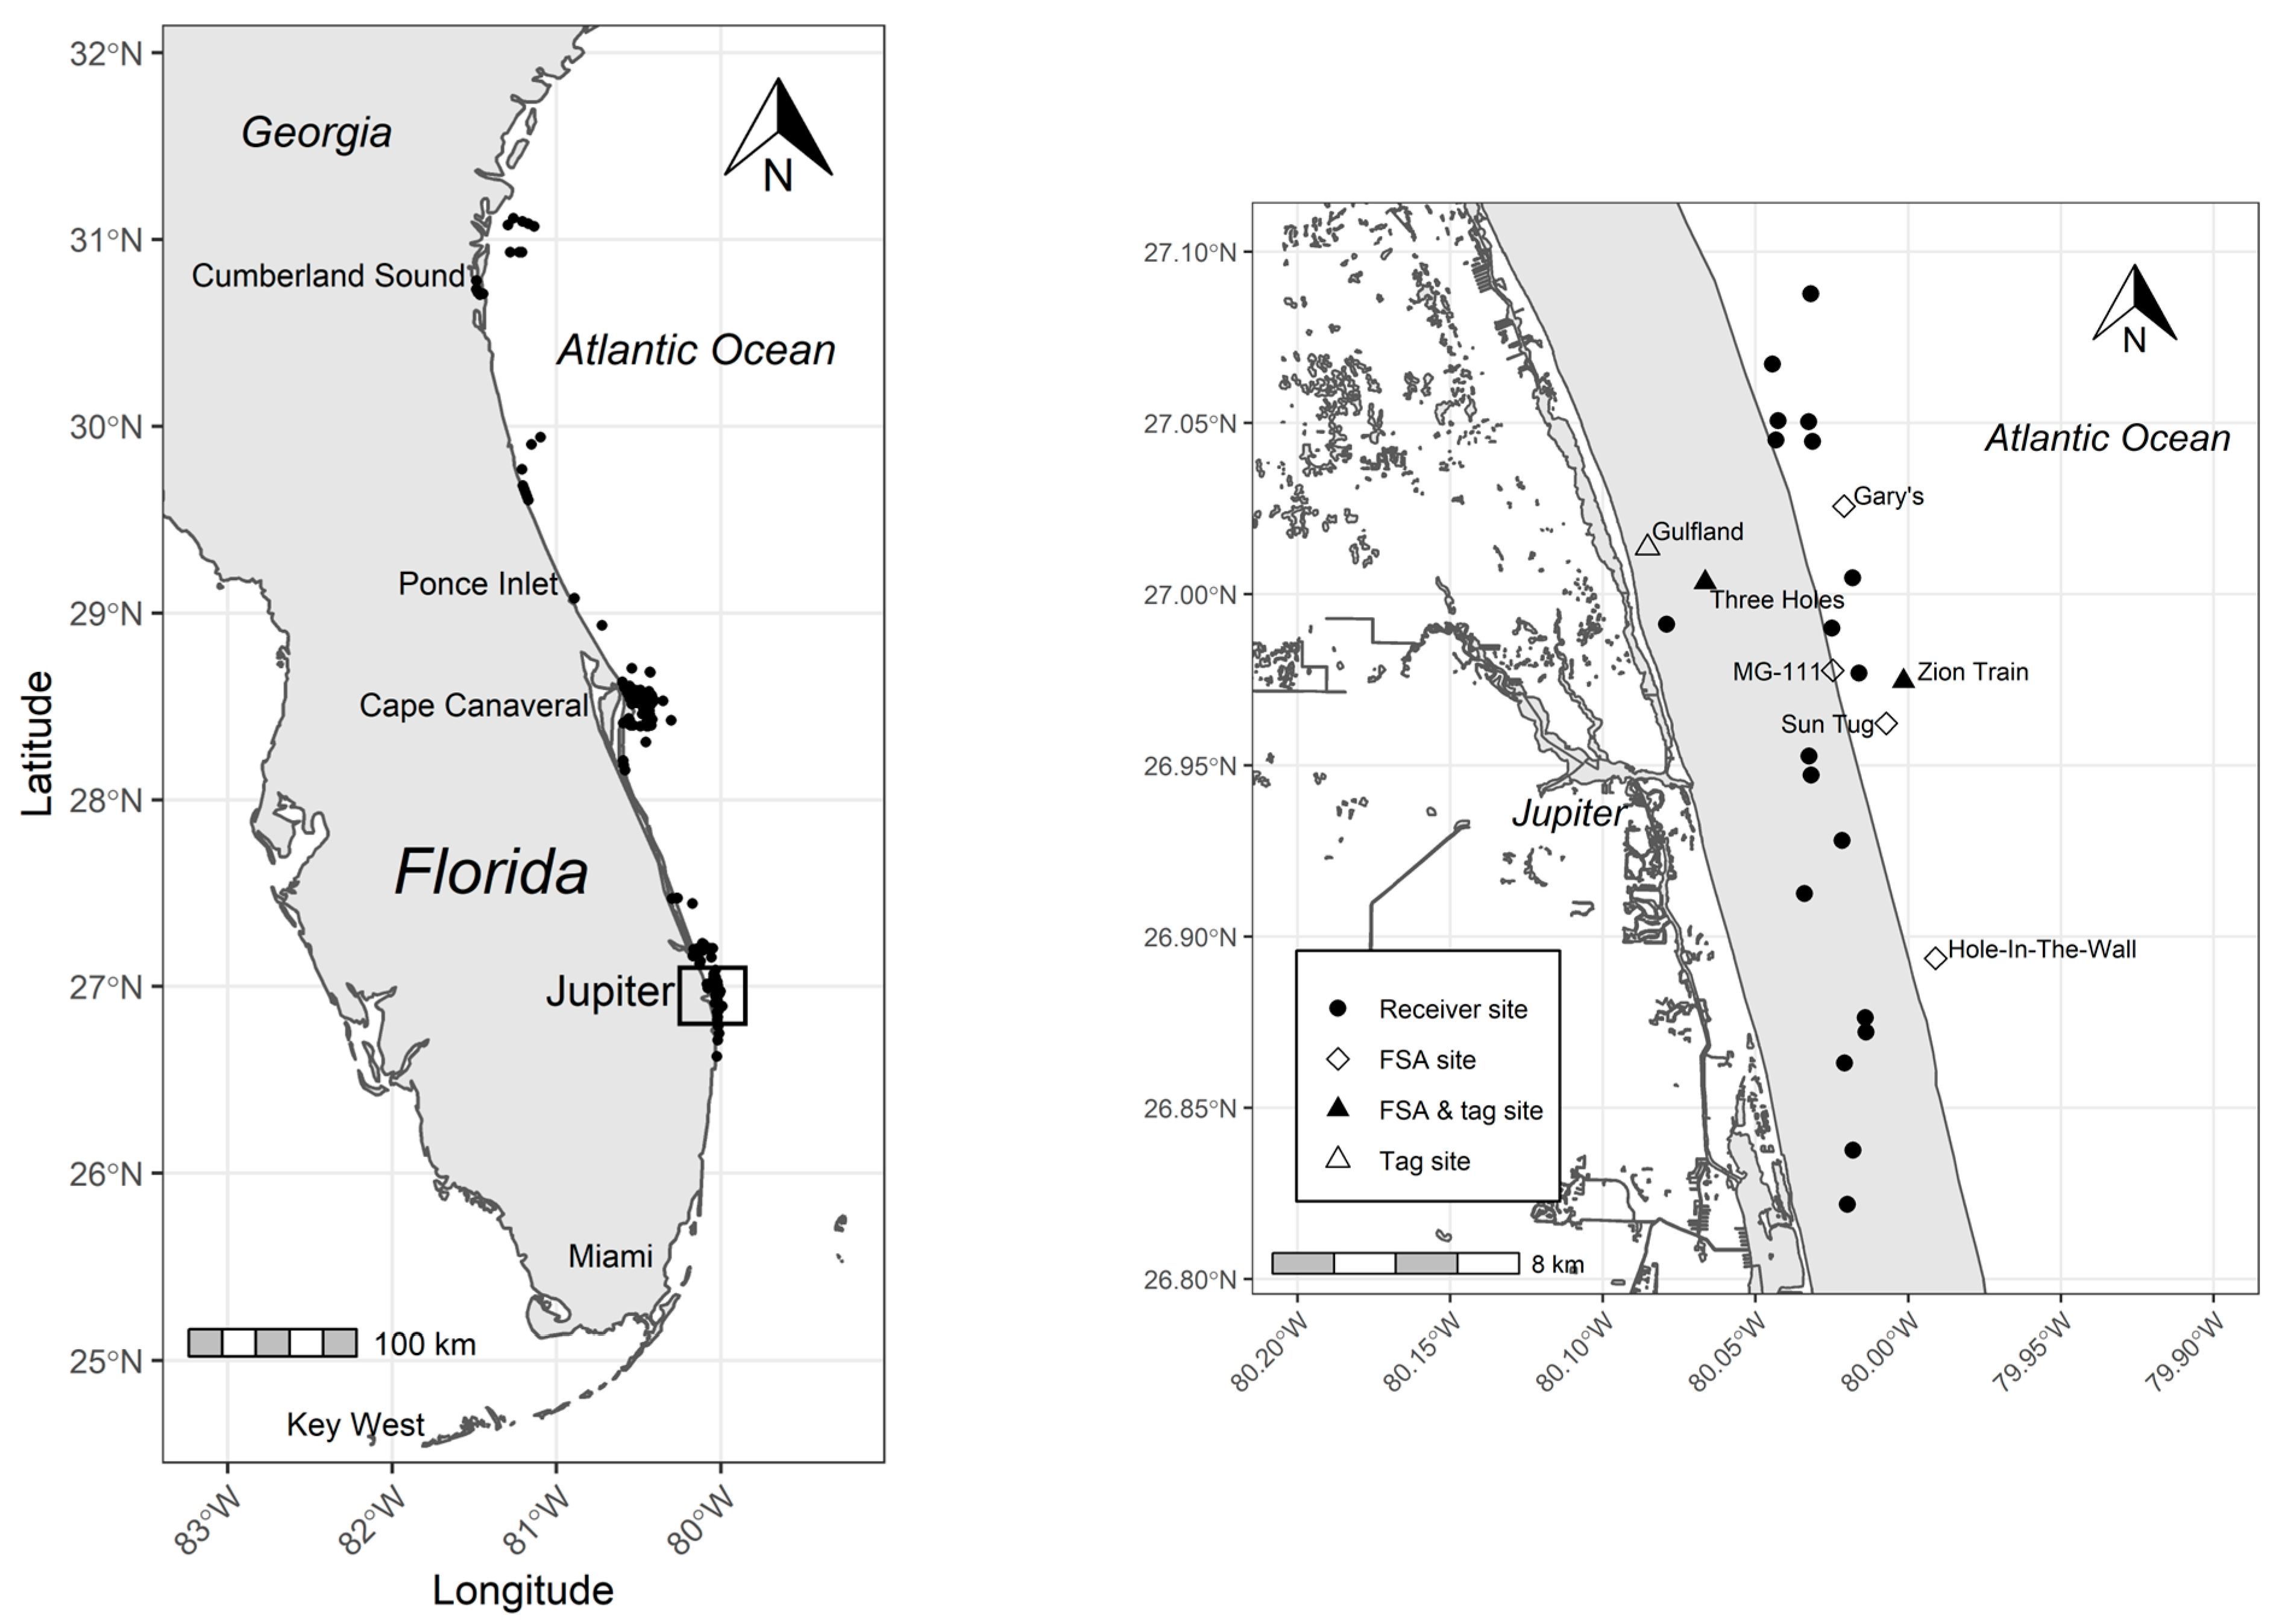
Fish #058 (180 cm TL, female): July 2011—moved 222 km between Ponce Inlet and an artificial reef near the St. Lucie Inlet in 9 days (~25 km d−1);
(2)
Fish #060 (186 cm TL, female): (a) July 2011—moved 252 km between Ponce Inlet and a natural reef site near the Jupiter Inlet in 22 days (~11.5 km d−1); (b) August 2012—moved 438 km between a site inside Cumberland Sound (near the Florida—Georgia state border) and the spawning site MG-111 in 10 days (~44 km d−1);
(3)
Fish #417 (194 cm TL, female): (a) August 2013—moved 175 km between Cape Canaveral and the Sun Tug spawning site over 12 days (~14.5 km d−1); (b) late July to early August 2014—moved 184 km between Cape Canaveral and the Sun Tug spawning site over 13 days (~14 km d−1); (c) late July to early August 2015 moved 419 km between Cumberland Sound to sites near the St Lucie Inlet in 15 days (~28 km d−1); (d) August 2016—moved 424 km from Cumberland Sound to an artificial reef near the St. Lucie Inlet over 13 days (~32.6 km d−1); (e) July to August 2017—moved 430 km between Cumberland Sound and the St Lucie Inlet in 21 days (~20.4 km d−1). Note that although we were no longer monitoring the six focal FSA sites after July 2015 and thus cannot confirm that fish #417 returned to one of these FSAs, this individual was detected at other sites located within 10 km of confirmed FSA sites during both the 2015 and 2016 spawning seasons.
Temporal patterns of movement by tagged goliath groupers were consistent across all years of the study and showed that tagged fish were relatively sedentary during non-spawning months (December to June) and moved more during spawning months (July to October; Figure 4). Summed cumulative movement distances for all tagged fish across each month for the 2011–2014 period showed that, on average, tagged goliath groupers moved 6.28 ± 0.58 km per month. Tagged fish moved most during August in 2011, 2012, and 2014; in 2013 tagged fish moved most during July. Monthly movements during August and September were elevated across all four years, while July, October, and November were the most variable months in terms of tagged fish movement. These movement data suggest that spawning may have occurred earlier in the year in 2011 and 2013 and later in the year in 2012 and 2014. Tagged fish also appeared to move more than average during February 2011 and March 2014—where they also were detected at more sites.

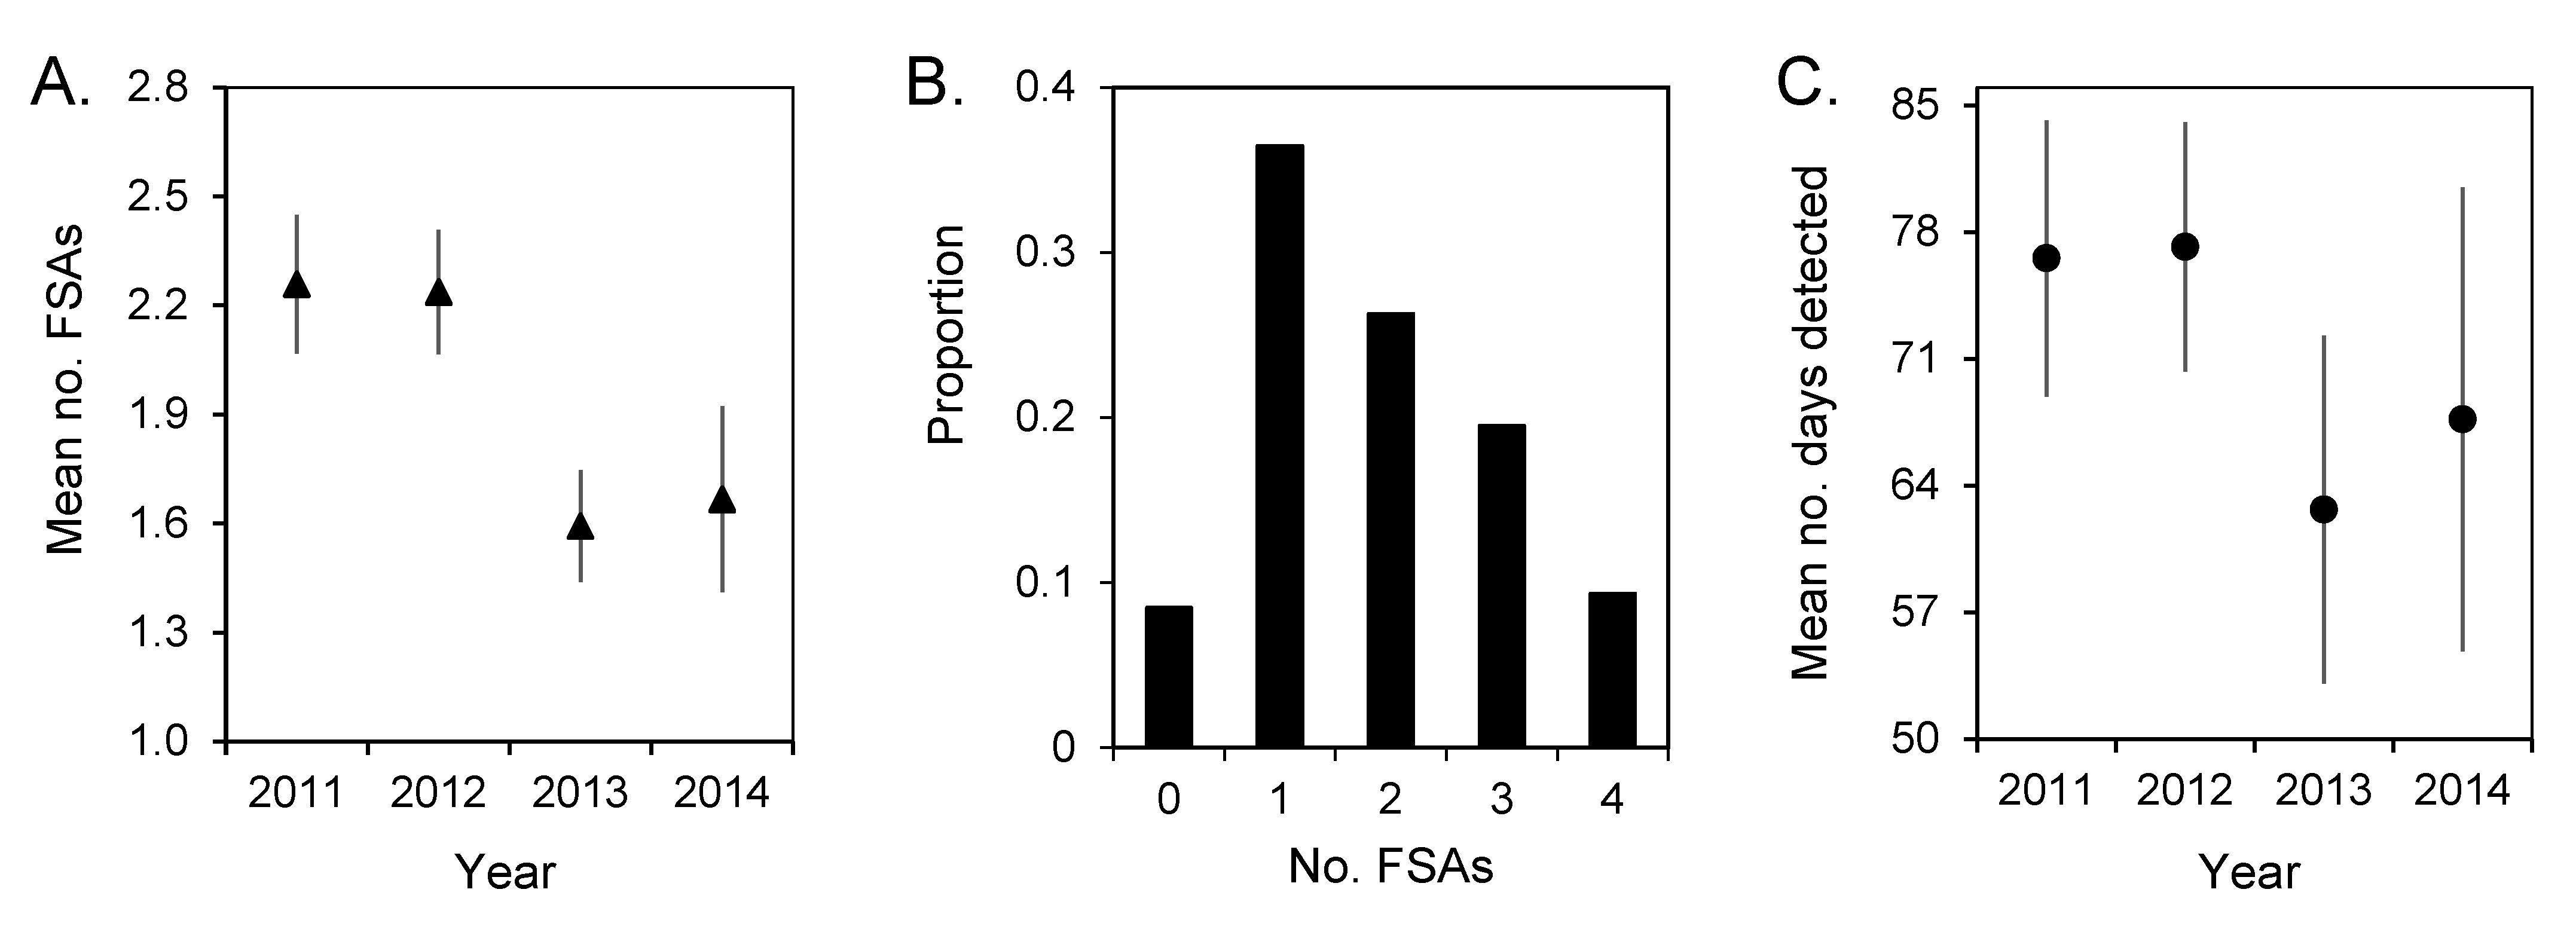
3.3. Spawning Site Fidelity

The number of tagged goliath groupers detected at FSA sites from July to October was generally high during the first four years of the study (2011–2014), ranging from 80.8% of tagged fish detected at one of the six confirmed FSA sites in 2013, to 94.1% of tagged fish in 2012 (Table 1). Overall, 46 of the 50 (92%) tagged goliath groupers were detected at an FSA site in subsequent years after tagging. On average, tagged fish were detected at 2.02 (±0.1) unique FSA sites over the course of the study period (Figure 5); however, this varied across the study period. Tagged fish visited more than 2.2 (±0.2) spawning sites, on average, in 2011 and 2012, which declined to 1.6 (±0.2) spawning sites in 2013 and 1.7 (±0.3) spawning sites in 2014. Most fish (36.4%) only visited a single FSA site during a given year, but we also detected multiple individuals (n = 10) that were detected at four FSA sites during a single year. However, the number of tagged goliath grouper that were detected at four FSA sites declined over time: only one tagged fish was detected at four FSA sites in 2013 and none were detected at four sites in 2014. During the spawning season from July to October, tagged fish were detected at FSA sites on average for 45.5 ± 3.5 days each year. The number of detection days at spawning sites was highest in 2011 at 64.0 ± 7.1 days but was between 37 to 42 days per spawning season for all other years.
The most frequently visited FSA site was Zion Train (ZT), which was also the site where we tagged the most fish and where divers observed the largest aggregations of goliath groupers each year (except for 2012, see below). In 2011, 28 of 38 (73.7%) tagged goliath groupers detected at an FSA site were detected at ZT; in 2012, 26 of 36 (72.2%) tagged fish were detected at ZT; in 2013, 14 of 26 tagged fish (53.8%) were detected at ZT; and in 2014, 5 of 14 tagged fish visited the ZT site (35.7%). Over all four years of the study, the most visited FSA site was ZT, followed by Three-Holes (TH), the MG-111 wreck (MG), the Sun Tug wreck (ST), Gary’s (GG), and Hole-in-the-Wall (HIW). The relative rank importance of the six focal FSA sites, in terms of the total number of tagged fish detected at each site annually, varied during the study (Table 2). In 2012 the MG site was the second most visited site of the six FSA sites that we monitored, and we also observed the largest aggregation of goliath grouper at the MG site in 2012, while in all other years, divers recorded the largest aggregation at the ZT site.

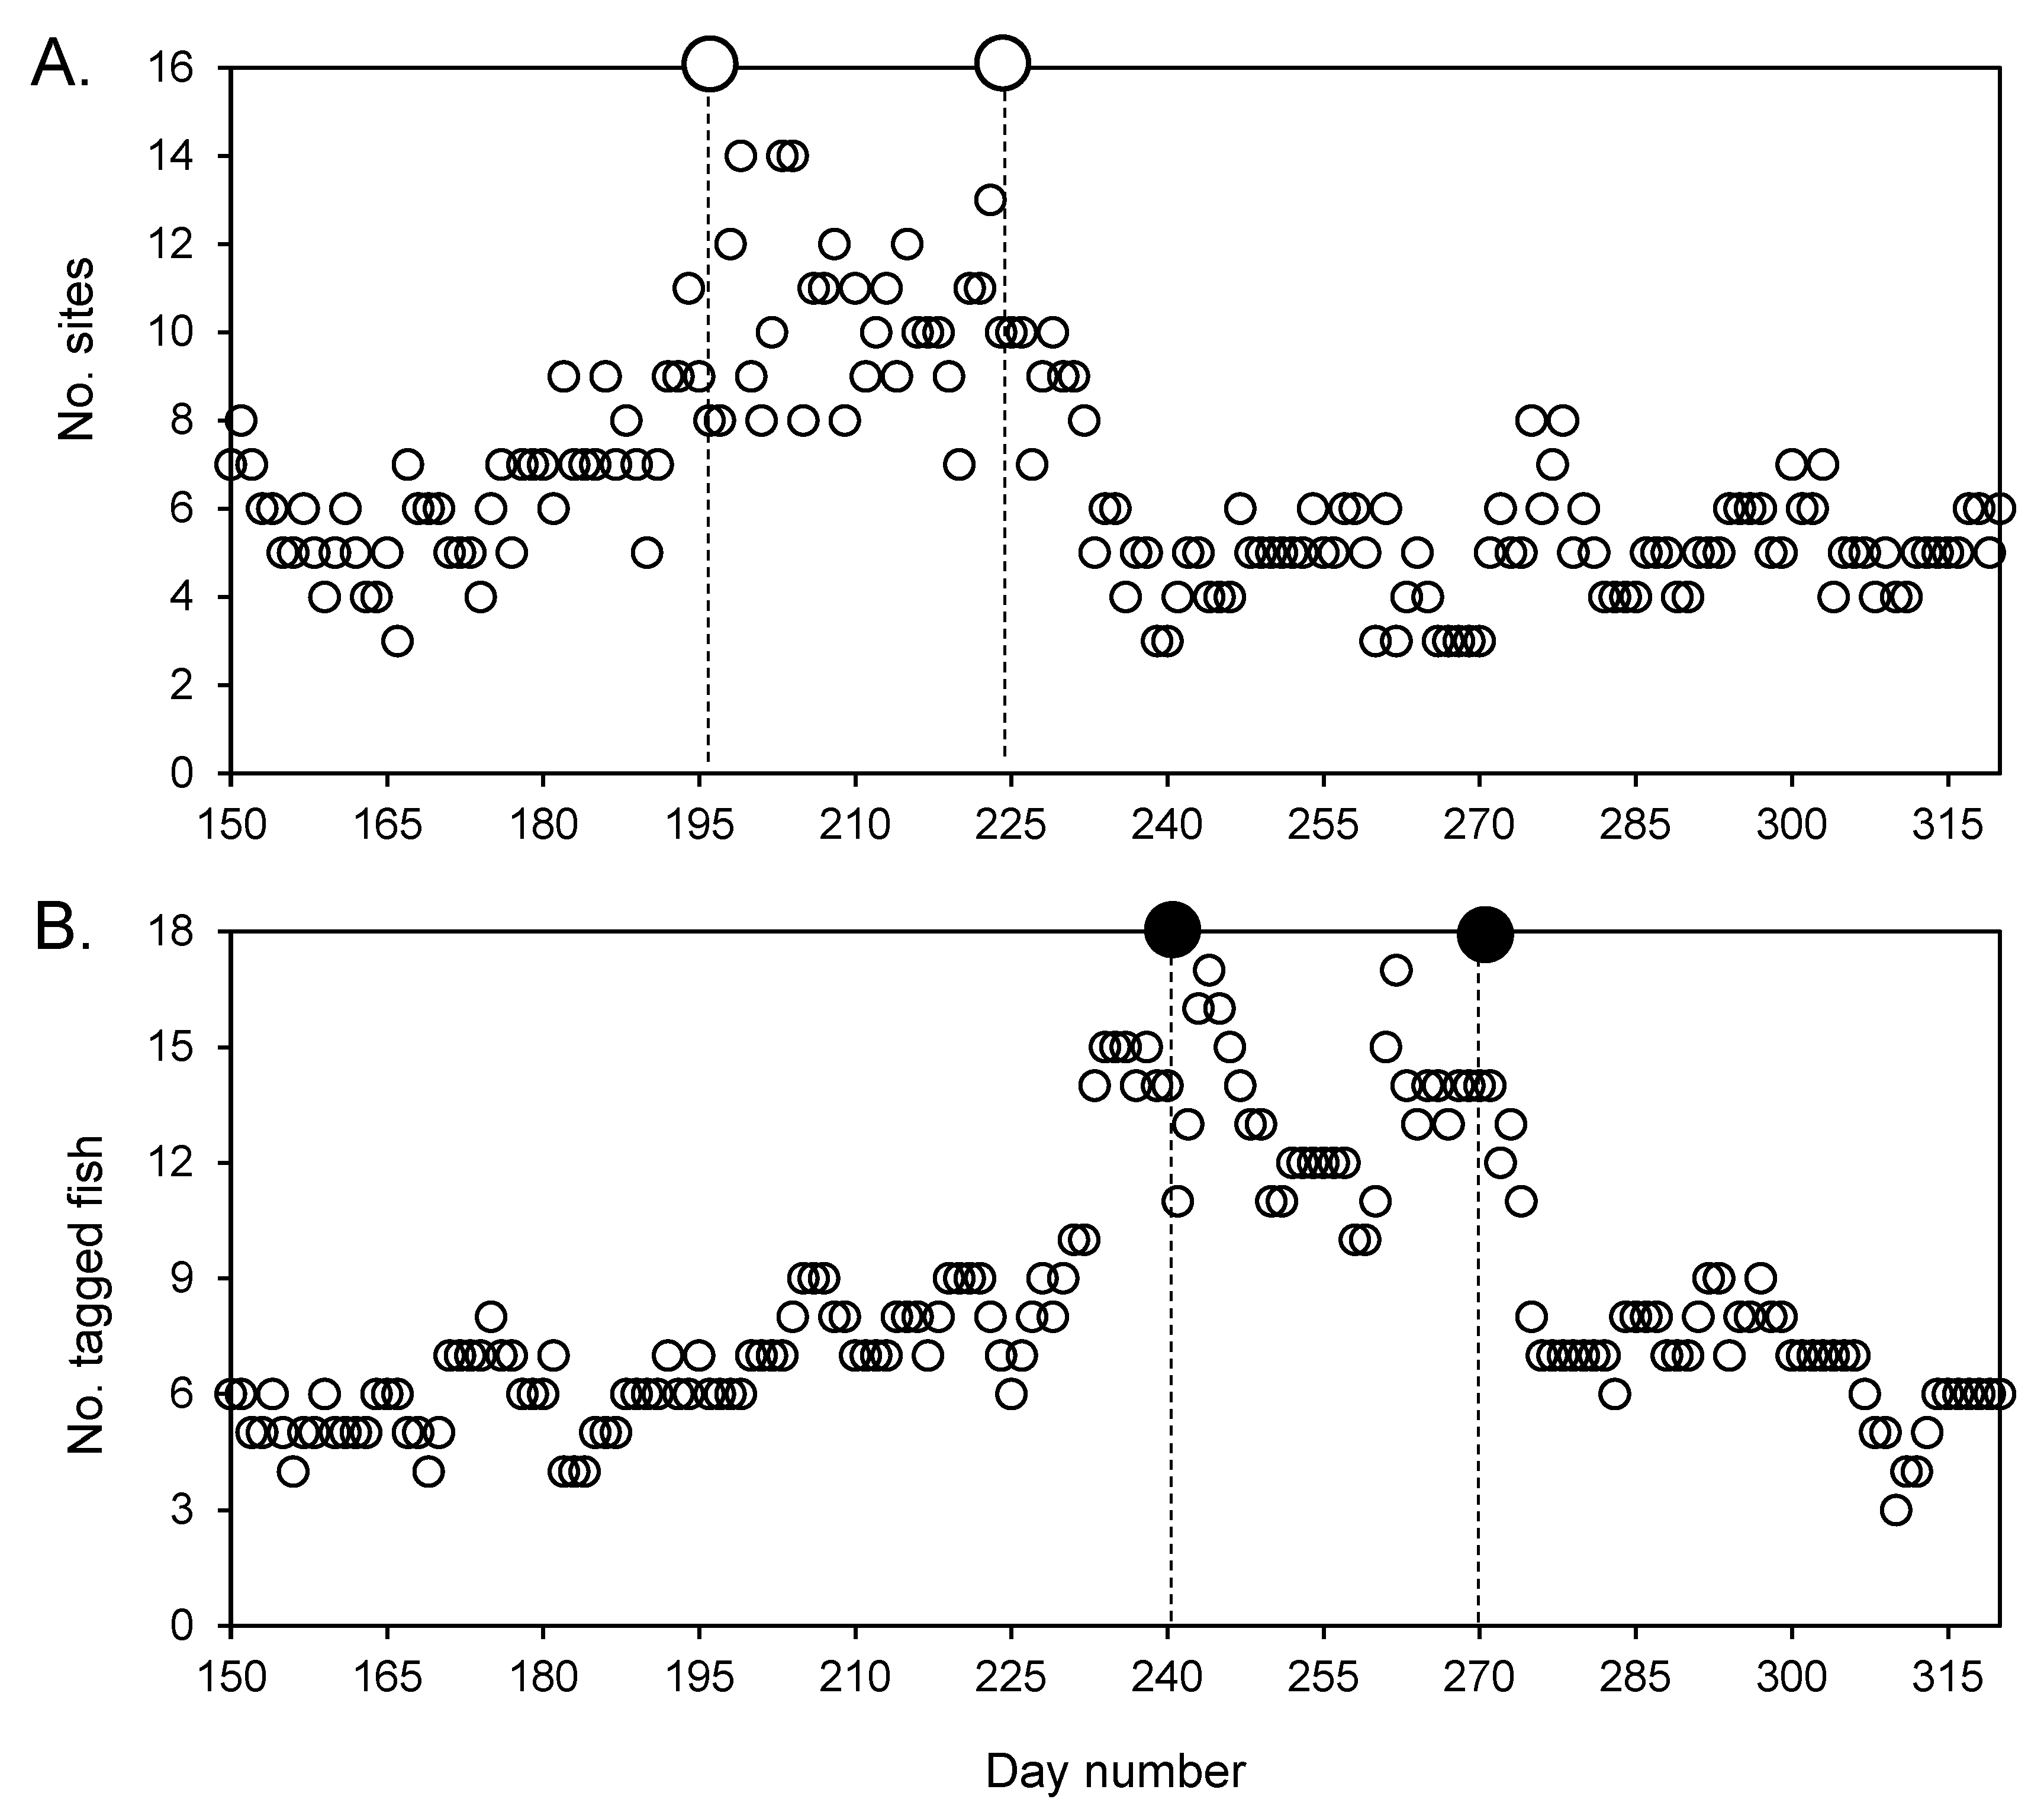
3.4. Aggregation Formation

Determining the arrival timing of tagged goliath grouper to FSA sites was complicated by the fact that some tagged fish were detected at FSA sites year-round. On average, 13.7 (±0.5) tagged goliath grouper were detected at one of the six monitored FSA sites during January to June each year from 2011 to 2013 (2011: 13.1 ± 1.5 tagged fish; 2012: 13.7 ± 0.4 tagged fish; 2013: 14.3 ± 0.5 tagged fish). The number of tagged goliath grouper detected at one of the six FSA sites from January to June in 2014 decreased to 6.3 (±0.8) compared to the previous three years. When estimating the mean date of arrival of tagged fish to spawning sites, we excluded any fish that were already present on 1 July. On average, tagged goliath grouper arrived at FSA sites during early August, with some tagged fish arriving as late as mid-October in 2012 and 2013 (Table 3).
To visualize aggregation formation by tagged goliath groupers, we plotted the number of sites where fish were detected from 30 May 2011 (day 150) to 16 November 2011 (day 330) and compared this to a plot of the number of tagged fish detected at the ZT site—the main spawning aggregation site by number in 2011 (Figure 6). The number of sites where a tagged goliath grouper was detected began to increase around the end of June (day #180), peaked on day #199 three days after the July full moon, then stayed high until after the August full moon (day #225) when it started to decline again. In contrast, the number of tagged fish detected at the ZT site began to increase around the August full moon, peaked on day #244 three days after the August new moon, and remained elevated until after the September new moon (day #270). A similar pattern of fish aggregating at the ZT spawning site was clearly detectable in 2012, somewhat evident in 2013, and not evident at all in 2014 due to the reduced number of tagged fish detected in the array (see Supplementary Figure S3). These data suggest a strong lunar component of spawning aggregation behavior, where movements peak around the July and August full moons and aggregation formation peaks around the August and September new moons.

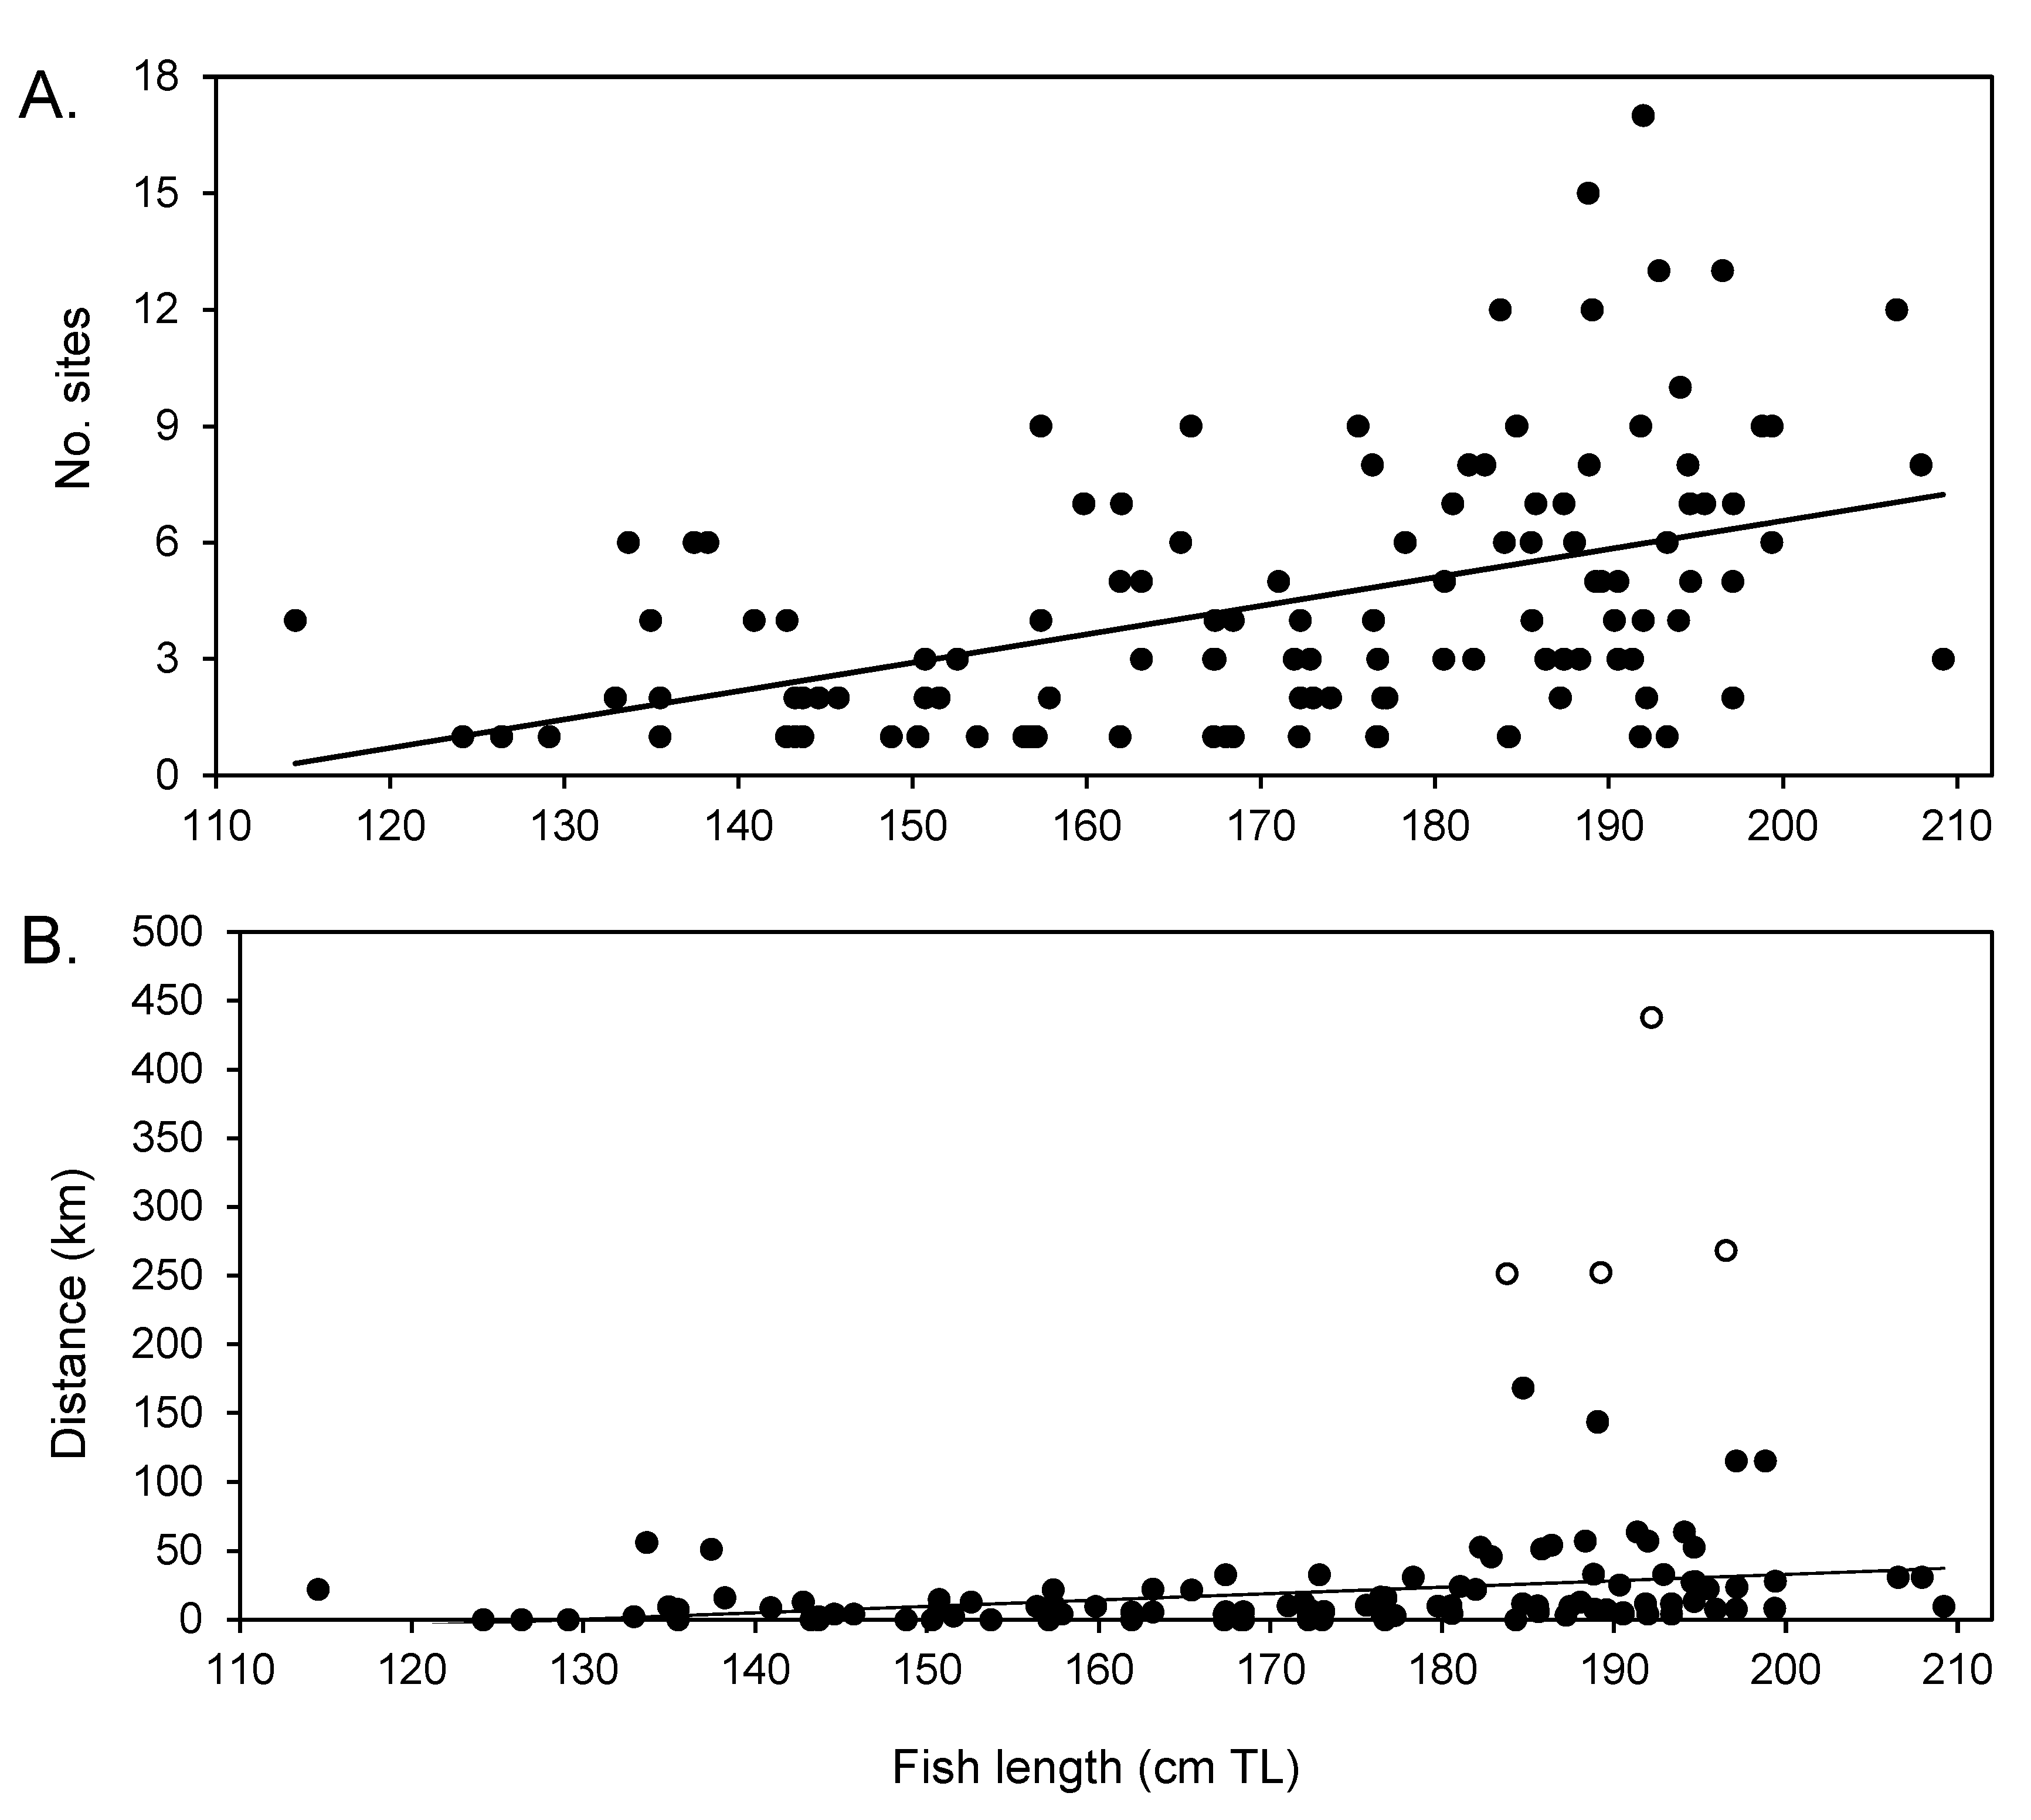
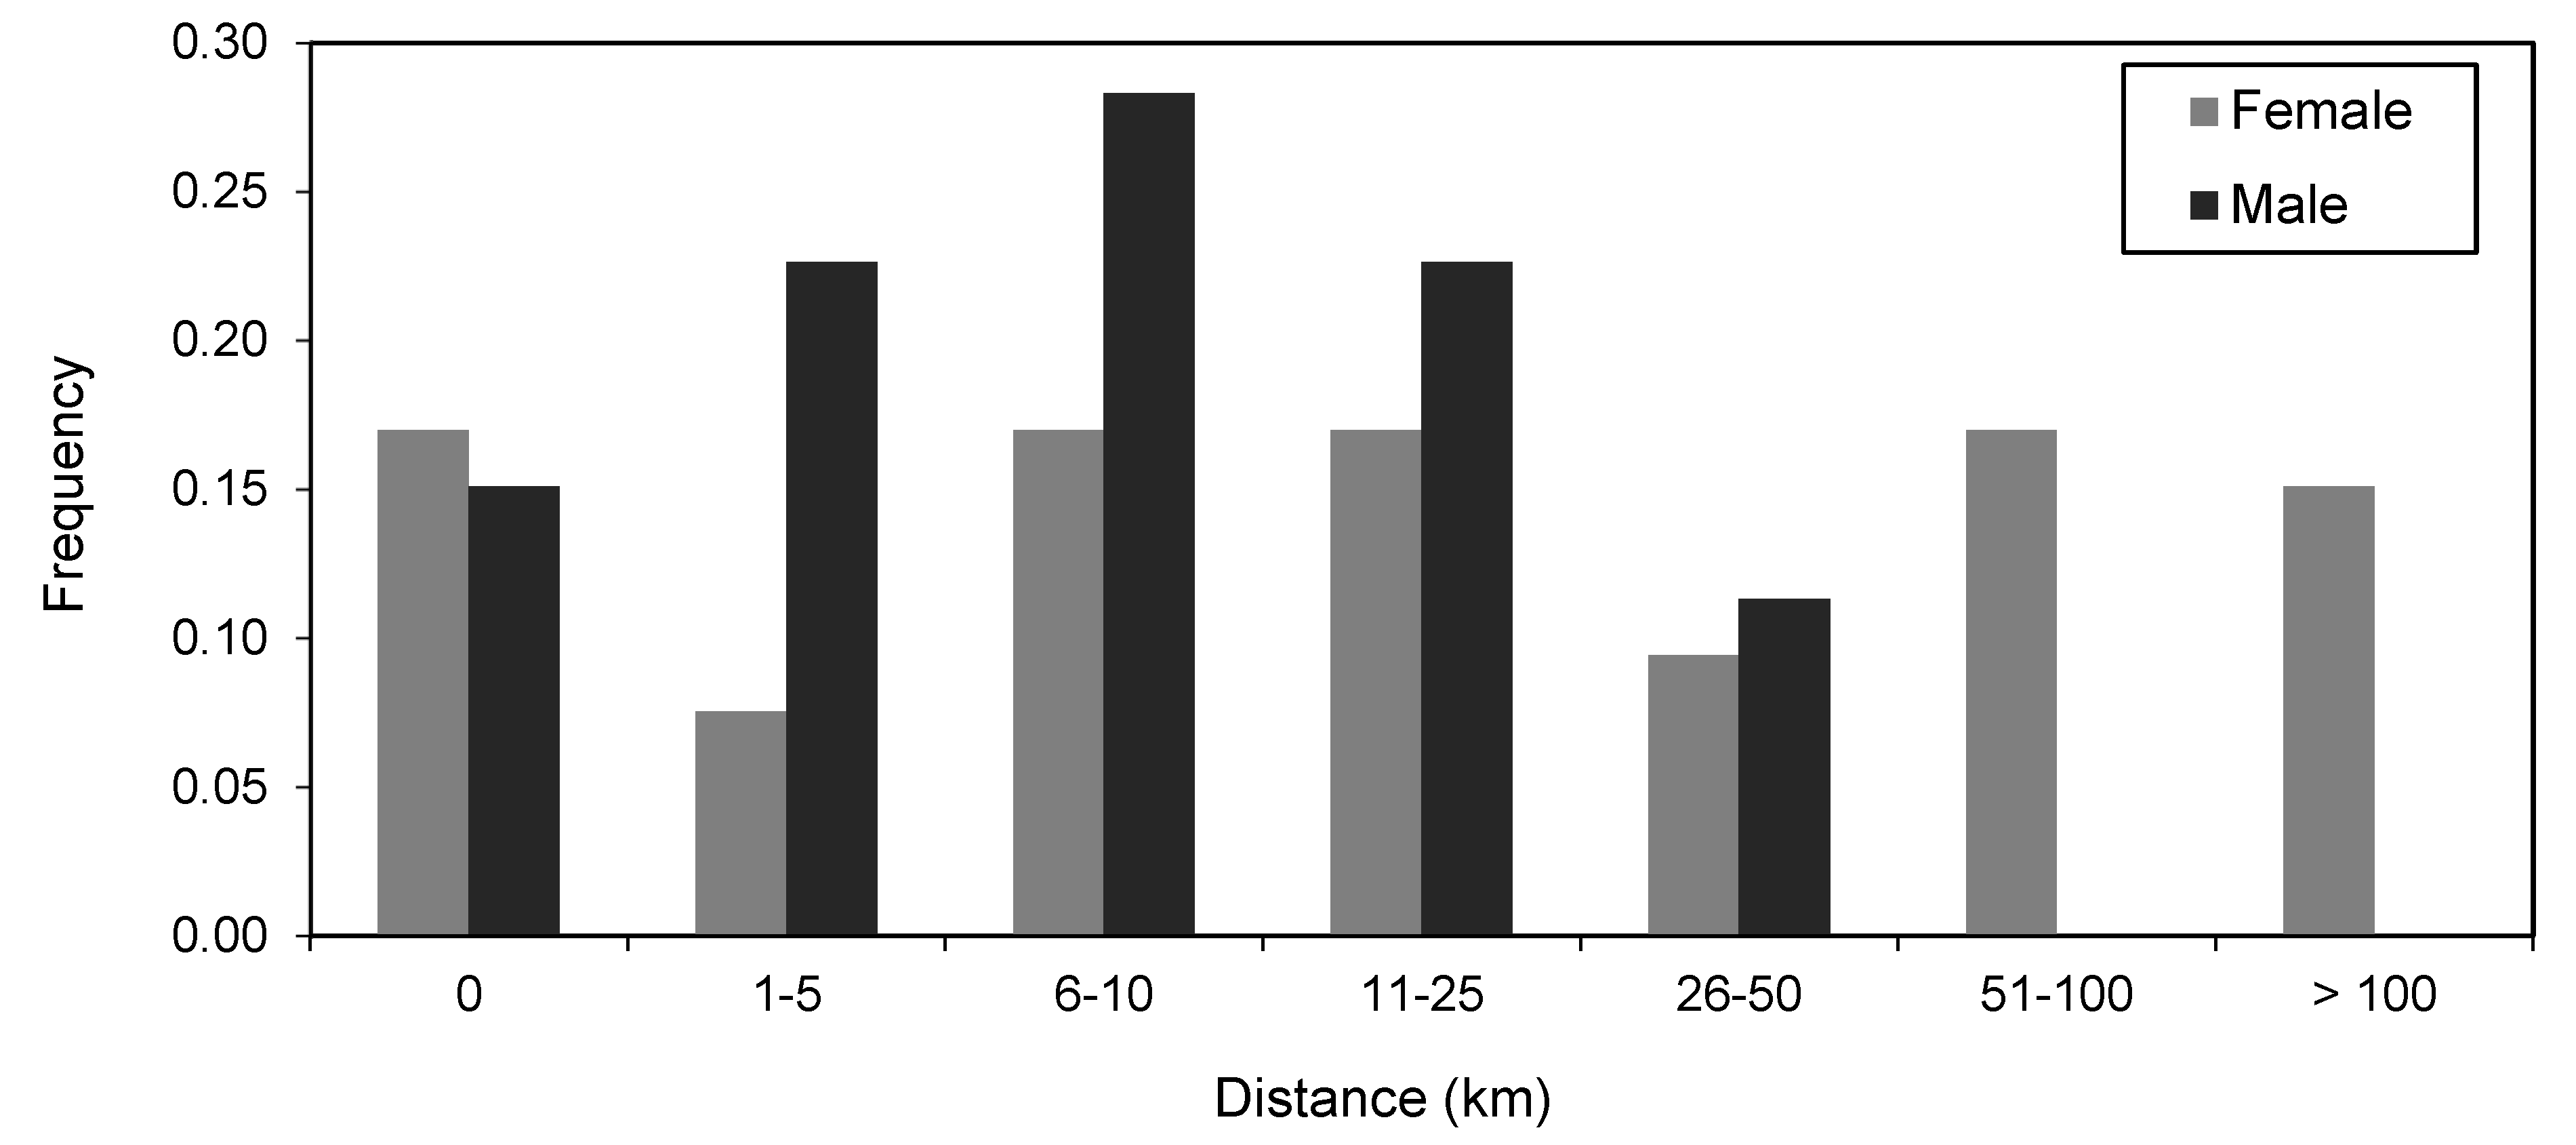
3.5. Size and Sex Differences in Movement Patterns

We analyzed the detection data to determine if any movement, residence, or date of arrival patterns could be attributed to either fish size or sex. In general, larger fish were detected at more sites and moved farther than smaller fish (Figure 7). Simple linear regressions performed on both metrics showed that both patterns were significant and positively related: number of stations visited, d.f. = 120, F = 31.4, p < 0.001; distance moved, d.f. = 114, F = 15.7, p < 0.001. The regression of minimum annual distance travelled, which was calculated as the straight-line distance between the furthest two sites with validated detections within a year, relative to total length was conducted after discarding four observations we considered outliers because they were more than three times the standard deviation from the mean (x = 29.3 km; S.D. = 59.9; Figure 7B). There was also a significant positive relationship between fish size and the number of FSA sites visited annually (d.f. = 104, F = 7.00, p = 0.009), where the slope of the regression line was significantly positive; however, the regression model explained just 6% of the variance in the data (R2 = 0.064). We did not find a significant relationship between the date of arrival at an FSA site and fish size: (d.f. = 57, F = 1.01, p = 0.319).
We tagged three fish that were later determined to be immature at the time of tagging based on their size at capture relative to the published maturity at age schedule in the literature: male goliath grouper mature around 110–115 cm TL and females mature around 120–135 cm TL [39]. Because the sex of immature fish was not apparent from visual examination during capture, we considered any fish less than 120 cm TL to be immature. The three fish that were captured and tagged during the fall of 2010 that met this criterion were, fish #041, 117 cm TL; fish #042, 104 cm TL; and fish #043, 120 cm TL. All three fish were captured and tagged on the same day at the Gulfland site, a site where we tagged fish but were not able to confirm spawning. None of these individuals were detected at FSA sites until they had grown to at least 135 cm TL, based on predicted growth calculated with the published growth curve for goliath grouper [12]. Fish #041 and #043 were both detected at FSA sites in 2012 (approximate length 135 and 137 cm TL respectively), while fish #042 was not detected at an FSA site until 2014 when it was approximately 141 cm TL.
We did not find significant differences between females and males in terms of the number of sites visited annually (d.f. = 107, t = 0.054, p = 0.957; females = 4.58 ± 1.6 sites; males = 4.54 ± 1.7 sites), the number of sites visited during all time at large (d.f. = 36, t = 0.254, p = 0.801; females = 9.05 ± 8.4 sites; males = 8.56 ± 8.1 sites), or the number of spawning sites visited annually (d.f. = 93, t = 0.668, p = 0.506; females = 1.2 ± 0.08 sites; males = 1.3 ± 0.08 sites). However, we did find that females moved significantly farther than males within a given year: d.f. = 100, t = 3.56, p < 0.001; females = 29.9 ± 5.5 km; males = 10.5 ± 1.3 km. Movements by female goliath grouper were more variable (Figure 8), and accounted for all recorded movements greater than 50 km. We also found a significant difference in the time of arrival by males versus females to spawning sites, where males arrived about 15 days earlier than females on average: d.f = 56, t = 2.27, p = 0.027.

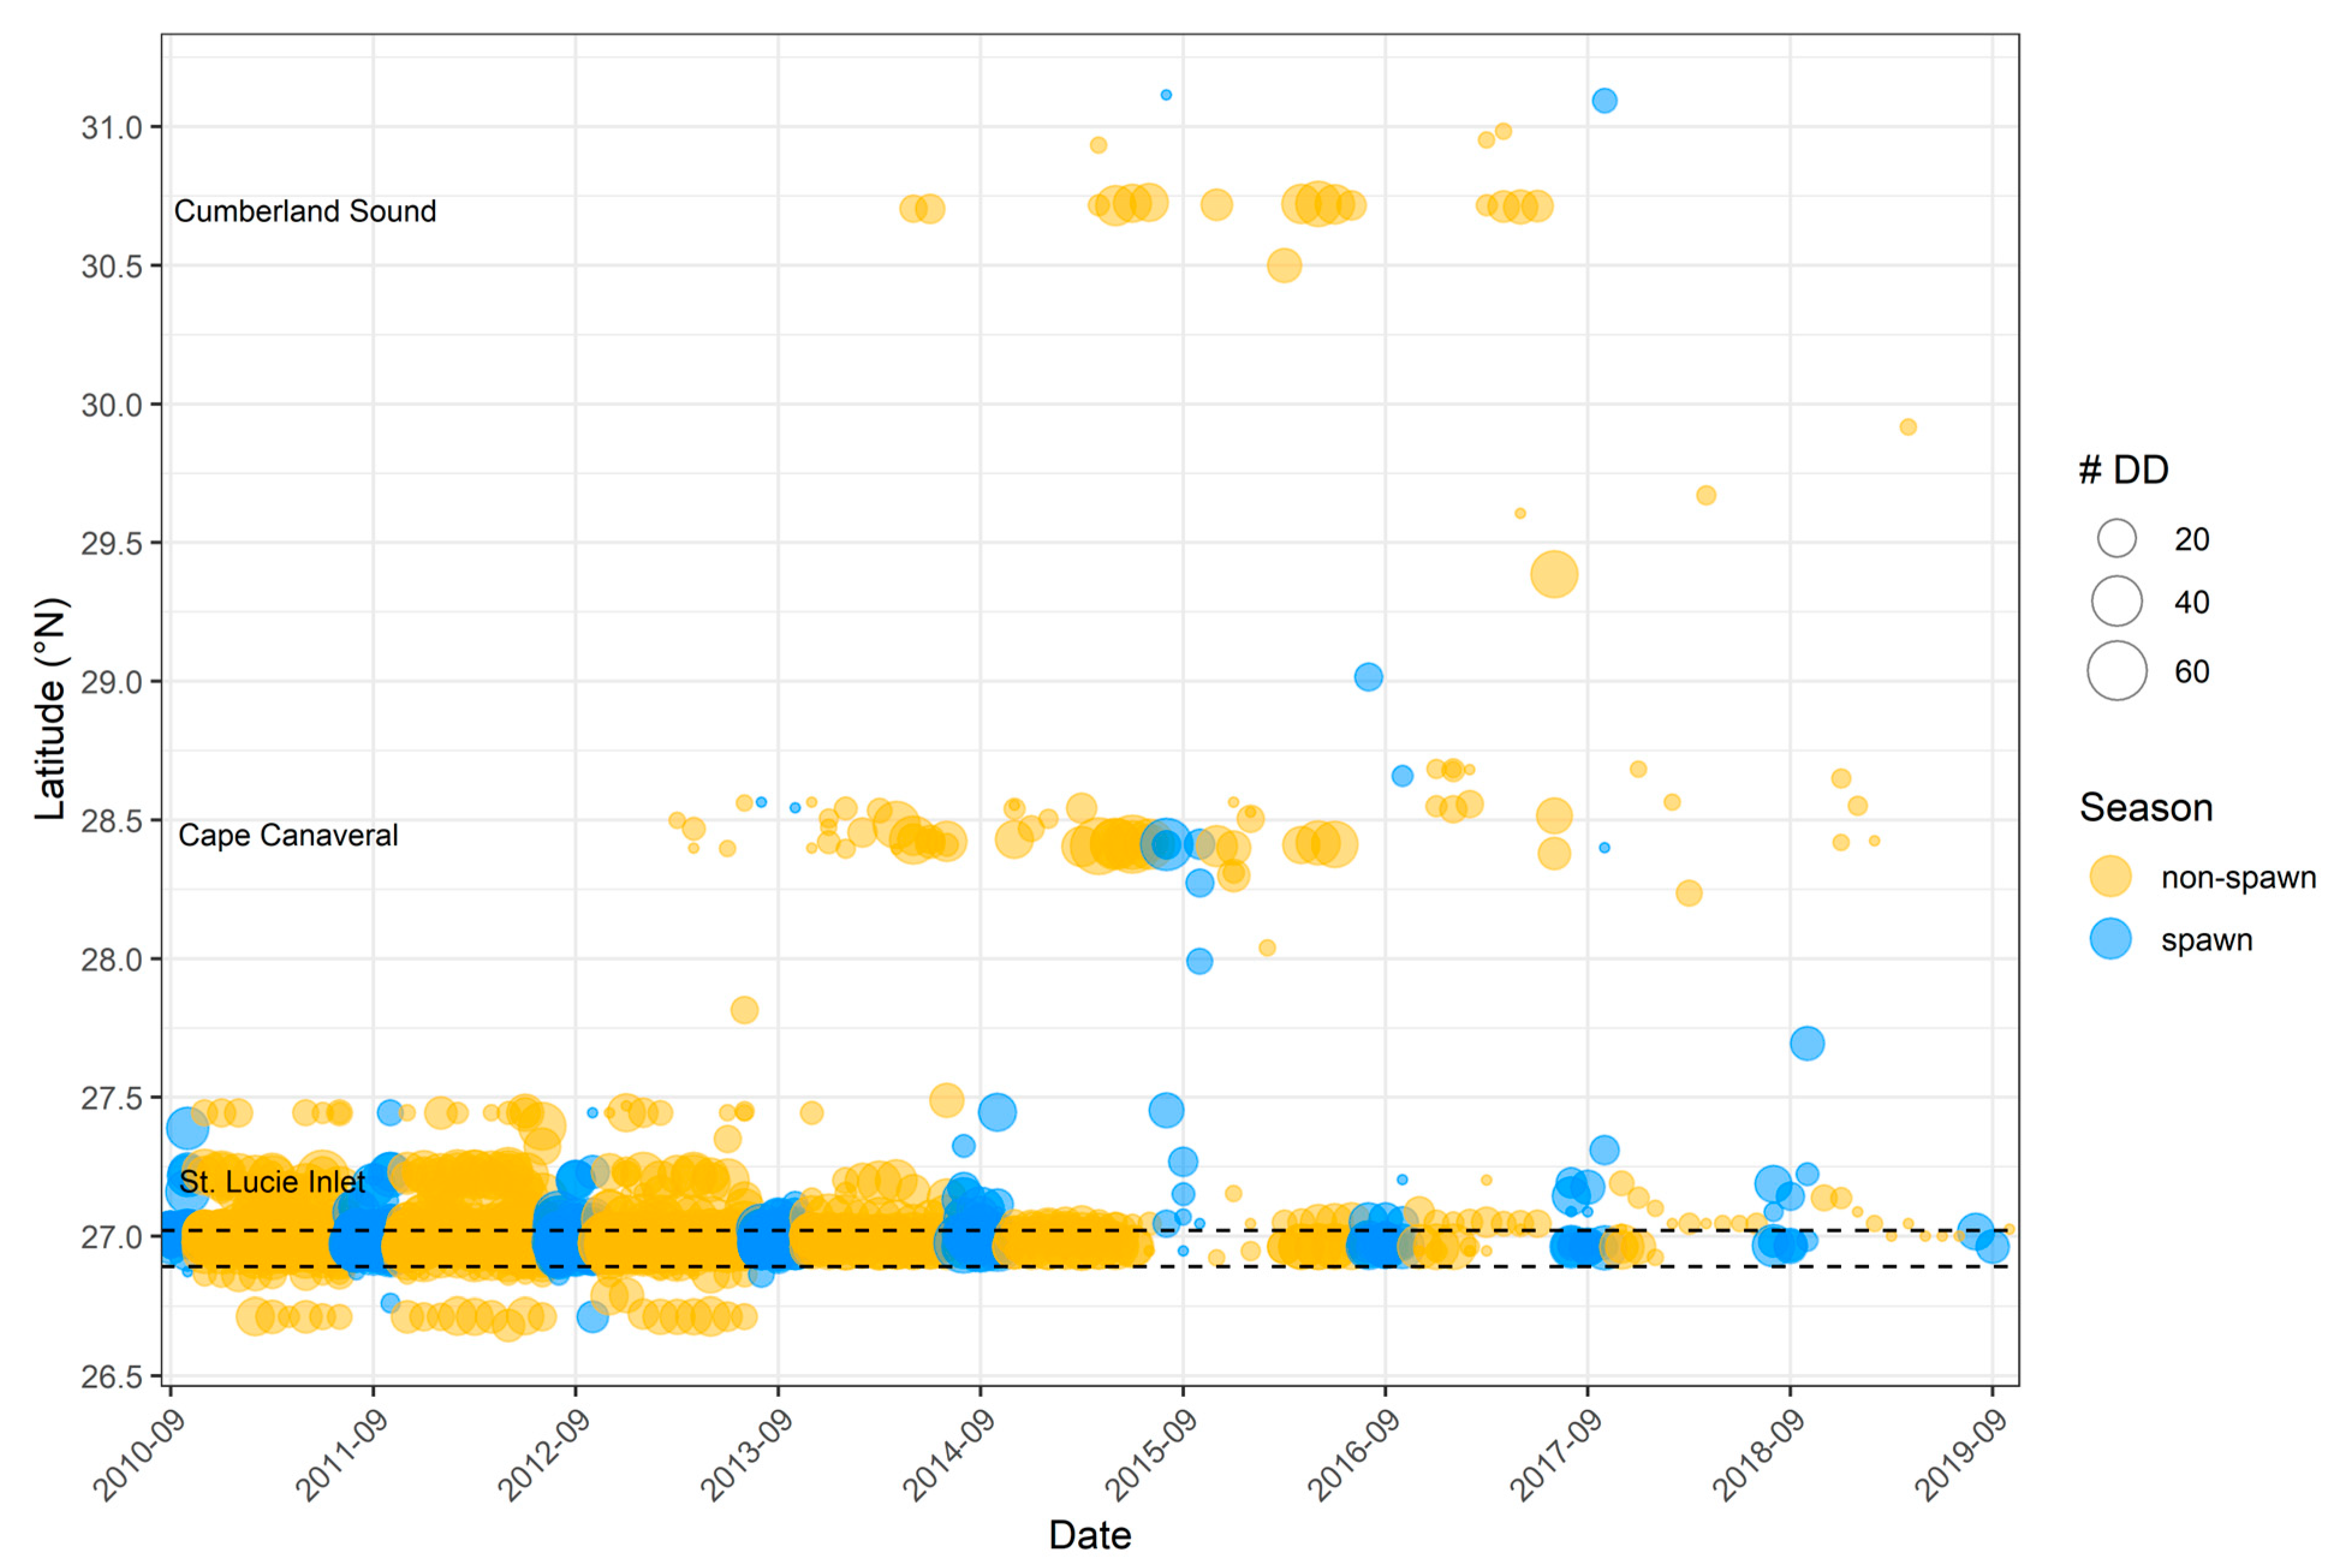
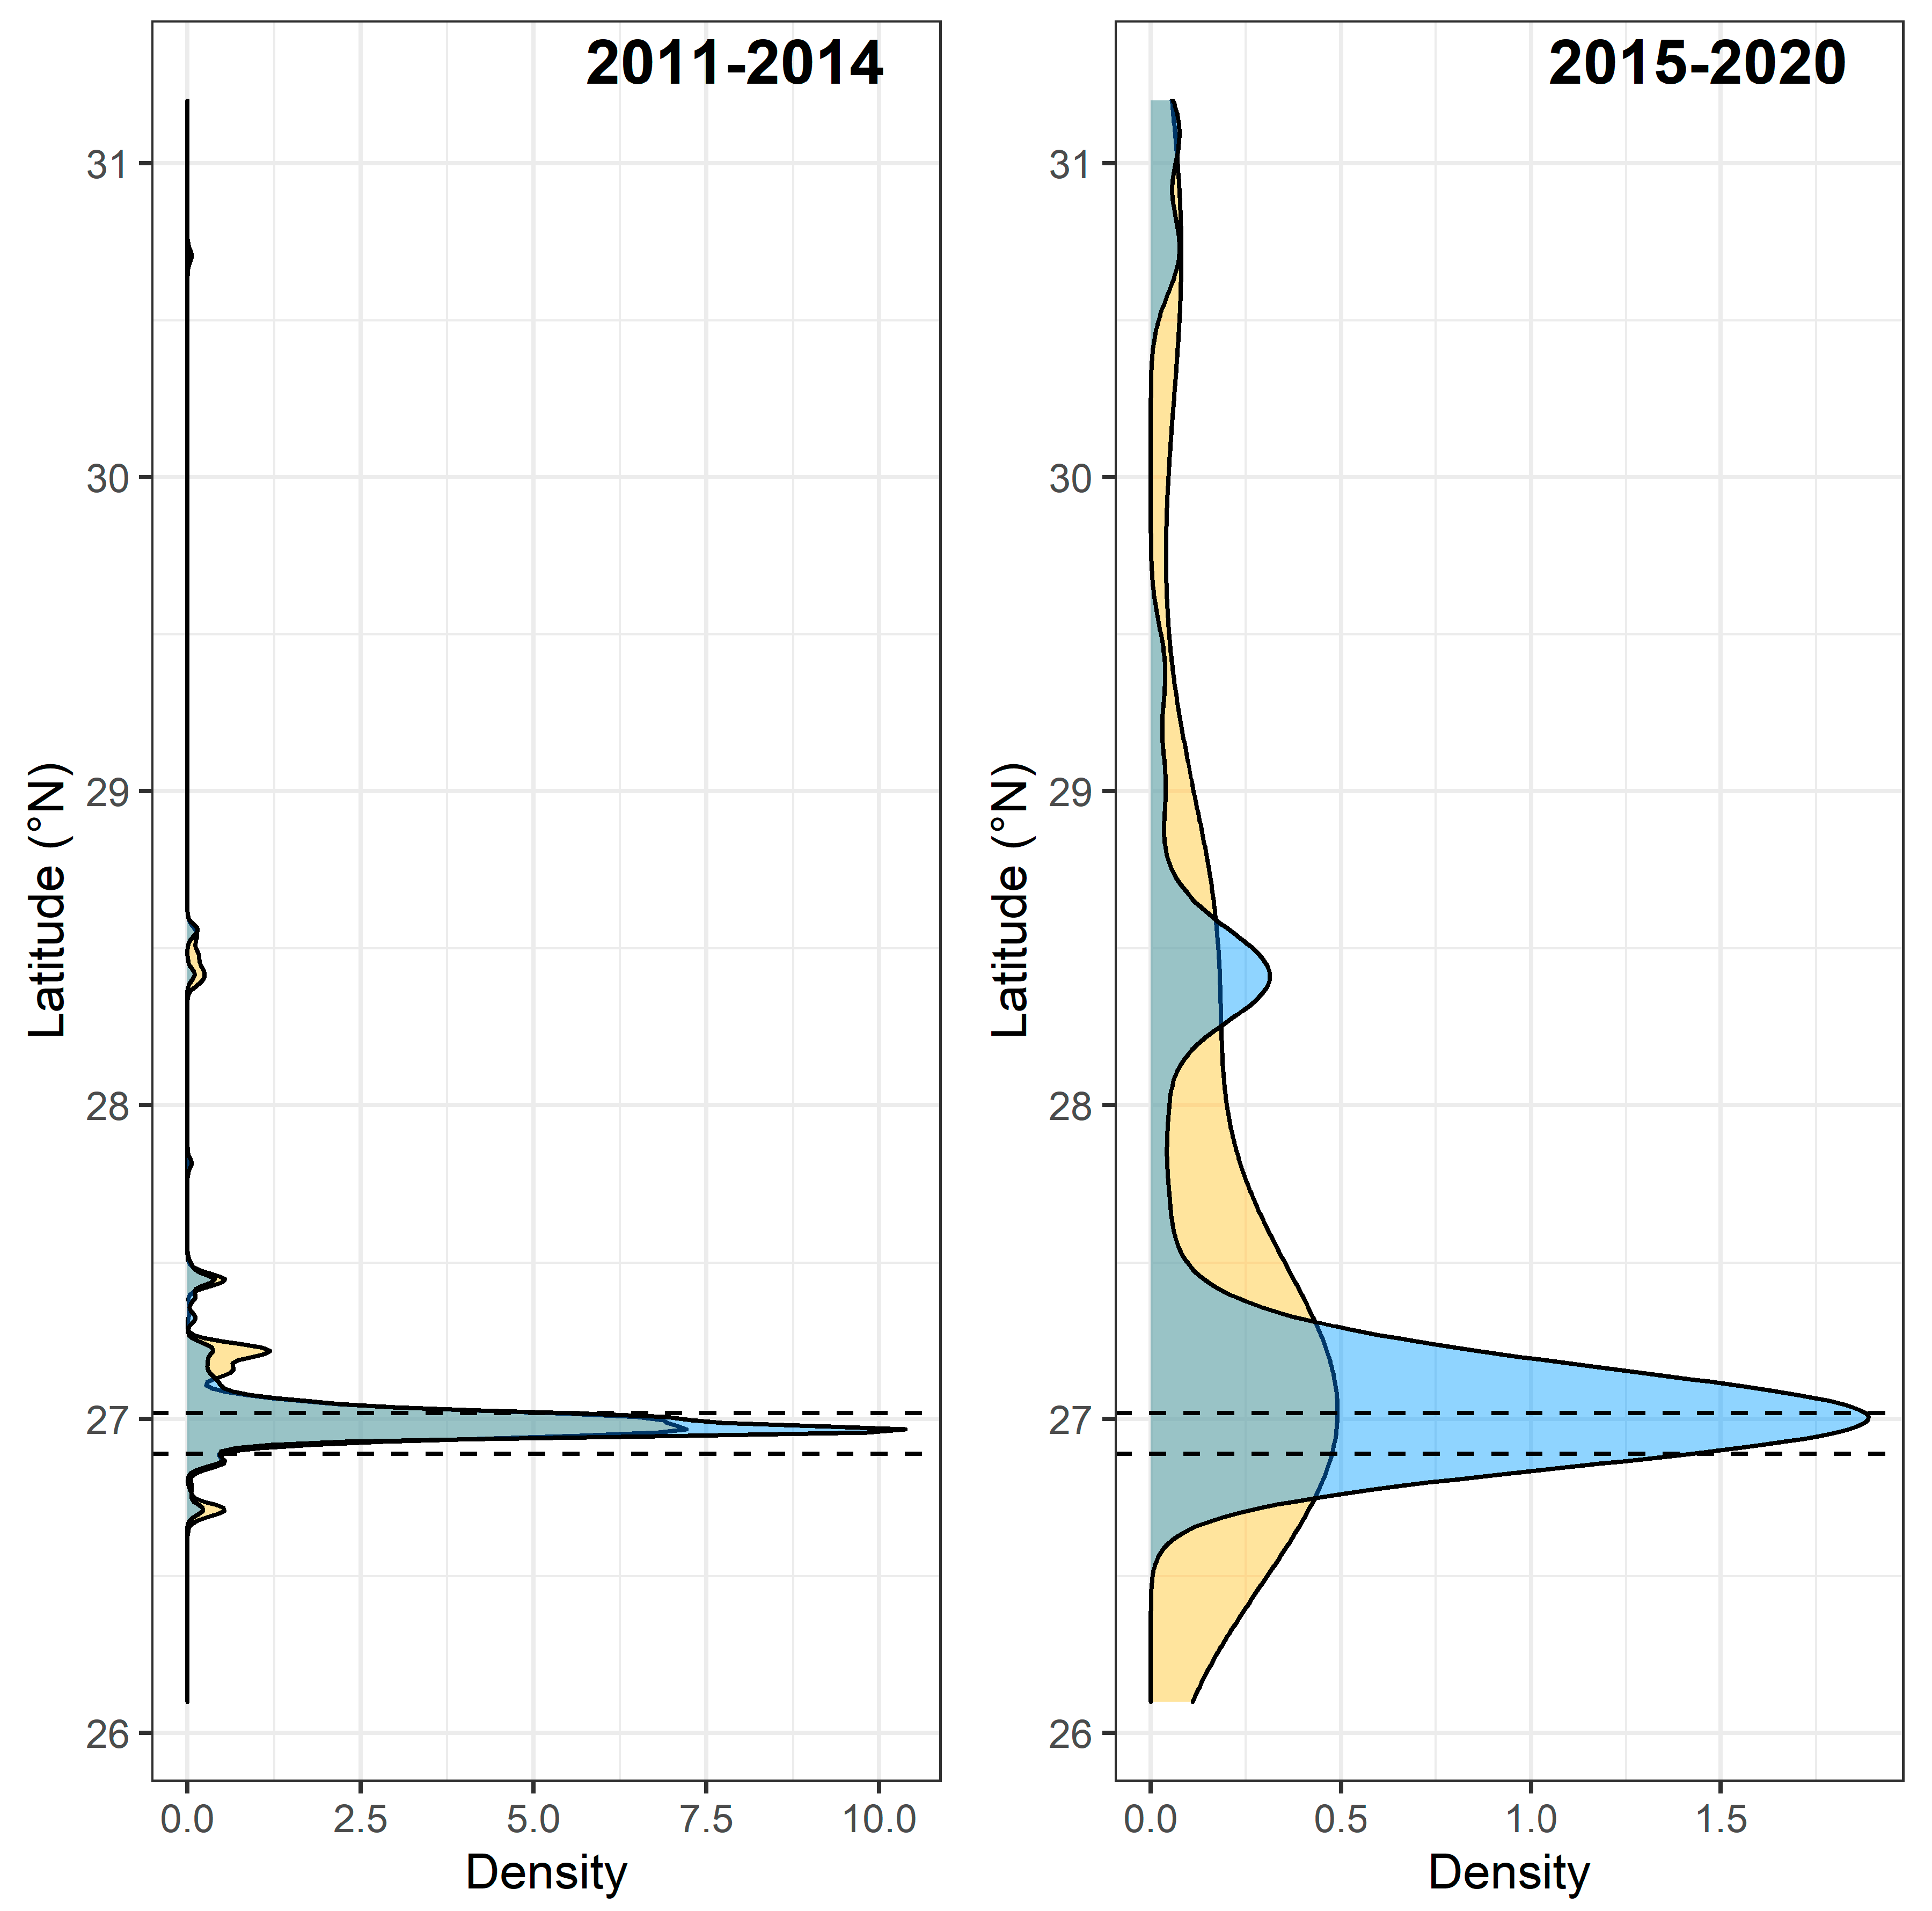
3.6. Catchment Area and Kernel Density Analyses

To estimate the catchment area for the focal FSA sites, we examined where tagged goliath groupers were detected over time. In general, the bulk of detections from tagged fish occurred at or near FSA sites but as the study progressed, we detected fish from nearly the entire Atlantic coast of Florida. From fall 2010 through spring 2013, most detections of tagged fish occurred at or near the FSA sites year-round (Figure 9). However, some tagged fish were also detected offshore of the St. Lucie (approx. latitude 27.2° N) and Ft. Pierce inlets (approx. latitude 27.5° N). Beginning spring 2013, tagged goliath groupers were detected offshore of Cape Canaveral (approx. latitude 28.5° N), and by late spring 2014 tagged fish were detected at sites inside Cumberland Sound, located at the state border between Florida and Georgia.
Detections of tagged fish during spawning months (July to Oct) were generally confined to the region between the Ft. Pierce and Jupiter Inlets in 2011, 2012, and 2014 (Figure 9). Detections outside this region during the spawning season in 2013 were caused by two individuals detected offshore of Cape Canaveral during July and October; these two individuals were also detected at FSA sites, indicating migrations occurred between Cape Canaveral and the FSA sites. In 2015, four tagged fish were detected offshore of Cape Canaveral during the spawning season; three of these four fish were also detected at sites located near the FSA sites, including one of the large females that migrated from the Cumberland Sound region, as detailed above. Similarly, in 2016 to 2018, detections away from the FSA sites during spawning months were of three tagged fish moving south from the Cumberland Sound region toward the FSA sites. Although we were no longer monitoring the focal FSA sites after 2015, these fish were detected at sites nearby during the peak spawning period every year from 2015 to 2019.
Results of the kernel density estimation confirmed that tagged fish were most likely to be detected near the FSA sites during the first four years of the study, 2011 to 2014, with secondary peaks near the St. Lucie and Ft. Pierce Inlets during non-spawning months (Figure 10). A small peak in detection probability appeared around the Cape Canaveral region as well during this period, mainly during non-spawning months. From 2015 to 2020, the KDE results showed that tagged fish were increasingly likely to be detected away from the FSA sites both during spawning and non-spawning months, though the highest peak in detection density still aligned with the FSA region during the spawning period.

4. Discussion

Goliath grouper tagged for this study showed very high site fidelity to spawning aggregation sites located offshore of southeastern Florida, US, with more than 80% of tagged fish at large returning to the FSA sites each year. Furthermore, most tagged goliath grouper appeared to make single migratory movements between home ranges and FSAs and remained on site at these aggregations long enough to spawn through at least two new moons. The catchment area of the focal FSA sites included the entire Florida Atlantic coast north of the aggregation sites, extending into southern Georgia coastal waters. Interestingly, we did not detect any tagged fish moving south of the focal FSA sites into waters of the Florida Keys, which had ample acoustic receiver coverage during the study period, or into waters of the Gulf of Mexico. Based on the defined characteristics of FSAs, goliath grouper spawning aggregations are transient: (1) they peak at specific times during the year, (2) they last for multiple lunar cycles, (3) they are located outside the home ranges of most individuals, and (4) they have a large catchment area requiring migrations lasting days to weeks [6,7].
The data we present here confirm a strong association between goliath grouper reproductive behaviors and the lunar cycle [5,12]. Specifically, we detected increased movements by tagged fish that appeared to be triggered by the July full moon when fish became more active and moved more often between sites and towards FSA sites. Spawning is apparently centered on the new moon phase, as indicated by the high frequency of post-ovulatory follicles and hydrated oocytes found in ovarian biopsies collected during the new moons of August and September, and by increased sound production that occurs around these new moons [5]. Aggregation of tagged fish at FSA sites around the new moon, specifically the Zion Train site, was clear from the detection data, further supporting our conclusion that peak spawning by goliath grouper in the Florida Atlantic occurs around the new moon.
We observed a large variation in migration distance among the tagged goliath groupers, where some individuals appeared to use FSA sites as home sites year-round, while others migrated long distances, sometimes over 400 km, between home sites and FSAs. This pattern, where a population includes both resident and migratory individuals, is commonly known as partial migration [40]. More specifically, the pattern we observed in goliath grouper is known as non-breeding partial migration, when all members of the population breed together but then separate spatially [41]. Partial migration has been documented often among fish species and the ecological and evolutionary drivers of partial migration in a population are thought to evolve in response to fluctuating environment, resources, or predation risk, as individuals navigate trade-offs among these factors while attempting to maximize their evolutionary fitness [42]. We observed three distinct migratory types of goliath grouper: in addition to resident individuals at the FSA sites (n = 12) and long-distance migrants (n = 5), some tagged fish appeared to use artificial reef sites located near the St. Lucie Inlet, located ~30 km north of the FSA sites, as home sites (n = 1; there were insufficient data for the remaining 18 individuals to be classified into one of these three groups). Unlike the long-distance migrants that made single migrations between home and FSA sites, the individuals with home sites near the St. Lucie Inlet made multiple trips to FSAs each year that were timed to the new moon, returning to home sites in between new moons during the duration of the spawning season. The evolution of multiple migration strategies has been described for multiple other species of Epinephelid groupers, including tiger grouper (Mycteroperca tigris), that displayed the same three migration patterns as described here for goliath groupers [28]. Likewise, an acoustic tracking study of leopard grouper (M. rosacea) found that individuals exhibited multiple migration types based on analysis of residency patterns [43]. In contrast, some Nassau (E. striatus) and yellowfin (M. venenosa) groupers were tracked making daily migrations of 5 to 10 km between home and spawning sites, while others remained at spawning sites throughout the study [44]. Such movement patterns could arise from a variety of causes, such as higher competition for resources at FSAs compared to home sites, to reduce displacement from home sites, or as a mechanism to increase conspecific encounter rates [42,43,44,45,46].
In general, we found that female goliath grouper moved more than males. Four of the five tagged fish that were documented traveling >100 km between home and FSA sites were female, and the two fish detected moving into southern Georgia were both females. The sex of resident goliath grouper was less clear: three of the 12 residents were males, four were females, one individual appeared to be undergoing transition from female to male (i.e., functional protogyny), and three were unknown [25]. We also found that larger goliath grouper moved farther and visited more sites than did smaller ones. For example, the mean size of the four long-distance migrators for which we had length at tagging data was 183.5 ± 4.8 cm TL, much larger than the overall group mean size at tagging (160.9 ± 3.7 cm TL), while the mean size of the resident fish was much smaller than the overall group mean size, at 145.7 ± 6.6 cm TL. However, there was no difference in the size of female versus male fish at the time of tagging that might reflect a bias in the sex and/or sizes of tagged goliath grouper (female average length = 166.4 ± 4.4 cm; male average length = 162.3 ± 5.7 cm). To date, the reproductive strategy of goliath grouper remains unresolved. While there is some evidence of protogynous hermaphroditism, based on the appearance of gonads collected from transitional individuals, we also observed a nearly even male:female sex ratio within over 600 individuals caught during a concurrent study of reproductive dynamics [5,25]. So, what to make of these patterns? Migration is thought to be a mechanism that maximizes growth in individuals, at the expense of elevated predation risk [45]. However, in most examples of partial migration, the smaller individuals that are more likely to migrate while larger ones are more likely to be resident, the opposite of what we observed in goliath grouper [40,42]. Among partial migrant species, females are more likely to migrate, while males are more likely to be resident, often hypothesized to be driven by the enhanced reproductive demands on females [45]. Such is the case for gag (M. microlepis), a protogynous hermaphroditic Epinephelid grouper, where males remain resident at shelf-edge FSA sites year-round while females migrate between FSA and coastal waters [47,48]. Here, we observed that goliath grouper migratory patterns matched the prediction that females are more likely to be migrators but did not follow the prediction that smaller individuals are more likely to migrate.
The goliath grouper tagged in the present study did not move very far or very often, except during migrations to spawning sites, exhibiting a pattern of high home site fidelity and rapid long-distance migrations to FSA sites. High site fidelity to home sites by goliath grouper has been previously reported by others [3,4], though our study is the first that we are aware of to show repeated long-distance migrations between home and FSA sites. These movement patterns have important implications for the management of this species. Although the fishery remains under a complete harvest moratorium in US Federal waters, a catch-and-release fishery has developed for adult goliath grouper in some parts of the southeastern US, where recreational and charter fishers target goliath groupers for the experience of catching and landing a fish that can often exceed 150 kg. Additionally, a restricted entry juvenile goliath grouper harvest was authorized by the Florida FWC to begin in state waters starting in 2023 [49]. Harvest rules include a maximum annual removal of 200 fish (limited by permit), a slot limit of 24 to 36” (61 to 91 cm TL), and both time (March through May) and spatial restrictions. This harvest was authorized against prevailing scientific advice and without a robust understanding of the effect of the harvest on the population trajectory [50]. The high site fidelity of goliath grouper reported here and elsewhere, combined with relatively low densities of individual goliath groupers reported at these sites, likely means that individual fish may be repeatedly caught by anglers who target specific locations [3,4]. The consequences of multiple catch and release events on the health and potential reproductive resilience of goliath grouper remains unknown. Future studies focused on developing reliable estimates of post-release mortality and optimal release strategies for goliath grouper are needed.
The ability to estimate activity of goliath grouper, in terms of distance moved by tagged fish throughout the year, highlights the importance of using continuously monitored sites such as those maintained by members of the FACT Network. In addition to collecting detection data that allowed us to describe migratory movements, nearly continuous monitoring of some individuals within their home ranges allowed us to estimate relative activity levels by comparing movements made across different time periods. Thus, we could graphically show both movement behaviors related to spawning and investigate movement patterns outside of the spawning period. For example, movement patterns during February and March were relatively low (see Figure 4). However, in February 2011 and again in March 2014, movement metrics exceeded the group mean value occurring during these months in other years. These observations could represent fish moving in response to changes in environment such as those induced by cold-water upwelling, flooding or droughts, or other events that occur seasonally in the study area [51]. Why some goliath groupers moved frequently between nearby sites while others appeared to remain at single sites year-round remains unknown, but such questions warrant further investigation.
Estimates of inter-annual site fidelity to the FSA sites were high overall but differed among specific spawning sites. Most fish were detected at just a single FSA site each year but did not necessarily return to the site where they were tagged. Indeed, the relative importance of spawning sites (in terms of the number of tagged fish detected at each site) changed from year to year, as did the site with the largest aggregation. The bulk of our tagging effort (30 of 50 tags deployed) occurred at a single FSA site, the Zion Train artificial reef, primarily because this site had the largest aggregation of goliath grouper in the study area based on local fisher’s knowledge. Diver counts confirmed that the Zion Train FSA site hosted the largest aggregation of goliath groupers in 2010, 2011, 2013, and 2014, while in 2012 the MG-111 wreck had the largest aggregation [38]. With multiple FSA sites located in relatively close proximity, tagged fish were not limited to a single “home” aggregation. Similar patterns in the variability of specific spawning locations have been observed in other fish species that form spawning aggregations. For example, Nassau grouper in the Cayman Islands form annual spawning aggregations near the same reef promontory; however, the exact location along the reef wall, as well as the size and shape of the aggregation, varies from year to year [52]. The ability to vary the location of FSAs within a localized area may enable individual fish to react to favorable oceanographic conditions with potentially dramatic consequences for reproductive success [53]. Recently, the Florida FWC considered but ultimately rejected a plan to protect some of the goliath grouper FSA sites that occur within state waters from fishing, in part due to a lack of information regarding the goliath grouper behaviors at FSAs [54]. Given the numerous data deficiencies that remain for this species, including behaviors of both fish and fishers around FSAs, a precautionary approach to management should be taken [50,55]. Additional research into the spatial variability of goliath grouper FSAs during spawning periods would be beneficial to determine the importance of multiple sites to the reproductive success of goliath grouper and help to guide future spatial management of goliath grouper FSAs.
The current population status of goliath grouper in US waters remains uncertain. While anecdotal evidence suggests the population has increased substantially, at least regionally within Florida waters, efforts to conduct formal stock assessments have failed to produce quantifiable stock status for the species [22,23]. If the goliath grouper population does increase over time, how might this growth affect migratory and spawning-related behaviors? Hypotheses to explain partial migration in other species might suggest that increased density could lead to greater competition for resources in terms of food, space, and mates, and so individual fish may alter their movement patterns and behaviors to reflect this increased competition. This could result in more individuals choosing to migrate rather than remain resident at FSA sites, which would result in a larger catchment area for existing FSAs or the establishment of new FSAs, as has been recently documented in the Gulf of Mexico [56]. Indeed, as our study progressed, tagged goliath grouper were increasingly likely to be detected further north and further away from FSA sites over time (see Figure 10 and Figure S4). These results may indicate that increasing densities of goliath grouper at FSAs are causing changes in movement behaviors, or they could simply be reflective of tagged individuals growing larger and becoming more likely to move farther. Additional tracking studies of goliath grouper, focused on tagging adults either at FSAs, as we have performed here, or at home sites, could address these hypotheses. In the meantime, the variability in goliath grouper FSA size, as well as the spatial extent of FSAs along the Atlantic coast remain unknown.

5. Conclusions

The results of our study highlight the importance of continuously monitored stations for acoustic telemetry, such as those maintained by members of the FACT Network. Without cooperative array networks, little detail on the movements of tagged animals can be gained. Our membership in the FACT Network allowed us to confirm that goliath grouper use a single spawning area off Palm Beach and Martin Counties and make extensive migrations to this area. Thus, a main conclusion from this work is that the FSA sites located off the east coast of Florida are composed of goliath grouper from the entire east coast of Florida and further north into southern coastal Georgia. That these individuals were found to return to the same spawning sites over consecutive years is an important insight into the aggregating behavior of this vulnerable species. One of the main goals of this study was to determine the fidelity of individual fish to spawning sites, and so we designed the study to focus on a fixed set of sites over time. Future studies should also investigate the spatial distribution of spawning sites, which remains a critical knowledge gap for the management of the species.

Supplementary Materials

The following supporting information can be downloaded at: https://www.mdpi.com/article/10.3390/fishes8080398/s1, Table S1: Figure S1: abacus plot of daily detections; Figure S2: plots of monthly detections and tags detected; Figure S3: plots of the number of tagged fish detected during the spawning season at the Zion Train FSA site, 2012–2014; Figure S4: annual KDE plots, 2011–2018.

Author Contributions

Conceptualization, C.C.K. and F.C.C.; methodology, R.D.E., C.C.K. and F.C.C.; investigation, R.D.E., C.C.K., J.V.L., C.R.M. and F.C.C.; data curation, R.D.E.; formal analysis, R.D.E.; writing—original draft preparation, R.D.E.; writing—review and editing, R.D.E., C.C.K., J.V.L., C.R.M. and F.C.C.; project administration, R.D.E., C.C.K. and F.C.C.; funding acquisition, C.C.K. and F.C.C. All authors have read and agreed to the published version of the manuscript.

Funding

This research was funded by NOAA Fisheries, MARFIN grants NA10NMF4330123 and NA11NMF4330123. The lead author, R.D.E., was partially supported by State of Florida fishing license sales, U.S. Department of Interior, U.S. Fish and Wildlife Service, Federal Aid for Sport Fish Restoration to the Florida Fish and Wildlife Conservation Commission. The views, statements, conclusions, and recommendations expressed herein are those of the authors and do not necessarily reflect the opinions or policies of the U.S. government or any of its agencies.

Institutional Review Board Statement

The animal study protocol was approved by the Institutional Animal Care and Use Committee (IACUC) of Florida State University (protocols 1106).

Data Availability Statement

Telemetry detection data, stored on the FACT Network database node at the time of publication, can be made available via the Ocean Biodiversity Information System (OBIS) upon request of the corresponding author.

Acknowledgments

This project would not have been possible without the vital advice and assistance of Captains Don Demaria and Mike Newman (F/V Dykoke). Assistance with fieldwork was provided by Captain Scott Briegel, Jim Fyfe, Tony Grogan, Alicia Brown, Leonardo (Leco) Bueno, Jessica Cusick, Kelly Kingon, Justin Lewis, Dylan Newman, Chris Peters, Orian Tzadik, and Kara Wall. Special thanks to the FACT Network members who contributed detection data over the past decade, including Bonnie Ahr and Eric Reyier, NASA Environmental and Medical Contract, Kennedy Space Center, Florida; Erick Ault, Joy Young, and the FWC Tequesta Field Lab staff; Matt Ajemian, Harbor Branch Oceanographic Institute, Florida Atlantic University; Adam Fox, University of Georgia; Chris Kalinowski, Coastal Resources Division, Georgia Department of Natural Resources; Debra Murie, University of Florida; and Steve Kessel and the Bimini Biological Field Station staff. Project support was provided by the Florida State University Coastal and Marine Laboratory and the Florida Fish and Wildlife Research Institute. Assistance with figures was provided by Jessica Pernell and Sarah Webb. The manuscript was improved by helpful comments provided by Philip Stevens and four anonymous reviewers.

Conflicts of Interest

The authors declare no conflict of interest.

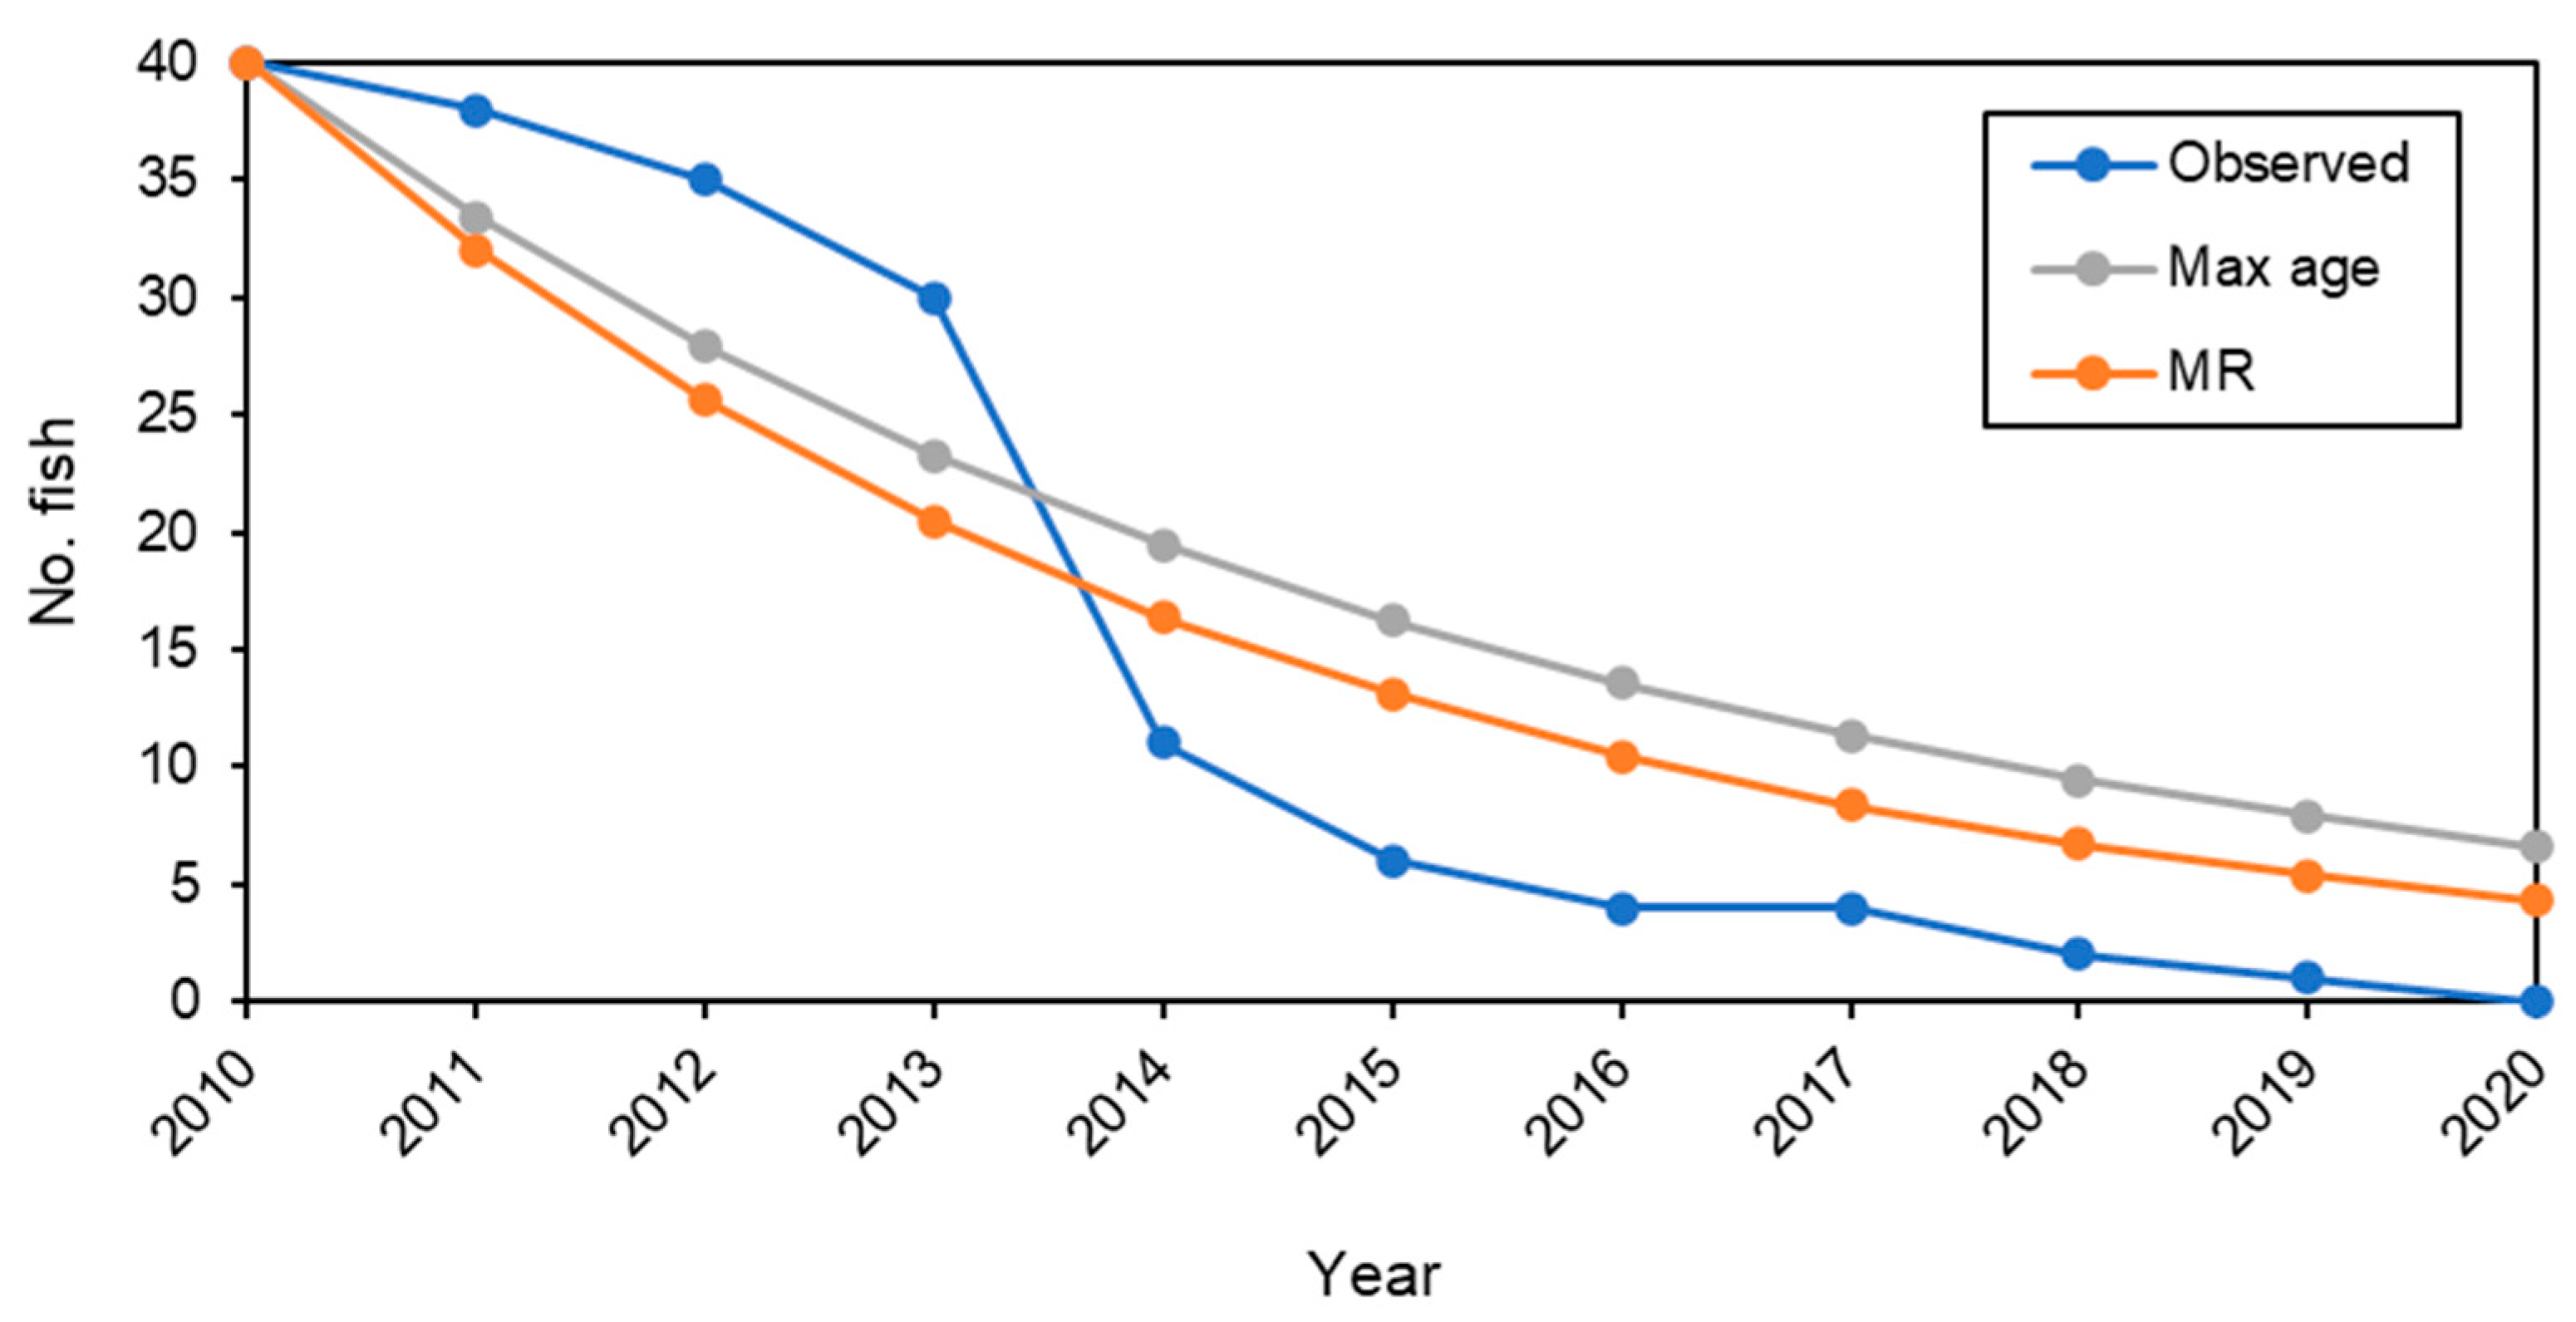
Appendix A. Investigating Attrition Rate of Detected Fish

The expected number of tagged goliath groupers detected during the study appeared to decline faster than anticipated. To determine if the rate of loss exceeded the rate predicted due to natural mortality, we modeled tag loss over time by applying previously calculated natural mortality rates to the population of the 40 fish that were tagged in 2010 and 2011. We compared the observed attrition rate to modeled two attrition rates, the first based on the natural mortality rate used in the most recent stock assessment [21], which was based on a presumed maximum age of 37 years, and the second based on mark-recapture results of our fishing efforts that occurred concurrently with the acoustic tag study [38].
The most recent goliath grouper stock assessment used an average instantaneous natural mortality rate of 0.18, which corresponds to an annual survival rate = 0.835 [21]. During the concurrent study, we calculated survival rates using mark-recapture (“MR”) data of fish caught from 2010 to 2015 based on a total of 700 marked individuals, of which 151 (22.1%) were recaptured [38]. We estimated survivorship of this group, which returned a maximum likelihood estimate of annual survival at 0.80. Note, we also calculated survivorship by combining the MR data with the acoustic tag detection data, to estimate a much more robust annual survival rate of 0.88, but because we are assessing attrition rate within the acoustic-tagged fish, to avoid circularity, here we used only the MR estimate.
Comparing the attrition rate of tagged goliath grouper to the two modeled loss curves shows that from 2010 to 2013 the observed attrition rate was less than predicted by either model (Figure A1). However, this was followed by a large drop in detected individuals between 2013 to 2014, then from 2014 to 2020 the observed attrition rate again roughly followed the expected rate of decline.
Figure A1. Observed and expected attrition rate for 40 Atlantic goliath grouper (Epinephelus itajara) tagged with acoustic telemetry tags in 2010–2011. Expected attrition rates were generated by two simple models, one based on the maximum estimated age as used in the latest goliath grouper stock assessment [21], and one based on mark-recapture (MR) results from a concurrent study [38].
Fishes 08 00398 g0a1
To verify that the attrition rate of tags detected was not likely caused by changes in detection probability, here we show that the number of receivers deployed by FACT Network members, and the corresponding area of the Florida Atlantic coast covered by these receivers, increased nearly 10-fold during the study period (Figure A2).
Figure A2. Number of active acoustic telemetry receivers deployed by FACT Network members, 2010–2020. Adapted from, https://secoora.org/fact/the-facts/about-us/ (accessed on 19 May 2023).
Fishes 08 00398 g0a2
Because goliath grouper were under a complete harvest moratorium during the study period, and lacking sufficient quantitative data on either catch rates or bycatch mortality, our models assumed that fishing mortality (F) effectively equaled zero and that the only remaining source of total mortality (Z) is natural mortality (M). Here, we show that this was likely the case for most of the study, excluding 2013–2014, when the attrition rate exceeded the expected rate. Either through mortality or emigration from the study area, more tagged fish were lost than expected during two of the ten years of the study.

References

  1. Colin, P.L. Preliminary investigations of reproductive activity of the jewfish, Epinephelus itajara (Pisces: Serranidae). Proc. Gulf Carib. Fish. Inst. 1990, 43, 138–147. [Google Scholar]
  2. Koenig, C.; Coleman, F.C.; Eklund, A.M.; Schull, J.; Ueland, J.S. Mangroves as essential nursery habitat for goliath grouper (Epinephelus itajara). Bull. Mar. Sci. 2007, 80, 567–586. [Google Scholar]
  3. Koenig, C.C.; Coleman, F.C.; Kingon, K. Pattern of recovery of the Goliath Grouper Epinephelus itajara population in the southeastern U.S. Bull. Mar. Sci. 2011, 87, 891–911. [Google Scholar] [CrossRef]
  4. Collins, A.B.; Barbieri, L.R.; McBride, R.S.; McCoy, E.D.; Motta, P.J. Reef relief and volume are predictors of Atlantic goliath grouper presence and abundance in the eastern Gulf of Mexico. Bull. Mar. Sci. 2015, 91, 399–418. [Google Scholar] [CrossRef]
  5. Koenig, C.C.; Bueno, L.S.; Coleman, F.C.; Cusick, J.A.; Ellis, R.D.; Kingon, K.; Locascio, J.V.; Malinowski, C.; Murie, D.J.; Stallings, C.D. Diel, lunar, and seasonal spawning patterns of the Atlantic Goliath Grouper, Epinephelus itajara, off Florida, United States. Bull. Mar. Sci. 2017, 93, 391–406. [Google Scholar] [CrossRef] [Green Version]
  6. Domeier, M.L.; Colin, P.L. Tropical reef fish spawning aggregations: Defined and reviewed. Bull. Mar. Sci. 1997, 60, 698–726. [Google Scholar]
  7. Domeier, M.L. Revisiting spawning aggregations: Definitions and challenges. In Reef fish Spawning Aggregations: Biology, Research and Management; Sadovy de Mitcheson, Y., Colin, P.L., Eds.; Fish and Fisheries Series 35; Springer Science + Business Media: Berlin, Germany, 2012; pp. 1–20. [Google Scholar]
  8. Sadovy de Mitcheson, Y.; Cornish, A.; Domeier, M.L.; Colin, P.L.; Russell, M.; Lindeman, K. A global baseline for spawning aggregation of reef fishes. Conserv. Biol. 2008, 22, 1233–1244. [Google Scholar] [PubMed]
  9. Nemeth, R.S. Ecosystem aspects of species that aggregate to spawn. In Reef Fish Spawning Aggregations: Biology, Research and Management; Sadovy de Mitcheson, Y., Colin, P.L., Eds.; Fish and Fisheries Series 35; Springer Science + Business Media: Berlin, Germany, 2012; pp. 21–56. [Google Scholar]
  10. Aguilar-Perera, A. Disappearance of a Nassau grouper spawning aggregation off the southern Mexican Caribbean coast. Mar. Ecol. Prog. Ser. 2006, 327, 289–296. [Google Scholar]
  11. Erisman, B.; Heyman, W.D.; Kobara, S.; Ezer, T.; Pittman, S.; Nemeth, R.S. Fish spawning aggregations: Where well-placed management actions can yield big benefits for fisheries and conservation. Fish Fish. 2017, 18, 128–144. [Google Scholar] [CrossRef] [Green Version]
  12. Ellis, R.D.; Koenig, C.C.; Coleman, F.C. Spawning-related movement patterns of goliath grouper (Epinephelus itajara) off the Atlantic coast of Florida. Proc. Gulf Carib. Fish. Inst. 2014, 66, 395–400. [Google Scholar]
  13. Levitan, D.R.; Fogarty, N.D.; Jara, J.; Lotterhos, K.E.; Knowlton, N. Genetic, spatial, and temporal components of precise spawning synchrony in reef building corals of the Montastraea annularis species complex. Evolution 2011, 65, 1254–1270. [Google Scholar] [PubMed]
  14. Lin, C.H.; Takahashi, S.; Mulla, A.J.; Nozawa, Y. Moonrise timing is key for synchronized spawning in coral Dipsastraea speciosa. Proc. Natl. Acad. Sci. USA 2021, 118, e2101985. [Google Scholar] [CrossRef] [PubMed]
  15. Shima, J.S.; Osenberg, C.W.; Alonzo, S.H.; Noonburg, E.G.; Mitterwallner, P.; Swearer, S.E. Reproductive phenology across the lunar cycle: Parental decisions, offspring responses, and consequences for reef fish. Ecology 2020, 10, e03086. [Google Scholar]
  16. Mann, D.A.; Locascio, J.V.; Coleman, F.C.; Koenig, C.C. Goliath grouper (Epinephelus itajara) sound production and movement patterns on aggregation sites. Endanger. Species Res. 2009, 7, 229–236. [Google Scholar]
  17. Lara, M.R.; Schull, J.; Jones, D.L.; Allman, R. Early life history stages of goliath grouper Epinephelus itajara (Pisces: Epinephelidae) from Ten Thousand Islands, Florida. Endanger. Species Res. 2009, 7, 221–228. [Google Scholar] [CrossRef]
  18. Koenig, C.C.; Coleman, F.C.; Malinowski, C.R. Atlantic Goliath Grouper of Florida: To Fish or Not to Fish. Fisheries 2020, 45, 20–32. [Google Scholar] [CrossRef]
  19. Brusher, J.H.; Schull, J. Non-lethal age determination for juvenile goliath grouper (Epinephelus itajara) from southwest Florida. Endanger. Species Res. 2009, 7, 205–212. [Google Scholar]
  20. Sadovy, Y.; Eklund, A.-M. Synopsis of Biological Data on the Nassau Grouper, Epinephelus striatus (Bloch, 1792), and the Jewfish, E. itajara (Lichtenstein, 1822); Technical Report National Marine Fisheries Service (NMFS): Silver Spring, MD, USA; National Oceanic and Atmospheric Administration (NOAA): Washington, DC, USA, 1999; Volume 146, p. 68. [Google Scholar]
  21. SEDAR. SEDAR 47 Stock Assessment Report South Atlantic U.S. Goliath Grouper; SEDAR: North Charleston, SC, USA, 2016; p. 206. [Google Scholar]
  22. SEDAR. SEDAR 23 Stock Assessment Report South Atlantic and Gulf of Mexico Goliath Grouper; SEDAR: North Charleston, SC, USA, 2011; p. 248. [Google Scholar]
  23. Tringali, M.D. Reproductive success dynamics could limit precision in close-kin mark-recapture abundance estimation for Atlantic Goliath Grouper (Epinephelus itajara). Fishes 2023, 8, 254. [Google Scholar] [CrossRef]
  24. Carroll, J.L.; Ellis, R.D.; Collins, A.B.; Murie, D.J. Dorsal Fin Spines and Rays for Nonlethal Ageing of Goliath Grouper Epinephelus itajara. Fishes 2023, 8, 239. [Google Scholar] [CrossRef]
  25. Murie, D.J.; Parkyn, D.C.; Koenig, C.C.; Coleman, F.C.; Malinowski, C.R.; Cusick, J.A.; Ellis, R.D. Age, Growth, and Functional Gonochorism with a Twist of Diandric Protogyny in Goliath Grouper in the Southeastern USA. Fishes, 2023; in review. [Google Scholar]
  26. Namami, A.; Kawabata, Y.; Sato, T.; Yamaguchi, T.; Kawabe, R.; Soyano, K. Spawning migration and returning behavior of white-streaked grouper Epinephelus ongus determined by acoustic telemetry. Mar. Biol. 2013, 161, 669–680. [Google Scholar] [CrossRef]
  27. Dahlgren, C.E.; Buch, K.; Rechisky, E.; Hixon, M.A. Multiyear Tracking of Nassau Grouper Spawning Migrations. Mar. Coast. Fish. 2016, 8, 522–535. [Google Scholar] [CrossRef] [Green Version]
  28. Sleugh, T.; McCoy, C.M.; Pattengill-Semmens, C.V.; Johnson, B.C.; Heppell, S.A.; Waterhouse, L.; Stock, B.C.; Semmens, B.X. Migratory behavior of aggregating male Tiger Grouper (Mycteroperca tigris) in Little Cayman, Cayman Islands. Environ. Biol. Fishes 2023, 106, 1195–1206. [Google Scholar] [CrossRef]
  29. Nemeth, R.S.; Kadison, E.; Jossart, J.; Shivji, M.; Wetherbee, B.; Matley, J. Acoustic telemetry provides insights for improving conservation and management at a spawning aggregation site of the endangered Nassau grouper (Epinephelus striatus). Front. Mar. Sci. 2023, 10, 1154689. [Google Scholar] [CrossRef]
  30. Young, J.M.; Bowers, M.E.; Reyier, E.A.; Morley, D.; Ault, E.R.; Pye, J.D.; Gallagher, R.M.; Ellis, R.D. The FACT Network: Philosophy, evolution, and management of a collaborative coastal tracking network. Mar. Coast. Fish. 2020, 12, 258–271. [Google Scholar] [CrossRef]
  31. Currier, R.; Kirkpatrick, B.; Simoniello, C.; Lowerre-Barbieri, S.; Bickford, J. iTAG: Developing a Cloud Based, Collaborative Animal Tracking Network in the Gulf of Mexico. In Proceedings of the OCEANS 2015—MTS/IEEE Washington, Washington, DC, USA, 19–22 October 2015; pp. 1–3. [Google Scholar] [CrossRef]
  32. Bangley, C.W.; Whoriskey, F.G.; Young, J.M.; Ogburn, M.B. Networked Animal Telemetry in the Northwest Atlantic and Caribbean Waters. Mar. Coast. Fish. 2020, 12, 339–347. [Google Scholar] [CrossRef]
  33. Kessel, S.T.; Hussey, N.E.; Webber, D.M.W.; Gruber, S.H.; Young, J.M.; Smale, M.J.; Fish, A.T. Close proximity detection interference with acoustic telemetry: The importance of considering tag power output in low ambient noise environments. Anim. Biotelem. 2015, 3, 5. [Google Scholar] [CrossRef] [Green Version]
  34. R-Core-Team. R: A Language and Environment for Statistical Computing; R Foundation for Statistical Computing: Vienna, Austria, 2021. [Google Scholar]
  35. Pincock, D.G. False Detections: What They Are and How to Remove Them. Document DOC-004691, InnovaSea Inc., AMIRIX Systems: Halifax, NS, Canada, 2012; p. 14. [Google Scholar]
  36. Wickham, H.; Averick, M.; Bryan, J.; Chang, W.; McGowan, L.D.A.; François, R.; Grolemund, G.; Hayes, A.; Henry, L.; Hester, J.; et al. Welcome to the Tidyverse. J. Open Source Softw. 2016, 4, 1686. [Google Scholar] [CrossRef] [Green Version]
  37. Wickham, H. ggplot2: Elegant Graphics for Data Analysis, 2nd ed.; Springer-Verlag: New York, NY, USA, 2016. [Google Scholar]
  38. Koenig, C.; Coleman, F.; Malinowski, C.; Ellis, R.; Murie, D.; Parkyn, D.; Friess, C.; Tzadik, O. Regional Age Structure, Reproductive Biology and Trophic Patterns of Adult Goliath Grouper in Florida; NOAA Marine Fisheries Initiative (MARFIN) Project Final Report: Washington, DC, USA, 2016; p. 222. [Google Scholar]
  39. Bullock, L.H.; Murphy, M.D.; Godcharles, M.F.; Mitchell, M.E. Age, growth, and reproduction of jewfish Epinephelus itajara in the eastern Gulf of Mexico. Fish. Bull. 1992, 90, 243–249. [Google Scholar]
  40. Chapman, B.B.; Brönmark, C.; Nilsson, J.Å.; Hansson, L.A. The ecology and evolution of partial migration. Oikos 2011, 120, 1764–1775. [Google Scholar] [CrossRef]
  41. Chapman, B.B.; Skov, C.; Hulthén, K.; Brodersen, J.; Nilsson, P.A.; Hansson, L.A.; Brönmark, C. Partial migration in fishes: Definitions, methodologies and taxonomic distribution. J. Fish Biol. 2012, 81, 479–499. [Google Scholar] [CrossRef]
  42. Chapman, B.B.; Hulthén, K.; Brodersen, J.; Nilsson, P.A.; Skov, C.; Hansson, L.A.; Brönmark, C. Partial migration in fishes: Causes and consequences. J. Fish Biol. 2012, 81, 456–478. [Google Scholar] [CrossRef] [Green Version]
  43. TinHan, T.; Erisman, B.; Aburto-Oropeza, O.; Weaver, A.; Vazquez-Arce, D.; Lowe, C.G. Residency and seasonal movements in Lutjanus argentiventris and Mycteroperca rosacea at Los Islotes Reserve, Gulf of California. Mar. Ecol. Prog. Ser. 2014, 501, 191–206. [Google Scholar] [CrossRef]
  44. Rowell, T.J.; Nemeth, R.S.; Schärer, M.T.; Appeldoorn, R.S. Fish sound production and acoustic telemetry reveal behaviors and spatial patterns associated with spawning aggregations of two Caribbean groupers. Mar. Ecol. Prog. Ser. 2015, 518, 239–254. [Google Scholar] [CrossRef]
  45. Molloy, P.P.; Cote, I.M.; Reynolds, D.J. Why spawn in aggregations. In Reef Fish Spawning Aggregations: Biology, Research and Management; Sadovy de Mitcheson, Y., Colin, P.L., Eds.; Fish and Fisheries Series 35; Springer Science + Business Media: Berlin, Germany, 2012; pp. 57–83. [Google Scholar]
  46. Jonsson, B.; Jonsson, N. Partial migration: Niche shift versus sexual maturation in fishes. Rev. Fish Biol. Fish. 1993, 3, 348–365. [Google Scholar] [CrossRef]
  47. Coleman, F.C.; Koenig, C.C.; Collins, L.A. Reproductive styles of shallow-water grouper (Pisces: Serranidae) in the eastern Gulf of Mexico and the consequences of fishing spawning aggregations. Environ. Biol. Fishes 1996, 47, 129–141. [Google Scholar] [CrossRef]
  48. Ellis, R.D.; Powers, J.E. Gag grouper, marine reserves, and density-dependent sex change in the Gulf of Mexico. Fish. Res. 2012, 115, 89–98. [Google Scholar] [CrossRef]
  49. FWC. Goliath Harvest Program. Available online: https://myfwc.com/fishing/saltwater/recreational/goliath/#harvest (accessed on 21 May 2023).
  50. Coleman, F.C.; Nunes, J.A.C.C.; Bertoncini, A.A.; Bueno, L.S.; Freitas, M.O.; Borgonha, M.; Leite, J.R.; Lima-Júnior, M.J.C.A.; Ferreira, B.; Bentes, B.; et al. Controversial opening of a limited fishery for Atlantic Goliath Grouper in the United States: Implications for population recovery. Mar. Pol. 2023, 155, 105752. [Google Scholar] [CrossRef]
  51. Smith, N.P. Temporal and spatial characteristics of summer upwelling along Florida’s Atlantic shelf. J. Phys. Oceanogr. 1983, 13, 1709–1715. [Google Scholar] [CrossRef]
  52. Whaylen, L.; Bush, P.; Johnson, B.; Luke, K.; McCoy, C.; Heppell, S.; Semmens, B.; Boardman, M. Aggregation dynamics and lessons learned from five years of monitoring at a Nassau grouper (Epinephelus striatus) spawning aggregation in Little Cayman, Cayman Islands, BWI. Proc. Gulf Carib. Fish. Inst. 2006, 57, 1–14. [Google Scholar]
  53. Stock, B.C.; Mullen, A.D.; Jaffe, J.S.; Candelmo, A.; Heppell, S.A.; Pattengill-Semmens, C.V.; McCoy, C.M.; Johnson, B.C.; Semmens, B.X. Protected fish spawning aggregations as self-replenishing reservoirs for regional recovery. Proc. Roy. Soc. B 2023, 290, 20230551. [Google Scholar] [CrossRef]
  54. FWC. CORRECTION: FWC Suspended Discussions on Goliath Grouper Spawning Aggregation Site Protections. Available online: https://myfwc.com/news/all-news/goliath-com-523/ (accessed on 21 May 2023).
  55. Sadovy de Mitcheson, Y. Mainstreaming fish spawning aggregation into fishery management calls for a precautionary approach. BioScience 2016, 66, 295–306. [Google Scholar] [CrossRef] [Green Version]
  56. Malinowski, C.; Coleman, F.; Koenig, C.; Locascio, J.V.; Murie, D.J. Are Atlantic goliath grouper, Epinephelus itajara, establishing more northerly spawning sites? Evidence from the northeast Gulf of Mexico. Bull. Mar. Sci. 2019, 95, 371–391. [Google Scholar] [CrossRef]
Figure 1. Atlantic goliath grouper (Epinephelus itajara) and bait fish (unidentified species) swimming off the Florida Atlantic coast (USA) near an acoustic receiver mooring structure consisting of a truck-trailer brake drum anchor, 9.5 mm diameter stainless steel cable, and hard float buoys. Photo credit: K. Wall, FWC-FWRI.
Fishes 08 00398 g001
Figure 2. Main map shows the distribution of sites where tagged Atlantic goliath grouper (Epinephelus itajara) were detected (n = 153). Inset map shows the focal study area of goliath grouper FSA sites (n = 6) and tag sites (n = 3) located offshore of Jupiter, Florida, USA, with Florida state managed waters shaded grey.
Fishes 08 00398 g002
Figure 3. Total number of tagged Atlantic goliath grouper (Epinephelus itajara) detected daily in the FACT array, 2011–2014. Vertical dashed lines indicate the approximate dates of the new moon in August and September for each year. Note the change in y-axis scale between the periods 2011–2012 and 2013–2014.
Fishes 08 00398 g003
Figure 4. (A) Number of FACT Network member-monitored sites where tagged Atlantic goliath grouper (Epinephelus itajara) were detected monthly from 2011 to 2014. Values shown represent mean number of sites with validated detections for all tagged fish detected during each month, 2011–2014. Dashed line indicates the mean for all fish; x = 1.6 sites. (B) Cumulative distance moved (km) by acoustically tagged goliath grouper monthly, 2011–2014. Dashed line indicates the mean monthly cumulative distance moved for all tagged fish; x = 6.28 km. Error bars are ± SE.
Fishes 08 00398 g004
Figure 5. Detection data summaries of Atlantic goliath grouper (Epinephelus itajara) tagged off the Florida Atlantic coast from 2011 to 2014, related to FSAs. (A) Average number of spawning aggregation sites fish visited (mean ± SE); (B) Proportion of the number of spawning aggregation sites where tagged goliath groupers were detected annually from 2011 to 2014. (C) Average number of days with validated detections of tagged goliath groupers (mean ± SE) at one of the six verified spawning aggregation sites annually from 2011 to 2014.
Fishes 08 00398 g005
Figure 6. (A) Number of FACT Network member-monitored sites where tagged Atlantic goliath grouper (Epinephelus itajara) were detected between 30 May (day number 150) and 16 November 2011 (day number 320). Vertical dashed lines indicate the approximate dates of the full moons in July and August. (B) Number of tagged goliath grouper that were detected at the Zion Train spawning site between 30 May and 16 November 2011. Vertical dashed lines indicate the approximate dates of the new moons in August and September.
Fishes 08 00398 g006
Figure 7. (A) Number of FACT Network member-monitored sites with validated detections of tagged Atlantic goliath grouper (Epinephelus itajara) across fish length at time of tagging (cm TL); the slope of the linear regression line was significantly positive (number of sites = 0.073 × fish length − 8.07). (B) Minimum annual distance moved by tagged goliath groupers across fish length; the slope of the linear regression line is significantly positive (distance = 0.47 × fish length − 60.3). Outliers (>3 × SD) are indicated by the open circles.
Fishes 08 00398 g007
Figure 8. Frequency of minimum annual distance moved by female (n = 22) and male (n = 18) acoustically tagged Atlantic goliath grouper (Epinephelus itajara) along the Florida Atlantic coast.
Fishes 08 00398 g008
Figure 9. Monthly mean location (latitude) of each acoustically tagged Atlantic goliath grouper (Epinephelus itajara); the size of each bubble represents the number of detection days (DD) recorded for each tagged fish across each month from September 2010 to September 2019. Peak spawning months for goliath grouper (August to October) are denoted in blue, all other months are denoted in yellow.
Fishes 08 00398 g009
Figure 10. Kernel density plots of the likelihood of detecting a tagged Atlantic goliath grouper (Epinephelus itajara) at a given latitude during the spawning season (July to Oct), blue shaded region, versus non-spawning months (Nov to June), yellow shaded region, for the two detection time series: 2011–2014 (focal FSA sites and FACT Network sites) and 2015–2020 (FACT Network sites only).
Fishes 08 00398 g010
Table 1. Inter-annual site fidelity of acoustically tagged Atlantic goliath grouper (Epinephelus itajara) to the six FSA sites monitored during this study from 2011 to 2014.
Year
2011201220132014
No. fish detected34342613
No. fish detected at FSA site31322112
% of fish detected at FSA site91.2%94.1%80.8%92.3%
Table 2. Relative rank importance of the six monitored FSA sites based on the number of acoustically tagged Atlantic goliath grouper (Epinephelus itajara) detected there during the July to October spawning period, 2011–2014.
YearZion TrainThree HolesMG-111Sun TugGary’sHole-in-the-Wall
2011134256
2012142365
2013124436
2014124346
Table 3. Arrival date of acoustically tagged Atlantic goliath grouper (Epinephelus itajara) at one of the six monitored FSA sites located along the Florida Atlantic coast. Only individuals that were not already present at an FSA on 1 July are included here.
YearNo. FishMean Arrival Date ± SELatest Arrival Date
201119August 8 ± 4.520 September
201225August 2 ± 5.63 October
201314August 16 ± 7.714 October
20148August 11 ± 9.214 September
Disclaimer/Publisher’s Note: The statements, opinions and data contained in all publications are solely those of the individual author(s) and contributor(s) and not of MDPI and/or the editor(s). MDPI and/or the editor(s) disclaim responsibility for any injury to people or property resulting from any ideas, methods, instructions or products referred to in the content.

