Abstract
Changes in marine ecosystem dynamics have led to alterations in the availability of fish in established fishing grounds. Predictive models suggest their utility in understanding and predicting species distribution at varying depths and times of the year, significantly influencing regional fisheries management. Thus, access to information on oceanographic conditions, serving as a science-based decision-making support tool for artisanal fishers, has been identified as an adaptation strategy fostering social empowerment in the Colombian Pacific region. To address this need, an open-source WebGIS (geographic information system) was co-created to provide users with the results of species distribution models of marine fish species, aiming to expand knowledge of the ever-changing environment dynamics. The Chocó Artisanal Fishing Geovisor offers options for planning fishing operations and provides tools for understanding the results of species distribution models and resource management. By promoting informed decision making and community empowerment, it serves as a strategic response to marine environmental fluctuations, establishing itself as an essential tool for adapting to shifting marine conditions and ensuring food security.
Keywords:
species distribution models; predictive modeling; informed decision making; marine artisanal fisheries; Chocó; Colombian Pacific coast Key Contribution:
1. Our study demonstrates that predictive models significantly contribute to understanding and forecasting marine species distributions at different depths and times. This substantially influences regional fisheries management by providing a scientific information base to support decision making. 2. The Chocó Artisanal Fishing Geovisor; a tool developed through a research–community collaboration, provides updated oceanographic, climatic, and species distribution data. It equips artisanal fishers with technology-driven decision-making mechanisms.
1. Introduction
Fishing systems are complex and are usually subject to a series of internal and external dynamics, such as the diversity of available resources, the possibility and guarantee of access to inputs, market systems, support mechanisms or networks, and the scarcity and uncertainty associated with the activity itself [1]. These dynamics have led to the introduction of risk in fisheries management, associated with the effectiveness of fishing efforts and the increasing need for computer science and scientific capacity in studies and fishing applications [2,3].
Fishers, according to the perspectives of [4,5,6], are decision-makers who assume a behavior similar to that of “predators”, seeking food and sustenance in fishing sites such as fishing banks and fishing grounds while exploiting the resources on which they depend. These decision-making processes are influenced by resource availability, changing environmental conditions, fishing regulations, and the skills and potential of fishers, vessels, and their equipment [7,8,9]. The latter condition, for example, establishes the greatest difference between industrial and artisanal fishing types.
For industrial fishing, using acoustic radars (video and echo sounding) helps reduce uncertainty in detecting target fish [10,11]. In contrast, artisanal fishers in the Colombian context, who typically have less installed and acquired capacity and low investment, often carry out their work empirically and traditionally. For example, the methods used to detect schools of fish can be visual, through bird watching over areas of abundance [10] and observing dark spots on the ocean surface [11], or through transmitted and inherited knowledge, relying on the experience of their colleagues [12,13,14].
“Industrial fishing” and “artisanal fishing” coexist in the Colombian Pacific fishing sector. The former focuses on commercialization and, if possible, exporting. At the same time, the latter primarily contributes to food security and household sovereignty before marketing their products for the domestic market and supplementing industrial production [15]. It is estimated that at least 11,000 people engage in artisanal fishing in the Colombian Pacific [16], with over 55,000 people directly dependent on the activity in the region and at least 3000 participating on the Chocó Pacific coast, mainly in the municipalities of Nuquí, Bahía Solano, and Juradó [17].
The fishing activity in Chocó is supported by a high biodiversity of fish that are categorized as key to the balance of the ecological structure [16], standing out among the main target resource species of tuna, hake, dorado, and snappers, among others [18] that are usually caught with fishing gear such as longlines and handlines by artisanal fishers in the region.
Acanthocybium solandri, Scomberomorus sierra, Euthynnus lineatus, and Thunnus albacares are marine fish species that are widely distributed and possess significant fishing, commercial, and food security importance in the tropical Pacific and the Colombian Pacific [19]. A. solandri is a migratory species, typically solitary or forming small, loose schools. Its habitat spans the tropical waters of the Atlantic, Pacific, and Indian Oceans, where it preys on scombrids, porcupinefishes, flyingfishes, herrings and pilchards, scads, lanternfishes, other pelagic fishes, and squids. It is known that a mature female can release up to six (6) million eggs per spawning season [20]. For industrial fishing, this species is often caught incidentally as a bycatch of the tuna fishery [21]. However, artisanal fishing in the Colombian Pacific is intentionally caught for home consumption and commercialization.
S. sierra is a highly migratory species in the Pacific from southern California to Peru [22]. It inhabits coastal areas, often forming schools [23], and has a reproductive season in the Colombian Pacific between November and April [24]. E. lineatus is distributed in tropical and subtropical waters of the eastern Pacific Ocean, from California to northern Peru. It performs large-scale migrations and maintains a predominantly carnivorous diet that includes pelagic fish, mollusks, and crustaceans [25]. Its reproduction is heterosexual. Like E. lineatus, T. albacares is distributed throughout tropical and subtropical waters, performing crucial trophic migrations and reproduction in its life cycle. Its reproduction involves external fertilization and spawning in surface waters. In addition, this species is an active predator, mainly feeding on fish and squid [26].
Concerning the distribution dynamics of the target species, understanding the relationship between the species and its environment allows for the analysis of spatial patterns that happen at different geographic and temporal scales [27] and in different ways, such as changes in species’ preference ranges and community composition, longitudinal and/or latitudinal shifts of communities or ecosystems, and broader changes in ecosystem functioning [28].
For a species to be geographically distributed in a given location, ideal conditions must be guaranteed for the interaction of three factors: (1) the possibility and guarantee of dispersal, i.e., the species must be able to locate itself in the area; (2) the abiotic environment; and (3) biotic interactions, combining 2 and 3, the species must be compatible with the abiotic conditions of the location and with the species that inhabit it [29,30,31]. Given this, it is pertinent to ask what the effect of climate change on species distribution will be. Two currents of thought emerge:
The first, called “niche conservationism”, suggests that species do not change their climatic requirements. Consequently, in the face of environmental changes, they will alter their distribution (through perceptible variations in terms of longitude and latitude) to occupy places with conditions similar to their native or original habitat. If a species cannot “mobilize”, its geographical area could diminish or even lead to extinction [32].
The second, called “niche change”, suggests that species can vary their environmental requirements, allowing them to remain in the same place despite climatic changes or even expand to new habitats with conditions different from their native habitat [33]. These authors indicate that niche change can occur due to phenotypic plasticity, biotic interactions, changes in access conditions of a location, and/or the evolutionary adaptive response of environmental tolerance.
Based on the notion that the ecological niche “includes all the biotic and abiotic factors with which any organism is related, in a given time and space”, and considering that many of these dynamics are the indirect consequence of climate change effects, predictive models of species’ ecological niches have emerged [34,35]. These models are based on the analysis of the interaction between the environmental conditions of sites with known presences [36,37,38] and the influential environmental variables [39], aiming to understand and evaluate the suitability of the environment for the species of interest.
Scientists argue that the conception of science, technology, and innovation, as well as the dissemination of knowledge, influences the empowerment capacity of affected communities [40,41,42]. As a result, decision-making processes and the application of actions around problems or alternatives have recently tended to consolidate citizen participation. Bearing this in mind, the purpose of this study was to identify and analyze the spatial and temporal variation in the distribution of four species of recognized social and ecosystem importance in the region and to deliver the information to the target community—artisanal fishing households from the Chocó Colombian Pacific coast—in a clear, timely, and legible manner. This approach aims to contribute to more informed decision making, encourage the social appropriation of scientific knowledge, and promote local empowerment.
Understanding the distribution patterns of key species can provide valuable insights for the fishing community, enabling them to better adapt to environmental changes and optimize their fishing efforts. Moreover, involving the community in this research process and sharing the findings in an accessible manner fosters a sense of ownership and active participation in fisheries management and conservation efforts.
This research can also serve as a foundation for further studies examining the impact of climate change on fish species and ecosystems. By combining traditional knowledge with scientific research, we can develop more comprehensive strategies to ensure the long-term sustainability of fisheries and the well-being of communities that depend on them. Within the framework of the development and social appropriation of the open-source WebGIS, it was possible to identify the potentialities of the combined use of climatic and oceanographic data in near real time and species distribution as a result of an ensemble of SDM models, not only for their application in the context of planning fishing activities, but also, if not in the application of open science towards smart fishing for the Colombian Pacific, as an experience gained and replicable in various applications for the articulation of science, technology, and innovation.
2. Methods
2.1. Study Area—Area of Influence
The department of Chocó, located in western Colombia (Figure 1), corresponds to the largest of the biogeographic Chocó—an intertropical confluence zone between two natural barriers, namely the Western Cordillera and the Pacific Ocean (45.7% of the area of the region—132,083 km2)—and is inhabited in its majority by a cultural composition of Afro-Colombians and indigenous, 96% of which are distributed in the collective territory of 693 Afro-communities, grouped into 64 titled community councils and 125 indigenous reservations of the “Emberá” ethnic groups [43].
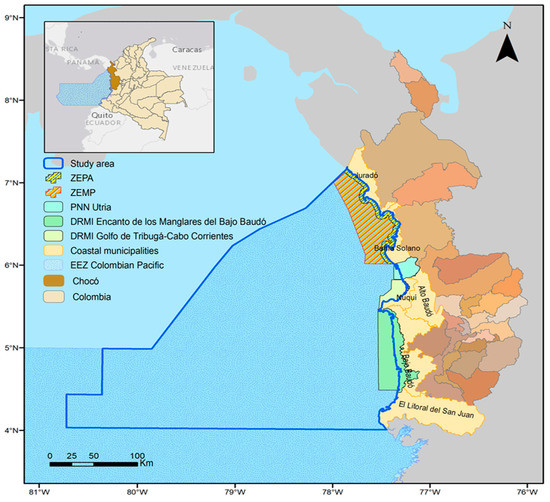
Figure 1.
Study area (blue polygon) in the department of Chocó in the Colombian Pacific. The yellow and orange dashed polygons show the Exclusive Artisanal Fishing Zone (ZEPA) and the Special Fisheries Management Zone (ZEMP) of Chocó, respectively.
The study area extends along the 748 km of the Pacific coast of the department of Chocó, forming a polygon of 79.5 km2, from the coastline to the furthest point offshore, reaching a length of 202 nautical miles (Figure 1). This area includes the municipalities of Juradó, Bahía Solano, Nuquí, Bajo Baudó, and El Litoral del San Juan, all of which are home to artisanal fishing activities that contribute to the economic livelihood and food security of coastal households in the region [44].
The oceanographic and coastal dynamics of the Chocoan Pacific allow for the characterization of the coast into two zones: (1) the north, which extends for around 473 km of coastline from Cabo Corrientes, a geographical feature, to the border with Panama in the municipality of Juradó and is characterized by an annual average rainfall between 5030 and 7700 mm; (2) the southern zone, from the rocky coast of Cabo Corrientes to the border with the department of Valle del Cauca [45,46], with a coastline of 275 km in length. This zone includes the marine-coastal area of Bajo Baudó and El Litoral del San Juan. It is characterized as a super-humid, warm region with a rainfall range oscillating between 6000 and 7500 mm per year. Thus, Chocó is characterized by being one of the most humid areas in the world and having a comprehensive genetic bank of flora and fauna [47].
Specifically, the coastal zone of the department is made up of some environmental units with special management characteristics and conditions (Table 1), where the Exclusive Zone for Artisanal Fishing (ZEPA; by its acronym in Spanish) and the Special Fisheries Management Zone (ZEMP) are particularly important for artisanal fisheries management, for its intention to improve economic activity, in addition to the conditions of the communities that make use of the resources, while seeking the permanence of the activity over time to feed future generations. For their part, the areas of the Utría National Natural Park (PNNU), Regional District of Integrated Management (DRMI) Gulf of Tribugá-Cabo Corrientes, and Regional District of Integrated Management “Encanto de los Manglares del Bajo Baudó”, which are part of the National System of Protected Areas (SINAP; by its acronym in Spanish), have use regimes according to the environmental zoning of each management plan.

Table 1.
Environmental units of the coastal zone of the department of Chocó.
Artisanal or small-scale fisheries in Colombia are crucial for coastal employment, providing both direct and indirect job opportunities, including fishing, processing, and distribution for self-consumption and wider marketing. The exact economic contributions of artisanal fishing are not thoroughly estimated, but in 2016, it contributed 15.9% to the GDP of the Chocó department, ranking third after social services and mining. The National Fisheries Authority’s 2019 census revealed that the Pacific region had 13,915 registered fishers, representing 42% of all registered fishers, with 2611 self-identified fishers in Chocó. These figures include both marine and freshwater fishers.
2.2. Species of Interest—Participatory Prioritization of Species and Identification of Traditional Fishing Grounds
Species of interest used in the modeling exercise and in the decision-supportive tool were selected in the participatory process described below. Using Colombia’s National Fisheries Statistics Service platform (SEPEC), data on key species in Chocó’s coastal zone were gathered to create a participatory survey assessing their fishing, commercial importance, and food security impact on artisanal fisher households, considering the national statistics of the contribution of artisanal fisheries in two types of approaches, namely catch landings by volume and landings of artisanal fisheries in collection sites of fishery production, to identify the most representative species in the regional context. A semi-structured survey identified significant species in Bahía Solano, Nuquí, and Bajo Baudó by asking about fishing practices, gear, and locations. Three social cartography maps were used to locate traditional fishing grounds in the northern Colombian Pacific zone, accounting for protected areas, coastal spatial management zones, and more. These maps helped recognize local fishing dynamics and assess ancestral knowledge. Additionally, georeferencing activities were conducted in Bahía Solano to aid in identifying fishing grounds. Through social cartography and participatory recognition, 58 artisanal fisher households provided input on 48 marine fish species, prioritizing those of interest for the study and creating a “fishing grounds” information layer with geographical attributes.
2.3. Forecasting Model Methodologies
Predictive models for species distribution analyze the interplay between known environmental conditions at specific locations [36,37,38] and influential environmental variables that enable inferences and simulations of ecosystem dynamics [39]. The ultimate goal is to assess and understand the environmental suitability of the species of interest. The following sections outline this process’s methodological steps and information sources (Table 2).
Table 2.
Sources of input data for predictive models of species distribution.
2.3.1. Species Occurrence and Pseudo-Absence Compilation
We established a comprehensive database of the species under investigation using national and international sources, such as the Smithsonian Tropical Research Institute’s Online Information System on Shorefish of the Tropical Eastern Pacific (https://biogeodb.stri.si.edu/sftep/es/pages; accessed on 30 September 2021), INVEMAR’s SiAM-Marine Environmental Information System (http://siam.invemar.org.co/; accessed on 10 September 2021), Global Biodiversity Information Facility (GBIF) (https://www.gbif.org/en/; accessed on 22 September 2021), and Ocean Biogeographic Information System (OBIS) (https://obis.org/; accessed on 13 September 2021) (Table 2). We downloaded and organized the presence/occurrence data of the study species into a database, consolidating information for each month and for each depth of interest, as explained in the subsequent sections (refer to Table 3). For the models of each species, we used an average of 308 occurrence data per depth mentioned in Table 3.
Table 3.
Prioritized species under study.
The data were preprocessed using the R software’s (Version 4.1.2; R.studio, PBC; Boston, MA; United States) “dplayer” and “CoordinateCleaner” libraries (https://cran.r-project.org/; accessed on 18 June 2022) [48] to eliminate duplicate coordinates or errors within the study area. Additionally, georeferenced data points were chosen to maintain a minimum distance of 1 km from each other, consistent with the spatial resolution of predictor variables [49]. This was accomplished using the “spThin” tool [50] to minimize spatial biases that could impact model predictions [51]. Pseudo-absence data were generated using the “Species Range Change” (SRC) method in the biomod2 package (https://cran.r-project.org/web/packages/biomod2/index.html; accessed on 25 July 2022) in R software, maintaining a 1:1 ratio with occurrences, considering that when using models based on machine learning, it is recommended to maintain these proportions between occurrences and pseudo-absences [52].
2.3.2. Environmental Predictor Variables
Following a principal component analysis (PCA) [53,54], we selected four physical predictors (temperature, salinity, U currents, and V currents) and three biogeochemical variables (net primary productivity, dissolved oxygen, and pH). Their relevance to marine ecosystems and the species under study and their use in previous modeling processes reported in the literature were considered [55,56]. We procured these variables and calculated their monthly averages over a ten-year climatology (January 2010 to December 2019), across 28 depth levels (0 to 266 m), from the Copernicus Marine Service portal (https://marine.copernicus.eu/; accessed on 15 April 2022). Physical variables were sourced from the Copernicus Marine Service Global Ocean Physics Reanalysis (GLOBAL_MULTIYEAR_PHY_001_030), while biogeochemical variables were obtained from the Copernicus Marine Service Global Ocean Biogeochemistry Hindcast (GLOBAL_REANALYSIS_BIO_001_029) (Table 2).
The data were included in the predictive modeling processes in their original form, but the spatial resolution of the physical (1/25°) and biogeochemical (1/4°) variables was scaled to 1 km using the bilinear interpolation method in the Climate Data Operators software (CDO, https://code.mpimet.mpg.de/projects/cdo/; accessed on 20 May 2022) [57]. This 1 km resolution, deemed optimal for regional studies [58,59], allows for more detailed distribution models.
2.3.3. Model Ensemble, Configuration, and Performance Evaluation
The potential distribution of prioritized species was predicted using an ensemble of nine predictive models, including five machine learning models (gradient boost models (GBMs), classification tree analysis (CTA), artificial neural networks (ANNs), random forest (RF), and maximum entropy (MaxEnt)) and four statistical regression models (functional data analysis (FDA), generalized linear models (GLMs), multivariate adaptative regression splines (MARSs), and generalized additive models (GAMs)) in the biomod2 package [60,61] of R software (https://cran.r-project.org/web/packages/biomod2/index.html; accessed on 25 July 2022). The models were chosen based on their individual predictive capacity and through the ensemble developed, as detailed below.
Initially, models were independently run using default package settings, with three cross-validations and two replicates per model. We allocated 75% and 25% of the species occurrence data for training and “true skill statistic” (TSS) testing, respectively [62,63]. TSS is a robust performance measure, superior to others [64,65], and has been used in evaluating ensemble models in past studies [66]. In the ensemble, we included models with TSS scores ≥ 0.7 [67,68], facilitating monthly potential distribution modeling across the 28 available depth levels of predictor variables. Ensemble models offer advantages over individual models, such as reducing bias associated with a single model [69]. This technique also enhances prediction [70,71].
The contribution and significance of each predictor variable indicated the relative importance of the variable in influencing the species distribution. This was determined by comparing the correlation coefficient between initial model predictions and predictions made from random data permutations for each predictor variable [60]. We first calculated the average contribution of each variable and then normalized the data so that the sum of all variables’ importance equaled 1 [49,72].
2.4. Decision-Support Tool—Accessible Scientific Information for Empowering Communities
As part of the effort to develop adaptation strategies for artisanal fishers in the region, taking into account the changing dynamics of economic and livelihood activities and promoting science-based decision making, a WebGIS project was conceptualized, designed, co-created, and delivered to the community. This integrated and articulated services according to the functional requirements of the end users. The development of WebGIS involved a 10-stage co-creation process:
- (1)
- Benchmarking: National and international geovisors for managing and visualizing oceanographic information were analyzed to identify common characteristics and functionalities for implementing a WebGIS tailored for Chocó’s artisanal fishers. These functionalities were later explored with the target community using a participatory approach.
- (2)
- Conceptualization and design of corporate identity: In order to conceptualize and design the corporate identity for the WebGIS project, three community meetings were organized in Bahía Solano, Nuquí, and Bajo Baudó (Pizarro), with the participation of 80 artisanal fishers. These meetings aimed to gather information about the participants’ perceptions and co-create the project’s corporate identity. Activities were conducted to define a name, co-create a logo, identify desired colors, and select representative phrases, figures, and images related to the fishing activity and the regional identity. Information on ancestral knowledge related to the moon and tides’ influence on fishing activities was also collected during these meetings.
- (3)
- Architecture and functionalities: The architecture was structured with open-source components to ensure transparent interoperability with other open and commercial systems. Backend and front-end functionalities were determined (Figure 2), utilizing open-source tools such as PostGIS, PostgreSQL, LeafletJS, Node.js, and Geoserver, as well as a framework and Docker for rapid application deployment and system security.
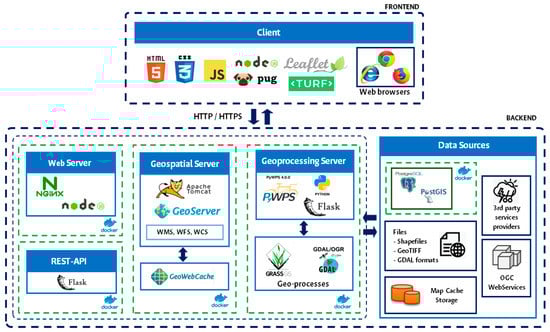 Figure 2. Architecture of the Chocó Artisanal Fishing Geovisor.
 - (4)
- Structuring of databases: A repository was structured in the PostgreSQL database to store results published through interoperable web services using WMS.
- (5)
- Integration of applied research results: An extraction, transformation, load (ETL) process was employed to structure and articulate primary databases, integrating workflows into custom ETL scripts developed in Python 3.8.
- (6)
- Development of geoprocesses and advanced functions: Tools and functions for the visor were co-created based on the information needs of artisanal fishers, such as recording information, species markets, travel costs, and species distribution probability and models. Basic functionalities like changing layer display and map scrolling were also added.
- (7)
- Usability tests: Three community meetings were held in Bahía Solano, Nuquí, and Bajo Baudó (Pizarro) with 51 artisanal fishers to identify processes to improve WebGIS access and navigation through user perception. A total of eight (8) activities were assigned to participants, consisting of unsupervised tasks with varying levels of difficulty, as follows: Activity 1—explore all the contents of the main page; Activity 2—create a user account in the Geovisor; Activity 3—interact with the map and its tools; Activity 4—interact with the map interface, tools, and menus; Activity 5—interact with control layers; Activity 6—send a message; Activity 7—interact with distribution models; and Activity 8—evaluate their performance in carrying out the assigned tasks on a scale of 1 to 5, where 1 corresponds to “Very dissatisfied”, 3 to “Neutral”, and 5 to “Very satisfied”.
- (8)
- Verification and implementation of improvements: Results of the usability tests were analyzed, and functionalities were integrated to enhance the user experience in accessing, viewing, and presenting geographic results and exploring the tool.
The system was developed in the backend and the front end. The backend involved server-side development, which included implementing the file system for storing geographic content, creating the database, using the map server system, and creating the API REST service. It also involved part of the controller of the MVC pattern. The main functions of the backend were to simplify the development process, perform logical actions, connect to the database, and use web server libraries. On the other hand, the front end consisted of programming the mobile application, which represented the view and controller parts of the MVC pattern. The graphical user interface, or UI, was designed based on simplicity, clarity, familiarity, coherence, and speed principles. This involved building the UI based on the chosen framework and libraries, using universal icons, naming menu and action elements, following the style guide, and encouraging user familiarity with the interface.
- (9)
- Institutional domain and migration to a free access web environment: The Universidad Nacional de Colombia sub-domain was defined as the executing entity, and the WebGIS platform was migrated to provide free access. Adapting distinctive elements according to the higher education public entity’s Institutional Image Use Manual in Colombia was required.
- (10)
- Training and social appropriation of the system: A participation strategy was created through training sessions to improve fishing operation efficiency and, consequently, fishers’ quality of life. During these sessions, the target community was provided with a didactic primer, short videos, and a detailed user manual that compiled the functionalities of all available tools for interaction and appropriation by the fishers.
3. Results and Discussion
3.1. Species of Interest—Participatory Prioritization of Species
As a result of secondary information collection, species from the Scombridae family were identified as significant contributors to the landings of fishers in the Pacific region of Chocó. Meanwhile, through the application of participatory mechanisms described above—primary information collection—four tuna species were prioritized (Table 2). These species are of particular importance due to their significance in capture, commercialization, and inclusion in the diets of fishing households in Chocó, and they are the focus of this study.
For instance, in the Eastern Pacific, industrial-scale captures primarily focus on tunas, especially those from the Scombridae family, which are considered the most important [73]. Nevertheless, in the Chocó Pacific Coastal Environmental Unit (UAC-PNCh), artisanal fishing primarily targets species such as tuna, billfish, hake, dorado, and snapper [74].
Although the species were modeled at all available depth levels according to the predictor variables, the depths listed in Table 3 were given special consideration. These depths were chosen based on changes relative to the thermocline and model performance and following previous studies that related distribution dynamics in the water column to the biological preferences of each species.
3.2. Species Distribution Models
3.2.1. Performance/Evaluation of Predictive Models
Figure 3 illustrates the performances of the ensemble models evaluated through cross-validation. The models for Acanthocybium solandri, Scomberomorus sierra, and Euthynnus lineatus yielded results above 0.9 (red horizontal reference line) across all months and depths for each species. In contrast, some assembly models built for Thunnus albacares displayed yields between 0.8 and 0.9, particularly at the third depth of 222 m. This decrease for the Thunnus albacares assemblage—compared to the other species—may be attributed to the number of occurrence records used as input data [75,76], and other factors potentially influencing the species’ geographic range and environmental tolerance [77].
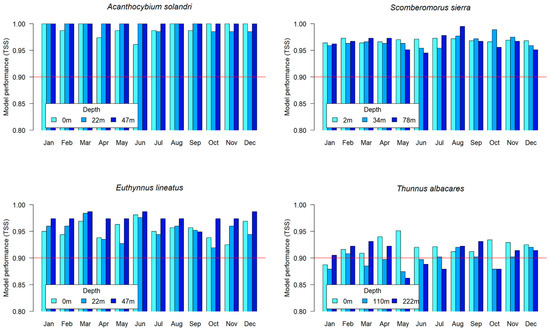
Figure 3.
Evaluation of the ensemble models by means of the true skill statistic (TSS) for each of the species.
For all species, the TSS test ranged between 0.8 and 1, generally outperforming individual models (Supplementary Materials Tables S1–S4). Consequently, these types of models have in general good predictive performance. For example, in recent applications in the Colombian Pacific, an ensemble comprising ANN, MaxEnt, GBM, RF, and CTA models demonstrated good performance [78]. Additionally, individual applications of MaxEnt and GBM models also yielded favorable results [79,80] for the Colombian Pacific geographic area.
3.2.2. Identification and Analysis of Potential Distribution and Variable Contribution
The following sections detail the results from applying prediction models to identify the potential distribution of the four prioritized tuna species under study and the relative importance of each predictor variable in the model, including temperature (T), salinity (S), pH, dissolved oxygen (O2), net primary production (nppv), U currents (Cu), and V currents (Cv).
Acanthocybium solandri
At a 0 m depth, the models showed that Acanthocybium solandri has a wide distribution in January, February, August, and October, with a probability of occurrence exceeding 60% in oceanic waters. In the remaining months, the high probability of occurrence values were limited to the coastal zone (Figure 4). These models’ most significant contributing variables were salinity, ranging from 11% to 36% across all months, and net primary production, contributing 10% to 21% in all months. Temperature, with notable contributions in May (18%) and December (19.5%), and U currents, with contributions over 20% in July and August (Figure 4), were also significant.
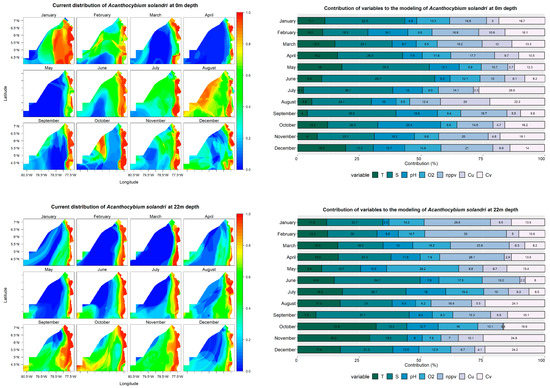
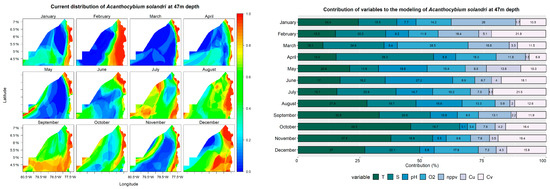
Figure 4.
Predictive models and performance of the variables (temperature—T; salinity—S; pH; dissolved oxygen—O2; net primary production—nppv; U currents—Cu; V currents—Cv) for the potential distribution of Acanthocybium solandri at 0, 22, and 47 m depths.
The probability of A. solandri at a depth of 22 m exceeded 40% throughout the study area during September, October, and November. In other months, the high probability of occurrence values were mainly located in a strip parallel to the coastline. Salinity remained one of the most significant contributing variables in models built at this depth, surpassing 10% throughout the year. Other notable variables include net primary production, with contributions above 28% in the first four months; temperature in October and November, contributing over 28%; and V currents, contributing more than 20% in November and December (Figure 4).
At a depth of 47 m, A. solandri exhibits a high probability of occurrence (>60%) both in a strip parallel to the coastal zone and in oceanic water areas from May to December. However, these values are concentrated in strips parallel to the coastal zone from January to April. The most significant variables contributing to the models at this depth were temperature and salinity, with their contributions exceeding 10% in all months. Additionally, other variables had contributions greater than 10% in some months (Figure 4).
The importance of the variables shows that salinity and net primary production are the variables that determine the species distribution, although temperature is also highlighted, which increases in importance as one descends in the water column. In a previous study on the distribution of A. solandri, a similar result was obtained, where temperature and chlorophyll were the variables that determined the species distribution; the probability of capturing the species increases when specific conditions of these variables are met [81]. In the Chocó Pacific, the environmental conditions for A. solandri are mainly present along the coastal zone, where high probabilities of occurrence are located, as corroborated by artisanal catch records of the species in Bahía Solano and the Utría National Natural Park [82].
The spatial distribution of A. solandri within the environmental units of the Pacific coast of Chocó reveals that the probability of species occurrences is greater than 60% at all three depth levels throughout the year in both the Special Fisheries Management Zone and the Exclusive Zone for Artisanal Fishing, located in the northern zone. This pattern also occurs in the central–southern part, where the “Utría” National Natural Park, the “Golfo de Tribugá-Cabo Corrientes” DRMI, and the “Encanto de los Manglares del Bajo Baudó” DRMI are situated. These results indicate that the species can be found in areas under exploitation regimes, special management, and conservation.
The overlap of high occurrence values on the ZEMP and ZEPA environmental units indicates the importance of generating adequate fishing resource management. It is necessary to establish sustainable exploitation to maintain food security for the population that depends on fishing. On the other hand, the overlap of high occurrence values of species in the areas defined by Colombia’s National System of Protected Areas may be an indicator of the ecological importance of these areas; these would be the spaces where the protection of species is ensured, maintaining an ecosystem balance.
Scomberomorus sierra
The distribution models constructed for Scomberomorus sierra at a depth of 2 m reveal that the species primarily inhabits the coastal zone, where the probability of occurrence is 100%. Only in January and February can areas with higher probabilities (>40%) be observed farther from the coast (Figure 5). Net primary production, which contributes between 29% and 33% in the first four months of the year, is the second most significant contributing variable, ranging between 30% and 64% across all months. Moreover, the pH variable contributed more than 10% in the last four months of the year, and V currents presented contributions of more than 10% in August, September, and October (Figure 5).
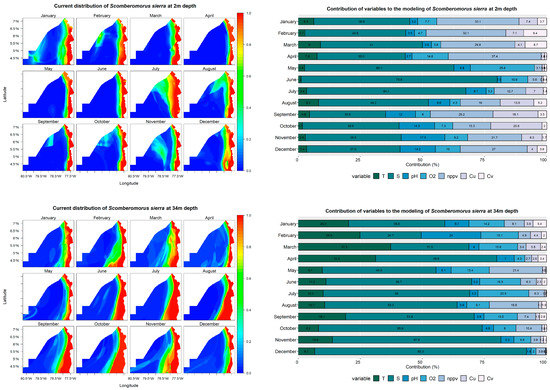
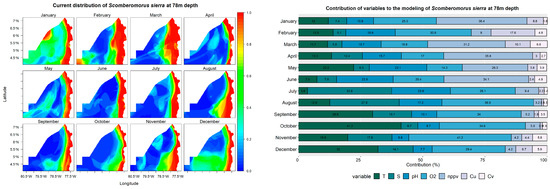
Figure 5.
Predictive models and performance of the variables (temperature—T; salinity—S; pH; dissolved oxygen—O2; net primary production—nppv; U currents—Cu; V currents—Cv) for the potential distribution of Scomberomorus sierra at 2, 34, and 78 m depths.
At a depth of 34 m, the species maintains a high probability of occurrence (100%) throughout the year, forming a strip parallel to the coastline. However, from June to November, the area with a high probability of occurrence values expands, reaching 78.5° W in the southern section. Salinity remains the most significant contributing variable in the models created at this depth, with contributions between 24% and 85%. October, November, and December are the months with the highest contributions. Temperature contributes more than 20% in the first four months of the year (Figure 5).
According to the models at a depth of 78 m, S. sierra displays a high probability of occurrence in a strip parallel to the coast, reaching up to 79° W in February and March. Furthermore, it was observed that in January and February, there are high probabilities of encountering the species in oceanic waters at latitudes of 6° N and 4° N, respectively. The variables that contributed the most to the models at this depth were O2, with contributions between 14% and 41% across all months; net primary production, with contributions greater than 25% in January, March, April, May, and June; and pH, with contributions greater than 10% from January to August.
In the Chocoan Pacific, the distribution of S. sierra would be defined by the behavior of the variables salinity, net primary production, and temperature due to their significant contributions to the models. In previous studies on the distribution of the species, a relationship between temperature and chlorophyll and the distribution of the species has also been found [79,83]. On the other hand, models applied to this species in the Colombian Pacific also resulted in the species maintaining a distribution regime in areas close to the coast [78,79]. The distribution results are consistent with sighting and capture records in the Chocoan Pacific [82,84].
The probability of occurrence of S. sierra at all three depth levels is high (>80%), throughout the year, in the areas that include the Special Zone for Fisheries Management and the Exclusive Zone for Artisanal Fishing, located in the northern part of the study area. Similarly, this occurs in the Utría National Natural Park, the DRMI Golfo de Tribugá-Cabo Corrientes, and the DRMI Encanto de los Manglares del Bajo Baudó, which are distributed from the center to the south of the coastal zone. The results demonstrate that the species is distributed almost homogeneously, maintaining a high probability of occurrence in both ecosystem protection areas and regions designated for the exclusive use of artisanal fishing.
The high probability of S. sierra’s occurrence over the environmental units within the study area underscores the importance of environmental zoning. This process is crucial for developing fishery management policies for sustainable resource exploitation. Such a strategy ensures resource stability and guarantees the persistence of ecosystem services over time.
Euthynnus lineatus
Euthynnus lineatus is a pelagic species widely distributed worldwide in tropical and subtropical waters [85]. Studies of the distribution of E. lineatus in this zone have indicated that its presence is frequent in the coastal zone at depths of up to 0 m, and a greater abundance has been observed in the months of May to September [86]. However, from June to November, the species has been recorded moving into deeper waters, reaching depths of up to 150 m. These changes in the spatial distribution of E. lineatus may be related to environmental factors, such as water temperature, food availability, and salinity [87].
The prediction models indicate that Euthynnus lineatus is frequently found in the Pacific coastal zone of Chocó at a depth of 0 m. However, it shows movements toward the open sea in January, June, July, August, and November, which coincides with the results presented in [86].
Regarding the variables influencing the presence of the species, it was found that net primary production contributed significantly, exceeding 33% in all cases during January, February, March, and April. Salinity is also important during June, July, and August. In addition, net primary production was a determining factor in January, March, and April, while pH contributed more than 30% during October, November, and December (Figure 6).
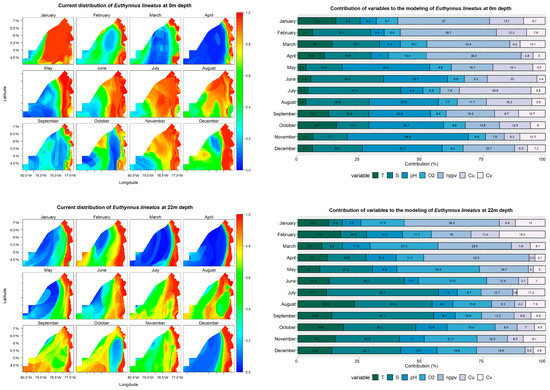
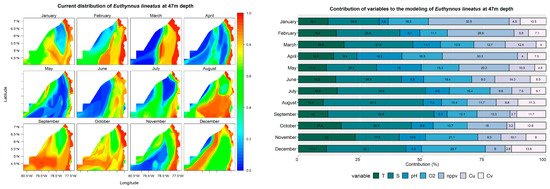
Figure 6.
Predictive models and performance of the variables (temperature—T; salinity—S; pH; dissolved oxygen—O2; net primary production—nppv; U currents—Cu; V currents—Cv) for the potential distribution of Euthynnus lineatus at 0, 22, and 47 m depths.
The prediction for E. lineatus at a depth of 22 m presents a probability greater than 0.9 in areas close to the coast. However, it has been observed that from June to November, the probability of its occurrence moves towards deeper waters. Regarding the analyzed variables, salinity was significant from June to December, reaching its greatest relevance in July and September (Figure 6).
According to the prediction models developed at a depth of 47 m, the distribution of the species presents variations with respect to the coast in August, September, and October, as it moves towards the open sea with probabilities greater than 0.7. On the other hand, during March, April, May, and November, prediction values greater than 0.8 are observed in areas close to the coast. Regarding the variables influencing the model, salinity presented a significant contribution from July to December, with percentages higher than 28%.
The results show that the distribution of this species at the analyzed depth levels has a high probability of occurrence (greater than 0.8) in areas close to the coast. When combining these results with the areas occupied by the environmental units in the Chocoan Pacific, it is observed that they overlap with important areas of the National System of Protected Areas of Colombia, located in the north-central zone, such as the PNN of “Utría”, the “Golfo de Tribugá-Cabo Corrientes” DRMI, and the “Encanto de los Manglares del Bajo Baudó” DRMI. These results may be indicative of the positive impact on zoning and environmental management that government authorities and the community exercise; in turn, they suggest the importance of implementing adequate conservation and management measures in terms of spatial management of protected areas and the implementation of sustainable artisanal fishing in the geographical context that is allowed, all of this given the need to protect marine biodiversity and the communities that depend on it in harmony with the environmental zoning established in their Environmental Management Plans.
Regarding the environmental units of the northern zone (ZEMP and ZEPA), there is also an overlap with the results of the highest probability of presence, which raises the need to implement and adopt management measures in line with the policies and strategies for use of these areas, such as the use of appropriate gear and for selective fishing and harvesting in regulatory sizes, to contribute to the sustainability and growth of biological communities.
Thunnus albacares
The predictive models employed in the study area demonstrated a remarkable performance exceeding 88% in predicting the distribution of Thunnus albacares across all modeled depths. Many factors, including bathymetry, chlorophyll-a concentration, sea surface temperature (SST), slope, and the interaction between SST and chlorophyll-a concentration, contribute to the abundance of this species. Moreover, research suggests that the species has a stronger affinity for shallow, warm waters with elevated primary production, higher chlorophyll-a concentrations, and complex bottoms such as rocky reefs [88,89].
At a depth of 0 m, the species is predominantly found along the coast from March to October. However, from November to December, its distribution expands towards areas farther from the coast. Intriguingly, a 100% occurrence probability was observed in the coastal strip, and the assemblage performance exceeded 89% in all months. At this depth, the net primary productivity significantly influenced the species distribution during January (40%), February (48%), and March (31%). Conversely, temperature was the dominant variable in April (31%), May (70%), June (50%), July (38%), and August (31%). Lastly, pH played a crucial role in November (37%) and December (36%) (Figure 7).
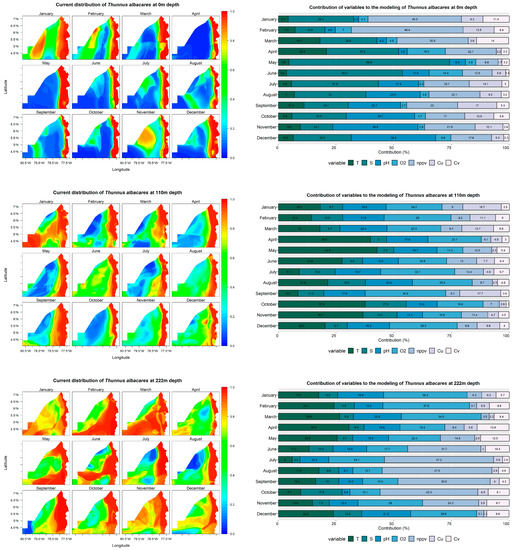
Figure 7.
Predictive models and performance of the variables (temperature—T; salinity—S; pH; dissolved oxygen—O2; net primary production—nppv; U currents—Cu; V currents—Cv) for the potential distribution of Thunnus albacares at 0, 110, and 222 m depths.
The species was found to extend towards waters further from the coast throughout the year at a depth of 110 m, with an ensemble performance surpassing 88%. The data reveal that during January, February, and March, O2 and pH exerted the most significant influence at this depth. Additionally, temperature was a key factor in April (40%), May (43%), June (28%), October (38%), and November (37%) (Figure 7).
Finally, the predictive models displayed a performance above 88% in the ensemble at a depth of 222 m, with the species distribution extending towards waters far from the coastline, predominantly in February, March, June, and November. In terms of variable importance, dissolved oxygen had a more substantial impact in January (36%), February (38%), March (35%), November (28%), and December (29%), while temperature also presented notable values during these months (Figure 7). Net primary production was another essential variable in June (32%), July (47%), August (48%), September (40%), and October (42%).
The findings for T. albacares across the three depth levels exhibit a probability greater than 0.8 in areas near the coast that coincide with the initially described environmental units of the Chocó department. This includes special management areas, exclusive zones for artisanal fishing, and SINAP areas. As a result, the importance of implementing and adopting effective management and conservation measures per the policies and strategies for these areas is once again highlighted, ensuring the sustainability of marine resources and their responsible use. Furthermore, in SINAP category areas, embracing suitable conservation and management measures is crucial for protecting biodiversity and guaranteeing food security for local communities, all within the context of established environmental zoning provisions in Management Plans.
3.2.3. Probability of Occurrence of Species around the Main Fishing Grounds
Concerning traditional or customary fishing sites, banks, and grounds in the region, 69 were identified. These sites were divided into three geographic zones based on the distribution of maps used for social cartography: the northern zone between “Juradó” and “Punta de San Francisco Solano”, the central zone from “El Valle” to “Cabo Corrientes”, and the southern zone from “Cabo Corrientes” to the San Juan River boundary along the San Juan Coast.
The results highlight the significance of these traditional fishing sites, which are rooted in the inherited and cultural knowledge of the artisanal fishing communities. It was possible to discern that the probability of occurrence for Acanthocybium solandri and Euthynnus lineatus follows a spatiotemporal dynamic, with their presence shifting throughout the year. In contrast, according to the developed predictive models, Scomberomorus sierra and Thunnus albacares exhibit more stable behavior across all identified fishing sites in the region (Figure 8). However, artisanal fishers frequently target Thunnus albacares along the Pacific coast of the Chocó department in areas farther from the coast (at distances greater than 20 nautical miles from the shoreline). This distribution is subject to territorial fishing dynamics and depends on the fishing gear and autonomy of the local community.
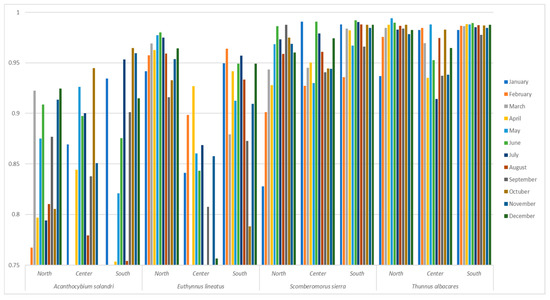
Figure 8.
Upper quartile (75%) of the probability of occurrence around the fishing grounds.
3.2.4. General Considerations for Predictive Models of Species Distribution
Regarding the biogeochemical variable pH, the literature suggests that species are distributed within specific ranges of variables, and a pH change can substantially affect organisms’ survival [90,91]. Moreover, pH is intricately linked to the availability of other nutrients and elements in the water column. It influences these elements’ solubility and biological availability, affecting the productivity of primary producers and the entire food web. This connection can indirectly shape fish distributions by affecting their prey availability.
In general, for the predictive distribution models developed, it is important to highlight that other potential factors, such as biotic interactions and time-lagged variables like SST, chlorophyll-a concentration, bottom features of the habitat, and prey predation relations, can have potential implications for the distribution of the four target species under study [92,93].
In particular, the idea of a time lag in chlorophyll-a concentration’s impact on higher trophic levels is compelling [94]. It aligns with the trophic delay or accumulation concept, where nutrients at lower levels of the food chain might not be immediately evident in higher trophic levels due to processing time through the food web. However, it is also widely accepted that these time lags may vary among different species and regions, making it difficult to generalize or assume a specific time lag applicable to the target species [95,96]. In addition, given the mobility of the species and the ocean’s vastness, the assumption of real-time environmental conditions as a significant determinant of species distribution remains valid.
In any case, the incorporation of such factors into the predictive model would require additional data and complex modifications of the model structure that go beyond the scope of the current study, but would certainly be valuable directions for future research.
3.3. Decision-Support Tool—Accessible Scientific Information for Empowering Communities
The “Chocó Artisanal Fishing Geovisor” is an open access WebGIS tool that offers options for planning fishing operations and tools to understand distribution models and resource management outcomes for fishing interest. As a result, communities can access near-real-time oceanographic and habitat distribution data for vital commercial species on the North Pacific coast of Colombia (in the Chocó department). The web tool incorporates various GIS operations, from basic functions such as visualization, superimposition, and selection to advanced queries and data processing operations essential for informed decision making in changing climate conditions and artisanal fishing practices.
This tool enables straightforward interaction for the target community. The architecture is structured with user-friendly, easy-to-use open-source components and transparent interoperability with other open and commercial systems. It consists of a three-layer representation: interface, model, and data, as follows:
- The interface layer displays user data across various platforms like the web, desktop GIS, and mobile devices. System management is conducted through this layer according to assigned roles.
- The model layer contains all processes that enable the functionality of each system tool, including data processing, report graph generation, and information analysis and consultation.
- The data layer stores binary files, flat files, and the database engine, the latter managing spatial and non-spatial information.
As a result of the “Co-creating the Geovisor for Chocó Artisanal Fishermen” workshop meetings, the fishers’ perceptions, fishing gear and instruments representing them, and the colors they most identify with (Figure 9) and the graphic elements in terms of conceptualization and design of the corporate identity for the “Chocó Artisanal Fishing Geovisor” (Figure 10) were established. From these meetings, the name, logo, iconography, colors, and keywords were designed within the Geovisor interface structure, allowing for the identification and visualization of figurative and representative elements of the region’s artisanal fishing activity (Figure 10).
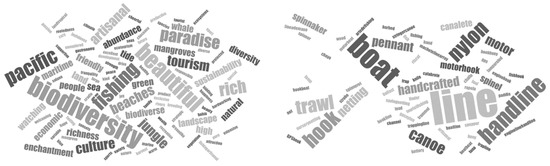
Figure 9.
(Left) Conceptual perception of marine artisanal fishers on the Pacific coast of Chocó. (Right) Instruments and fishing gear that represent the marine artisanal fishers of Chocó.
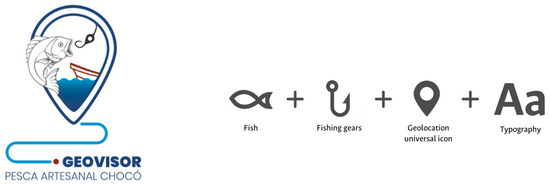
Figure 10.
Logo of the Chocó Artisanal Fishing Geovisor and identification of its key elements.
The “Chocó Artisanal Fishing Geovisor” (Figure 11) features a structure and development that include base layer controls with maps such as marine topographic relief (The General Bathymetric Chart of the Oceans (GEBCO) 2020), satellite view, and ocean maps (Environmental Systems Research Institute (ESRI) Ocean Base Map). It also uses internal and external sources, such as geo-services of the Colombian Pacific Economic Exclusive Zone (EEZ), study areas, reference sites, distances from the coast, bathymetric contour lines, conservation and environmentally protected areas, climate maps, and physical and biogeochemical variables, such as sea surface temperature, surface current velocity, sea surface salinity, chlorophyll-a concentration in seawater, and net primary production. In addition, layers co-created with the fishing community, such as common fishing grounds and sites, have also been integrated, particularly emphasizing the importance of empirical, traditional, and inherited knowledge of Chocó’s artisanal fishers.
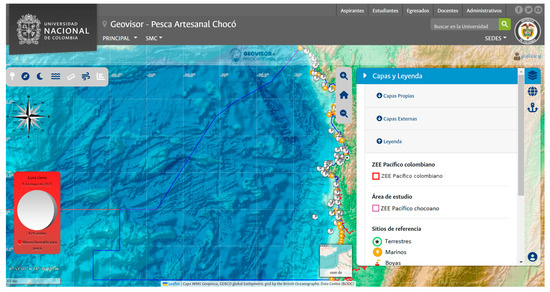
Figure 11.
Chocó Artisanal Fishing Geovisor user interface.
To enhance the user experience, navigation and information management tools were created for quick access, including zoom-in/out controls, wind and nautical roses, and distance and angle measurement tools in the International System of Units, prioritizing units commonly used by the target community. Additionally, essential information tools for fishing operations frequently consulted by fishers, such as moon phases, tide projections, and wind maps, were incorporated.
The Geovisor offers a broad array of functionalities and features tailored specifically to cater to the fishing community in the Chocó region. This visualization tool enables users to access comprehensive geographic and cartographic data, including oceanic and tidal characteristics crucial for efficiently planning and implementing fishing activities.
The primary functionalities of the Geovisor include the following:
- Visualization of geographic and cartographic data layers, along with oceanic and tidal information.
- Access to data on conservation and environmental care zones, reference sites, distances from the coast, bathymetric contour lines, and specific fishing areas, among others.
- Using the coordinate system and tools to measure angles and distances and navigate to different areas.
- Real-time data on tides and moon phases are key factors in fishing activity.
- Geoprocessing tools allow users to maintain a georeferenced record of fishing sites and compute travel expenses.
- Potential distribution maps of modeled species, enabling users to visualize and analyze the probability of the presence of priority species.
These features are user-friendly and display well on various devices, such as mobile phones, tablets, and computers.
The “Chocó Artisanal Fishing Geovisor” includes tools such as the market price and fishing trip cost calculator, allowing fishers to plan their fishing routes efficiently by considering fuel costs and expected travel times. These tools can be combined with others that provide relevant biological dynamics information, such as technical sheets of prioritized species, predictive distribution models, and the lunar calendar, facilitating comprehensive planning of fishing activities during specific and relevant periods.
The co-created WebGIS tool equips artisanal fishers with a wide range of tools and data to achieve their goals based on scientific information, as well as the ability to utilize various functions that help improve their fishing strategies and gain a competitive edge in the region. The opportunity to analyze the dynamics of environmental variables affecting fishing, such as water temperature, salinity, and ocean currents, is particularly important for planning fishing operations and contributing to decision making regarding safety during execution. As a result, this information can be used to predict fish locations and adjust fishing strategies accordingly.
In summary, the “Chocó Artisanal Fishing Geovisor” provides an accessible and user-friendly platform for empowering artisanal fishing communities, enabling them to make data-driven decisions and optimize their fishing practices. By incorporating local knowledge and addressing the community’s specific needs, this tool contributes to sustainable fishing and promotes the well-being of Chocó’s artisanal fishers.
Finally, in order to establish possible limitations to the scope of this study, if one considers the context and scope of the information that, through international cooperation agencies, makes geographical information available for decision-making processes worldwide, it could be said that the use of a regional ocean modeling system (ROMS) could have constituted a source of information for a better scale of processing and analysis; however, such a system was not available for the geographic area of the Colombian Pacific and the coast of the department, so the input data of the model are made up of the best possible sources of information at the temporal and spatial resolution that the level of processing that is modified thus allows.
On the other hand, as an experience gained, we highlight the feasibility and possibility of combining the use of a global dataset (databases of occurrence and predictor environmental variables) with data from national sources and information collected and validated with the approach of participation of artisanal fishers as the target community of the study, for the development of automatic learning processes (in species distribution models and the creation of WebGIS).
4. Conclusions
The results of this study indicate that Acanthocybium solandri is broadly distributed along the Pacific coast of Chocó. Its probability of occurrence is higher in oceanic waters during January, February, August, and October at a depth of 0 m and in September, October, and November at 22 m. At a depth of 47 m, the probability of occurrence is high in both oceanic waters and strips parallel to the coastal zone. Salinity, net primary production, and temperature are the variables that contribute the most to the species distribution, and their importance varies with depth.
Scomberomorus sierra is primarily found in the coastal zones, with a 100% occurrence probability at 2 m depth and in a strip parallel to the coast at greater depths. Net primary production, pH, and salinity are the three factors influencing distribution models at all depths. Additionally, temperature and oxygen are also key variables affecting the species distribution during different months of the year.
The pelagic species Euthynnus lineatus is widely distributed in tropical and subtropical waters worldwide. It frequently appears in the coastal zone at depths up to 0 m and has greater abundance from May to September. Nevertheless, the species moves towards deeper waters, reaching up to 150 m from June to November. These shifts in the spatial distribution of E. lineatus may relate to environmental factors like water temperature, food availability, and salinity.
Bathymetry, chlorophyll-a concentration, sea surface temperature, slope, and the interaction between SST and chlorophyll-a concentration are factors affecting Thunnus albacares distribution. Notably, the species is associated with shallow, warm waters with high primary production and complex bottoms, such as rocky reefs. At a 0 m depth, the species is associated with the coast from March to October, and from November to December, it extends towards the open sea.
The predictive models suggest their utility in understanding and predicting species distribution at varying depths and times of the year, significantly influencing regional fisheries management. Species distribution is primarily concentrated in the Special Fisheries Management Zone and the Exclusive Zone for Artisanal Fishing in the northern zone of the Pacific coast of Chocó, and the conservation and management areas of the Utría National Natural Park, the “Golfo de Tribugá-Cabo Corrientes” DRMI, and the “Encanto de los Manglares del Bajo Baudó” DRMI. The overlap of high occurrence values in protected areas emphasizes these areas’ ecological importance as species habitats and underscores the need for sustainable fishing practices.
The “Chocó Artisanal Fishing Geovisor” seeks to enhance fishing resource management by offering updated information on the oceanographic, climatic, and current distribution of commercially important species. These conditions are determined through modeling processes that lessen information access limitations and enhance understanding of coastal and oceanographic dynamics impacting marine artisanal fishing.
The “Chocó Artisanal Fishing Geovisor” serves as a strategy for information dissemination and accessibility, empowering artisanal fishers with technology-driven decision-making mechanisms based on real-time data. Understanding the community’s specific needs was key in providing appropriate technological tools. Collaborative efforts with local community organizations and leaders can foster trust and ensure effective utilization of these tools. WebGIS can facilitate collaboration among community decision-makers, such as government entities, conservation groups, and representatives of the fisheries sector, thereby promoting sustainable fishing practices and information sharing.
The artisanal fishing community actively participated in the co-creation process of the visual identity, tools, and functionalities enabling science-based decision making. This process consolidated and promoted the social appropriation of the WebGIS tool, available at http://geopesca-choco.unal.edu.co (accessed on 2 May 2023).
For sustainable fishing practices based on informed decisions and ecosystem-based conservation, it is vital to have a decision-support tool. This tool should make the results of spatial distribution models available to the target community for visualization, consultation, inference, and analysis while also considering local and ancestral knowledge. The results obtained underscore the importance of considering spatial closures to preserve natural reproduction patterns and the migration of fish species. This consideration is pivotal in maintaining robust and resilient populations over time.
By integrating traditional knowledge with scientific models, effective management strategies can be designed to balance the economic benefits of fishing with the long-term environmental health of the region. Prioritizing sustainable approaches is imperative to ensure that future generations continue to benefit from these invaluable resources.
In conclusion, our focus on examining environmental factors and ever-evolving marine dynamics that affect fish species’ spatial and temporal dispersion can equip impacted communities with vital knowledge for improved decision making and enhanced self-determination. The outcomes of this study have the potential to help design resilient fishing methods that consider the relentless environmental transformations brought about by climate change, thereby providing a dual benefit to both the marine ecosystems and the dependent communities.
Supplementary Materials
The following supporting information can be downloaded at: https://www.mdpi.com/article/10.3390/fishes8070349/s1, Table S1: Performance of individual models applied to the species Acanthocybium solandri; Table S2: Performance of individual models applied to the species Scomberomorus sierra; Table S3: Performance of individual models applied to the species Euthynnus lineatus; Table S4: Performance of individual models applied to the species Thunnus albacares.
Author Contributions
J.J.S.: conceived and designed the analysis; wrote the paper. M.A.C.-O.: conceived and designed the analysis; collected the data; contributed data or analysis tools; performed the analysis; wrote the paper. J.P.-N.: performed the analysis; wrote the paper. M.A.M.-P.: collected the data; performed the analysis; wrote the paper. F.A.H.-R.: conceived and designed the analysis; collected the data; contributed data or analysis tools; performed the analysis; wrote the paper. All authors have read and agreed to the published version of the manuscript.
Funding
This research and APC was funded by “Research for the Sustainability of Artisanal Fishing in the Department of Chocó” project (General System of Royalty SGR Colombia BPIN: 2018000100045). The project was undertaken by the Universidad Nacional de Colombia in collaboration with the Special Agreement for Scientific Cooperation No. FUV-GJU-R-C-004.2021, between the Foundation Universidad del Valle (the primary executing entity) and the Universidad Nacional de Colombia Sede Palmira HERMES 44830 (the cooperating entity).
Institutional Review Board Statement
Ethical review and approval were waived for this study because the survey with human subjects consisted of non-invasive items.
Informed Consent Statement
Informed consent was obtained from all the subjects involved in the study.
Data Availability Statement
The data presented in this research are not publicly available due to participant privacy.
Acknowledgments
We wish to express our deepest to the fishing communities of Bahía Solano, Nuquí, and Pizarro (Bajo Baudó), as well as the entire Pacific region of Chocó. Their contributions of information, knowledge, and experiences were indispensable to this research. Our appreciation goes specifically to the Copernicus Marine Service (2022) and the European Centre for Medium-Range Weather Forecasts (2022) for providing data access (https://apps.ecmwf.int/archive-catalogue/; BCC9EC340775489AB89C76B926217785; dated 16 June 2022). These resources were invaluable in the context of global efforts toward open and collaborative science, making significant contributions accessible to both researchers and the wider community.
Conflicts of Interest
The authors declare no conflict of interest.
References
- Mohsin, M.; Hengbin, Y.; Luyao, Z.; Riu, L.; Chong, Q.; Mehak, A. An application of multiple-criteria decision analysis for risk prioritization and management: A case study of the fisheries sector in Pakistan. Sustainability 2022, 14, 8831. [Google Scholar] [CrossRef]
- Cheung, W.W.L.; Jones, M.C.; Reygondeau, G.; Frolicher, T.L. Opportunities for climate-risk reduction through effective fisheries management. Glob. Change Biol. 2018, 24, 5149–5163. [Google Scholar] [CrossRef]
- Zeller, D.; Pauly, D. Viewpoint: Back to the future for fisheries, where will we choose to go? Glob. Sustain. 2019, 2, 1–8. [Google Scholar] [CrossRef]
- Bertrand, S.; Bertrand, A.; Guevara-Carrasco, R.; Gerlotto, F. Scale-invariant movements of fishermen: The same foraging strategy as natural predators. Ecol. Appl. 2007, 17, 331–337. [Google Scholar] [CrossRef]
- Bez, N.; Walker, E.; Gaertner, D.; Rivoirard, J.; Gaspar, P. Fishing activity of tuna purse seiners estimated from vessel monitoring system (VMS) data. Can. J. Fish. Aquat. Sci. 2011, 68, 1998–2010. [Google Scholar] [CrossRef]
- Planque, B.; Loots, C.; Petitgas, P.; Lindstrøm, U.; Vaz, S. Understanding what controls the spatial distribution of fish populations using a multi-model approach. Fish. Oceanogr. 2011, 20, 1–17. [Google Scholar] [CrossRef]
- Holley, J.F.; Marchal, P. Fishing strategy development under changing conditions: Examples from the French offshore fleet fishing in the North Atlantic. ICES J. Mar. Sci. 2004, 61, 1410–1431. [Google Scholar] [CrossRef]
- Marchal, P.; Andersen, B.; Bromley, D.; Iriondo, A.; Mahévas, S.; Quirijns, F.; Rackham, B.; Santurtún, M.; Tien, N.; Ulrich, C. Improving the definition of fishing effort for important European fleets by accounting for the skipper effect. Can. J. Fish. Aquat. Sci. 2006, 63, 510–533. [Google Scholar] [CrossRef]
- Simpson, S.D.; Jennings, S.; Johnson, M.P.; Blanchard, J.L.; Schön, P.J.; Sims, D.W.; Genner, M.J. Continental shelf-wide response of a fish assemblage to rapid warming of the sea. Curr. Biol. 2011, 21, 1565–1570. [Google Scholar] [CrossRef]
- Zapata, L.A.; Peña, E.; Rubio, E. The Small Pelagic Fishery in the Pacific of Colombia [La Pesquería de Pequeños Pelágicos en el Pacífico de Colombia]; Agüero, M., Ed.; Capacidad de pesca y manejo pesquero en América Latina y el Caribe; FAO Documento Técnico de Pesca, No. 461; FAO: Roma, Italy, 2007; p. 423. [Google Scholar]
- Zapata, L.A.; Beltrán-León, B.S.; Herrera, J.C.; Jiménez-Tello, P.; Prieto, L.M.; Guevara-Fletcher, C.; Zambrano, E. Current Status of the Small Pelagic Fishery in the Colombian Pacific [Estado Actual de la Pesquería de Pequeños Pelágicos en el Pacífico Colombiano]; Díaz-Merlano, J.M., Vieira-Betancourt, C., Melo-Saldarriaga, J., Eds.; Diagnóstico de las principales pesquerías del Pacífico colombiano; Fundación Marviva-Colombia: Bogotá, Colombia, 2011; pp. 157–175. [Google Scholar]
- Vázquez-Rowe, I.; Tyedmers, P. Identifying the importance of the “skipper effect” within sources of measured inefficiency in fisheries through data envelopment analysis (DEA). Mar. Policy 2013, 38, 387–396. [Google Scholar] [CrossRef]
- Aroca-Araujo, A. Some Spatial Conceptions of the Fishermen of Buenaventura, Colombian Pacific [Algunas Concepciones Espaciales de los Pescadores de Buenaventura, Pacífico Colombiano]; Revista Amauta; Universidad del Atlántico: Puerto Colombia, Colombia, 2013; Volume 21, pp. 47–61. ISSN 1794-5658. [Google Scholar]
- León-Valle, W.; Núñez-Guale, L.; Valencia, A.; Cedeño, J. Artisanal fishing a legacy of ancestral knowledge, province of Santa Elena [La pesca artesanal un legado del saber ancestral, provincia de Santa Elena]. Rev. De Investig. Soc. 2017, 3, 51–63. Available online: https://www.ecorfan.org/republicofnicaragua/researchjournal/investigacionessociales/journal/vol3num10/Revista_de_Investigaciones_Sociales_V3_N10_6.pdf (accessed on 1 April 2023).
- Díaz-Merlano, J.M.; Vieira-Betancourt, C.; Melo-Saldarriaga, J. (Eds.) Diagnosis of the Main Fisheries of the Colombian Pacific [Diagnóstico de las Principales Pesquerías del Pacífico Colombiano]; Fundación Marviva-Colombia: Bogotá, Colombia, 2011; p. 244. Available online: https://www.marviva.net/sites/default/files/2020-10/pesquerias_baja.pdf (accessed on 28 February 2023).
- USAID-U.S. Agency for International Development. Towards Sustainable Artisanal Fishing: The Challenges of the Colombian Pacific [Hacia Una Pesca Artesanal Sostenible: Los Retos del Pacífico Colombiano]; Programa BIOREDD+: Cali, Colombia, 2015; p. 55. [Google Scholar]
- Neira, A.; Díaz, J.M.; González, G.G.; Velandia, M.C.; Melo, M.C. Diagnosis of Artisanal Fisheries in the North of the Chocoan Pacific [Diagnóstico de las Pesquerías Artesanales en el Norte del Pacífico Chocoano]; Díaz-Merlano, J.M., Guillot-Illidge, L., Velandia-Díaz, M.C., Eds.; La pesca artesanal en la costa norte del Pacífico colombiano: Un horizonte ambivalente; Fundación MarViva: Bogotá, Colombia, 2016; pp. 69–89. [Google Scholar]
- Diaz-Merlano, J.M.; Guillot-Illidge, L.; Velandia-Díaz, M.C. Artisanal Fishing in the North of the Colombian Pacific. An Ambivalent Horizon [La Pesca Artesanal en el Norte del Pacífico Colombiano Un Horizonte Ambivalente]; Fundación Marviva-Colombia: Bogotá, Colombia, 2016; p. 158. Available online: https://marviva.net/la-pesca-artesanal-en-el-norte-del-pacifico-colombiano/ (accessed on 1 February 2023).
- FAO-Food and Agriculture Organization of the United Nations. The State of World Fisheries and Aquaculture 2020 [El Estado Mundial de la Pesca y la Acuicultura 2020; La Sostenibilidad En Acción: Roma, Italy, 2020; p. 243. [Google Scholar] [CrossRef]
- Froese, R.; Pauly, D. (Eds.) FishBase. Acantocybium Solandri (Cuvier, 1832). 2023. Available online: https://www.marinespecies.org/aphia.php?p=taxdetails&id=403164 (accessed on 1 May 2023).
- Gao, C.; Tian, S.; Kindong, R.; Dai, X. Biology and environmental preferences of Wahoo, Acanthocybium solandri (Cuvier, 1832), in the Western and Central Pacific Ocean (WCPO). J. Mar. Sci. Eng. 2020, 8, 184. [Google Scholar] [CrossRef]
- Lucano-Ramírez, G.; Ruiz-Ramírez, S.; Palomera-Sánchez, F.I.; González-Sansón, G. Reproductive biology of the Pacific sierra Scomberomorus sierra (Pisces, Scrombridae) in the central Mexican Pacific. Cienc. Mar. 2011, 37, 240–260. Available online: https://www.redalyc.org/pdf/480/48020755001.pdf (accessed on 1 May 2023). [CrossRef]
- Box, S.J.; Salgado, B.R. Evaluation of Fishing Practices in Small-Scale Fisheries in the Gulf of Fonseca, Honduras [Evaluación de las Prácticas Pesqueras en Pesquerías de Pequeña Escala del Golfo de Fonseca, Honduras]; Recomendaciones para el manejo: Informe Técnico; 2009; p. 39. Available online: https://docplayer.es/38622230-Evaluacion-de-las-practicas-pesqueras-en-pesquerias-de-pequena-escala-del-golfo-de-fonseca-honduras-recomendaciones-para-el-manejo.html (accessed on 1 May 2023).
- Tobón-López, A.; Rubio, E.; Giraldo, A. Composition and taxonomic analysis of the ichthyofauna of the Gulf of Tribugá, North Pacific of Colombia [Composición y análisis taxonómico de la ictiofauna del golfo de Tribugá, Pacífico norte de Colombia]. Lat. Am. J. Aquat. Res. 2008, 36, 93–104. [Google Scholar] [CrossRef]
- García-Ulloa, D.G.; García-Ulloa, M.G.; Aguilar-Palomina, B.; Banda-Dávila, A.; García Ulloa, M. Composition of the diet of the black skipjack Euthynnus lineatus (Perciformes: Scrombridae) from the central Mexican Pacific coast [Composición de la dieta del barrilete negro Euthynnus lineatus (Perciformes: Scrombridae) de la costa central del Pacífico mexicano]. In Estudios Marinos y Pesqueros en el Pacífico Mexicano; Universidad de Colima: Jalisco, Mexico, 2022; pp. 83–95. [Google Scholar]
- Pacheco-Bedoya, J.L. Biological and Fishing Aspects of the Yellowfin Tuna Thunnus Albacares Caught by the Ecuadorian Tuna Purse Seine Fleet, Period 2009–2013 [Aspectos Biológicos y Pesqueros del Atún Aleta Amarilla Thunnus Albacares Capturado Por la Flota Atunera Cerquera Ecuatoriana, Periodo 2009–2013]; Ministerio de Agricultura, Ganadería, Acuacultura y Pesca; Instituto Nacional de Pesca/Proceso IRBA-Subproceso EE: Quito, Ecuador, 2014; Available online: https://institutopesca.gob.ec/wp-content/uploads/2017/07/2-Aspectos-biol%C3%B3gicos-y-Pesqueros-del-At%C3%BAn-Aleta-Amarilla-Capturado-por-la-Flota-Atunera-Cerquera-2009-2013.pdf (accessed on 2 May 2023).
- Quesada-Quirós, M.; Acosta-Vargas, L.G.; Arias-Aguilar, D.; Rodríguez-González, A. Ecological niche modeling based on three climate change scenarios for five plant species in highlands of Costa Rica [Modelación de nichos ecológicos basado en tres escenarios de cambio climático para cinco especies de plantas en zonas altas de Costa Rica]. Rev. For. Mesoam. Kurú 2016, 14, 1–12. [Google Scholar] [CrossRef]
- Cuesta-Camacho, F.; Peralvo, M.; Ganzenmüller, A. Possible Effects of Global Warming on the Ecological Niche of Some Species in the Tropical Andes [Posibles Efectos del Calentamiento Global Sobre el Nicho Ecológico de Algunas Especies en los Andes Tropicales]; Síntesis del artículo publicado en; Mena, P., Maldonado, G., Eds.; Páramo y Cambio Climático. #23. Serie Páramo; Grupo de Trabajo en Páramos del Ecuador/EcoCiencia: Quito, Ecuador, 2008; Available online: https://keneamazon.net/Documents/Publications/Virtual-Library/Adaptacion-Riesgo/22.pdf (accessed on 2 February 2023).
- Muñoz, F.; Anthelme, F.; Raevel, V. Multi-Scale Ecological Processes Driving Plant Community Dynamics in High-Elevation Peatlands of Bolivia. Ecol. En Boliv. 2014, 49, 104–119. Available online: http://www.scielo.org.bo/pdf/reb/v49n3/v49n3_a10.pdf (accessed on 6 January 2023).
- Maciel-Mata, C.A.; Manríquez-Morán, N.; Octavio-Aguilar, P.; Sánchez-Rojas, G. Geographical distribution of the species: A concept review [El área de distribución de las especies: Revisión del concepto]. Acta Univ. 2015, 25, 3–19. [Google Scholar] [CrossRef]
- Ben-Rais-Lasram, B.F.; Hattab, T.; Nogues, Q.; Beaugrand, G.; Dauvin, J.C.; Halouani, G.; Le Loc’h, F.; Niquil, N.; Leroy, B. An open-source framework to model present and future marine species distributions at local scale. Ecol. Inform. 2020, 59, 101130. [Google Scholar] [CrossRef]
- Wiens, J.J.; Graham, C.H. Niche conservatism: Integrating evolution, ecology, and conservation biology. Annu. Rev. Ecol. Evol. Syst. 2005, 36, 519–539. [Google Scholar] [CrossRef]
- Villaverde, T.; González-Moreno, P.; Rodríguez-Sánchez, F.; Escudero, M. Niche shifts after long-distance dispersal events in bipolar sedges (Carex, Cyperaceae). Am. J. Bot. 2017, 104, 1765–1774. [Google Scholar] [CrossRef] [PubMed]
- Illoldi-Rangel, P.; Escalante, T. From ecological niche patterns to geographic distribution areas [De los modelos de nicho ecológico a las áreas de distribución geográfica]. Biogeografía 2008, 3, 7–12. Available online: https://www.researchgate.net/publication/286336295_De_los_modelos_de_nicho_ecologico_a_las_areas_de_distribucion_geografica (accessed on 20 November 2022).
- Ibarra-Montoya, J.L.; Rangel-Peraza, G.G.; González-Farias, F.A.; De Anda, J.; Zamudio-Reséndiz, M.E.; Martínez-Meyer, E.; Macias-Cuellar, H. Ecological Niche Model to Predict the Potential Distribution of Phytoplankton in the Aguamilpa Hydroelectric Dam, Nayarit. Mexico [Modelo de Nicho Ecológico Para Predecir la Distribución Potencial de Fitoplancton en la presa Hidroeléctrica Aguamilpa, Nayarit. Mexico]. Ambiente Água 2010, 6, 60–75. Available online: https://www.redalyc.org/articulo.oa?id=92815711004 (accessed on 15 December 2022).
- Peterson, A.T.; Soberon, J.; Sánchez-Cordero, V. Conservation of ecological niches in evolutionary time. Science 1999, 285, 1265–1267. [Google Scholar] [CrossRef]
- Pearson, R.G.; Dawson, T.P.; Lin, C. Modelling species distributions in Britain: And hierarchical integration of climate and land-cover data. Ecography 2004, 27, 285–298. [Google Scholar] [CrossRef]
- Phillips, S.J.; Anderson, R.P.; Schapire, R.E. Maximum entropy modeling of species geographic distributions. Ecol. Model. 2006, 190, 231–259. [Google Scholar] [CrossRef]
- Guisan, A.; Zimmermann, N.E. Predictive habitat distribution models in ecology. Ecol. Model. 2000, 135, 147–186. [Google Scholar] [CrossRef]
- Lacy, W.B. Empowering communities through public work, science, and local food systems: Revisiting democracy and globalization. Rural. Sociol 2000, 65, 3–26. [Google Scholar] [CrossRef]
- Arnold, M.; Stillman, L. Empowerment in the Context of Community Informatics. In Proceedings of the Prato CIRN Community Informatics Conference, Refereed Paper; 2009. Available online: https://www.academia.edu/26364462/Empowerment_in_the_Context_of_Community_Informatics (accessed on 2 February 2023).
- Yen-Chia, H.; Ting-Hao, K.H.; Verma, H.; Mauri, A.; Nourbakhsh, I.; Bozzon, A. Empowering local communities using artificial intelligence. Perspective. Patterns 2022, 3, 100449. [Google Scholar] [CrossRef]
- Palacios-Calderón, A. Departmental Development Plan 2020–2023 [Plan Departamental de Desarrollo 2020–2023]; Generando confianza; Gobernación del Chocó, 2020; p. 472. Available online: https://rap-pacifico.gov.co/wp-content/uploads/2020/07/choco-final-pddd.pdf (accessed on 2 February 2023).
- Alzate, O.A.; López, J.D. A food Security Strategy for the Colombian Pacific from the Perspective of the Communities [Una Estrategia de Seguridad Alimentaria Para el Pacífico Colombiano Desde la Perspectiva de las Comunidades]. Red de desarrollo tecnológico y Fortalecimiento Institucional Para la Pequeña Producción Agropecuaria del Pacífico Colombiano (Red de Seguridad Alimentaria); Programa Nacional de Transferencia de Tecnología Agropecuaria PRONATTA; Proyecto DFID: Colombia, 2003; Available online: http://cpps.dyndns.info/cpps-docs-web/planaccion/biblioteca/pordinario/Proceso%20Ordinario/FoodSecurity/SeguridadAlimentariPacifico.pdf (accessed on 15 February 2023).
- IGAC—Instituto Geográfico Agustín Codazzi. General Study of Soils and Land Zoning of the Department of Chocó [Estudio General de Suelos y Zonificación de Tierras del Departamento del Chocó]; Escala 1: 100000; IGAC: Bogotá, Colombia, 2012. Available online: https://www.igac.gov.co/es/catalogo/estudio-general-de-suelos-y-zonificacion-de-tierras-del-departamento-de-choco (accessed on 2 February 2023).
- INVEMAR—Instituto de Investigaciones Marinas y Costeras. “José Benito Vives de Andréis” Report on the State of the Marine and Coastal Environments and Resources of Colombia [Informe del Estado de los Ambientes y Recursos Marinos y Costeros de Colombia]; Serie de Publicaciones Periódicas No. 3; INVEMAR: Santa Marta, Colombia, 2020; p. 183. ISSN 1692-5025. Available online: http://www.invemar.org.co/documents/10182/0/IER-2019_Informe_del_estado_de_los_ambientes_y_recursos_marinos/b7520e57-5cdc-4558-a3d4-bea36f767a98 (accessed on 2 February 2023).
- IGAC—Instituto Geográfico Agustín Codazzi. Circular 00005. Training, updating and Conservation Program 1996 [Circular 00005 Programa formación, actualización y Conservación 1996]. 1996. Available online: http://igacnet2.igac.gov.co/intranet/catastro_files/documentos/C%205_96.pdf (accessed on 1 February 2023).
- Zizka, A.; Silvestro, D.; Andermann, T.; Azevedo, J.; Duarte-Ritter, C.; Edler, D.; Farooq, H.; Herdean, A.; Ariza, M.; Schuarn, R.; et al. CoordinateCleaner: Standardized cleaning of occurrence records from biological collection databases. Methonds Ecol. Evol. 2019, 10, 744–751. [Google Scholar] [CrossRef]
- Bucklin, D.N.; Basille, M.; Benscoter, A.M.; Brandt, L.A.; Mazzotti, F.J.; Romañach, S.S.; Speroterra, C.; Watling, J.I. Comparing species distribution models constructed with different subsets of environmental predictors. Divers. Distrib. 2015, 21, 23–35. [Google Scholar] [CrossRef]
- Aiello-Lammens, M.E.; Boria, R.A.; Radosavljevic, A.; Viela, B.; Andersonm, R.P. spThin: An R package for spatial thinning of species occurrence records for use in ecological niche models. Ecography 2015, 38, 541–545. [Google Scholar] [CrossRef]
- Beck, J.; Böller, M.; Erhardt, A.; Schwanghart, W. Spatial bias in the GBIF database and its effect on modeling species’ geographic distributions. Ecol. Inform. 2014, 19, 10–15. [Google Scholar] [CrossRef]
- Barbet-Massin, M.; Jiguet, F.; Albert, C.H.; Thuiller, W. Selecting pseudo-absences for species distribution models: How, where and how many? Methods Ecol. Evol. 2012, 3, 327–338. [Google Scholar] [CrossRef]
- Legendre, P.; Legendre, L. Numerical Ecology, 3rd ed.; Université de Montréal: Montréal, QC, Canada, 2012; ISBN 9780444538697. [Google Scholar]
- Tourne, D.C.M.; Ballester, M.V.R.; James, P.M.A.; Martorano, L.G.; Carneiro-Guedes, M.; Thomas, E. Strategies to optimize modelling habitat suitability of Bertholletia excelsa in the Pan-Amazonia. Ecol. Evol. 2019, 9, 12623–12638. [Google Scholar] [CrossRef]
- Alvarez-Filip, L.; Gill, J.A.; Dulvy, N.K. Complex reef architecture supports more small-bodied fishes and longer food chains on Caribbean reefs. Ecosphere 2011, 2, 1–17. [Google Scholar] [CrossRef]
- Hays, G.C. Ocean currents and marine life. Curr. Biol. 2017, 27, R470–R473. [Google Scholar] [CrossRef] [PubMed]
- Doxa, A.; Almpanidou, V.; Katsanevakis, S.; Queirós, A.M.; Kaschner, K.; Garilao, C.; Kesner-Reyes, K.; Mazaris, A.D. 4D marine conservation networks: Combining 3D prioritization of present and future biodiversity with climatic refugia. Glob. Change Biol. 2022, 28, 4577–4588. [Google Scholar] [CrossRef] [PubMed]
- Moudrý, V.; Šímová, P. Influence of positional accuracy, sample size and scale on modelling species distributions: A review. Int. J. Geogr. Inf. Sci. 2012, 26, 2083–2095. [Google Scholar] [CrossRef]
- Casas, E.; Martín-García, L.; Hernández-Leal, P.; Arbelo, M. Species Distribution Models at Regional Scale: Cymodocea nodosa Seagrasses. Remote Sens. 2022, 14, 4334. [Google Scholar] [CrossRef]
- Thuiller, W.; Lafourcade, B.; Engler, R.; Araújo, M.B. BIOMOD—A platform for ensemble forecasting of species distributions. Ecography 2009, 32, 369–373. [Google Scholar] [CrossRef]
- Hao, T.; Elith, J.; Guillera-Arroita, G.; Lahoz-Monfort, J.J. A review of evidence about use and performance of species distribution modelling ensembles like BIOMOD. Divers. Distrib. 2019, 25, 839–852. [Google Scholar] [CrossRef]
- Olden, J.D.; Neff, B.D. Cross-correlation bias in lag analysis of aquatic time series. Mar. Biol. 2001, 138, 1063–1070. [Google Scholar] [CrossRef]
- Ashrafzadeh, M.R.; Ghorbani, R.; Pourkazemi, M.; Tavakoli, M. Modeling of Persian sturgeon (Acipenser persicus) habitat suitability using BIOMOD in the southwestern Caspian Sea. J. Appl. Ichthyol. 2019, 35, 1327–1334. [Google Scholar] [CrossRef]
- Shabani, F.; Kumar, L.; Ahmadi, M. A comparison of absolute performance of different correlative and mechanistic species distribution models in an independent area. Ecol. Evol. 2016, 6, 5973–5986. [Google Scholar] [CrossRef]
- Shabani, F.; Kumar, L.; Ahmadi, M. Assessing Accuracy Methods of Species Distribution Models: AUC, Specificity, Sensitivity and the True Skill Statistic. Glob. J. Hum. Soc. Sci. 2018, 18, 6–8. [Google Scholar]
- Alabia, I.D.; Saitoh, S.I.; Igarashi, H.; Ishikawa, Y.; Usui, N.; Kamachi, M.; Awaji, T.; Seito, M. Ensemble squid habitat model using three-dimensional ocean data. ICES J. Mar. Sci. 2016, 73, 1863–1874. [Google Scholar] [CrossRef]
- Guisan, A.; Thuiller, W.; Zimmermann, N.E. Habitat Suitability and Distribution Models. In Habitat Suitability and Distribution Models; Cambridge University Press: Cambridge, UK, 2017. [Google Scholar] [CrossRef]
- Koo, K.A.; Park, S.U.; Kong, W.S.; Hong, S.; Jang, I.; Seo, C. Potential climate change effects on tree distributions in the Korean Peninsula: Understanding model & climate uncertainties. Ecol. Model. 2017, 353, 17–27. [Google Scholar] [CrossRef]
- Araújo, M.B.; New, M. Ensemble forecasting of species distributions. In Trends in Ecology and Evolution; Elsevier Current Trends: UK, 2007; Volume 22, pp. 42–47. [Google Scholar] [CrossRef]
- Araújo, M.B.; Whittaker, R.J.; Ladle, R.J.; Erhard, M. Reducing uncertainty in projections of extinction risk from climate change. Glob. Ecol. Biogeogr. 2005, 14, 529–538. [Google Scholar] [CrossRef]
- Tanaka, K.R.; Torre, M.P.; Saba, V.S.; Stock, C.A.; Chen, Y. An ensemble high-resolution projection of changes in the future habitat of American lobster and sea scalloin the Northeast US continental shelf. Divers. Distrib. 2020, 26, 987–1001. [Google Scholar] [CrossRef]
- Gama, M.; Crespo, D.; Dolbeth, M.; Anastácio, P.M. Ensemble forecasting of Corbicula fluminea worldwide distribution: Projections of the impact of climate change. Aquatic Conservation. Mar. Freshw. Ecosyst. 2017, 27, 675–684. [Google Scholar] [CrossRef]
- CIAT—Comisión Interamericana del Atún Tropical. Documents SAC 05-06 The Tuna and Billfish Fishery in the Eastern Pacific Ocean [Documento SAC 05-06 La Pesquería de Atunes y Peces Picudos en el Océano Pacífico Oriental]; Estados Unidos: La Jolla, CA, USA, 2014; p. 3. Available online: https://www.iattc.org/GetAttachment/219ff835-5a68-43e7-ac74-50828b90e716/SAC-05-06_La-pesqueria-en-el-Oceano-Pacifico-oriental-2013.pdf (accessed on 2 February 2023).
- ANLA—Autoridad Nacional de Licencias Ambientales. North Pacific Regional Analysis Report: Gulf of Tribugá and Golfo Cupica (PN-GTGC) [Reporte de Análisis Regional del Pacífico Norte: Golfo de Tribugá y Golfo Cupica (PN-GTGC)]; 2020; p. 91. Available online: https://www.anla.gov.co/documentos/biblioteca/07-01-2021-anla-rar-golfo-tribuga-golfo-cupica.pdf (accessed on 2 February 2023).
- Guisan, A.; Graham, C.H.; Elith, J.; Huettmann, F. The NCEAS Species Distribution Modelling GrouSensitivity of predictive species distribution models to change in grain size. Divers. Distrib. 2007, 13, 332–340. [Google Scholar] [CrossRef]
- Graham, C.H.; Elith, J.; Hijmans, R.J.; Guisan, A.; Townsend Peterson, A.; Loiselle, B.A. The NCEAS Species Distribution Modelling GrouThe influence of spatial errors in species occurrence data used in distribution models. J. Appl. Ecol. 2008, 45, 239–247. [Google Scholar] [CrossRef]
- Hernandez, P.A.; Graham, C.H.; Master, L.L.; Albert, D.L. The effect of sample size and species characteristics on performance of different species distribution modeling methods. Ecography 2006, 29, 773–785. [Google Scholar] [CrossRef]
- Selvaraj, J.J.; Rosero-Henao, L.V.; Cifuentes-Ossa, M.A. Projecting future changes in distributions of small-scale pelagic fisheries of the southern Colombian Pacific Ocean. Heliyon 2022, 8, e08975. [Google Scholar] [CrossRef]
- Herrera Montiel, S.A.; Coronado-Franco, K.V.; Selvaraj, J.J. Predicted changes in the potential distribution of seerfish (Scomberomorus sierra) under multiple climate change scenarios in the Colombian Pacific Ocean. Ecol. Inform. 2019, 53, 100985. [Google Scholar] [CrossRef]
- Martínez-Arias, A.M.; Salcedo, L.O.G.; Martínez, I.F.B.; Selvaraj, J.J. Satellite and historical data, and statistical modeling to predict potential fishing zones for dolphinfish, Coryphaena hippurus (Perciformes: Coryphaenidae) in Colombian Pacific. Rev. De Biol. Trop. 2022, 70, 576–588. [Google Scholar] [CrossRef]
- Martínez-Rincón, R.O.; Ortega-García, S.; Vaca-Rodríguez, J.G. Comparative performance of generalized additive models and boosted regression trees for statistical modeling of incidental catch of wahoo (Acanthocybium solandri) in the Mexican tuna purse-seine fishery. Ecol. Model. 2012, 23, 20–25. [Google Scholar] [CrossRef]
- Morales, M.A. Characterization of Artisanal Fishing in the Park National Natural Utría, Colombian Chocó [Caracterización de la Pesca Artesanal en el Parque Nacional Natural Utría, Chocó Colombiano]; Undergraduate degree work in Biology; Pontifical Javeriana University: Bogota, Colombia, 2002. [Google Scholar]
- Dzul-Magaña, F.G. Catch of Scomberomorus cavalla and S. maculatus (Perciformes: Scrombridae) and Their Relationshiwith Sea Surface Temperature (1998–2009) off the Veracruz Coast 2014, Gulf of Mexico [Captura de Scomberomorus cavalla y S. maculatus (Perciformes: Scrombridae) y su Relación con la Temperatura Superficial del mar (1998–2009) en el Litoral Veracruzano, Golfo de México]. Master’s Thesis, Universidad Veracruzana, Veracruz, Mexico, 2014. [Google Scholar]
- Eraso-Ordoñez, J.F.; Bustos-Montes, D.M.; Salas-Castro, S.; Girón, A.; Rueda, M. Fecundity of Scomberomorus sierra (Perciformes: Scombridae) in the Colombian Pacific [Fecundidad de Scomberomorus sierra (Perciformes: Scombridae) en el Pacífico Colombiano]; Boletín de Investigaciones Marinas y Costeras–INVEMAR: Santa Marta, Colombia, 2017; Volume 46, ISSN 0122-9761. [Google Scholar]
- Collette, B.B.; Nauen, C.E. FAO Species Catalogue. Vol. 2. Scombrids of the World. An Annotated and Illustrated Catalogue of Tunas, Mackerels, Bonitos and Related Species Known to Datel; FAO Fisheries Synopsis No. 125 (2); FAO: Rome, Italy, 1983; p. 137. ISBN Nr. 92-5-101381-0. [Google Scholar] [CrossRef]
- Álvarez-León, R.; Orozco-Rey, R.H.; Páramo-Fonseca, M.E.; Restrepo-Santamaría, D. List of Current and Fossil Fish in Colombia: Valid Scientific Names, Geographic Distribution, Reference Diagnosis and Common and Indigenous Names [Lista de los Peces Fósiles y Actuales de Colombia: Nombre Científicos Válidos, Distribución Geográficas, Diagnosis de Referencia y Nombres Comunes e Indígenas]; Primera edición; Eco Prints Diseño Gráfico y Audiovisual Ltda: Bogotá, Colombia, 2014; p. 346. ISBN 978-958-46-3657-7. [Google Scholar]
- Velázquez-Polanco, R.I.; Cerdenares-Ladrón de Guevara, G.; Ramón-Carrillo, S.; González-Medina, G. Condition and Allometric Growth of the Black Skipjack Euthynnus lineatus using Multiple Model Inference [Condición y Crecimiento Alométrico del Barrilete Negro Euthynnus lineatus Utilizando Inferencia de Múltiples Modelos]; VII Foro de Pesca Ribereña: Puerto Vallarta, Mexico, 2016. [Google Scholar]
- González-Andrés, C.; Lopes, P.F.M.; Cortés, J.; Sánchez-Lizaso, J.L.; Pennino, M.G. Abundance and Distribution Patterns of Thunnus albacares in Isla del Coco National Park through Predictive Habitat Suitability Models. PLoS ONE 2016, 11, e0168212. [Google Scholar] [CrossRef]
- Cucalón-Zenck, E. Spatial and temporal distribution of purse-seine yellowfin tuna (Thunnus albacares) catches in relation to AVHRR derived SST in the eastern tropical Pacific Ocean. Rev. Científica Cienc. Nat. Y Ambient. 2017, 11, 1–11. [Google Scholar]
- Tasoff, A.J.; Johnson, D.W. Can larvae of marine fish adapt to ocean acidification? Evaluating the evolutionary potential of California Grunion (Leuresthes tenuis). Evol. Appl. 2019, 12, 560–571. [Google Scholar] [CrossRef]
- Baag, S.; Mandal, S. Combined effects of ocean warming and acidification on marine fish and shellfish: A molecule to ecosystem perspective. Sci. Total Environ. 2022, 802, 149807. [Google Scholar] [CrossRef] [PubMed]
- Trujillo, A.P.; Thurman, H.V. Essentials of Oceanography, 12th ed.; Pearson Education, Inc.: Boston, MA, USA, 2016; pp. 403–444. [Google Scholar]
- Wang, L.; Kerr, L.A.; Record, N.R.; Bridger, E.; Tupper, B.; Mills, K.E.; Armstrong, E.M.; Pershing, A.J. Modeling marine pelagic fish species spatiotemporal distributions utilizing a maximum entropy approach. Fish. Oceanogr. 2018, 27, 571–586. [Google Scholar] [CrossRef]
- Suryan, R.M.; Santora, J.A.; Sydeman, W.J. New approach for using remotely sensed clorophyll-a to identify seabird hotspots. Mar. Ecol. Prog. Ser. 2012, 451, 213–225. [Google Scholar] [CrossRef]
- Torres, L.G.; Read, A.; Halpin, P.N. Fine-scale habitat modeling of a tomarine predator: Do prey data improve predictive capacity? Ecol. Appl. 2008, 18, 1702–1717. [Google Scholar] [CrossRef]
- Brodie, S.; Jacox, M.G.; Bograd, S.J.; Welch, H.; Dewar, H.; Scales, K.L.; Maxwell, S.M.; Briscoe, D.M.; Edwards, C.A.; Crowder, L.B.; et al. Integrating dynamic subsurface habitat metrics into species distribution models. Front. Mar. Sci. 2018, 5, 219. [Google Scholar] [CrossRef]
Disclaimer/Publisher’s Note: The statements, opinions and data contained in all publications are solely those of the individual author(s) and contributor(s) and not of MDPI and/or the editor(s). MDPI and/or the editor(s) disclaim responsibility for any injury to people or property resulting from any ideas, methods, instructions or products referred to in the content. |
© 2023 by the authors. Licensee MDPI, Basel, Switzerland. This article is an open access article distributed under the terms and conditions of the Creative Commons Attribution (CC BY) license (https://creativecommons.org/licenses/by/4.0/).