
Seasonal Dynamics and Environmental Drivers of Goliath Grouper (Epinephelus itajara) Sound Production

 , and
, and
Abstract
1. Introduction
2. Materials and Methods
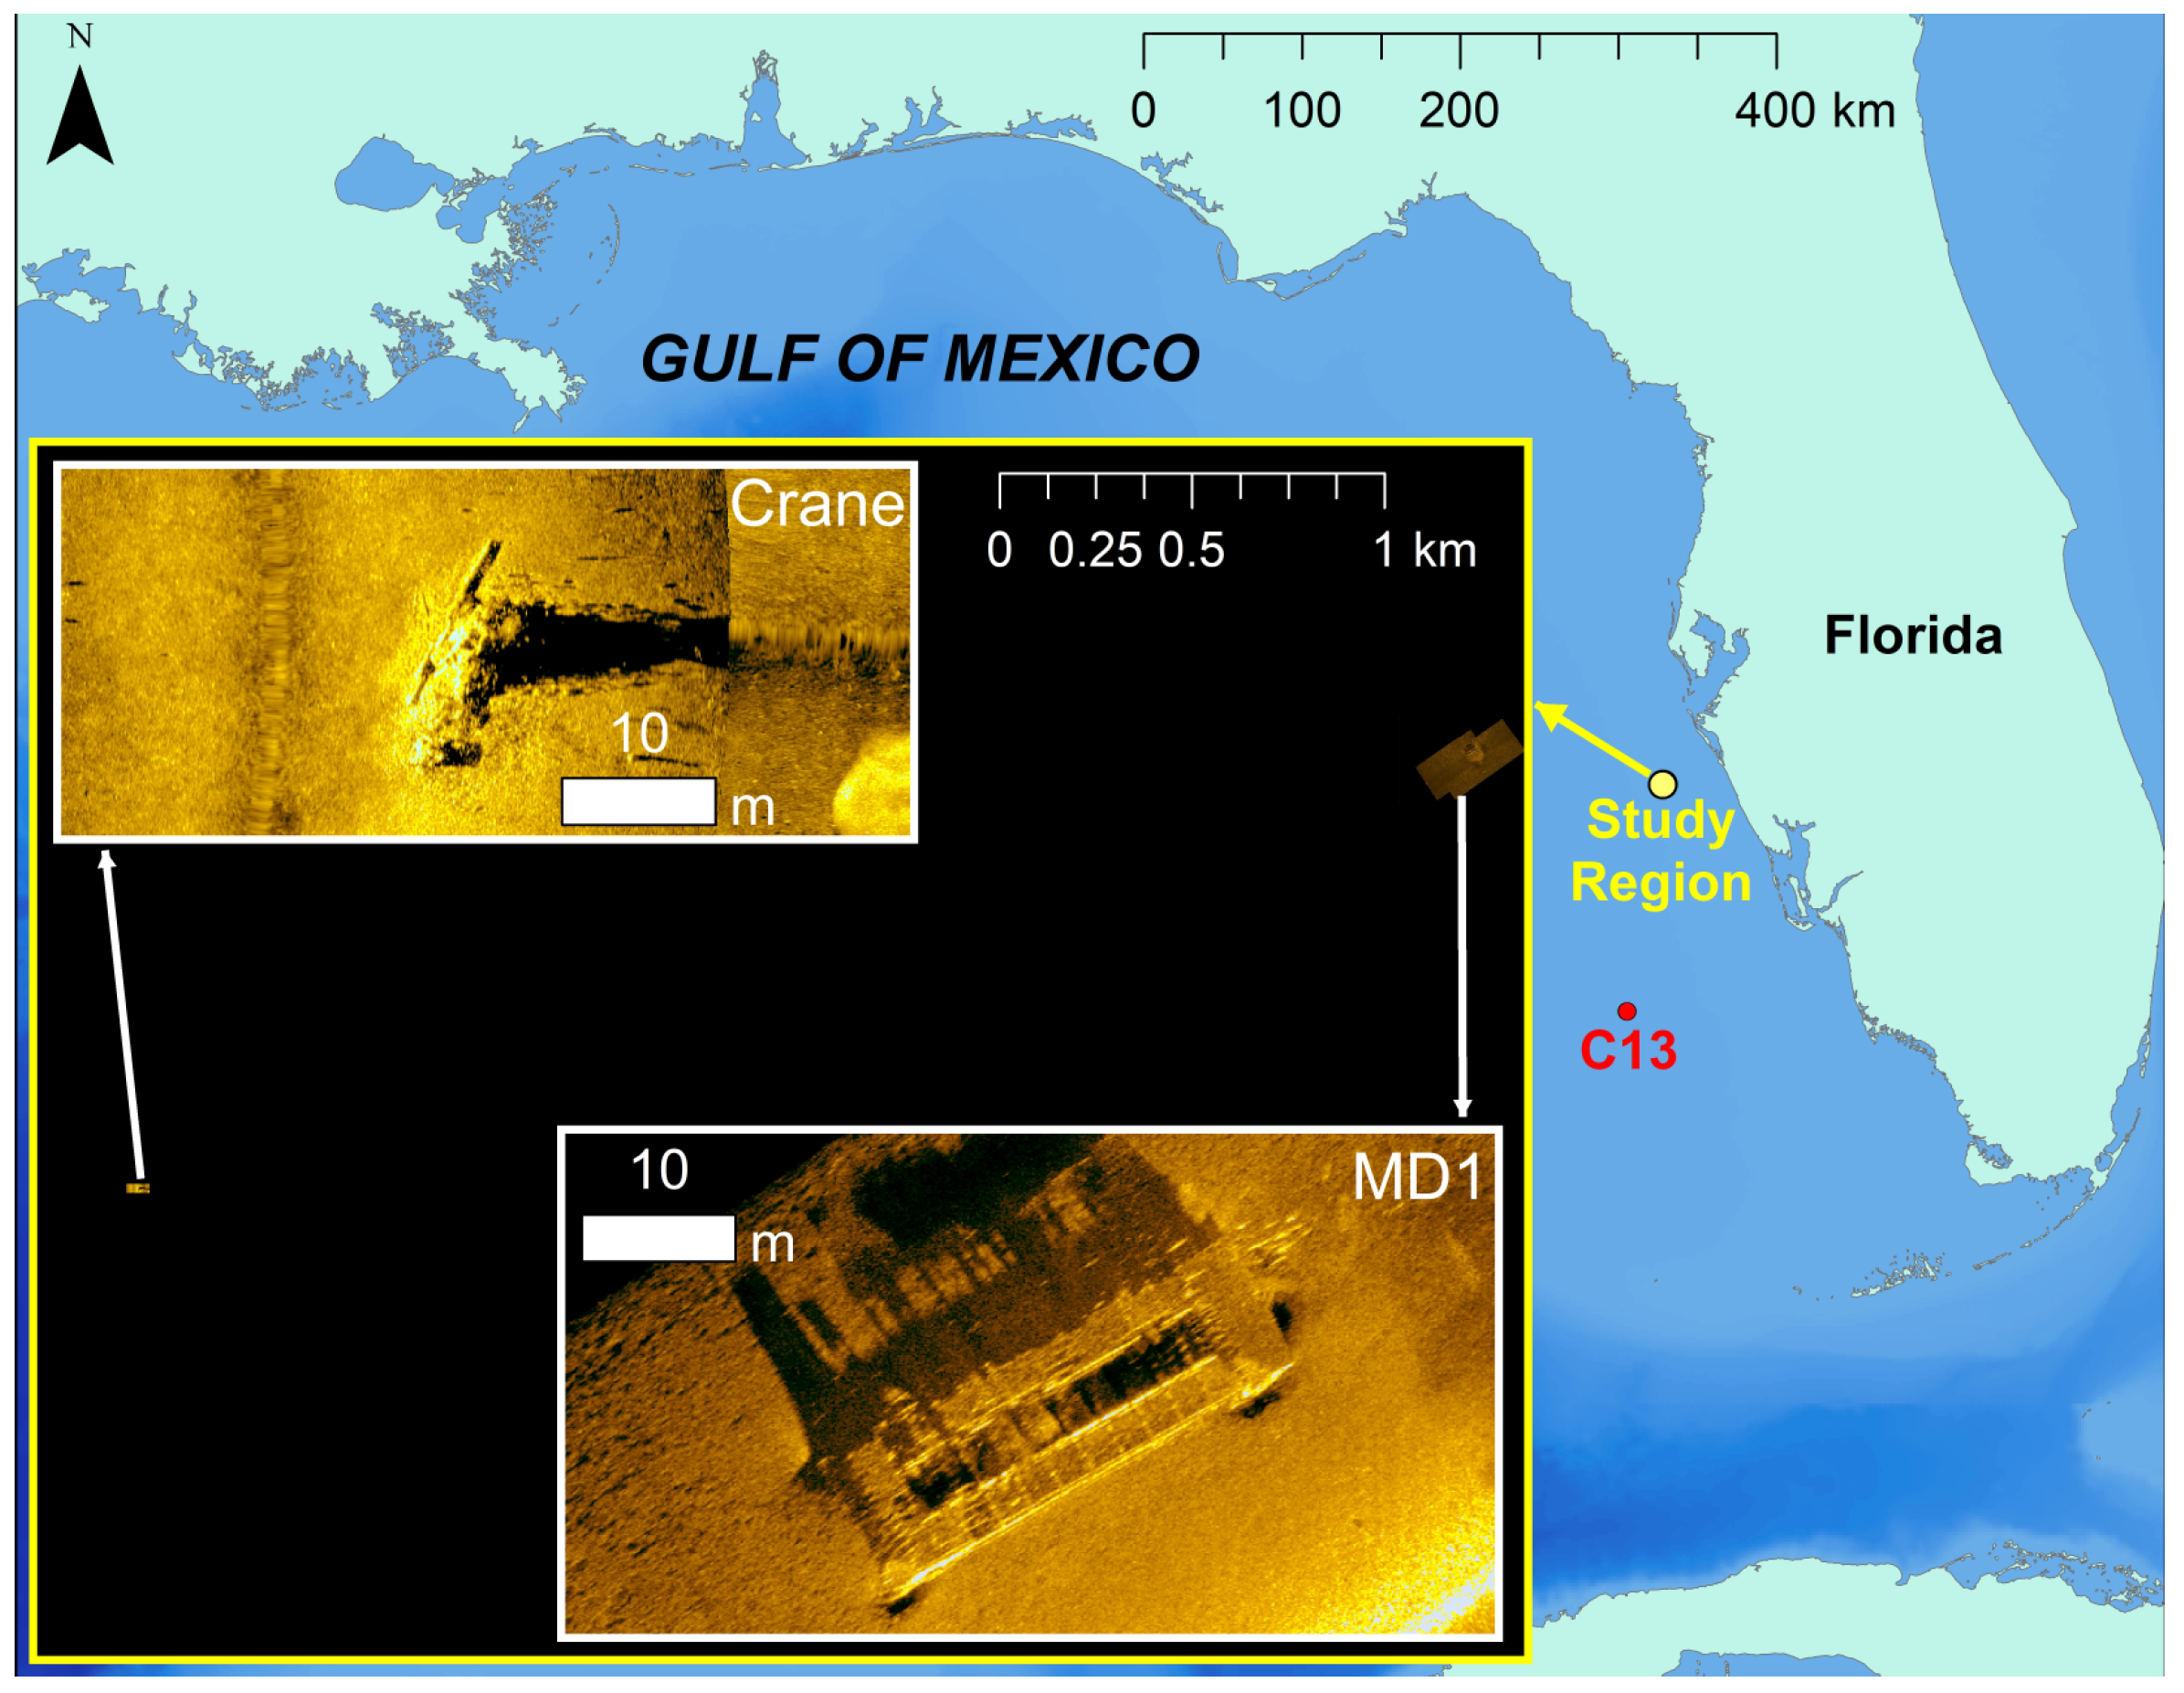
2.1. Acoustic Data Collection
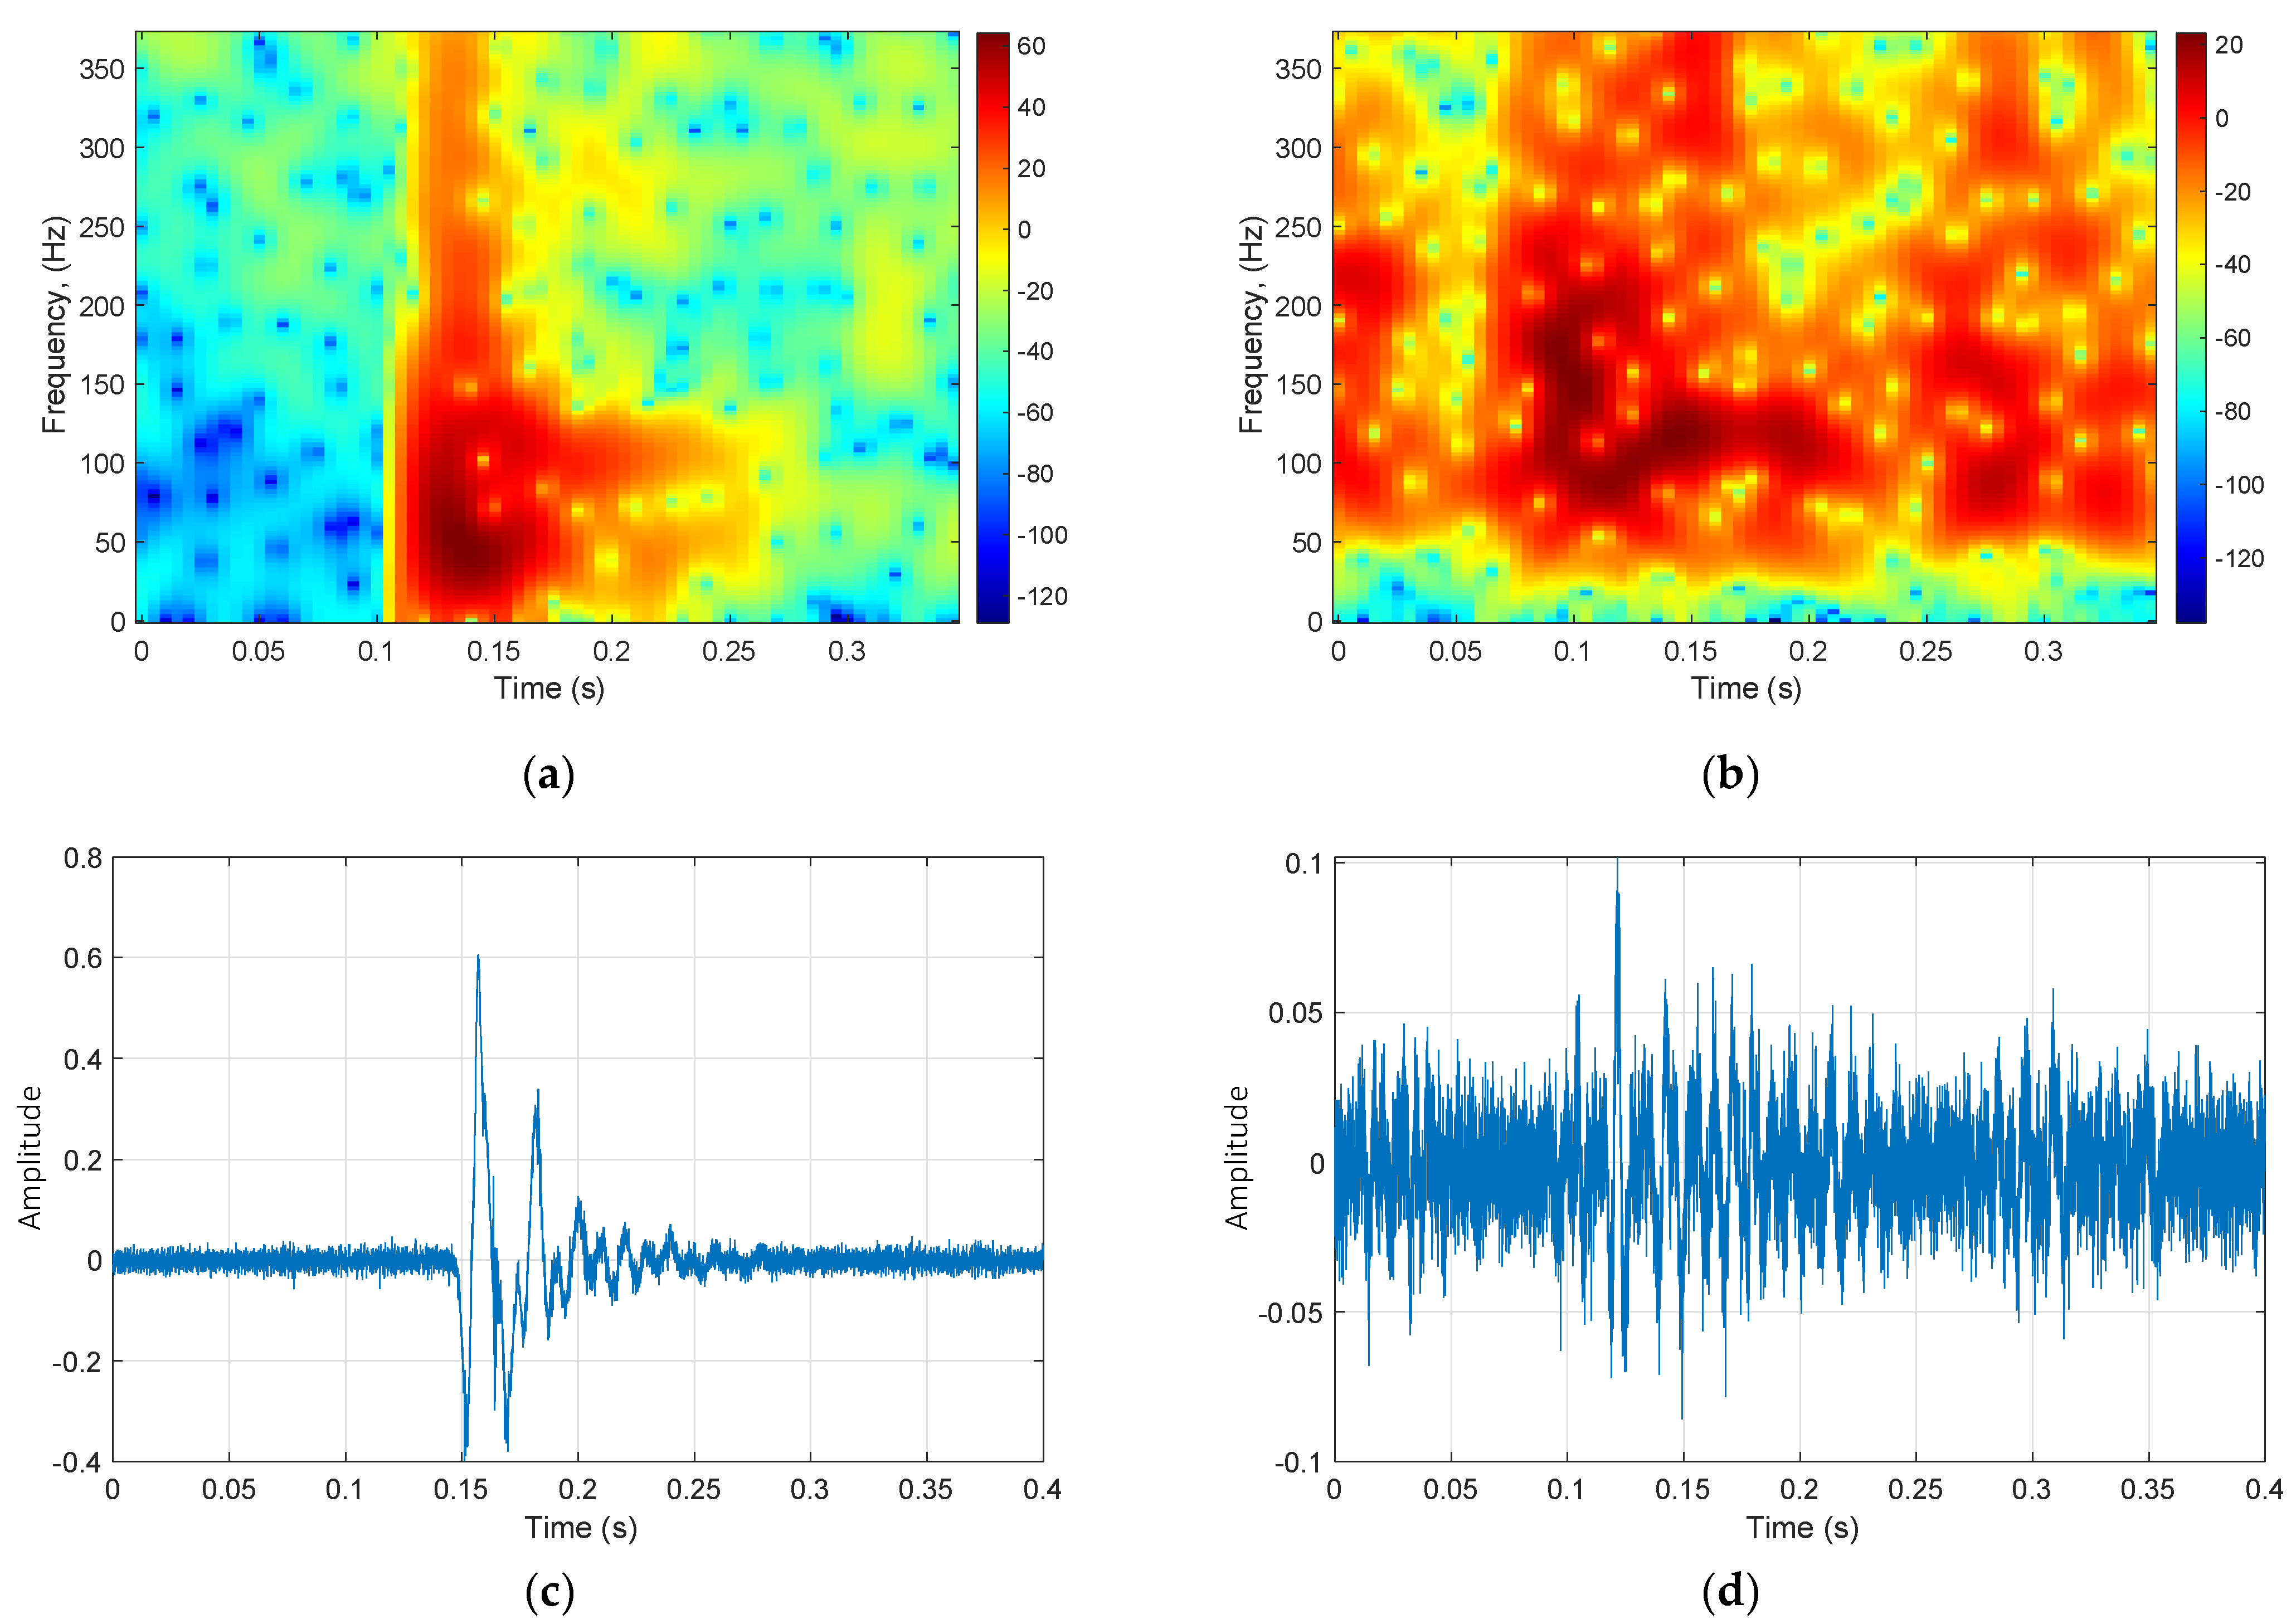
2.2. Call Detection
2.3. Call Modeling
3. Results
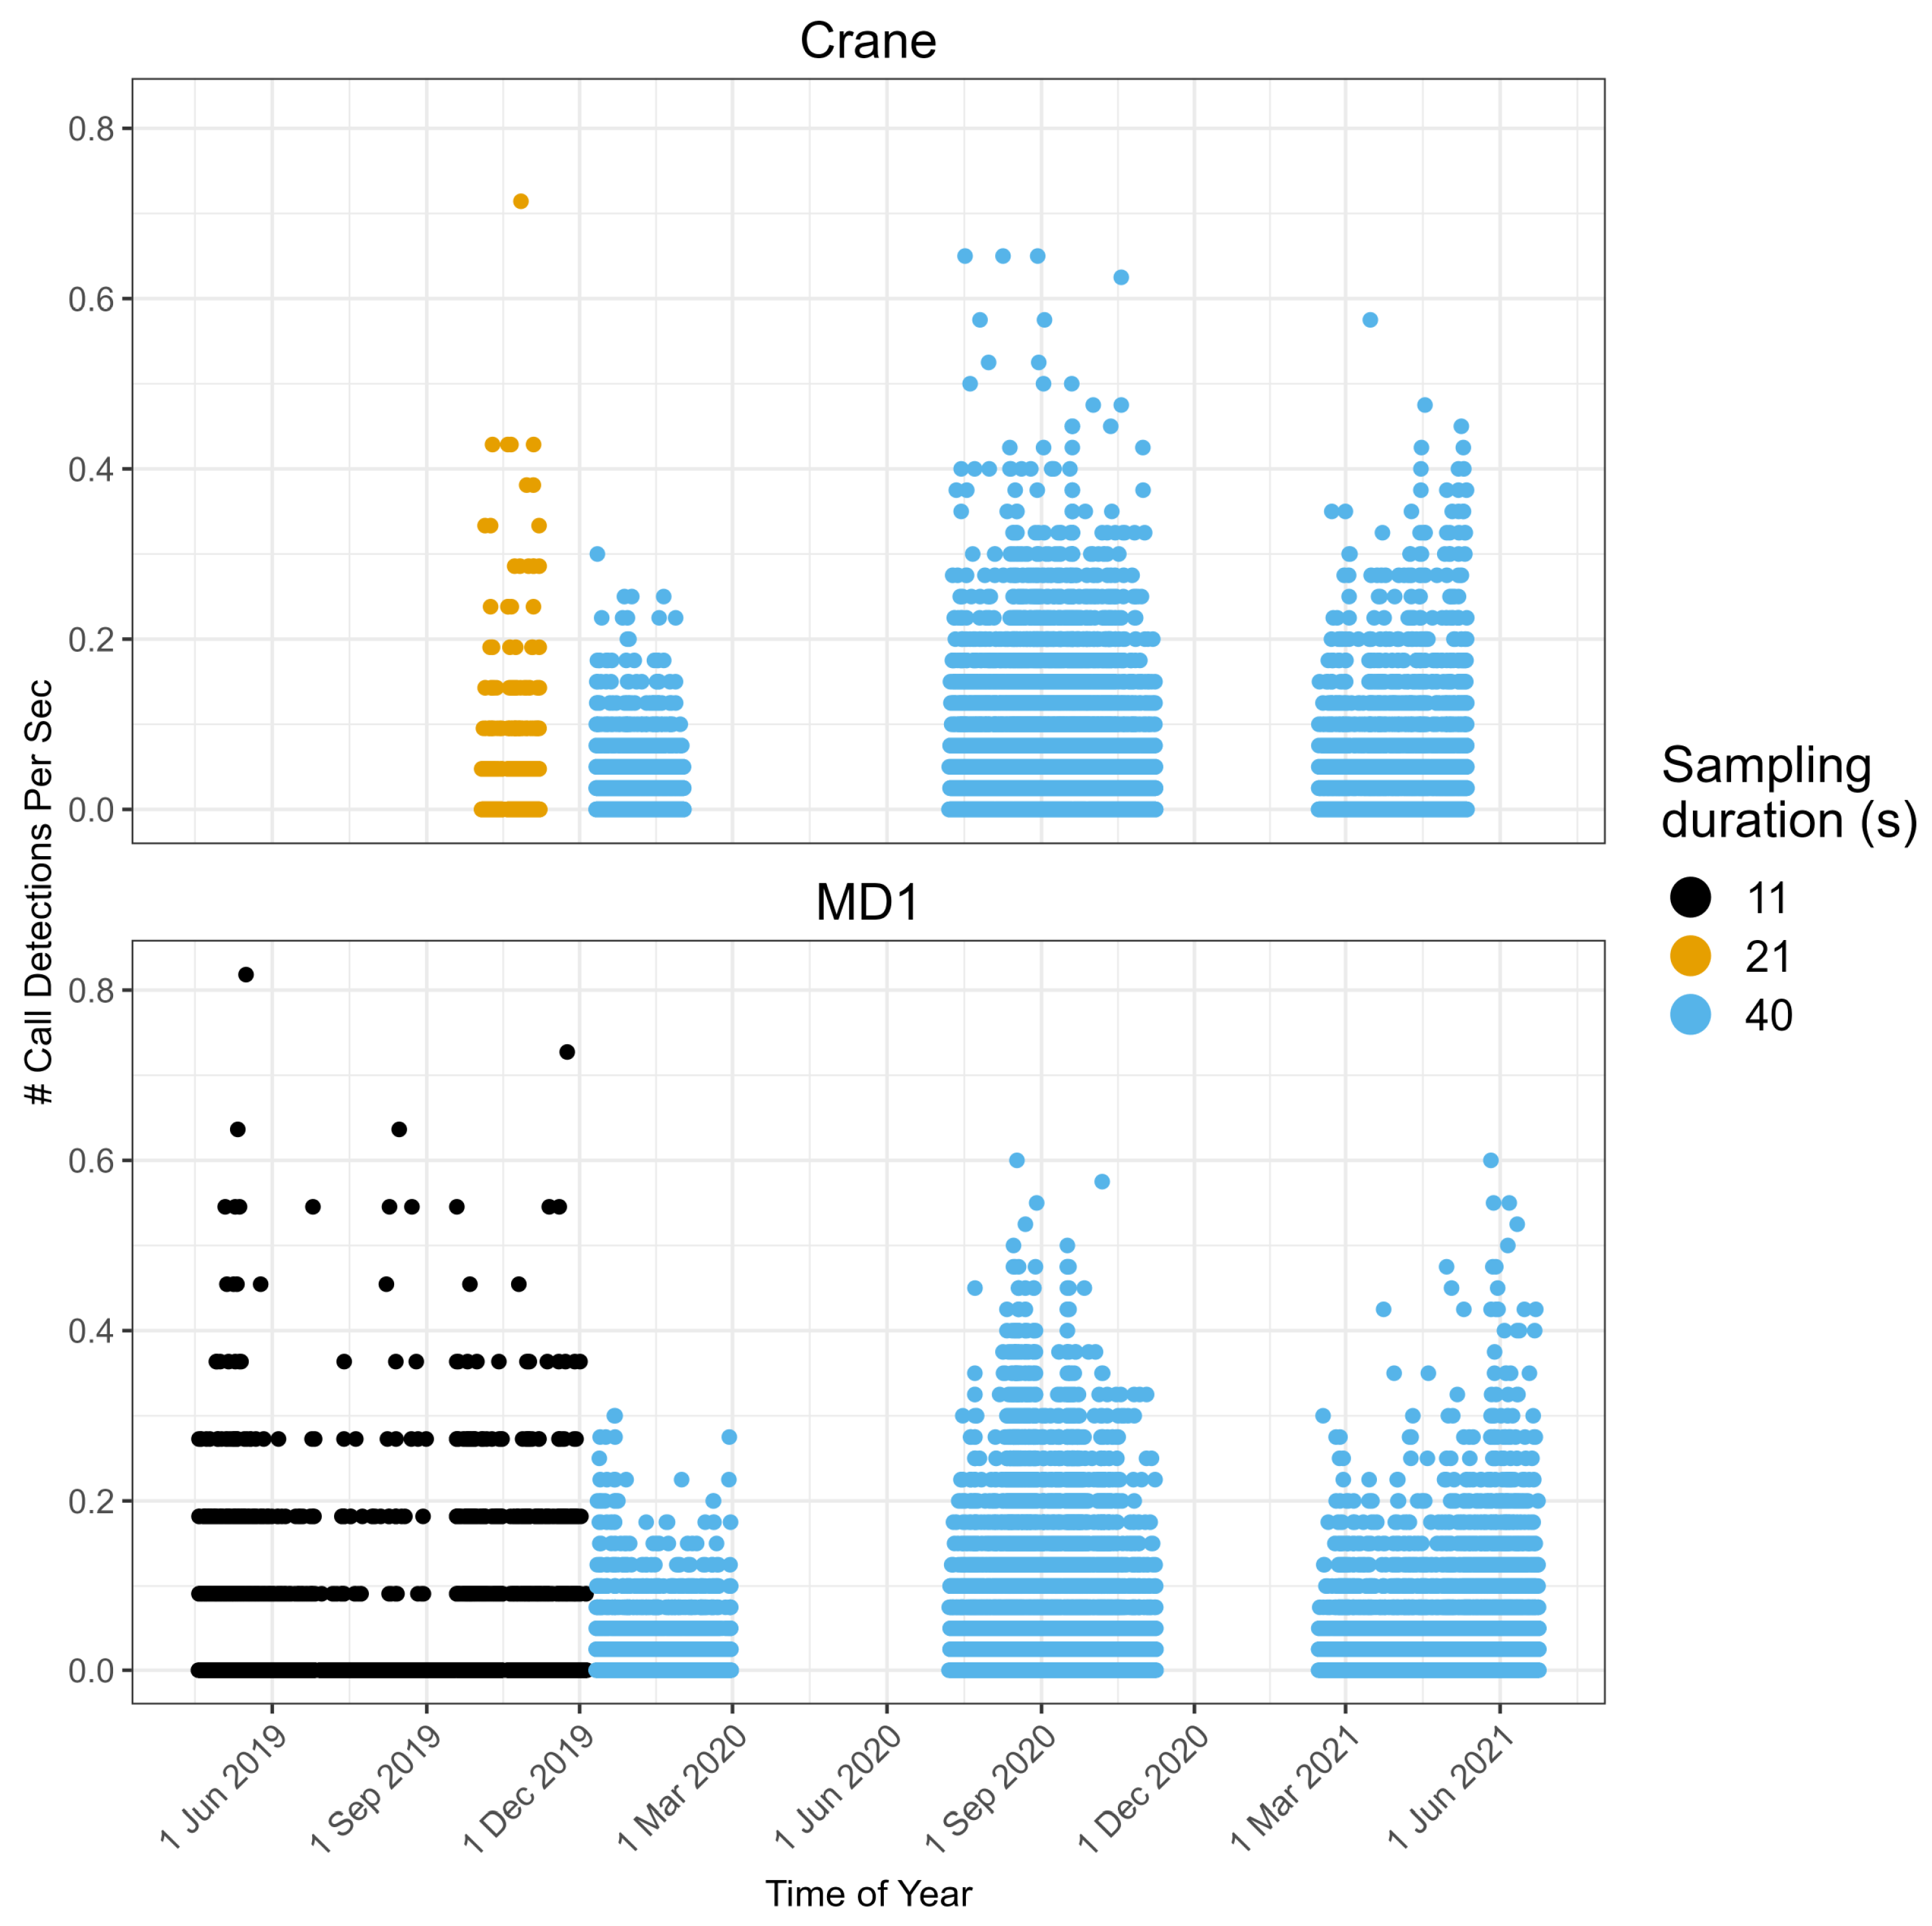
3.1. Call Detection
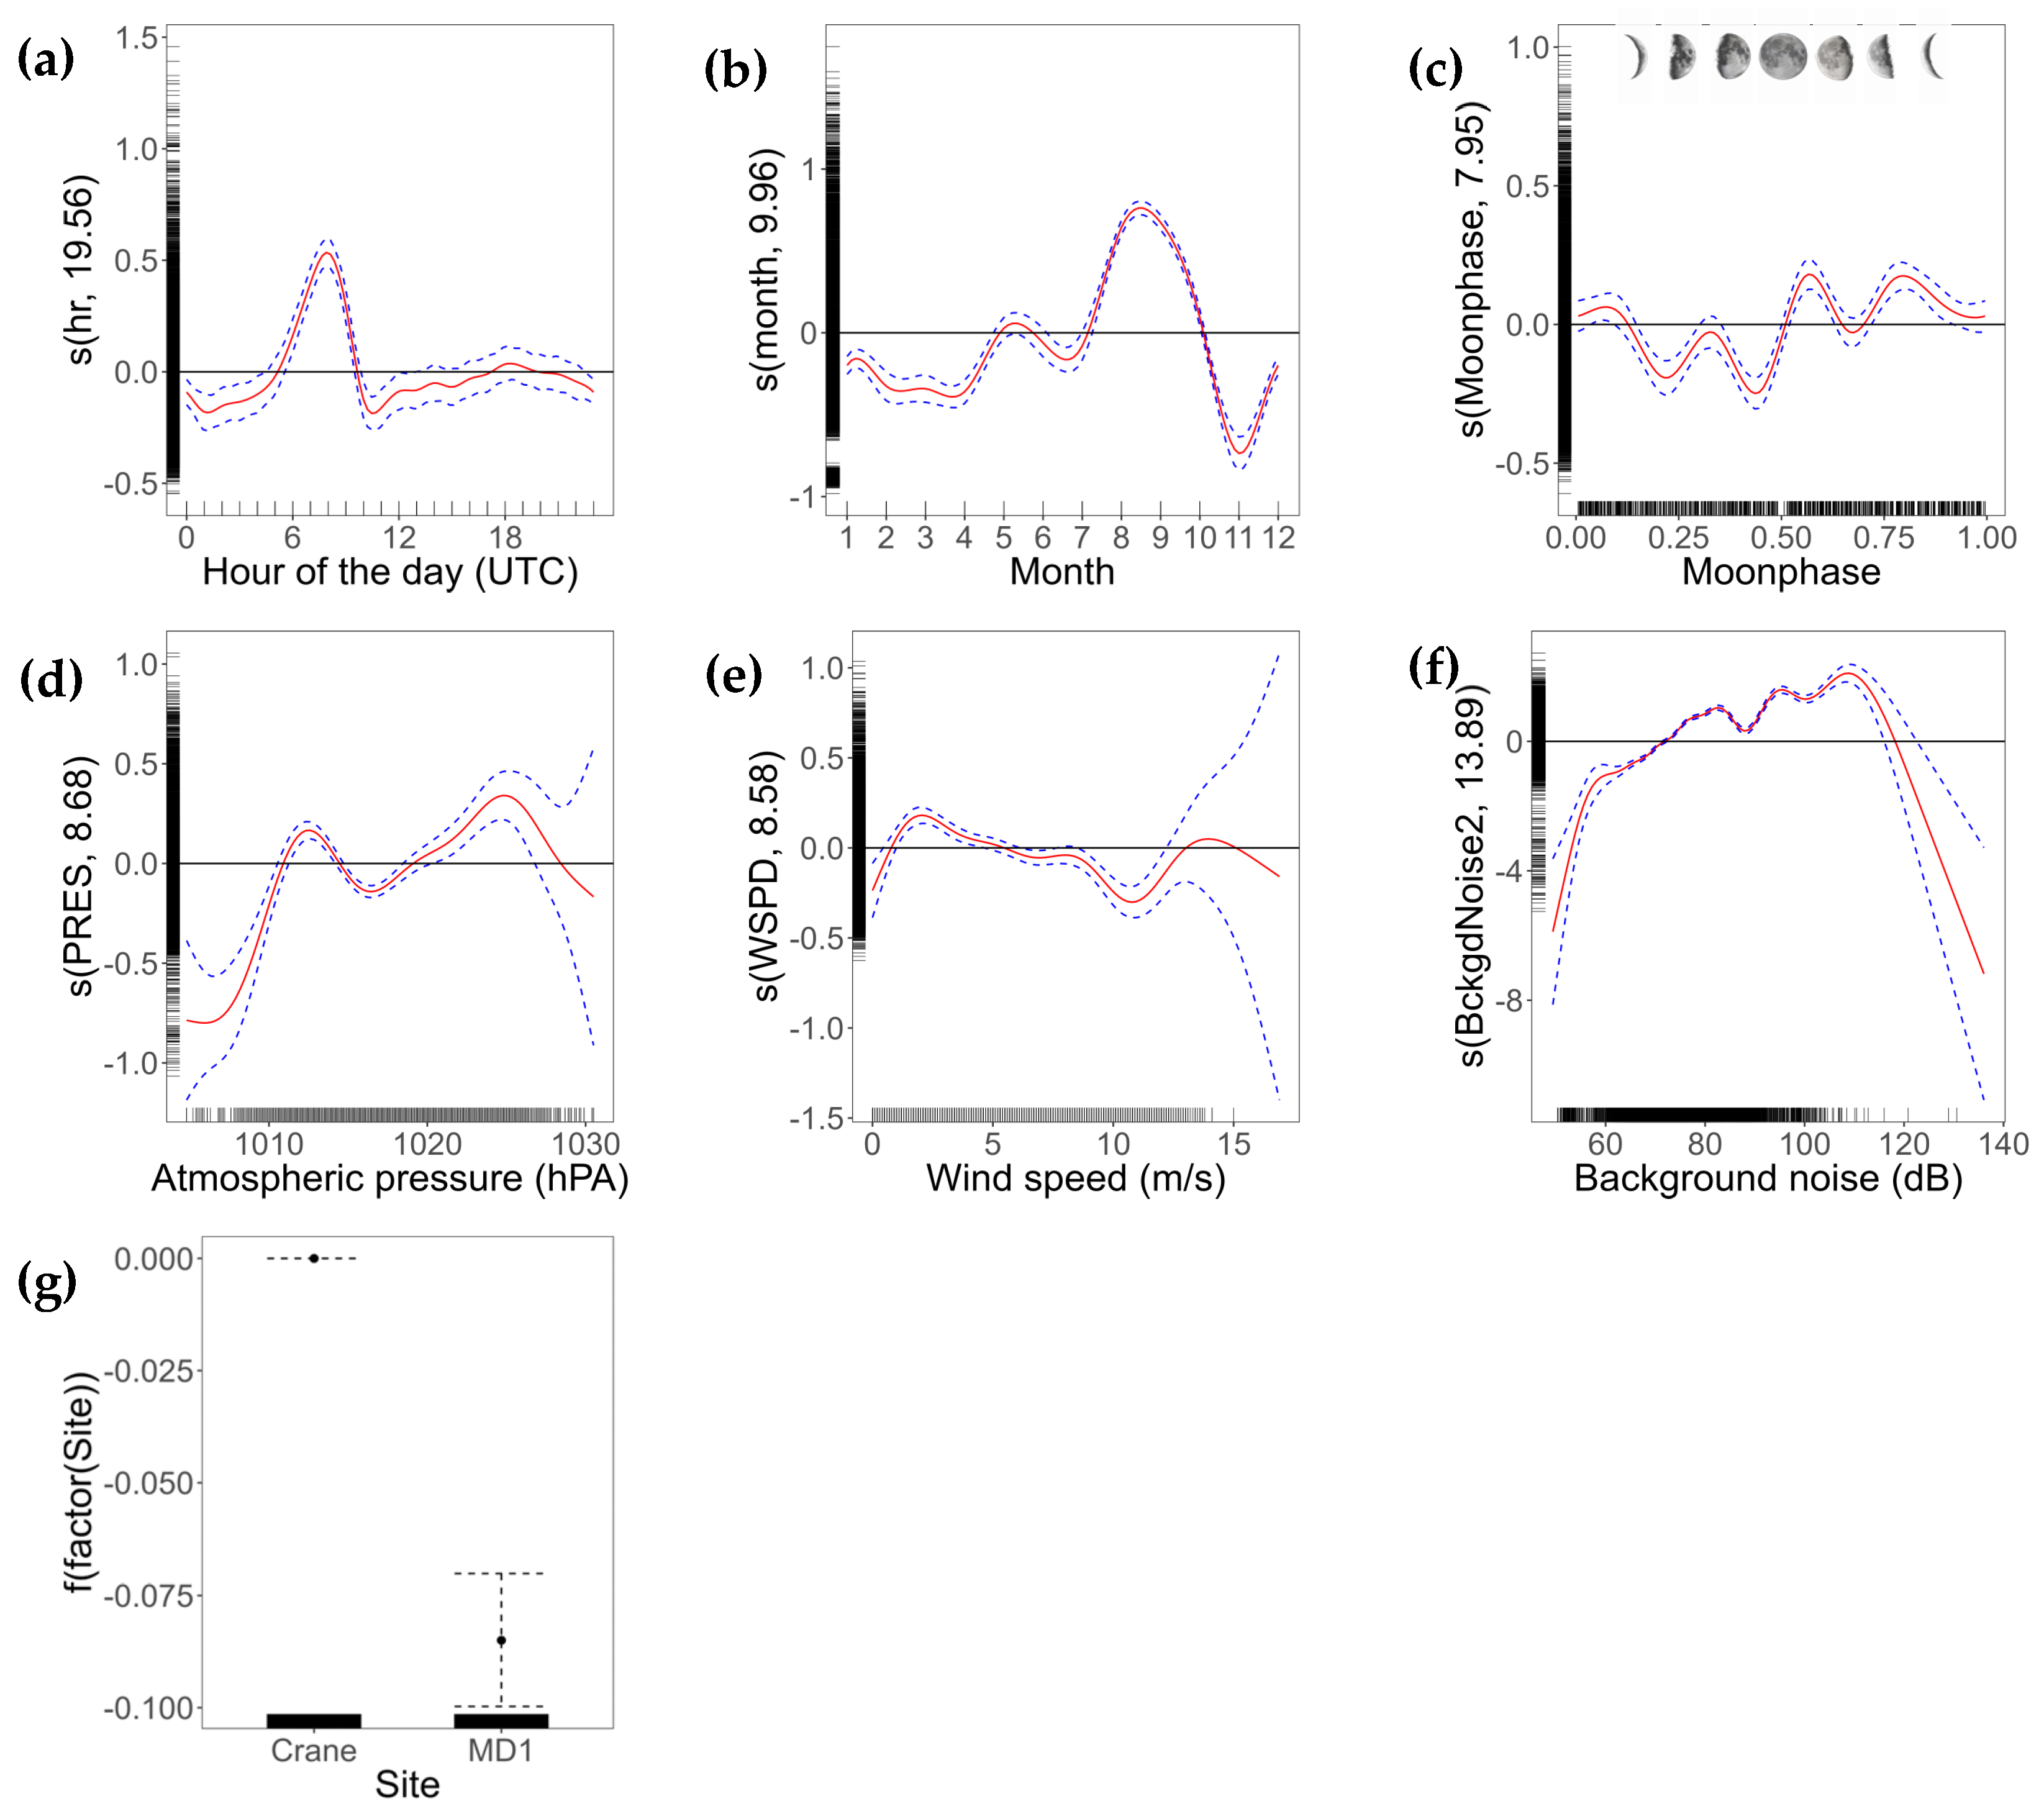
3.2. Call Model
4. Discussion
5. Conclusions
Author Contributions
Funding
Institutional Review Board Statement
Informed Consent Statement
Data Availability Statement
Acknowledgments
Conflicts of Interest
References
- Dodge, K.L.; Kukulya, A.L.; Burke, E.; Baumgartner, M.F. TurtleCam: A “Smart” Autonomous Underwater Vehicle for Investigating Behaviors and Habitats of Sea Turtles. Front. Mar. Sci. 2018, 5, 90. [Google Scholar] [CrossRef]
- Jones, R.E.; Griffin, R.A.; Rees, S.C.; Unsworth, R.K.F. Improving Visual Biodiversity Assessments of Motile Fauna in Turbid Aquatic Environments. Limnol. Oceanogr. Methods 2019, 17, 544–554. [Google Scholar] [CrossRef]
- Urick, R.J. Principles of Underwater Sound, 3rd ed.; Peninsula Publishing: Los Altos Hills, CA, USA, 1983. [Google Scholar]
- Looby, A.; Cox, K.; Bravo, S.; Rountree, R.; Juanes, F.; Reynolds, L.K.; Martin, C.W. A Quantitative Inventory of Global Soniferous Fish Diversity. Rev. Fish Biol. Fish 2022, 32, 581–595. [Google Scholar] [CrossRef]
- Mann, D.A.; Hawkins, A.D.; Jech, J.M. Active and Passive Acoustics to Locate and Study Fish. In Fish Bioacoustics; Springer: New York, NY, USA, 2008; pp. 279–309. [Google Scholar] [CrossRef]
- Mooney, T.A.; Di Iorio, L.; Lammers, M.; Lin, T.H.; Nedelec, S.L.; Parsons, M.; Radford, C.; Urban, E.; Stanley, J. Listening Forward: Approaching Marine Biodiversity Assessments Using Acoustic Methods. R. Soc. Open Sci. 2020, 7, 201287. [Google Scholar] [CrossRef] [PubMed]
- Rowell, T.J.; Demer, D.A.; Aburto-Oropeza, O.; Cota-Nieto, J.J.; Hyde, J.R.; Erisman, B.E. Estimating Fish Abundance at Spawning Aggregations from Courtship Sound Levels. Sci. Rep. 2017, 7, 3340. [Google Scholar] [CrossRef] [PubMed]
- Rowell, T.J.; Schärer, M.T.; Appeldoorn, R.S.; Nemeth, M.I.; Mann, D.A.; Rivera, J.A. Sound Production as an Indicator of Red Hind Density at a Spawning Aggregation. Mar. Ecol. Prog. Ser. 2012, 462, 241–250. [Google Scholar] [CrossRef]
- Mann, D.A.; Locascio, J.V.; Coleman, F.C.; Koenig, C.C. Goliath Grouper Epinephelus itajara Sound Production and Movement Patterns on Aggregation Sites. Endanger. Species Res. 2009, 7, 229–236. [Google Scholar] [CrossRef]
- Rycyk, A.M.; Tyson Moore, R.B.; Wells, R.S.; McHugh, K.A.; Berens McCabe, E.J.; Mann, D.A. Passive Acoustic Listening Stations (PALS) Show Rapid Onset of Ecological Effects of Harmful Algal Blooms in Real Time. Sci. Rep. 2020, 10, 17863. [Google Scholar] [CrossRef]
- Boyd, A.D.; Gowans, S.; Mann, D.A.; Simard, P. Tropical Storm Debby: Soundscape and Fish Sound Production in Tampa Bay and the Gulf of Mexico. PLoS ONE 2021, 16, e0254614. [Google Scholar] [CrossRef]
- Fish, M.P.; Kelsey, A.S.; Mowbray, W.H. Studies on the Production of Underwater Sound by North Atlantic Coastal Fishes. J. Mar. Res. 1952, 11, 769. [Google Scholar]
- Fish, M.P.; Mowbray, W.H. Sounds of Western North Atlantic Fishes: A Reference File of Biological Underwater Sounds; Rhode Island Univ Kingston Narragansett Marine Lab: Narragansett, RI, USA, 1970. [Google Scholar]
- Rountree, R.A.; Grant Gilmore, R.; Goudey, C.A.; Hawkins, A.D.; Luczkovich, J.J.; Mann, D.A. Listening to Fish: Applications of Passive Acoustics to Fisheries Science. Fisheries 2006, 31, 433–446. [Google Scholar] [CrossRef]
- Hawkins, A.D. Underwater Sound and Fish Behaviour. In The Behaviour of Teleost Fishes; Springer: New York, NY, USA, 1986; pp. 114–151. [Google Scholar] [CrossRef]
- Cato, D.H.; McCauley, R.D. Australian Research in Ambient Sea Noise. Acoust. Aust. 2002, 30, 13–20. [Google Scholar]
- Cato, D.H. The Biological Contribution to the Ambient Noise in Waters Near Australia. Acoust. Aust. 1992, 20, 76–80. [Google Scholar]
- McCauley, R.D. Fish Choruses from the Kimberley, Seasonal and Lunar Links as Determined by Long Term Sea Noise Monitoring. In Proceedings of the Acoustical Society of Australia, Fremantle, Australia, 21–23 November 2014. [Google Scholar]
- McCauley, R.D.; Cato, D.H. Separation of the Acoustic ‘“Sound Space”’ by Nearshore Fishes in the Great Barrier Reef, Australia. J. Acoust. Soc. Am. 2001, 109, 2391. [Google Scholar] [CrossRef]
- Radford, C.A.; Stanley, J.A.; Jeffs, A.G. Adjacent Coral Reef Habitats Produce Different Underwater Sound Signatures. Mar. Ecol. Prog. Ser. 2014, 505, 19–28. [Google Scholar] [CrossRef]
- Radford, C.A.; Stanley, J.A.; Tindle, C.T.; Montgomery, J.C.; Jeffs, A.G. Localised Coastal Habitats Have Distinct Underwater Sound Signatures. Mar. Ecol. Prog. Ser. 2010, 401, 21–29. [Google Scholar] [CrossRef]
- Nedelec, S.L.; Simpson, S.D.; Holderied, M.; Radford, A.N.; Lecellier, G.; Radford, C.; Lecchini, D. Soundscapes and Living Communities in Coral Reefs: Temporal and Spatial Variation. Mar. Ecol. Prog. Ser. 2015, 524, 125–135. [Google Scholar] [CrossRef]
- Bertoncini, A.A.; Aguilar-Perera, A.; Barreiros, J.; Craig, M.T.; Ferreira, B.; Koenig, C. Epinephelus itajara (Atlantic Goliath Grouper); IUCN Red List: Cambridge, UK, 2018; p. e.T195409A145206345. [Google Scholar] [CrossRef]
- Bullock, L.H.; Murphy, M.D.; Godcharles, M.F.; Mitchell, M.E. Age, Growth, and Reproduction of Jewfish Epinephelus itajara in the Eastern Gulf of Mexico. Fish. Bull. 1992, 90, 243–249. [Google Scholar]
- Hughes, A.T.; Hamilton, R.J.; Choat, J.H.; Rhodes, K.L. Declining Grouper Spawning Aggregations in Western Province, Solomon Islands, Signal the Need for a Modified Management Approach. PLoS ONE 2020, 15, e0230485. [Google Scholar] [CrossRef]
- Koenig, C.C.; Coleman, F.C.; Malinowski, C.R. Atlantic Goliath Grouper of Florida: To Fish or Not to Fish. Fisheries 2020, 45, 20–32. [Google Scholar] [CrossRef]
- Cass-Calay, S.L.; Schmidy, T.W. Monitoring Changes in the Catch Rates and Abundance of Juvenile Goliath Grouper Using the ENP Creel Survey, 1973–2006. Endanger. Species Res. 2009, 7, 183–193. [Google Scholar] [CrossRef]
- Status Report on the Continental United States Distinct Population Segment of the Goliath Grouper (Epinephelus itajara), NMFS (National Marine Fisheries Service): St. Petersburg, FL, USA, 12 January 2006; 49p.
- Bueno, L.S.; Bertoncini, A.A.; Koenig, C.C.; Coleman, F.C.; Freitas, M.O.; Leite, J.R.; De Souza, T.F.; Hostim-Silva, M. Evidence for Spawning Aggregations of the Endangered Atlantic Goliath Grouper Epinephelus itajara in Southern Brazil. J. Fish Biol. 2016, 89, 876–889. [Google Scholar] [CrossRef]
- Craig, M.T.; Graham, R.T.; Torres, R.A.; Hyde, J.R.; Freitas, M.O.; Ferreira, B.P.; Hostim-Silva, M.; Gerhardinger, L.C.; Bertoncini, A.A.; Robertson, D.R. How Many Species of Goliath Grouper Are There? Cryptic Genetic Divergence in a Threatened Marine Fish and the Resurrection of a Geopolitical Species. Endanger. Species Res. 2009, 7, 167–174. [Google Scholar] [CrossRef]
- Koenig, C.C.; Coleman, F.C.; Kingon, K. Pattern of Recovery of the Goliath Grouper Epinephelus itajara Population in the Southeastern US. Bull. Mar. Sci. 2011, 87, 891–911. [Google Scholar] [CrossRef]
- Malinowski, C.; Coleman, F.; Koenig, C.; Locascio, J.; Murie, D. Are Atlantic Goliath Grouper, Epinephelus itajara, Establishing More Northerly Spawning Sites? Evidence from the Northeast Gulf of Mexico. Bull. Mar. Sci. 2019, 95, 371–391. [Google Scholar] [CrossRef]
- Koenig, C.C.; Coleman, F.C.; Eklund, A.-M.; Schull, J.; Ueland, J. Mangroves as Essential Nursery Habitat for Goliath Grouper. Bull. Mar. Sci. 2007, 80, 567–586. [Google Scholar]
- Koenig, C.C.; Bueno, L.S.; Coleman, F.C.; Cusick, J.A.; Ellis, R.D.; Kingon, K.; Locascio, J.V.; Malinowski, C.; Murie, D.J.; Stallings, C.D. Diel, Lunar, and Seasonal Spawning Patterns of the Atlantic Goliath Grouper, Epinephelus itajara, off Florida, United States. Bull. Mar. Sci. 2017, 93, 391–406. [Google Scholar] [CrossRef]
- Wozenkraft, J.; Jacobs, I. Principles of Communication Engineering; John Wiley & Sons Inc.: New York, NY, USA; London, UK; Sydney, Australia, 1965. [Google Scholar]
- Duda, R.O.; Hart, P.E. Pattern Classification and Scene Analysis; Wiley: New York, NY, USA, 1973; Volume 3. [Google Scholar]
- Jain, A.K. Fundamentals of Digital Image Processing; Prentice-Hall, Inc.: Hoboken, NJ, USA, 1989. [Google Scholar]
- Elm, S. Cascade Matched Filtering & Adaptive Threshold Techniques on Optical Tracking Signals under AWGN. Master’s Thesis, Lund University, Lund, Sweden, 2019. [Google Scholar]
- Altaher, A.S.; Zhuang, H.; Ibrahim, A.K.; Muhamed Ali, A.; Altaher, A.; Locascio, J.; McCallister, M.P.; Ajemian, M.J.; Chérubin, L.M. Detection and Localization of Goliath Grouper Using Their Low- Frequency Pulse Sounds. J. Acoust. Soc. Am. 2023, 153, 2190–2202. [Google Scholar] [CrossRef] [PubMed]
- Zuur, A.F.; Ieno, E.N.; Elphick, C.S. A Protocol for Data Exploration to Avoid Common Statistical Problems. Methods Ecol. Evol. 2010, 1, 3–14. [Google Scholar] [CrossRef]
- Akaike, H. Information Theory and an Extension of the Maximum Likelihood Principle. In Proceedings of the 2nd International Symposium on Information Theory, Tsahkadsor, Armenia, 2–8 September 1971; Petrov, B.N., Csáki, F., Eds.; Publishing House of the Hungarian Academy: Budapest, Hungary, 1973; pp. 268–281. [Google Scholar]
- Rowell, T.J.; Nemeth, R.S.; Schärer, M.T.; Appeldoorn, R.S. Fish Sound Production and Acoustic Telemetry Reveal Behaviors and Spatial Patterns Associated with Spawning Aggregations of Two Caribbean Groupers. Mar. Ecol. Prog. Ser. 2015, 518, 239–254. [Google Scholar] [CrossRef]
- Chérubin, L.M.; Dalgleish, F.; Ibrahim, A.K.; Schärer-Umpierre, M.; Nemeth, R.S.; Matthews, A.; Appeldoorn, R. Fish Spawning Aggregations Dynamics as Inferred From a Novel, Persistent Presence Robotic Approach. Front. Mar. Sci. 2020, 6, 779. [Google Scholar] [CrossRef]
- Shapiro, D.Y.; Sadovy, Y.; McGehee, M.A. Size, Composition, and Spatial Structure of the Annual Spawning Aggregation of the Red Hind, Epinephelus guttatus (Pisces: Serranidae). Copeia 1993, 1993, 399. [Google Scholar] [CrossRef]
- Wilson, K.C.; Semmens, B.X.; Pattengill-Semmens, C.V.; McCoy, C.; Širović, A. Potential for Grouper Acoustic Competition and Partitioning at a Multispecies Spawning Site off Little Cayman, Cayman Islands. Mar. Ecol. Prog. Ser. 2020, 634, 127–146. [Google Scholar] [CrossRef]
- Zhu, X.; Zhang, X.; Chen, M.; Xu, X. Characteristics of Auditory Brainstem Response in Wild Yellow Grouper Epinephelus awoara. Front. Mar. Sci. 2023, 10, 1135310. [Google Scholar] [CrossRef]
- Popper, A.N.; Hawkins, A.D. An Overview of Fish Bioacoustics and the Impacts of Anthropogenic Sounds on Fishes. J. Fish Biol. 2019, 94, 692–713. [Google Scholar] [CrossRef] [PubMed]
- Collins, A.B.; Barbieri, L.R.; McBride, R.S.; McCoy, E.D.; Motta, P.J. Reef Relief and Volume Are Predictors of Atlantic Goliath Grouper Presence and Abundance in the Eastern Gulf of Mexico. Bull. Mar. Sci. 2015, 91, 399–418. [Google Scholar] [CrossRef]
- Kanamori, Y.; Takasuka, A.; Nishijima, S.; Okamura, H. Climate Change Shifts the Spawning Ground Northward and Extends the Spawning Period of Chub Mackerel in the Western North Pacific. Mar. Ecol. Prog. Ser. 2019, 624, 155–166. [Google Scholar] [CrossRef]
- Narins, P.M.; Clark, G.A. Principles of Matched Filtering with Auditory Examples from Selected Vertebrates. In The Ecology of Animal Senses: Matched Filters for Economical Sensing; Springer: Cham, Switzerland, 2015; pp. 111–140. [Google Scholar] [CrossRef]
- Harakawa, R.; Ogawa, T.; Haseyama, M.; Akamatsu, T. Automatic Detection of Fish Sounds Based on Multi-Stage Classification Including Logistic Regression via Adaptive Feature Weighting. J. Acoust. Soc. Am. 2018, 144, 2709. [Google Scholar] [CrossRef]
- Urazghildiiev, I.R.; Parijs, S.M. Van Automatic Grunt Detector and Recognizer for Atlantic Cod (Gadus morhua). J. Acoust. Soc. Am. 2016, 139, 2532. [Google Scholar] [CrossRef]
- Brewster, L.R.; Ibrahim, A.K.; DeGroot, B.C.; Ostendorf, T.J.; Zhuang, H.; Chérubin, L.M.; Ajemian, M.J. Classifying Goliath Grouper (Epinephelus itajara) Behaviors from a Novel, Multi-Sensor Tag. Sensors 2021, 21, 6392. [Google Scholar] [CrossRef]
- Hawkins, A.D.; Picciulin, M. The Importance of Underwater Sounds to Gadoid Fishes). J. Acoust. Soc. Am. 2019, 146, 3536. [Google Scholar] [CrossRef] [PubMed]
- Locascio, J.V.; Burton, M.L. A Passive Acoustic Survey of Fish Sound Production at Riley’s Hump within Tortugas South Ecological Reserve: Implications Regarding Spawning and Habitat Use. Fish. Bull. 2016, 114, 103–116. [Google Scholar] [CrossRef]
- Rowell, T.J.; Schärer, M.T.; Appeldoorn, R.S.; Allison, J.G.; Wagner, M.E.; McAllister, M.; Ren, A.K.J.; Snyder, R.A.; Flaherty, K.E.; Winner, B.L.; et al. Description of a New Sound Produced by Nassau Grouper at Spawning Aggregation Sites. Gulf Caribb. Res. 2018, 29, GCFI22–GCFI26. [Google Scholar] [CrossRef]


| Variable | Description | Range in Dataset |
|---|---|---|
| Wind speed (m/s) | Wind speed averaged over an eight-min period | 0.3–15.8 |
| Water temperature (°C) | Sea surface temperature | 17.5–29.0 |
| Atmospheric pressure (hPA) | Sea level pressure | 1003.6–1024.4 |
| Moon phase | Obtained using the longitude and latitude of MD1 and the ‘suncalc’ package. Treated as a circular smoother. | 0–1 0: New Moon Waxing Crescent 0.25: First Quarter Waxing Gibbous 0.5: Full Moon Waning Gibbous 0.75: Last Quarter Waning Crescent |
| Hour of the day | Treated as a circular smoother. In UTC. | 0–23 |
| Month | Month of the year. Treated as a circular smoother. | 1–12 |
| Background noise (dB re 1 µPa) | Mean sound pressure level in the 100–200 Hz frequency band | 50–140 |
| Site | Location that the data was collected at. Treated as a factor. | MD1, Crane |
| Site | Sensitivity | Precision | F |
|---|---|---|---|
| Crane | 0.9749 | 0.9164 | 0.9448 |
| MD1 | 0.9757 | 0.9380 | 0.9565 |
| Covariate | edf | Ref.df | F | p-value | R2 (adj.) | Deviance Explained (%) | |
|---|---|---|---|---|---|---|---|
| Hour | 19.558 | 22.000 | 145.72 | <0.05 | 0.165 | 20.7 | |
| Month | 9.960 | 10.000 | 1077.14 | <0.05 | |||
| Moon phase | 7.953 | 8.000 | 132.23 | <0.05 | |||
| Atmospheric pressure | 8.681 | 8.959 | 149.29 | <0.05 | |||
| Windspeed | 8.583 | 8.929 | 79.72 | <0.05 | |||
| Background noise | 13.888 | 13.996 | 1875.77 | <0.05 | |||
| Level | Coefficient | SE | t value | ||||
| Site | Crane | −4.707782 | 0.006428 | −732.4 | |||
| MD1 | −0.084985 | 0.007523 | −11.3 | <0.05 |
| Model | Log-Likelihood | AIC | ΔAIC |
|---|---|---|---|
| s(hour) + s(month) + s(moon phase) + s(atmospheric pressure) + s(wind speed) + s(background noise) + factor(site) | 6008.532 | −11,870.9 | 0 |
| s(hour) + s(month) + s(moon phase) + s(atmospheric pressure) + s(wind speed) + s(background noise) | 5944.768 | −11,745.4 | 125.52 |
| s(hour) + s(month) + s(moon phase) + s(atmospheric pressure) + s(background noise) + factor(site) | 5650.363 | −11,172.1 | 698.82 |
| s(hour) + s(month) + s(moon phase) + s(atmospheric pressure) + s(background noise) | 5587.614 | −11,048.6 | 822.31 |
| s(hour) + s(month) + s(atmospheric pressure) + s(wind speed) + s(background noise) + factor(site) | 5474.450 | −10,818.6 | 1052.34 |
Disclaimer/Publisher’s Note: The statements, opinions and data contained in all publications are solely those of the individual author(s) and contributor(s) and not of MDPI and/or the editor(s). MDPI and/or the editor(s) disclaim responsibility for any injury to people or property resulting from any ideas, methods, instructions or products referred to in the content. |
© 2023 by the authors. Licensee MDPI, Basel, Switzerland. This article is an open access article distributed under the terms and conditions of the Creative Commons Attribution (CC BY) license (https://creativecommons.org/licenses/by/4.0/).
Share and Cite
Brewster, L.R.; Ibrahim, A.K.; Locascio, J.; DeGroot, B.C.; Chérubin, L.M.; Ajemian, M.J. Seasonal Dynamics and Environmental Drivers of Goliath Grouper (Epinephelus itajara) Sound Production. Fishes 2023, 8, 293. https://doi.org/10.3390/fishes8060293
Brewster LR, Ibrahim AK, Locascio J, DeGroot BC, Chérubin LM, Ajemian MJ. Seasonal Dynamics and Environmental Drivers of Goliath Grouper (Epinephelus itajara) Sound Production. Fishes. 2023; 8(6):293. https://doi.org/10.3390/fishes8060293
Chicago/Turabian StyleBrewster, Lauran R., Ali K. Ibrahim, James Locascio, Breanna C. DeGroot, Laurent M. Chérubin, and Matthew J. Ajemian. 2023. "Seasonal Dynamics and Environmental Drivers of Goliath Grouper (Epinephelus itajara) Sound Production" Fishes 8, no. 6: 293. https://doi.org/10.3390/fishes8060293
APA StyleBrewster, L. R., Ibrahim, A. K., Locascio, J., DeGroot, B. C., Chérubin, L. M., & Ajemian, M. J. (2023). Seasonal Dynamics and Environmental Drivers of Goliath Grouper (Epinephelus itajara) Sound Production. Fishes, 8(6), 293. https://doi.org/10.3390/fishes8060293