Article

Resource Partitioning of Sympatric Lutjanids in the Northern Gulf of Mexico Using Stable Isotope Analysis

by
Steven B. Garner
1,2,*,
Michelle Zapp Sluis
3,
R. J. David Wells
3,
Kevin M. Boswell
4 and
James H. Cowan, Jr.
5,†
1
Cooperative Institute for Marine and Atmospheric Sciences, Rosenstiel School of Marine and Atmospheric Science, University of Miami, Miami, FL 33149, USA
2
National Marine Fisheries Service, Southeast Fisheries Science Center, 3500 Delwood Beach Rd., Panama City, FL 32408, USA
3
Department of Marine Biology, Texas A&M University at Galveston, 1001 Texas Clipper Rd., Galveston, TX 77553, USA
4
Coastlines and Oceans Division of the Institute of Environment, Florida International University, 3000 NE 151st St., North Miami, FL 33181, USA
5
Department of Oceanography & Coastal Sciences, Louisiana State University, 2247 Energy, Coast & Environment Bldg., Baton Rouge, LA 70803, USA
*
Author to whom correspondence should be addressed.
Deceased author.
Fishes 2023, 8(5), 244; https://doi.org/10.3390/fishes8050244
Submission received: 28 March 2023 / Revised: 28 April 2023 / Accepted: 2 May 2023 / Published: 8 May 2023
(This article belongs to the Section Biology and Ecology)

Abstract

:
Lutjanid snappers are ubiquitous at reef sites in the northern Gulf of Mexico (Gulf), but the degree of niche overlap and basal resource utilization is unknown for most species. Muscle tissue for stable isotope analysis was opportunistically sampled from red snapper (Lujanus campechanus), gray snapper (Lutjanus griseus), lane snapper (Lutjanus synagris), and vermilion snapper (Rhomboplites aurorubens) recreational catches across the northern Gulf. A Bayesian mixing model used to compare resource utilization indicated that Lutjanids occupy niches with varying degrees of overlap among regions but maintain a consistent hierarchy in isotopic composition. Scale shifts among regions were likely due to differences in riverine outflow, nitrogen fixation, and anoxic zones that alter prey abundance or isotopic δ15N ratios. All four Lutjanid species had high percent contributions from particulate organic matter and benthic microalgae with little contribution by macroalgae to any species in any region. Ontogenetic shifts in stable isotope values were observed in most species indicating that size plays an important role in avoiding niche overlap due to intense competition for high-value prey items among congeners at isolated reef sites. Diet specialization is modest but likely plays an important role in avoiding complete niche overlap.
Key Contribution: Lutjanid isotope data collected from four regions of the Gulf of Mexico indicated dynamic niches among regions while maintaining a consistent among-species hierarchy. Lutjanids rely on ontogenetic shifts, behavioral differences, and modest diet specialization to avoid complete niche overlap while feeding on a wide variety of shared prey resources.

1. Introduction

The Gulf of Mexico (Gulf) shelf is characterized by differences in riverine outflows, sediment composition, natural and artificial habitats, and latitudinal temperature gradients. Drowned river deltas, relic oyster reefs, and shelf-edge breaks provide the predominant large-scale natural features, while artificial reefs and oil infrastructure have been distributed throughout shallow depths [1,2], all of which support diverse reef fish communities [3,4,5,6]. Despite a wide range of specific habitat features (e.g., rugosity, height, and depth), fish communities at northern Gulf reef sites show remarkably consistent community composition in time and space at similar latitudes [3,4,5,6].
Relationships among habitats and reef fish community structure have been described in numerous studies, yet few have investigated resource partitioning among fishes in the Gulf region and none at a Gulf-wide scale [7,8,9]. Resource partitioning at a given scale is dependent upon a variety of factors, including prey availability and abundance [10,11,12], species and functional diversity [10,13], competition and predation [12,14,15], ontogeny [16,17], and habitat [12,18]. Regardless of the community’s composition, differences in temporal, spatial, and ecological preferences among species must facilitate niche separation on at least one resource dimension as two sympatric competitors cannot completely overlap [19], or sources of mortality must be sufficient as to limit overexploitation of shared resources [20,21]. Direct observation of prey via gut contents or benthic sampling devices provides some insight into resource utilization, but apparent prey abundance versus energetic value may be misleading when prey have dramatically different digestion rates or energy densities [22,23,24,25]. This disconnect between what is consumed and what is critical limits our ability to understand ecosystem-level effects of climate change, invasive species [26,27], or environmental disasters like the Deepwater Horizon oil spill [7,27] on reef fish community ecology in the northern Gulf.
Stable isotopes provide a means to integrate resource utilization over time while also tracing primary producer resource pools. Isotopic signatures of primary producers utilizing C3 vs. C4 pathways are distinct, and the 13C stable isotope fractionates very little during incorporation into consumer muscle tissue. The lighter stable isotope 14N is preferentially utilized over the heavier stable isotope 15N during de- or transamination in consistent ratios (i.e., fractionation), which allows the placement of consumers within the food web hierarchy [28,29,30]. The 34S stable isotope of sulfur also fractionates very little during incorporation into muscle tissues and is used to infer consumers’ proximity to benthic anoxic layers [28,31]. For example, muscle tissue of fishes that primarily consume benthic and infaunal invertebrates would be expected to have less enriched 34S values than fishes feeding on zooplankton up in the water column due to consistent differences in 34S values between the water column and benthic resource pools. Stable isotope ratios can be input into Bayesian mixing models to estimate the percent contribution of basal resources to reef fish diets [8,32].
Lutjanids are a sympatric group of reef fishes found throughout the northern Gulf with generally similar morphology and behavior that occupy overlapping habitats both spatially and temporally throughout most of their ontogeny. Lutjanids are mesopredators with small to large body sizes [33,34] that play an important role in the vertical transfer of energy from low-level consumers to top predators [35]. Diet data suggest Lutjanids are generalists, consuming many common prey items such as zooplankton, cephalopods, and small fishes, especially at late juvenile and early adult size classes [36,37]. High Lutjanid density and site fidelity are concomitant with small home ranges at reef sites and can result in epibenthic deserts of epi- and infaunal diversity that extend several meters out from the reef edge [11,38,39]. Lutjanids exhibit wide dietary overlap because they utilize forage fish, zooplankton, and meiobenthic communities [33,34,40,41]. However, it remains unclear how Lutjanids partition niches and how niche separation changes among regions and habitats.
The objective of this study was to examine basal resource utilization and niche partitioning of Lutjanids by comparing stable isotope ratios from muscle tissues of fishes collected at reef sites throughout the northern Gulf. Red snapper (RS, Lutjanus campechanus), vermilion snapper (VS, Rhomboplites aurorubens), gray snapper (GS, Lutjanus griseus), and lane snapper (LS, Lutjanus synagris) were chosen because of their ubiquity at reef sites in the northern Gulf, numerical dominance among reef fish communities, abundance of diet data, and economic importance as fishery species.

2. Materials and Methods

2.1. Sample Collection

The four Lutjanid species were sampled opportunistically from recreational charter vessels between June and August 2009 across four regions in the Gulf: the western Gulf (WG) along the Texas shelf from Galveston to South Padre Island, west-central Gulf (WCG) out of Port Fourchon, Louisiana, east-central Gulf (ECG) out of Dauphin Island, Alabama, and the eastern Gulf (EG) along the Florida shelf form Destin to Tampa, Florida (Figure 1). All Lutjanids were identified to species, and total length (TL) was recorded to the nearest millimeter (Table 1).
Muscle tissue samples for stable isotope analyses were collected in the field by removing a 50 × 25 mm piece of dorsal anterior epaxial muscle from the fish’s right side with a clean stainless-steel scalpel. Tissue samples were stored in sterile polyethylene vials and placed on ice for transport to the laboratory, where they were stored at –80 °C. In the laboratory, tissue samples were dried in a Yamato model DX600 drying oven at 60 °C for 24 h. Samples were then homogenized with a ball-mill grinder and stored in clean glass scintillation vials prior to chemical analysis.

2.2. Chemical Analysis

The isotopic composition of δ15N, δ13C, and δ34S was analyzed with a Finnigan MAT DeltaPlus continuous-flow stable isotope mass spectrometer (Thermo Fisher Scientific, Waltham, MA, USA) attached to a Carlo Erba elemental analyzer at Louisiana State University following the batch analysis methods and standards used by Fry [42]. Approximately 5 mg of dry ground epaxial muscle tissue was placed in a weighing tin with 10 mg of pre-combusted vanadium pentoxide (V2O5). Isotope ratios are reported relative to known standards (i.e., atmospheric N2 for δ15N, Vienna PeeDee belemnite for δ13C, and Vienna Canyon Diablo troilite for δ34S) following the formula:
δ sample = R s a m p l e R s t a n d a r d 1 × 1000
where Rsample is the ratio of each element-specific isotope to the non-isotopic form measured in each sample, and Rstandard is the ratio measured in the standard. Replicate isotope analyses of δ13C, δ15N, or δ34S differed by ≤0.2%.

2.3. Statistical Analysis

A three-factor permutational multivariate analysis of variance (PERMANOVA, v7.0.13, Primer-e, Albany, Auckland, New Zealand, 2022) was used to assess the effects of the region (n = 4) and species (n = 4) on stable isotope ratios of Lutjanids [43]. Stable isotope ratios of δ13C, δ15N, and δ34S were included as dependent variables, with region and species as independent variables. Fish TL was included as a covariate to correct for size-related differences within Lutjanids. Isotope data were square-root transformed, and the Bray–Curtis similarity measure was computed between each pair of samples. PERMANOVA models were estimated with 9999 permutations and type III sums of squares with the a priori significance levels set to α = 0.05. General linear models (two-way ANOVAs, type III SS) were conducted in R (version 4.1.2) [44] to compare TL of each species by region as well as species-specific isotope values versus TL (α was set at 0.05 a priori for all significance tests). Diagnostic plots were used to assess assumptions of normality and homoscedasticity.
Bayesian mixing models were used to assess the potential contribution of basal food web components present in the northern Gulf to the diets of the four Lutjanids. The basal food web components included benthic microalgae (BMA), macroalgae (MA), and particulate organic matter (POM) that were collected from the WCG concomitant with fish collections following the methods described by Daigle et al. [32]. Mixing models were estimated with the Stable Isotope Analysis in the R package (“SIAR” version 4.0) [45]. In mixing models, trophic fractionation for δ13C was specified with a value of 1.0‰ (SD ± 0.3‰) [31,46]. As δ15N fractionation ranges from 2.5 to 3.5‰ (SD ± 0.6‰) in aquatic systems based on the literature-reported values [29,30], therefore a δ15N fractionation value of 3.0‰ was assigned per trophic position [31]. Region-specific (i.e., WG, WCG, ECG, or EG) mixing models were developed for each of the four Lutjanids. Stable Isotope Bayesian Ellipses in R (SIBER) [47] were used to generate standard ellipse areas corrected for small sample size (SEAc; containing 40% of the data) with the formula:
S E A c = S E A ( n 1 ) ( n 2 )
and convex hulls (total area) for δ13C, δ15N, or δ34S tissue values from snappers within each collection region. Isotopic niche space and overlap (‰2) were estimated with the maxLikOverlap function in SIBER to estimate the area and overlap between two ellipses based on the maximum likelihood of fitted ellipses. The percent overlap of niche space between two species within a region was calculated as a proportion of the overlap compared to the non-overlapping area of each niche.

3. Results

A total of 321 Lutjanids comprised of 45 GS, 25 LS, 150 RS, and 101 vs. were collected for stable isotope analysis (Table 1). Due to sample availability, no GS or RS were collected from the ECG. Species-specific mean (±SE) TLs for GS, LS, RS, and vs. were 446.8 (±14.0), 325.1 (±12.4), 524.3 (±7.7), and 360.6 (±6.1) mm, respectively. Species-specific (two-way) ANOVAs of the region by TL indicated LS, RS, and vs. had significantly different TLs among regions (p < 0.05); GS TL was not significantly different (p = 0.655). Therefore, TL was used as a covariate in subsequent analyses for all four species.
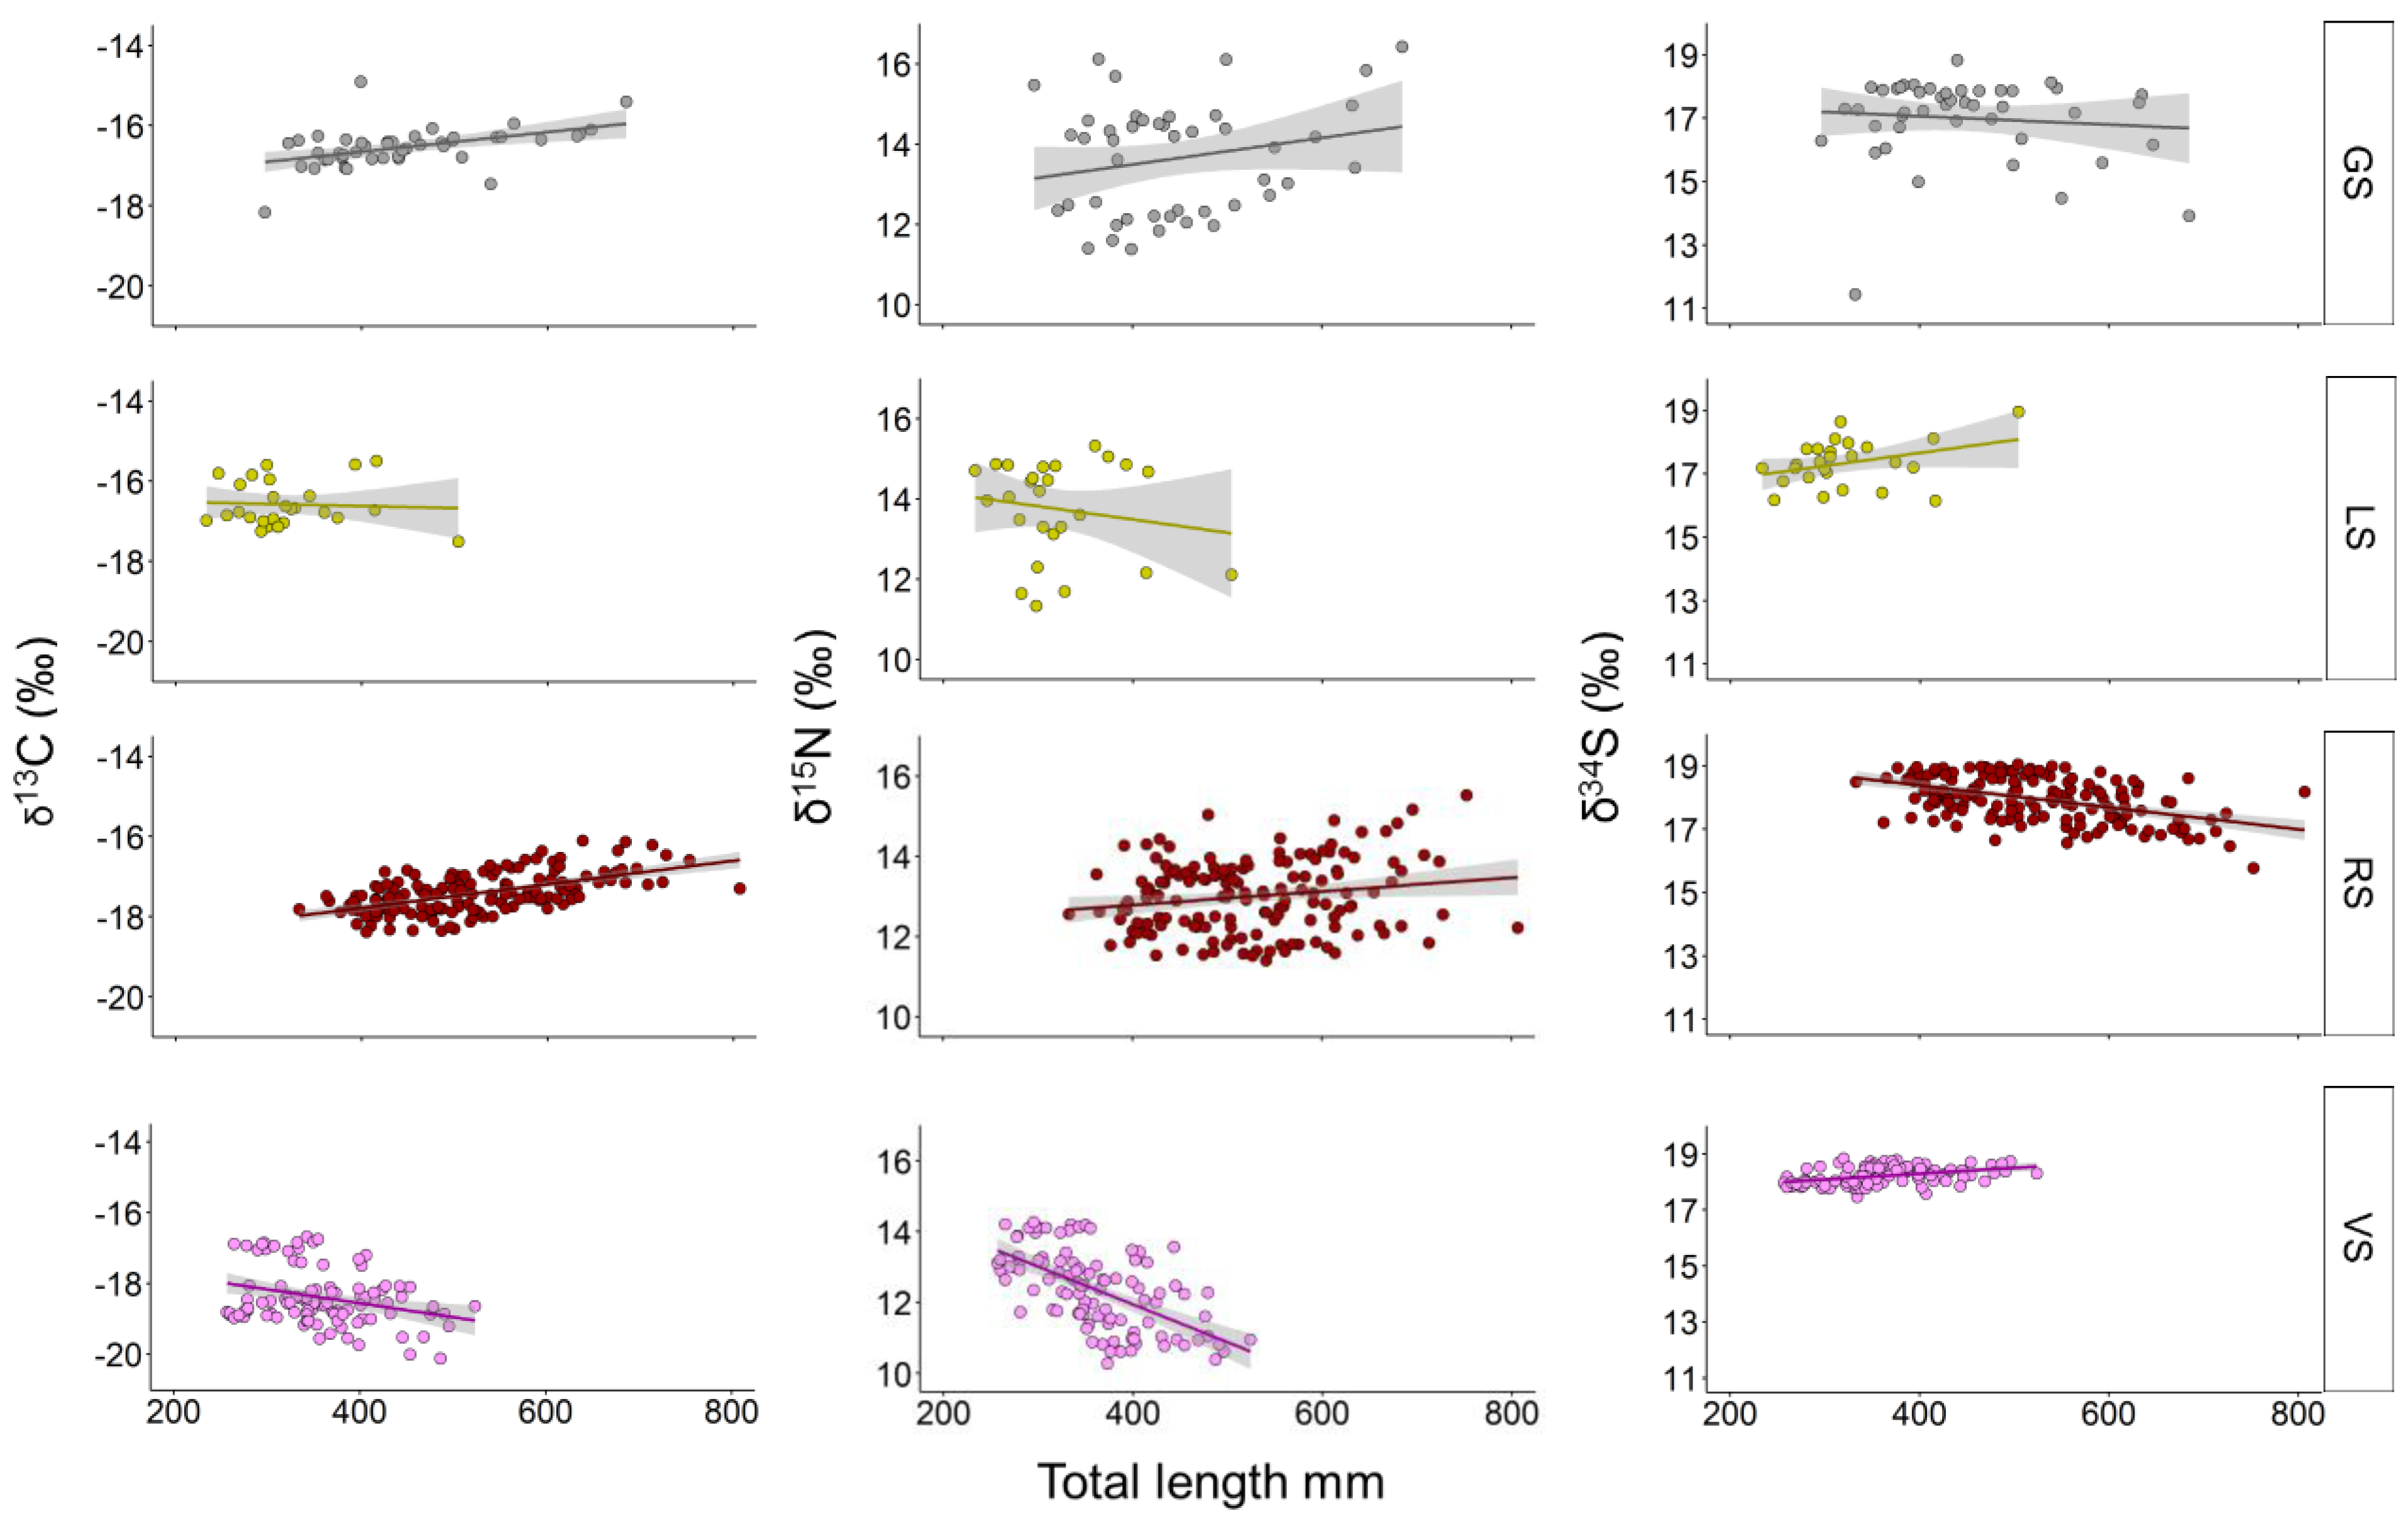
Multiple species showed significant changes in isotopic composition with increasing length (Figure 2). δ13C values of GS (coef = 0.002, p = 0.001) and RS (coef = 0.003, p < 0.001) increased, while δ13C of vs. (coef = −0.004, p = 0.002) decreased with increasing TL. δ15N values showed trends opposite those of δ13C with increasing TL for all four species and were significant for RS (coef = 0.002, p = 0.027) and vs. (coef = −0.011, p < 0.001). Trends in δ34S values mirrored those of δ13C and were significant for RS (coef = −0.003, p < 0.001) and vs. (coef = 0.002, p < 0.001).
PERMANOVA models indicated a significant interaction in stable isotope composition between species and regions among the four Lutjanids (p = 0.028). Inter-regional or inter-species differences were also significant (p < 0.05 in nearly all comparisons). Within species, GS, RS, and vs. were significantly different among all regions tested (all p < 0.05). Within regions, all four Lutjanids differed significantly in isotopic composition in all comparisons except for LS and GS from the EG (p = 0.083).
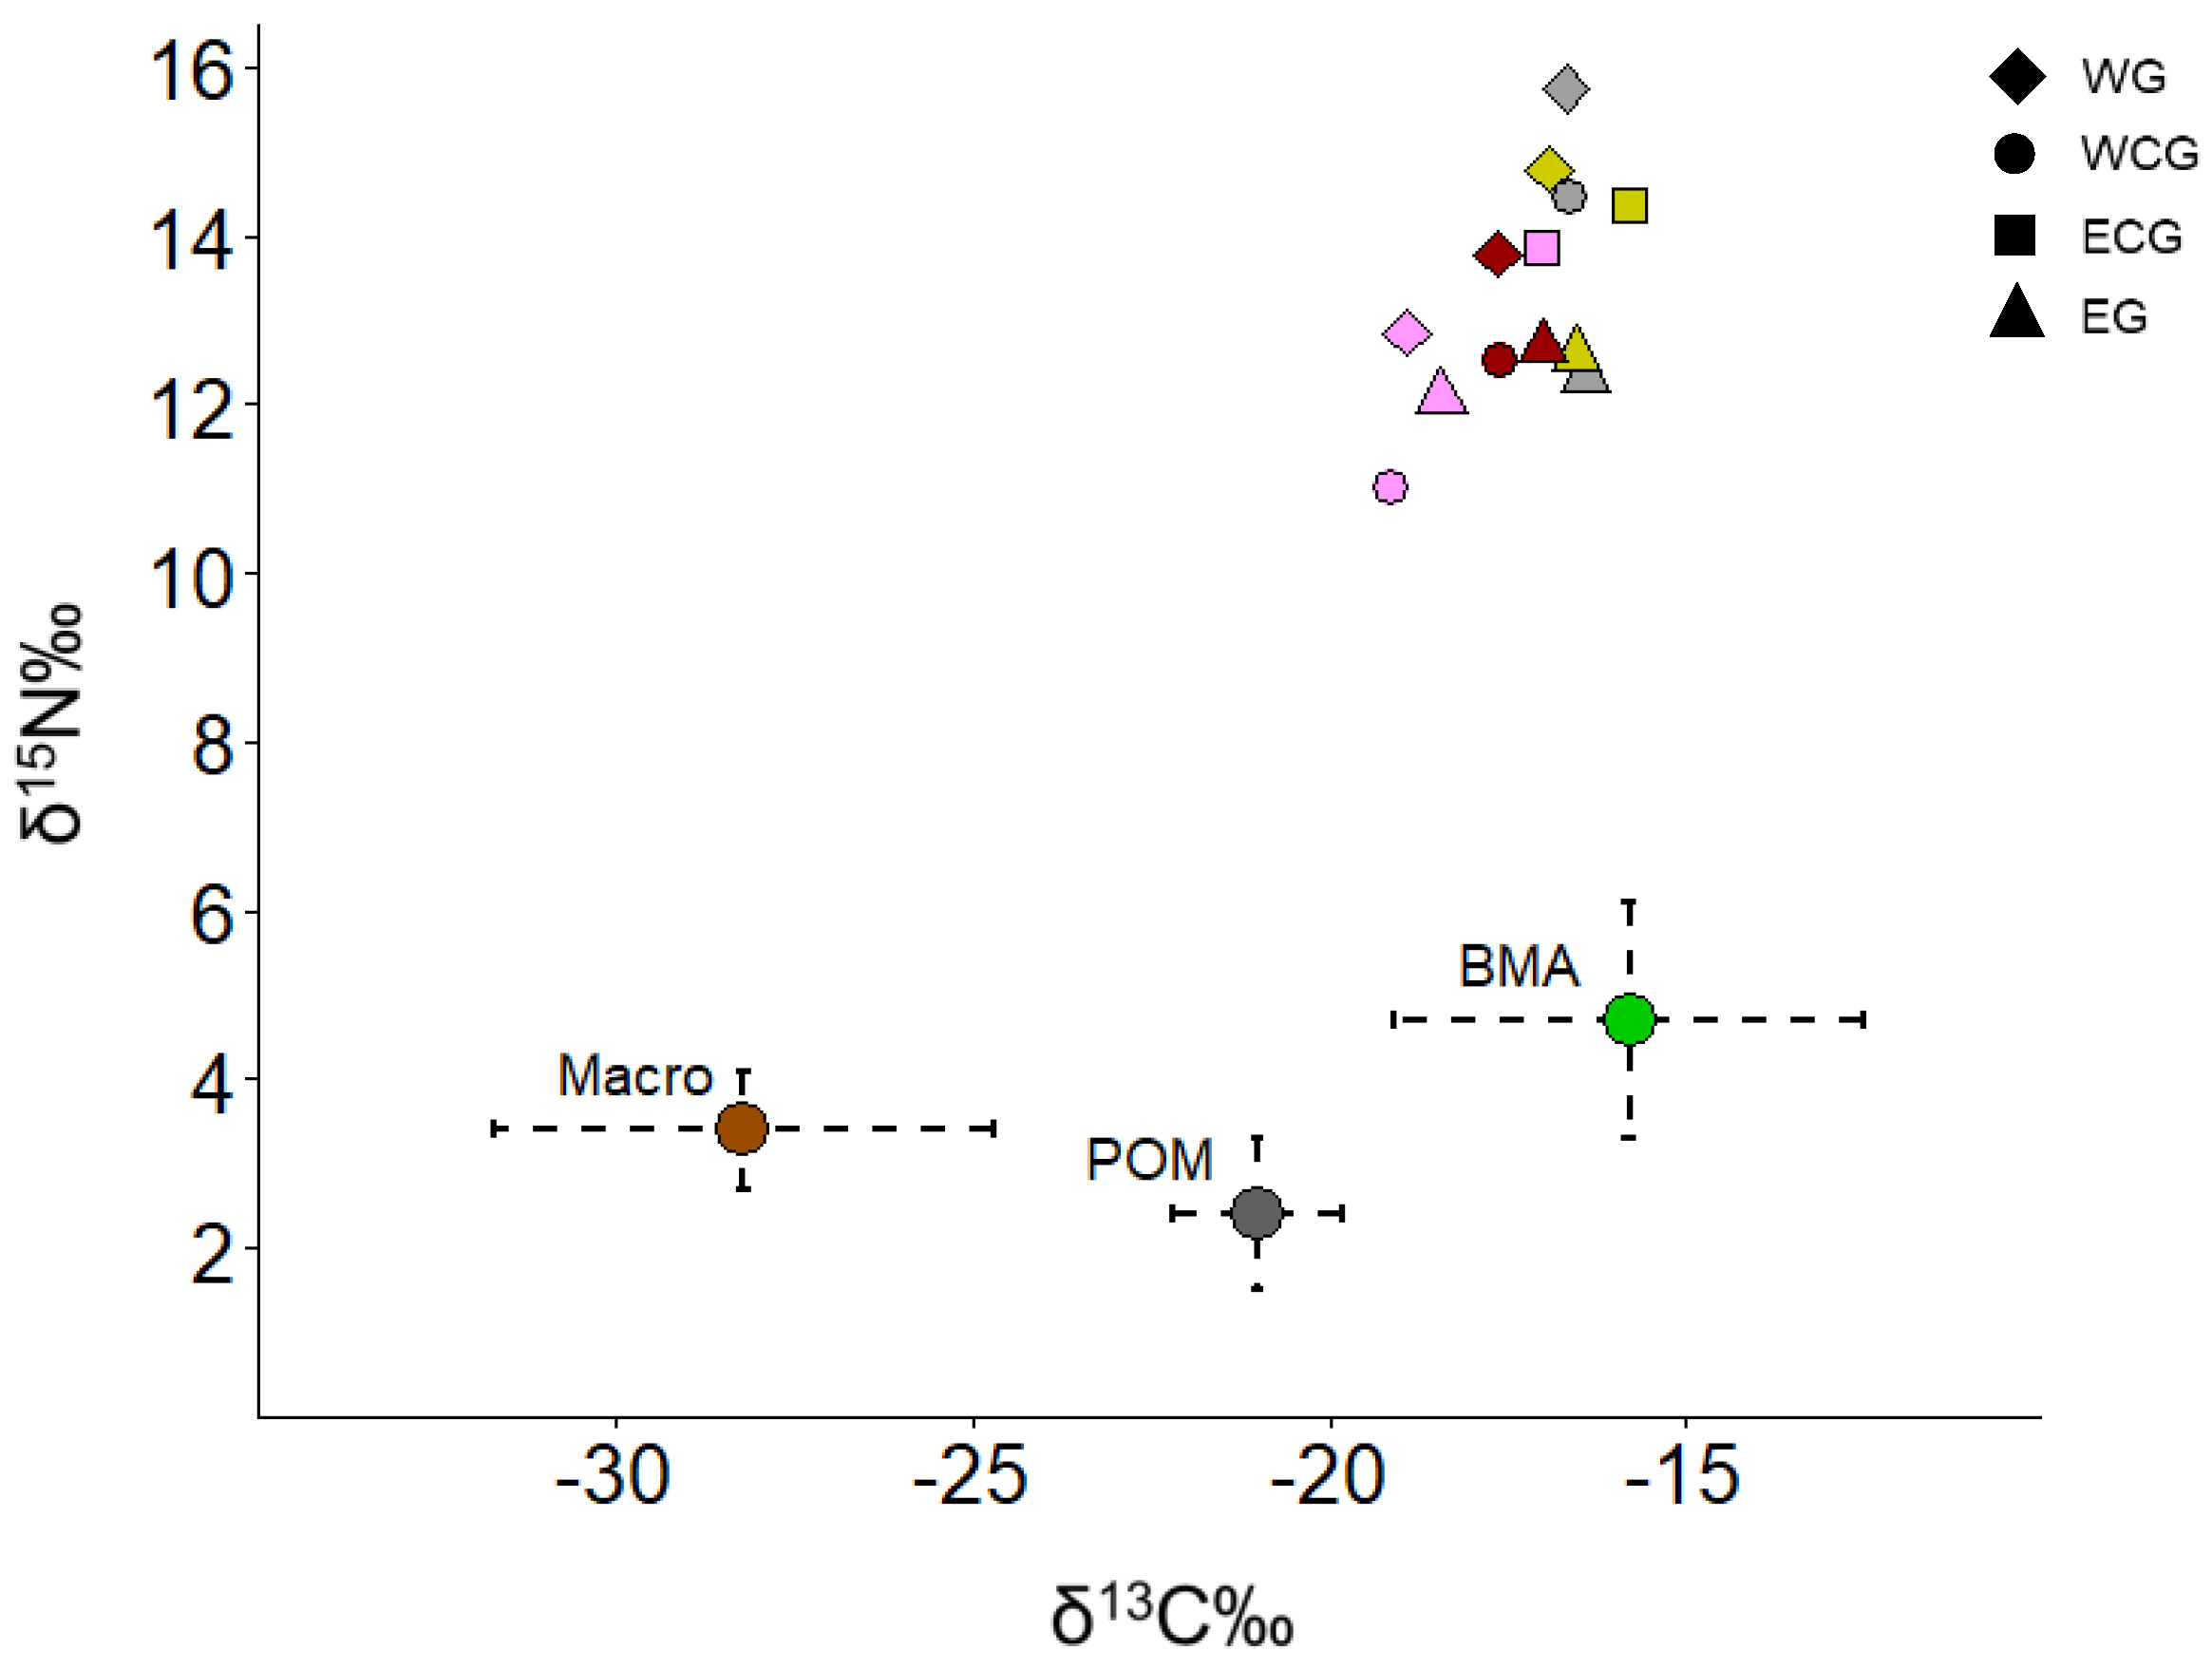
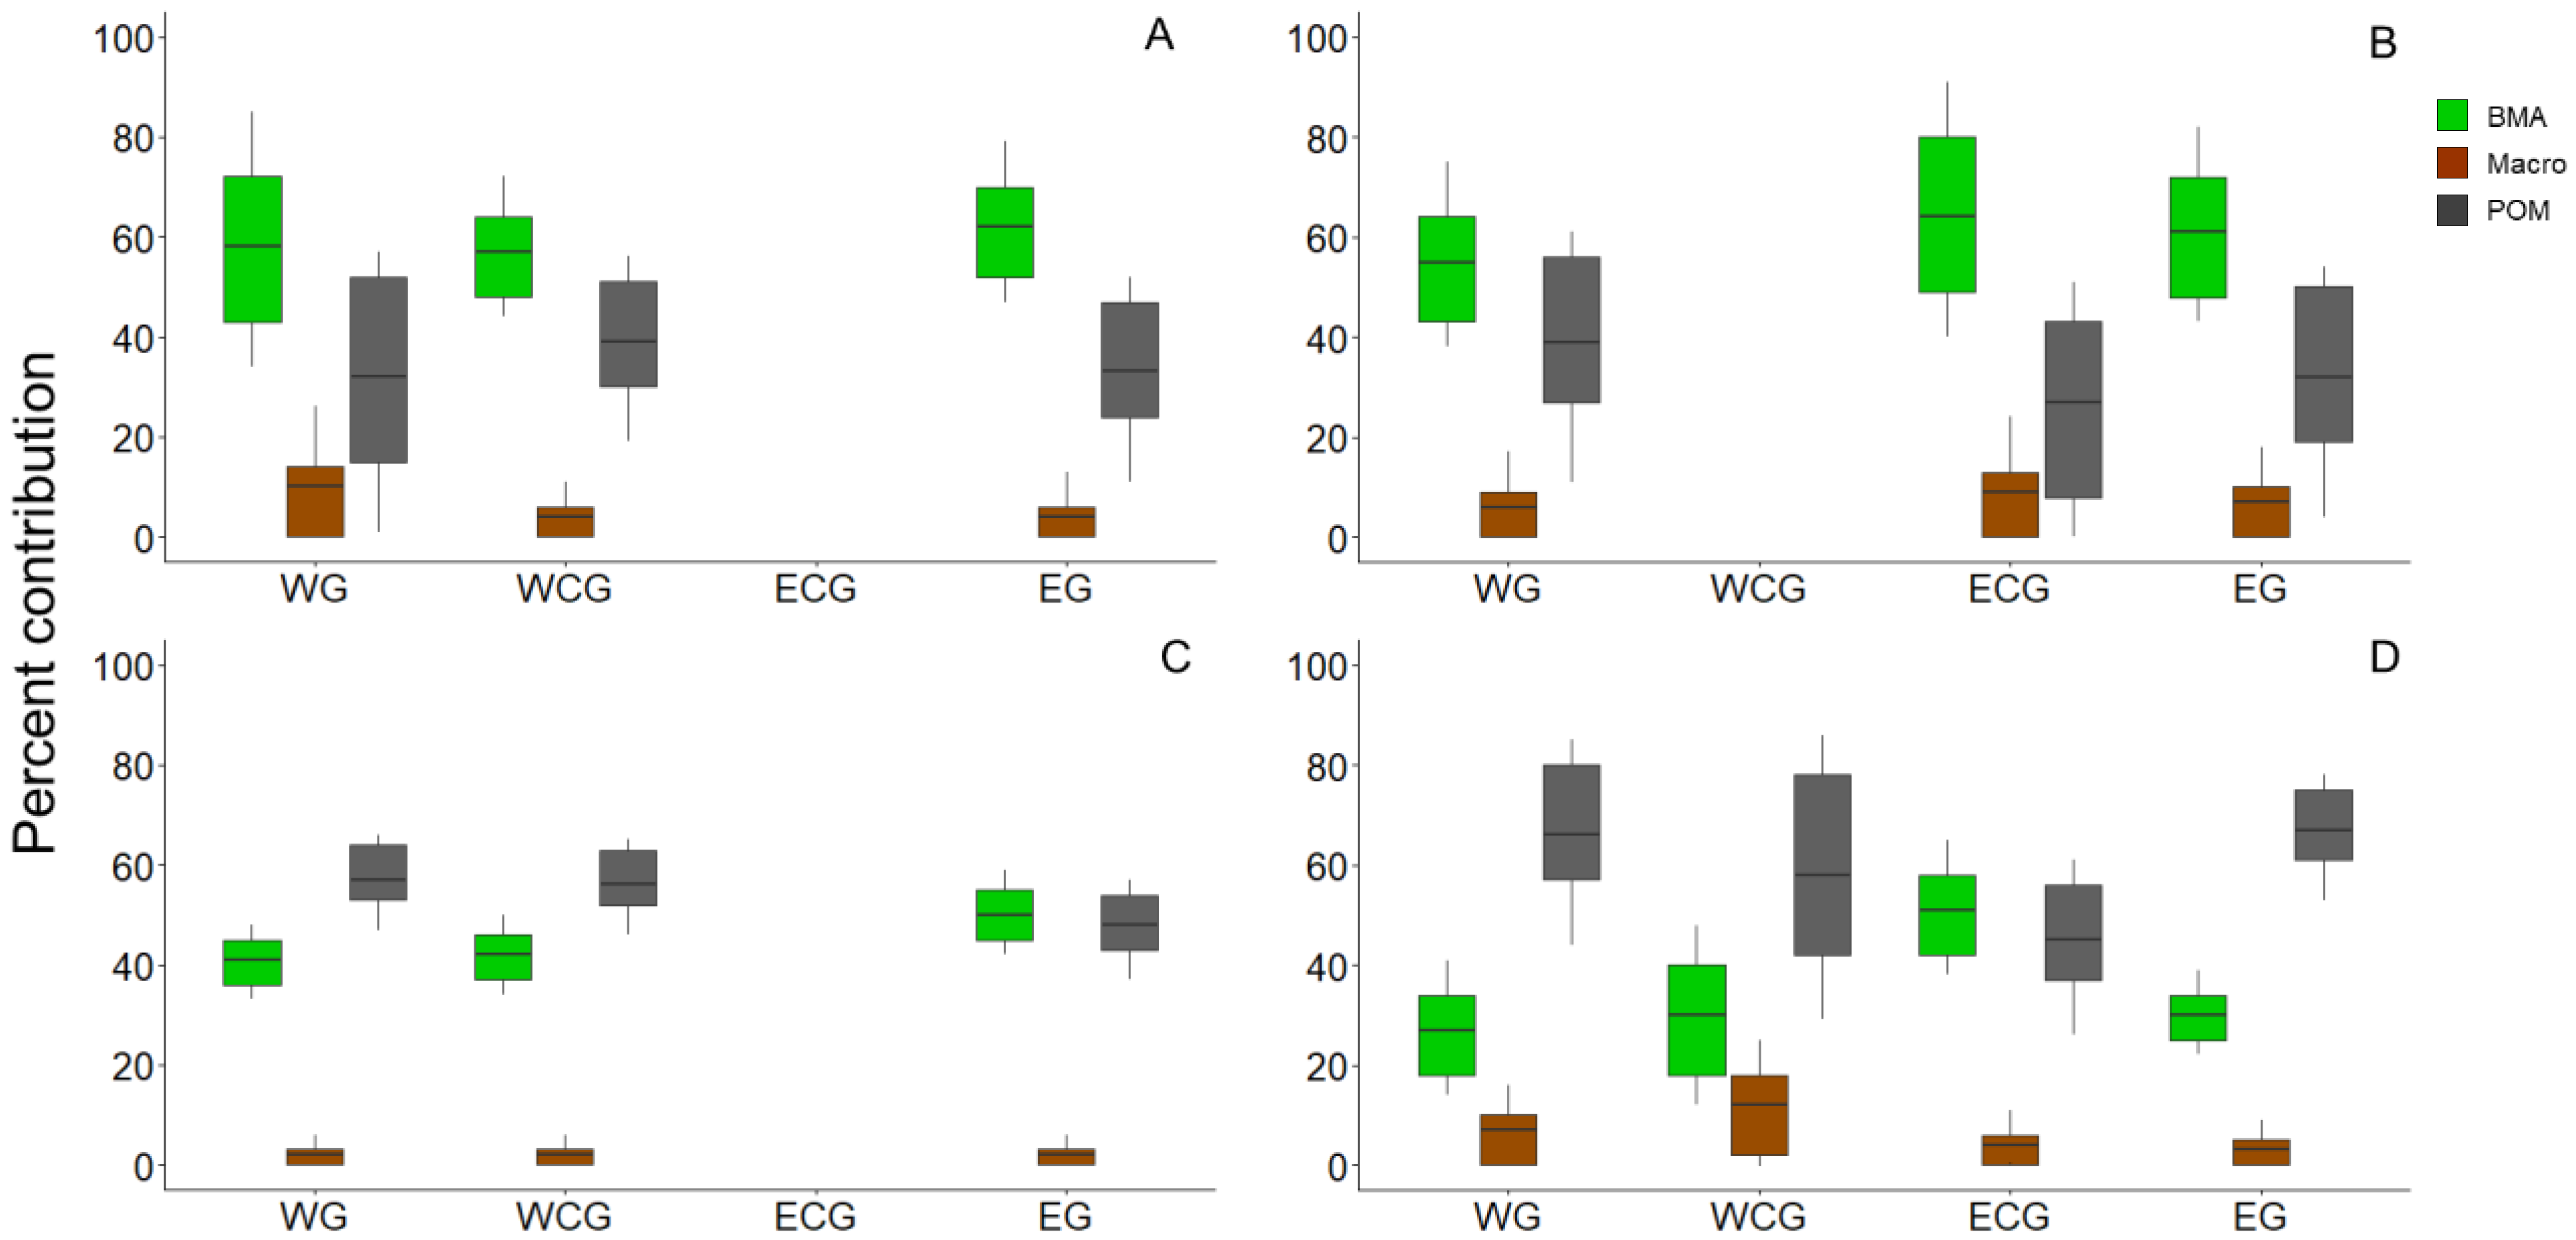
Within each snapper species, δ13C values were similar among regions, except for vs. from the ECG, which had δ13C values ~3‰ greater than vs. from the other three regions (Figure 3). Among snapper species, vs. were the most depleted in 13C, while LS and GS were the least depleted. Gray snappers collected from the WG and WCG had the highest δ15N values, while vs. from all regions, except the ECG, had the lowest δ15N values compared to other snappers (Figure 3). SIAR mixing models indicated that BMA and POM were the predominant basal food resources utilized by the four Lutjanids among all regions, although there exists spatial variation in the relative importance of both resources to each species (Figure 4). Benthic microalgae was the predominant primary producer utilized by prey consumed by GS and LS in all regions, averaging 59% and 60%, respectively. Prey consumed by RS or vs. predominantly utilized POM in the western regions averaging 54 and 59%, respectively. The contribution of BMA and POM to prey diets was approximately equal for RS collected from the EG and vs. collected from the ECG. However, POM contributed overwhelmingly to prey diets of vs. from the WG and EG. The contribution of macroalgae to basal resource pools averaged less than 7% for all species in all regions.
In the WG and WCG, there was little isotopic niche overlap between GS and RS (9% and 11%, respectively), while the overlap of niche areas increased to 32% in the EG (Figure 5). In the WG, LS occupied space between GS and RS with minimal overlap (4% and 16%, respectively), but there was increased overlap in the EG (42% and 35%, respectively). Vermilion snapper displayed clear niche separation from all other snappers among all regions except the EG. Lutjanids from the WG were the most enriched compared to conspecifics in nearly all cases, except for vs. from the ECG, which were similar to those in the WG in both C and N isotopes. Vermilion snappers from the WCG were the least enriched compared to other regions. Gray snapper showed an overall gradient of declining δ15N values from the WG to EG. For 34S, GS had the least enriched values (i.e., the most benthic signal), vs. the most enriched values (i.e., the most pelagic signal), and RS displayed intermediate values.

4. Discussion

Stable isotope results indicate that ontogenetic shifts play an important role in reducing niche overlap. As fish grow, optimal foraging behavior changes due to species-specific differences in diet specialization and vulnerability to predators [12,48,49,50]. Length-based trends in isotopic composition were strongest for δ15N; the direction differed among species, with some species having a positive relationship with size (GS and RS) while others were negatively related (LS and VS). Shared, high-value prey resources likely aggregate Lutjanids in a smaller niche space than expected based on gut contents [7,36,41,51] and the diversity of organisms typically found on reef structures in the northern Gulf [4,5,6]. Ecological niches varied in their degree of overlap among regions but maintained a consistent inter-species hierarchy. For example, vs. were always the most depleted in 13C and 15N, while GS were nearly always the most enriched in both. Gulf-wide comparisons suggest that Lutjanid niches are scale-shifted in the ECG in δ13C, in the WG for δ15N, and compressed in the EG for both δ13C and δ15N. Regional shifts likely result from differing intensities of nutrient-rich riverine outflows, anoxic zones, and nitrogen fixation that modify both basal resource isotopic ratios and primary consumer productivity [9,52,53].
When we compared region-specific results from previous studies [7,8,9,41] with our results, Lutjanids showed remarkable consistency in isotopic composition within subregions, especially considering the temporal range of studies in the literature (spanning a decade) as well as the potential for great spatial and temporal variability reported in isoscapes [53]. However, Lutjanids were never previously compared at a Gulf-wide scale, which has revealed region-specific differences in isotopic ratios. Regional differences in basal resources are driven by seasonal pulses of riverine nutrient flow, coastal upwelling, and nitrogen fixation that deliver nutrients to oligotrophic offshore food webs [53,54,55,56]. Pulse strength, frequency, and duration affect regional variability in the productivity of photosynthetic primary producers due to differences in nutrient availability and light attenuation that affect productivity rates and particle selection [57,58]. Both δ13C and δ15N vary with year and season, but large differences in δ13C tend to occur at local to subregional scales [53], perhaps due to differences in local CO2 concentrations that affect photosynthetic fractionation [59,60].
In the western Gulf, nutrient dynamics are strongly linked to Mississippi (MS) river outflow that creates a nutrient gradient moving both westward and offshore [1,53,56]. The WG and EG both receive depleted nutrient loads from MS river outflow on a time scale of weeks to months, whereas the WCG and ECG are in much closer proximity to direct plume flow [1]. River-derived POM has high δ15N values ranging from ~5–7‰, suggesting that Lutjanids from regions with less freshwater input would have lower nitrogen isotopic ratios. This was true for Lutjanids from the EG; however, Lutjanids from the WG showed the most enriched 15N values in three of the four species. Although none have nearly as much flow as the MS river, several rivers contribute to coastal shelf ecosystems along the Texas coast. Perhaps, lower δ15N values in Lutjanids from the WCG reflect a more offshore profile because they were targeted farther offshore on the expansive coastal Louisiana shelf, where isotopic values reflect more oceanic environments [53,56]. Radabaugh et al. [53] reported similar trends for the eastern Gulf as were observed in our study, with fishes from the NW shelf of Florida (ECG in our study) having more enriched 15N values than those from the W shelf (EG). The EG has much lower riverine input compared to the other regions, while nitrogen fixation in the EG may also contribute to lower δ15N values, especially in fishes collected from the middle and outer shelf [56,61].
Mixing model results indicated that BMA and POM were important basal resources to all four Lutjanids. The primarily basal resource utilized differed among species but was the same among regions within each species. For example, BMA contributed the most to LS isotopic composition in all regions, but POM contributed the most to vs. in all regions. Regardless, Lutjanids heavily utilize both resource pools in all regions as POM and BMA comprised >85% percent contribution in all cases. Macroalgae contributed little (<10%) to Lutjanid trophic linkages, likely due to its highly variable and ephemeral abundance throughout the region. The largest differences were observed for vs. in the WG and EG where percent contributions from POM approached 70%. Percent contributions to vs. in the ECG were very similar, suggesting that vs. are the most plastic of the four Lutjanids, being able to specialize in pelagic zooplankton that consumes POM in some regions while utilizing a more even mixture of resource pools in others. In contrast, both BMA and POM contributed similarly to RS diets in all regions. Red snapper attains the largest body size of the four species, which reduces predation and likely facilitates a generalist feeding strategy through expanded prey fields and search areas.
Diet studies help explain the observed differences in isotopic composition among Lutjanids in our study. vs. have been found to feed almost exclusively on zooplankton as body size (i.e., gape limitation) and morphology restrict all but the largest vs. from consuming moderate to large invertebrates and fishes. However, vs. feeding morphology allows them to filter fish and macroinvertebrate larvae more efficiently than the other Lutjanids [36,37,62]. In contrast, RS diets are supplemented by small low-value zooplankton between infrequent consumption of high-value prey items such as large fish and invertebrates [7,41,62]. Generalist feeding behavior by RS dilutes isotopically distinct prey resources unique to some regions resulting in consistent isotopic composition. The other two Lutjanids, GS and LS, appear to have more distinct diets among areas. LS feed on prey that utilize a relatively wide variety of carbon sources in the EG but are tightly clustered in the WG and ECG; GS feed on prey that are tightly clustered in the WCG but vary widely in the WG and EG.
Unlike C and N isotopes, δ34S values showed only modest differences among Lutjanids in most regions, which suggests weak vertical stratification in the water column. Information from acoustic tagging studies (limited predominantly to RS) on movement behavior provides additional insight into niche overlap among Lutjanids. Acoustically tagged Lutjanids (predominantly red snapper) make relatively large daily movements (10s of meters) away from reef structures to forage, especially at night when predation may be lower and food availability higher. Lutjanids also make vertical movements during the day, which may be linked to spawning and seasonal temperature gradients [63,64,65,66]. δ34S values were consistent among regions and indicated a pelagic prey signal for LS, RS, and VS; GS clustered with the other species, but some individuals had wider-ranging values. Prey consumed from throughout the water column may dilute benthic/pelagic isotopic differences among species over isotopic timescales [30,67,68] due to interactions between demersal Lutjanids and infaunal invertebrates (e.g., polychaetes and amphipods) during nocturnal emergence periods [37,69,70].
Localized movements likely play a strong role in reducing competition. Reef fishes utilize a network of reef structures over short time scales (days to weeks), with diurnal and seasonal movements [66]. Differences in diurnal and seasonal vertical movements of RS are likely driven by changes in water column temperatures associated with upwelling events and stratification [65,71]. Lutjanids (i.e., RS) may increase movements towards surface waters during summer months and daylight hours [65,71] in response to changes in vertical distributions of prey. Larger individuals dissociate from reefs to increase search fields, while smaller individuals likely aggregate to reduce predation pressure during search [66,71]. For example, VS, the smallest of the four Lutjanids sampled in this study, relies upon schooling behavior to avoid predation while feeding up in the water column on small zooplankton. vs. showed very little variation in δ34S values in all regions. Large RS outgrow predation by most reef mesopredators and shift to a diet of large demersal invertebrates, and fish consumed off-reef due to low prey abundances surrounding small or closely spaced reef structures [38,71,72,73].
Lutjanids have high site fidelity (i.e., movements <1 km) at time scales (i.e., weeks) required for muscle tissues to incorporate isotope values that reflect recent prey consumption [68,74,75,76]. Samples were collected during the summer growth period when muscle tissue turnover rates were high, and fish tissues would be expected to have fully incorporated isotope values of prey consumed over the previous weeks [68,77]. Thus, fish in our study would have incorporated the isotopic ratios that were reflective of late spring and early summer food sources [68]. Furthermore, mean values for most species- or region-specific comparisons had very low standard errors and were remarkably consistent with mean values reported in the literature [7,9,41].
Despite the overall consistency of our results with the literature-reported values, differences in Lutjanid isotope values have been reported in previous studies. Dance et al. [8] reported similar ontogenetic trends in isotope δ13C, δ15N, and δ34S values, but their samples were slightly enriched in 15N. Tarnecki and Patterson [7] reported that both δ13C and δ15N values of RS from the ECG decreased with increasing fish length, the opposite of our results for RS from other regions. Although we did not collect any RS from the ECG, LS, and vs. from the ECG were much more enriched in 13C than in other areas suggesting this subregion may differ significantly in the food web or basal resource dynamics. Zapp Sluis et al. [78] reported very different isotope compositions for RS, with mean δ13C values 2 to 3‰ lower, δ15N values 2 to 3‰ higher, and δ34S values 3 to 4‰ lower for fish collected regionally in the northern Gulf, especially fish collected from the EG or WCG. It is difficult to attribute differences in isotope signatures to differences in prey preference or availability as Lutjanids could be isotopically similar when resources are both abundant and diverse but specialization is low or when all four species feed opportunistically on a narrow range of preferred resources despite abundant and diverse feeding opportunities. Generalist and opportunistic behaviors are necessary for gregarious fishes with high site fidelity occupying structural oases that can be depleted of reef-derived and benthic resources [11,72,73] when communities are diverse and individuals abundant [6,49].

5. Conclusions

Stable isotope analysis indicated that Lutjanid niches show a consistent hierarchy among species, but values can shift strongly among regions. The degree of separation is region-specific and may change depending on regional factors affecting the isotopic composition of primary producers and prey resources. Generalist feeding behavior serves to aggregate niches while ontogenetic shifts, differences in maximum length and morphological specialization, and behavioral plasticity serve to avoid complete niche overlap in reef fish communities with high redundancy and competition. Although all four Lutjanids showed varying degrees of overlap in isotopic composition, vs. had an isotopic signature more similar to a pelagic zooplanktivore, GS a benthic omnivore, RS a generalist, and LS intermediate of GS and RS. All four utilize BMA- and POM-derived basal resources for much of their diet with little contribution from MA.
The scale of this study provided valuable insight into the ecological niche space occupied by several predominant reef fishes in the northern Gulf. Consistency in isotopic composition suggests stable isotopes can serve as a useful tool in evaluating ecosystem health after large-scale disturbances, such as might occur after the introduction of invasive species such as lionfish (Pterois volitans) or anthropogenic disasters such as the Deepwater Horizon Oil Spill in 2010. For example, Tarnecki and Patterson [7] were able to track highly depleted 13C signatures indicative of petroleum through muscle tissues immediately following the oil spill. Future studies should make comparisons at the largest scales possible due to the asynchrony within the northern Gulf in terms of habitat, food web structure, water chemistry and hydrodynamics, and temperature regimes. Samples collected at seasonal intervals will help elucidate how or if niches are altered among seasons within and among regions according to temperature and reproductive cycles, as well as if less important basal resources increase their contribution to Lutjanid diets during winter periods when prey communities are less productive.

Author Contributions

Conceptualization, M.Z.S., R.J.D.W., K.M.B. and J.H.C.J.; methodology, M.Z.S., R.J.D.W., K.M.B. and J.H.C.J.; software, S.B.G., M.Z.S. and R.J.D.W.; validation, M.Z.S., R.J.D.W. and K.M.B.; formal analysis, S.B.G., M.Z.S. and R.J.D.W.; investigation, M.Z.S., R.J.D.W. and K.M.B.; resources, J.H.C.J.; data curation, M.Z.S. and R.J.D.W.; writing—original draft preparation, S.B.G., M.Z.S. and K.M.B.; writing—review and editing, S.B.G., M.Z.S., R.J.D.W. and K.M.B.; visualization, S.B.G., M.Z.S. and R.J.D.W.; supervision, R.J.D.W., K.M.B. and J.H.C.J.; project administration, J.H.C.J.; funding acquisition, J.H.C.J. and K.M.B. All authors have read and agreed to the published version of the manuscript.

Funding

This research was supported by the Louisiana Sea Grant College Program with funds from the National Oceanic and Atmospheric Administration Office of Sea Grant, Department of Commerce (grantNA06OAR4170022, project R/HMC-03-PD). This is contribution #1571 from the Institute of Environment at Florida International University.

Institutional Review Board Statement

Not applicable.

Informed Consent Statement

Not applicable.

Data Availability Statement

Data from this study can be accessed from the authors upon request.

Conflicts of Interest

The authors declare no conflict of interest.

References

  1. Spies, R.B.; Senner, S.; Robbins, C.S. An overview of the northern Gulf of Mexico ecosystem. Gulf Mex. Sci. 2016, 1, 98–121. [Google Scholar] [CrossRef]
  2. Karnauskas, M.; Walter, J.F., III; Campbell, M.D.; Pollack, A.G.; Drymon, J.M.; Powers, S. Red snapper distribution on natural habitats and artificial structures in the northern Gulf of Mexico. Mar. Coast. Fish. 2017, 9, 50–67. [Google Scholar] [CrossRef]
  3. Strelcheck, A.J.; Cowan, J.H., Jr.; Shah, A. Influence of reef location on artificial-reef fish assemblages in the northcentral Gulf of Mexico. Bull. Mar. Sci. 2005, 77, 425–440. [Google Scholar]
  4. Dance, M.A.; Patterson, W.F., III; Addis, D.T. Fish community and trophic structure at artificial reef sites in the northeastern Gulf of Mexico. Bull. Mar. Sci. 2011, 87, 301–324. [Google Scholar] [CrossRef]
  5. Ajemian, M.J.; Wetz, J.J.; Shipley-Lozano, B.; Shively, J.D.; Stunz, G.W. An analysis of artificial reef fish community structure along the northwestern Gulf of Mexico shelf: Potential impacts of “rigs-to-reefs” programs. PLoS ONE 2015, 10, e0126354. [Google Scholar] [CrossRef]
  6. Garner, S.B.; Boswell, K.M.; Lewis, J.P.; Tarnecki, J.H.; Patterson, W.F., III. Effect of reef morphology and depth on fish community and trophic structure in the northcentral Gulf of Mexico. Estuar. Coast. Shelf Sci. 2019, 230, 106423. [Google Scholar] [CrossRef]
  7. Tarnecki, J.H.; Patterson, W.F., III. Changes in red snapper diet and trophic ecology following the deepwater horizon oil spill. Mar. Coast. Fish. 2015, 7, 135–147. [Google Scholar] [CrossRef]
  8. Dance, K.M.; Rooker, J.R.; Shipley, J.B.; Dance, M.A.; Wells, R.J.D. Feeding ecology of fishes associated with artificial reefs in the northwest Gulf of Mexico. PLoS ONE 2018, 13, e0203873. [Google Scholar] [CrossRef]
  9. Dillon, K.S.; Fleming, C.R.; Slife, C.; Leaf, R.T. Stable isotopic niche variability and overlap across four fish guilds in the north-central Gulf of Mexico. Mar. Coast. Fish. 2021, 13, 213–227. [Google Scholar] [CrossRef]
  10. Schoener, T.W. Resource partitioning in ecological communities. Science 1974, 185, 27–39. [Google Scholar] [CrossRef]
  11. Frazer, T.K.; Lindberg, W.J. Refuge spacing similarly affects reef-associated species from three phyla. Bull. Mar. Sci. 1994, 55, 388–400. [Google Scholar]
  12. Cachera, M.; Ernande, B.; Villanueva, M.C.; Lefebvre, S. Individual diet variation in a marine fish assemblage: Optimal foraging theory, niche variation hypothesis and functional identity. J. Sea Res. 2017, 120, 60–71. [Google Scholar] [CrossRef]
  13. Micheli, F.; Halpern, B.S. Low functional redundancy in coastal marine assemblages. Ecol. Lett. 2005, 8, 391–400. [Google Scholar] [CrossRef]
  14. Blaber, S.J.M. Feeding selectivity of a guild of piscivorous fish in mangrove areas of north-west Australia. Aust. J. Mar. Freshw. Res. 1986, 37, 329–336. [Google Scholar] [CrossRef]
  15. Hixon, M.A.; Jones, G.P. Competition, predation, and density-dependent mortality in demersal marine fishes. Ecology 2005, 86, 2847–2859. [Google Scholar] [CrossRef]
  16. Schmitt, R.J.; Holbrook, S.J. Gape-limitation, foraging tactics and prey size selectivity of two microcarnivorous species of fish. Oecologia 1984, 63, 6–12. [Google Scholar] [CrossRef]
  17. Hartman, K.J.; Brandt, S.B. Comparative energetics and the development of bioenergetics models for sympatric estuarine piscivores. Can. J. Fish. Aquat. Sci. 1995, 52, 1647–1666. [Google Scholar] [CrossRef]
  18. Kaldonski, N.; Lagrue, C.; Motreuil, S.; Rigaud, T.; Bollache, L. Habitat segregation mediates predation by the benthic fish Cottus gobio on the exotic amphipod species Gammarus roeseli. Naturwissenschaften 2008, 95, 839–844. [Google Scholar] [CrossRef]
  19. Hardin, G. The competitive exclusion principle. Science 1960, 131, 1292–1297. [Google Scholar] [CrossRef]
  20. Sale, P.F. Maintenance of high diversity in coral reef fish communities. Am. Nat. 1977, 111, 337–359. [Google Scholar] [CrossRef]
  21. Stier, A.C.; Hanson, K.M.; Holbrook, S.J.; Schmitt, R.J.; Brooks, A.J. Predation and landscape characteristics independently affect reef fish community organization. Ecology 2014, 95, 1294–1307. [Google Scholar] [CrossRef]
  22. Gannon, J.E. The effects of differential digestion rates of zooplankton by alewife, Alosa pseudoharengus, on determinations of selective feeding. Trans. Am. Fish. Soc. 1976, 1, 89–95. [Google Scholar] [CrossRef]
  23. Jackson, S.; Duffy, D.C.; Jenkins, J.F.G. Gastric digestion in marine vertebrate predators: In vitro standards. Funct. Ecol. 1987, 1, 287–291. [Google Scholar] [CrossRef]
  24. Aarnio, K.; Bonsdorff, E. Passing the gut of juvenile flounder, Platichthys flesus: Differential survival of zoobenthic prey species. Mar. Biol. 1997, 129, 11–14. [Google Scholar] [CrossRef]
  25. Berens, E.J.; Murie, D.J. Differential digestion and evacuation rates of prey in a warm-temperate grouper, gag Mycteroperca microlepis (Goode & Bean). J. Fish Biol. 2008, 72, 1406–1426. [Google Scholar]
  26. Dahl, K.A.; Patterson, W.F., III. Habitat-specific density and diet of rapidly expanding invasive red lionfish, Pterois volitans, populations in the northern Gulf of Mexico. PLoS ONE 2014, 9, e105852. [Google Scholar] [CrossRef]
  27. Lewis, J.P.; Tarnecki, J.H.; Garner, S.B.; Chagaris, D.D.; Patterson, W.F., III. Changes in reef fish community structure following the Deepwater Horizon oil spill. Sci. Rep. 2020, 10, 5621. [Google Scholar] [CrossRef]
  28. Peterson, B.J.; Fry, B. Stable isotopes in ecosystem studies. Annu. Rev. Ecol. Syst. 1987, 18, 293–320. [Google Scholar] [CrossRef]
  29. Vanderklift, M.A.; Ponsard, S. Sources of variation in consumer-diet δ15N enrichment: A meta-analysis. Oecologia 2003, 136, 169–182. [Google Scholar] [CrossRef]
  30. Vander Zanden, M.J.; Rasmussen, J.B. Variation in δ15N and δ13C trophic fractionation: Implications for aquatic food web studies. Limnol. Oceanogr. 2001, 46, 2061–2066. [Google Scholar] [CrossRef]
  31. Fry, B.; Sherr, E.B. δ13C measurements as indicators of carbon flow in marine and freshwater ecosystems. Contrib. Mar. Sci. 1984, 27, 13–47. [Google Scholar]
  32. Daigle, S.T.; Fleeger, J.W.; Cowan, J.H., Jr.; Pascal, P. What is the relative importance of phytoplankton and attached macroalgae and epiphytes to food webs on offshore oil platforms? Mar. Coast. Fish. 2013, 5, 53–64. [Google Scholar] [CrossRef]
  33. Randall, J.E. Food habits of reef fishes of the West Indies. Stud. Trop. Oceanogr. 1967, 5, 665–847. [Google Scholar]
  34. Marancik, K.E.; Hare, J.A. An annotated bibliography of diet studies of fish of the southeast United States and Gray’s Reef National Marine Sanctuary. In Marine Sanctuaries Conservation Series; NOAA/National Ocean Service/Marine Sanctuaries Division: Silver Spring, MD, USA, 2005; p. MSD-05. [Google Scholar]
  35. Rastorgueff, P.-A.; Harmelin-Vivien, M.; Richard, P.; Chevaldonné, P. Feeding strategies and resource partitioning mitigate the effects of oligotrophy for marine cave mysids. Mar. Ecol. Prog. Ser. 2011, 440, 163–176. [Google Scholar] [CrossRef]
  36. Grimes, C.B. Diet and feeding ecology of the vermilion snapper, Rhomboplites aurorubens (Cuvier) from North Carolina and South Carolina waters. Bull. Mar. Sci. 1979, 29, 53–61. [Google Scholar]
  37. Sedberry, G.R.; Cuellar, N. Planktonic and benthic feeding by the reef-associated vermilion snapper, Rhomboplites aurorubens (Telostei, Lutjanidae). Fish. B-NOAA 1993, 91, 699–709. [Google Scholar]
  38. Bortone, S.A.; Cody, R.P.; Turpin, R.K.; Bundrick, C.M. The impact of artificial-reef fish assemblages on their potential forage area. Ital. J. Zool. 1998, 65, 265–267. [Google Scholar] [CrossRef]
  39. Reeds, K.A.; Smith, J.A.; Suthers, I.M.; Johnston, E.L. An ecological halo surrounding a large offshore artificial reef: Sediments, infauna, and fish foraging. Mar. Environ. Res. 2018, 141, 30–38. [Google Scholar] [CrossRef]
  40. Franks, J.S.; VanderKooy, K.E. Feeding habits of juvenile lane snapper Lutjanus synagris from Mississippi coastal waters, with comments on the diet of gray snapper Lutjanus griseus. Gulf Caribb. Res. 2000, 12, 11–17. [Google Scholar] [CrossRef]
  41. Wells, R.J.D.; Cowan, J.H., Jr.; Fry, B. Feeding ecology of red snapper Lutjanus campechanus, in the northern Gulf of Mexico. Mar. Ecol. Prog. Ser. 2008, 361, 213–225. [Google Scholar] [CrossRef]
  42. Fry, B. Coupled N, C, and S stable isotope measurements using a dual-column gas chromatography system. Rapid Commun. Mass Sp. 2007, 21, 750–756. [Google Scholar] [CrossRef]
  43. Anderson, M.J.; Gorley, R.N.; Clarke, K.R. PERMANOVA+ for PRIMER: Guide to Software and Statistical Methods; PRIMER-E: Plymouth, UK, 2008. [Google Scholar]
  44. R Core Team. R: A Language and Environment for Statistical Computing; R Foundation for Statistical Computing: Vienna, Austria, 2021. [Google Scholar]
  45. Parnell, A.; Inger, R.; Bearhop, S.; Jackson, A.L. Source partitioning using stable isotopes: Coping with too much variation. PLoS ONE 2010, 5, e9672. [Google Scholar] [CrossRef]
  46. DeNiro, M.J.; Epstein, S. Influence of diet on the distribution of carbon isotopes in animals. Geochim. Cosmochim. Acta 1978, 42, 495–506. [Google Scholar] [CrossRef]
  47. Jackson, A.L.; Parnell, A.C.; Inger, R.; Bearhop, S. Comparing isotopic niche widths among and within communities: SIBER—Stable Isotope Bayesian Ellipses in R. J. Anim. Ecol. 2011, 80, 595–602. [Google Scholar] [CrossRef]
  48. Persson, L.; Crowder, L.B. Fish-habitat interactions mediated via ontogenetic niche shifts. In The Structuring Role of Submerged Macrophytes in Lakes; Springer: New York, NY, USA, 1998; pp. 3–23. [Google Scholar]
  49. Robinson, B.W.; Wilson, D.S. Optimal foraging, specialization, and a solution to Liem’s paradox. Am. Nat. 1998, 151, 223–235. [Google Scholar] [CrossRef]
  50. Colloca, F.; Carpentieri, P.; Balestri, E.; Adizzone, G. Food resource partitioning in a Mediterranean demersal fish assemblage: The effect of body size and niche width. Mar. Biol. 2010, 157, 565–574. [Google Scholar] [CrossRef]
  51. Duarte, L.O.; García, C.B. Diet of the Lane Snapper, Lutjanus synagris (Lutjanidae), in the Gulf of Salamanca, Colombia. Caribb. J. Sci. 1999, 35, 54–63. [Google Scholar]
  52. Rabalais, N.N.; Turner, R.E.; Dortch, Q.; Wiseman, W.J., Jr.; Sen Gupta, B.K. Nutrient changes in the Mississippi River and system responses on the adjacent continental shelf. Estuaries 1996, 19, 386–407. [Google Scholar] [CrossRef]
  53. Radabaugh, K.R.; Hollander, D.J.; Peebles, E.B. Seasonal δ13C and δ15N isoscapes of fish populations along a continental shelf trophic gradient. Cont. Shelf Res. 2013, 68, 112–122. [Google Scholar] [CrossRef]
  54. Breed, G.A.; Jackson, G.A.; Richardson, T.L. Sedimentation, carbon export and food web structure in the Mississippi River plume described by inverse analyses. Mar. Ecol. Prog. Ser. 2004, 278, 35–51. [Google Scholar] [CrossRef]
  55. Wissel, B.; Fry, B. Tracing Mississippi River influences in estuarine food webs of coastal Louisiana. Oecologia 2005, 144, 659–672. [Google Scholar] [CrossRef]
  56. Dorado, S.; Rooker, J.R.; Wissel, B.; Quigg, A. Isotope baseline shifts in pelagic food webs of the Gulf of Mexico. Mar. Ecol. Prog. Ser. 2012, 464, 37–49. [Google Scholar] [CrossRef]
  57. Hansson, S.; Hobbie, J.E.; Elmgren, R.; Larsson, U.; Fry, B.; Johansson, S. The stable nitrogen isotope ratio as a marker of food-web interactions and fish migration. Ecology 1997, 78, 2249–2257. [Google Scholar] [CrossRef]
  58. Nerot, C.; Lorrain, A.; Grall, J.; Gillikin, D.P.; Munaron, J.-M.; Le Bris, H.; Paulet, Y.-M. Stable isotope variations in benthic filter feeders across a large depth gradient on the continental shelf. Estuar. Coast Shelf Sci. 2012, 96, 228–235. [Google Scholar] [CrossRef]
  59. Popp, B.N.; Laws, E.A.; Bidigare, R.R.; Dore, J.E.; Hanson, K.L.; Wakeham, S.G. Effect of phytoplankton cell geometry on carbon isotopic fractionation. Geochim. Cosmochim. Acta 1998, 62, 69–77. [Google Scholar] [CrossRef]
  60. Hofmann, M.; Wolf-Gladrow, D.A.; Takahashi, T.; Sutherland, S.C.; Six, K.D.; Maier-Reimer, E. Stable carbon isotope distribution of particulate organic matter in the ocean: A model study. Mar. Chem. 2000, 72, 131–150. [Google Scholar] [CrossRef]
  61. Mulholland, M.R.; Bernhardt, P.W.; Heil, C.A.; Bronk, D.A.; O’Neil, J.M. Nitrogen fixation and release of fixed nitrogen by Trichodesmium spp. In the Gulf of Mexico. Limnol. Oceanogr. 2006, 51, 1762–1776. [Google Scholar] [CrossRef]
  62. Davis, W.T.; Drymon, J.M.; Powers, S.P. Spatial and dietary overlap creates potential for competition between red snapper (Lutjanus campechanus) and vermilion snapper (Rhomboplites aurorubens). PLoS ONE 2015, 10, e0144051. [Google Scholar] [CrossRef]
  63. Farmer, N.A.; Ault, J.S. Grouper and snapper movements and habitat use in Dry Tortugas, Florida. Mar. Ecol. Prog. Ser. 2011, 433, 169–184. [Google Scholar] [CrossRef]
  64. Topping, D.T.; Szedlmayer, S.T. Home range and movement patterns of red snapper (Lutjanus campechanus) on artificial reefs. Fish. Res. 2011, 112, 77–84. [Google Scholar] [CrossRef]
  65. Williams-Grove, L.J.; Szedlmayer, S.T. Depth preferences and three-dimensional movements of red snapper, Lutjanus campechanus, on an artificial reef in the northern Gulf of Mexico. Fish. Res. 2017, 190, 61–70. [Google Scholar] [CrossRef]
  66. Bohaboy, E.C.; Cass-Calay, S.L.; Patterson, W.F., III. Fine-scale movement of northern Gulf of Mexico red snapper and gray triggerfish estimated with three-dimensional acoustic telemetry. Sci. Rep. 2022, 12, 14274. [Google Scholar] [CrossRef] [PubMed]
  67. Post, D.M. Using stable isotopes to estimate trophic position: Models, methods, and assumptions. Ecology 2002, 83, 703–718. [Google Scholar] [CrossRef]
  68. Vander Zanden, M.J.; Clayton, M.K.; Moody, E.K.; Solomon, C.T.; Weidel, B.C. Stable isotope turnover and half-life in animal tissues: A literature synthesis. PLoS ONE 2015, 10, e0116182. [Google Scholar] [CrossRef]
  69. Alldredge, A.L.; King, J.M. Distribution, abundance, and substrate preferences of demersal reef zooplankton at Lizard Island Lagoon, Great Barrier Reef. Mar. Biol. 1977, 41, 317–333. [Google Scholar] [CrossRef]
  70. Jacoby, C.A.; Greenwood, J.G. Emergent zooplankton in Moreton Bay, Queensland, Australia: Seasonal, lunar, and diel patterns in emergence and distribution with respect to substrata. Mar. Ecol. Prog. Ser. 1989, 51, 131–154. [Google Scholar] [CrossRef]
  71. Bacheler, N.M.; Shertzer, K.W.; Runde, B.J.; Rudershausen, P.J.; Buckel, J.A. Environmental conditions, diel period, and fish size influence the horizontal and vertical movements of red snapper. Sci. Rep. 2021, 11, 9580. [Google Scholar] [CrossRef]
  72. Galván, D.E.; Parma, A.M.; Iribarne, O.O. Influence of predatory reef fishes on the spatial distribution of Munidia gregaria (=M. subrugosa) (Crustacea; Galatheidae) in shallow Patagonian soft bottoms. J. Exp. Mar. Biol. Ecol. 2008, 354, 93–100. [Google Scholar] [CrossRef]
  73. Campbell, M.D.; Rose, K.; Boswell, K.; Cowan, J., Jr. Individual-based modeling of an artificial reef fish community: Effects of habitat quantity and degree of refuge. Ecol. Model. 2011, 222, 3895–3909. [Google Scholar] [CrossRef]
  74. Jardine, T.D.; Kidd, K.A.; Fisk, A.T. Applications, considerations, and sources of uncertainty when using stable isotope analysis in ecotoxicology. Environ. Sci. Technol. 2006, 40, 7501–7511. [Google Scholar] [CrossRef]
  75. MacNeil, M.A.; Drouillard, K.G.; Fisk, A.T. Variable uptake and elimination of stable nitrogen isotopes between tissues in fish. Can. J. Fish. Aquat. Sci. 2006, 63, 345–353. [Google Scholar] [CrossRef]
  76. Buchheister, A.; Latour, R.J. Turnover and fractionation of carbon and nitrogen stable isotopes in tissues of a migratory coastal predator, summer flounder (Paralichthys dentatus). Can. J. Fish. Aquat. Sci. 2010, 67, 445–461. [Google Scholar] [CrossRef]
  77. Perga, M.E.; Gerdeaux, D. ‘Are fish what they eat’ all year round? Oecologia 2005, 144, 598–606. [Google Scholar] [CrossRef] [PubMed]
  78. Zapp Sluis, M.; Boswell, K.M.; Chumchal, M.M.; Wells, R.J.D.; Soulen, B.; Cowan, J.H., Jr. Regional variation in mercury and stable isotopes of red snapper (Lutjanus campechanus) in the northern Gulf of Mexico, USA. Environ. Toxicol. Chem. 2013, 32, 434–441. [Google Scholar] [CrossRef]
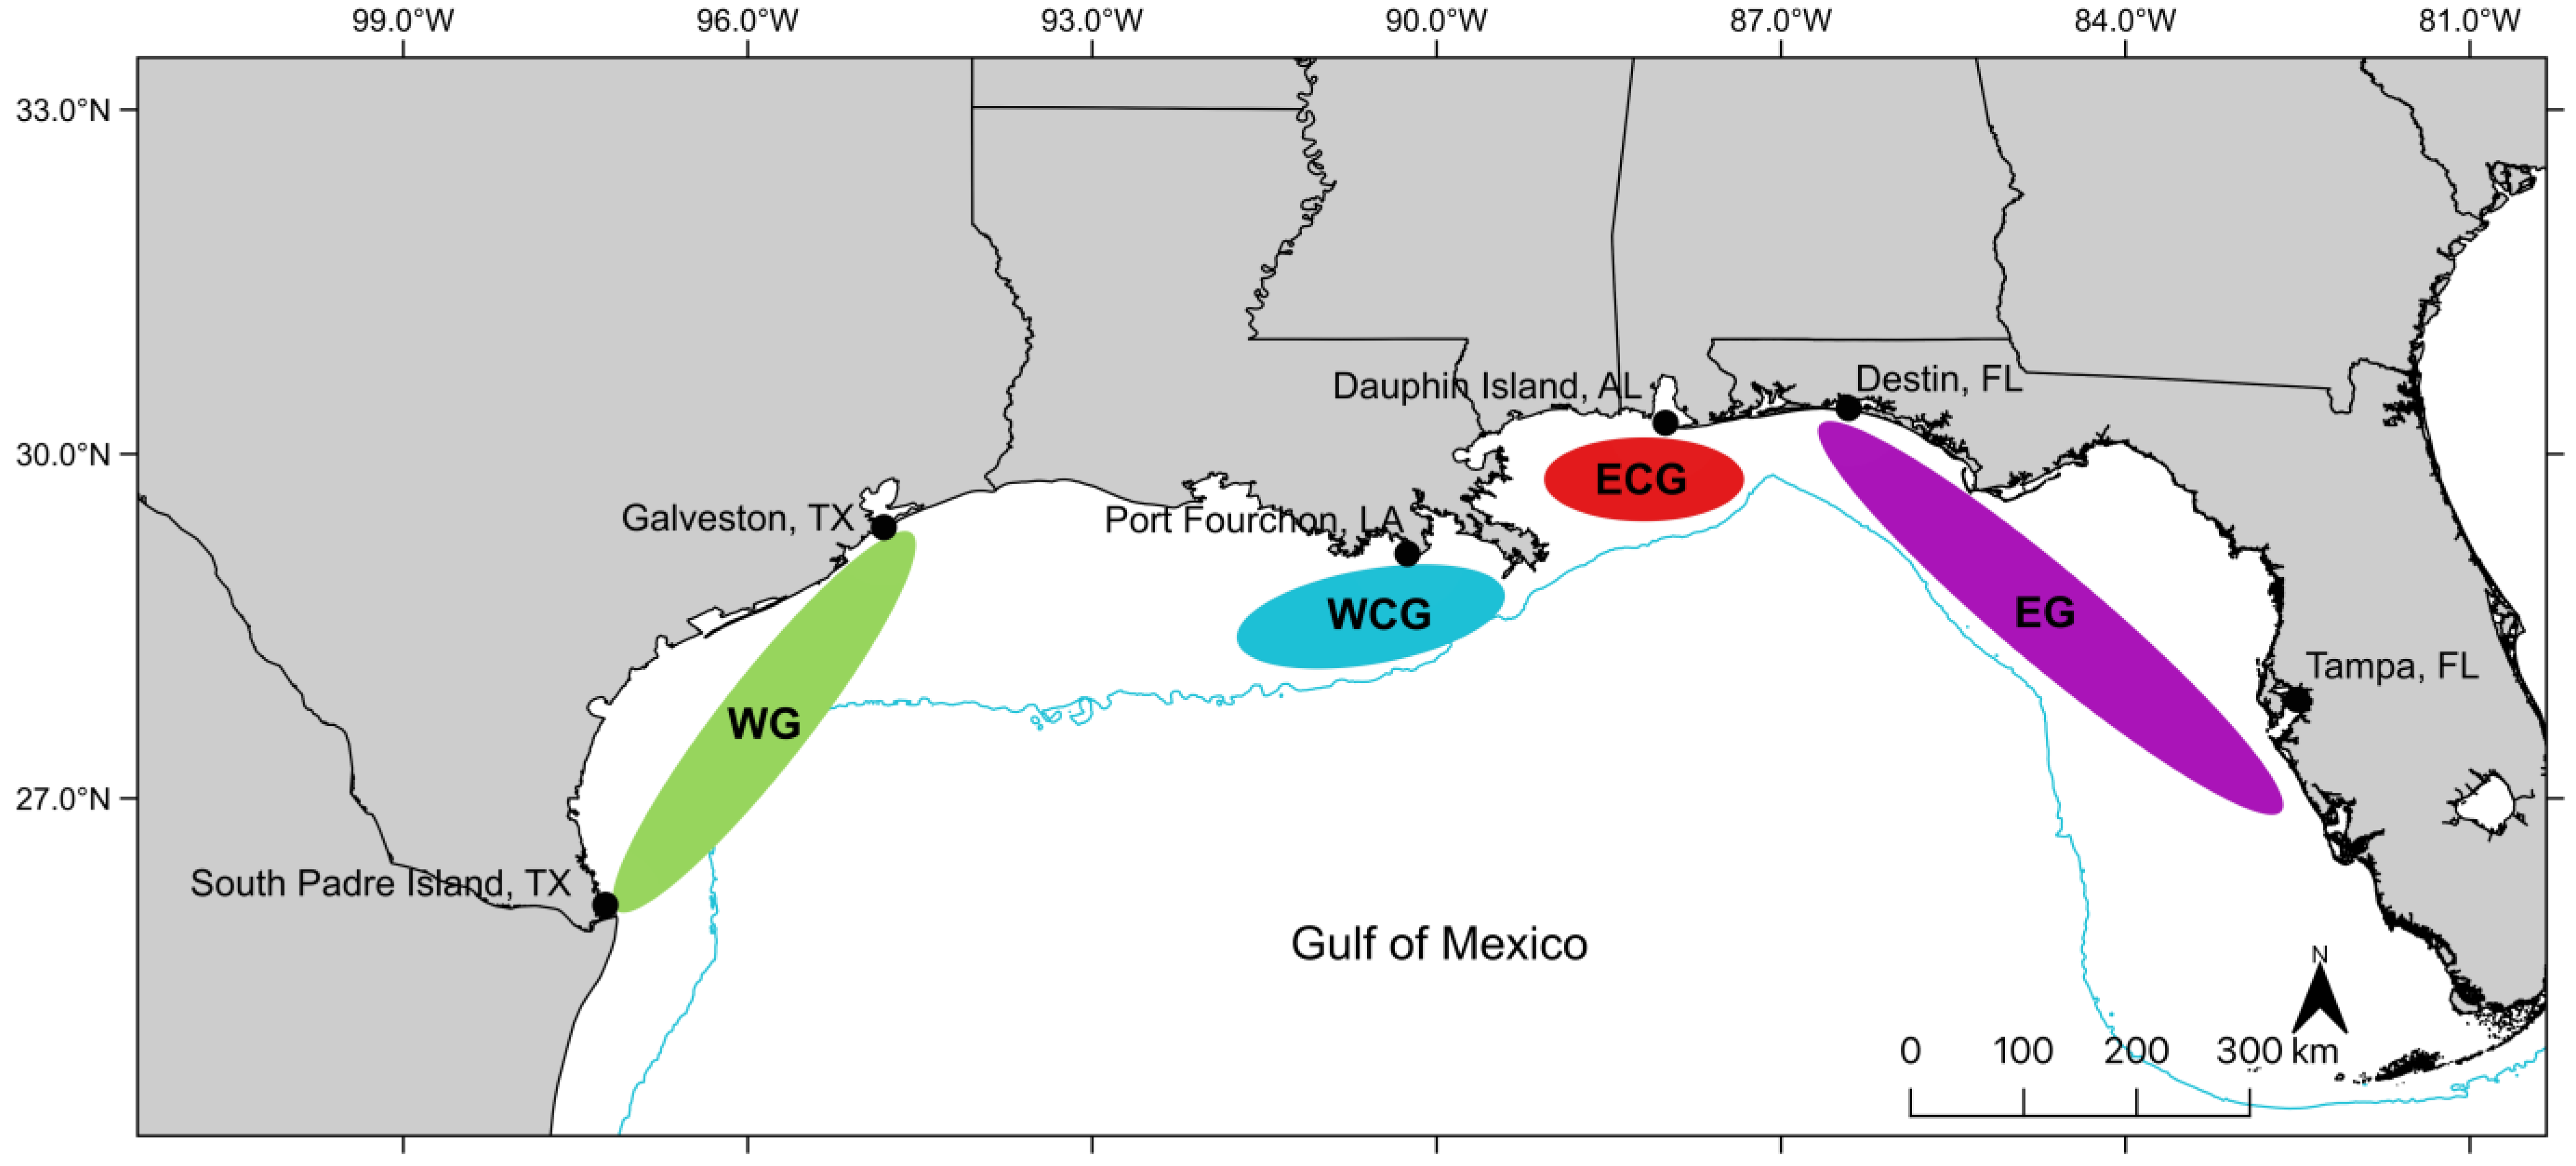
Figure 1. Lutjanids were collected from recreational vessels during the summer of 2009 from four regions in the northern Gulf of Mexico: western (WG), west-central (WCG), east-central (ECG), or eastern (EG) Gulf of Mexico. The 200 m depth contour (blue line) indicates the continental shelf edge.
Fishes 08 00244 g001
Figure 2. Stable isotope values of δ13C, δ15N, and δ34S (‰) versus total length (mm) for gray snapper (gray, GS), lane snapper (gold, LS), red snapper (red, RS), and vermilion snapper (pink, VS) collected from the northern Gulf of Mexico during summer 2009. Smoothed regression lines with 95% confidence regions are shown in each panel.
Fishes 08 00244 g002
Figure 3. Biplot of δ13C and δ15N mean stable isotope values from gray snapper (gray), lane snapper (gold), red snapper (dark red), or vermilion snapper (pink) muscle tissue samples collected from the western (WG, diamonds), west-central (WCG, circles), east-central (ECG, squares), or eastern (EG, triangles) Gulf of Mexico. Stable isotope values from basal resources (benthic microalgae, BMA; macroalgae, MA, or particulate organic matter, POM) also are shown. Dashed lines indicate ±1 standard error of the mean.
Fishes 08 00244 g003
Figure 4. Percent contribution of basal resources: benthic microalgae (BMA, green), macroalgae (M, brown), or particulate organic matter (POM, darkgray), to (A) gray snapper, (B) lane snapper, (C) red snapper, or (D) vermilion snapper stable isotope composition for samples collected from the western (WG), west-central (WCG), east-central (ECG), or eastern (EG) Gulf of Mexico. Box ends indicate the 25th and 75th percentiles, while whiskers indicate the 5th and 95th percentiles. Horizontal lines indicate mean values.
Fishes 08 00244 g004
Figure 5. Biplots of δ13C, δ15N, or δ34S values from gray snapper (GS, gray), lane snapper (LS, gold), red snapper (RS, dark red), or vermilion snapper (VS, pink) muscle tissue samples collected from the western (WG), west-central (WCG), east-central (ECG), or eastern (EG) Gulf of Mexico. Standard ellipses (solid lines) contain 40% of the data, while convex hulls (dashed lines) indicate the total area.
Fishes 08 00244 g005
Table 1. The number of individuals (N), mean total length (TL, mm), and TL range for gray snapper (GS), lane snapper (LS), red snapper (RS), and vermilion snapper (VS) collected from four regions in the northern Gulf of Mexico (western, WG; west-central, WCG; east-central, ECG; or eastern, EG, Gulf of Mexico). Numbers in parentheses indicate ±1 standard error of the mean. No gray or red snapper was collected from the east-central Gulf.
SpeciesRegionNTLRange
Gray snapperWG5439.4 (69.9)296–685
WCG20461.3 (20.0)335–647
ECG0NANA
EG20434.1 (18.6)321–635
Lane snapperWG10300.9 (13.8)233–374
WCG2477.5 (26.5)451–504
ECG5325.0 (33.8)246–416
EG10319.0 (12.3)280–414
Red snapperWG50530.2 (13.4)391–753
WCG50490.5 (13.6)333–807
ECG0NANA
EG50552.1 (11.8)415–728
Vermilion snapperWG20309.4 (10.0)257–412
WCG21427.6 (10.7)357–524
ECG20330.1 (9.1)265–407
EG40366.2 (7.9)279–479
Disclaimer/Publisher’s Note: The statements, opinions and data contained in all publications are solely those of the individual author(s) and contributor(s) and not of MDPI and/or the editor(s). MDPI and/or the editor(s) disclaim responsibility for any injury to people or property resulting from any ideas, methods, instructions or products referred to in the content.