
Spawning Locations of Pallid Sturgeon in the Missouri River Corroborate the Mechanism for Recruitment Failure


Abstract
1. Introduction
2. Materials and Method
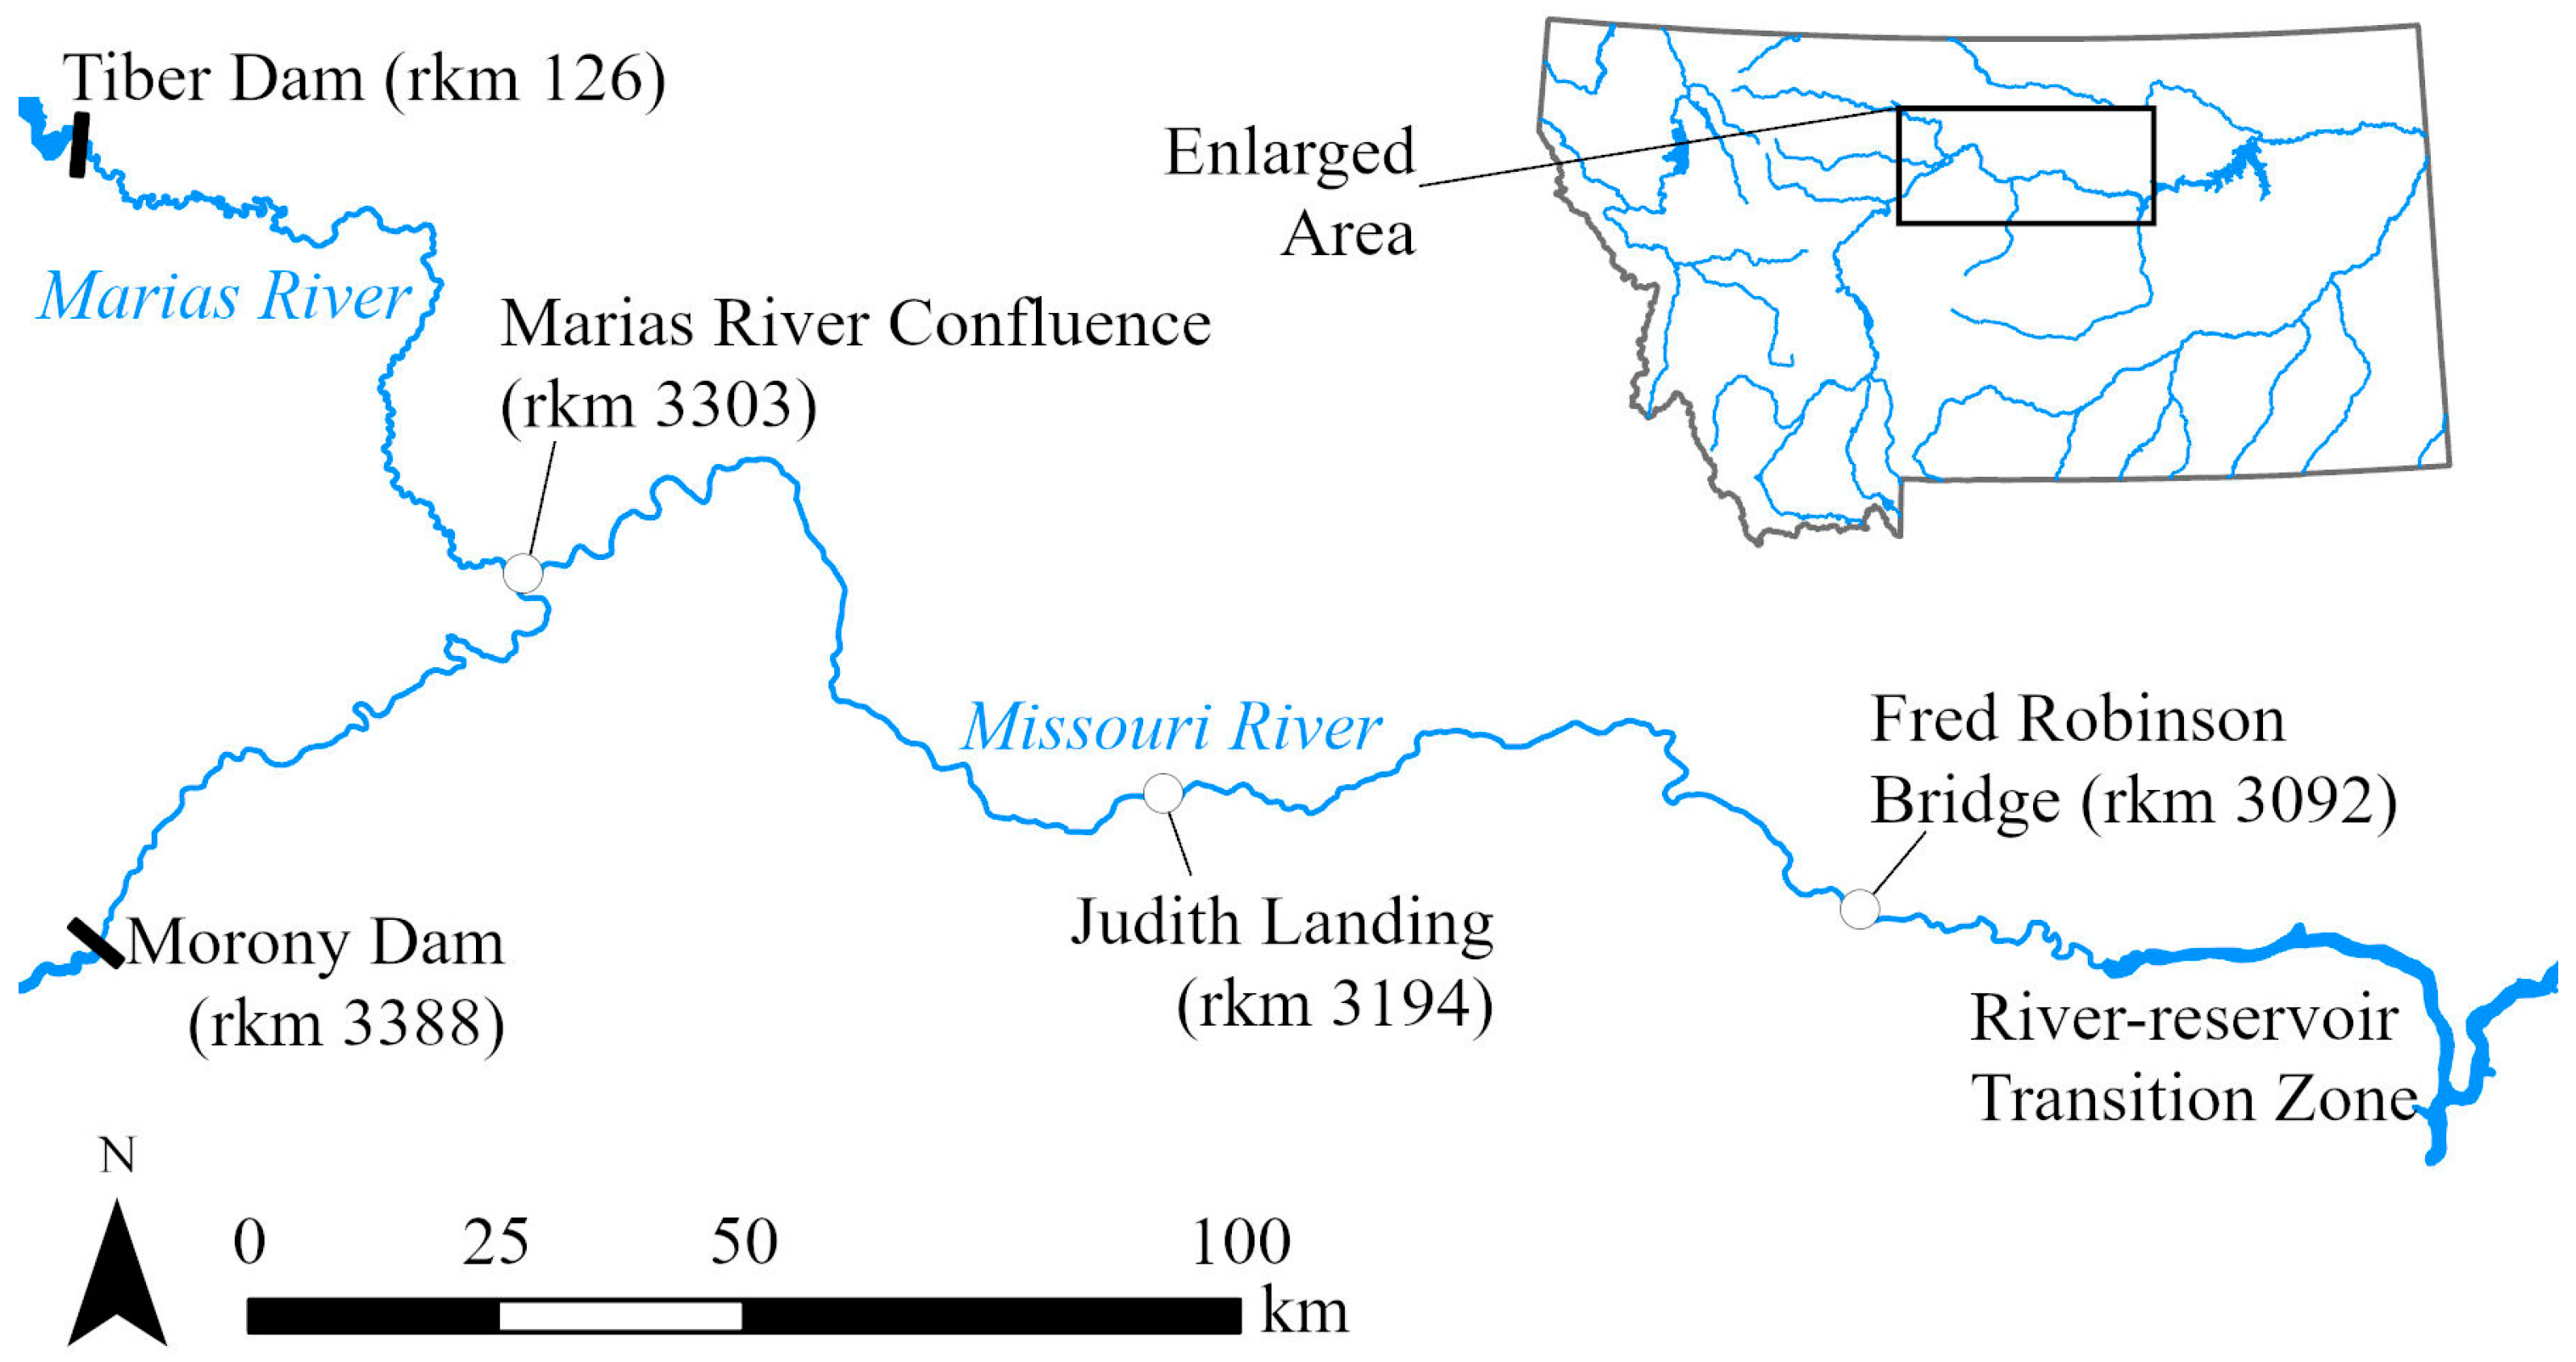
2.1. Study Area
2.2. Sampling
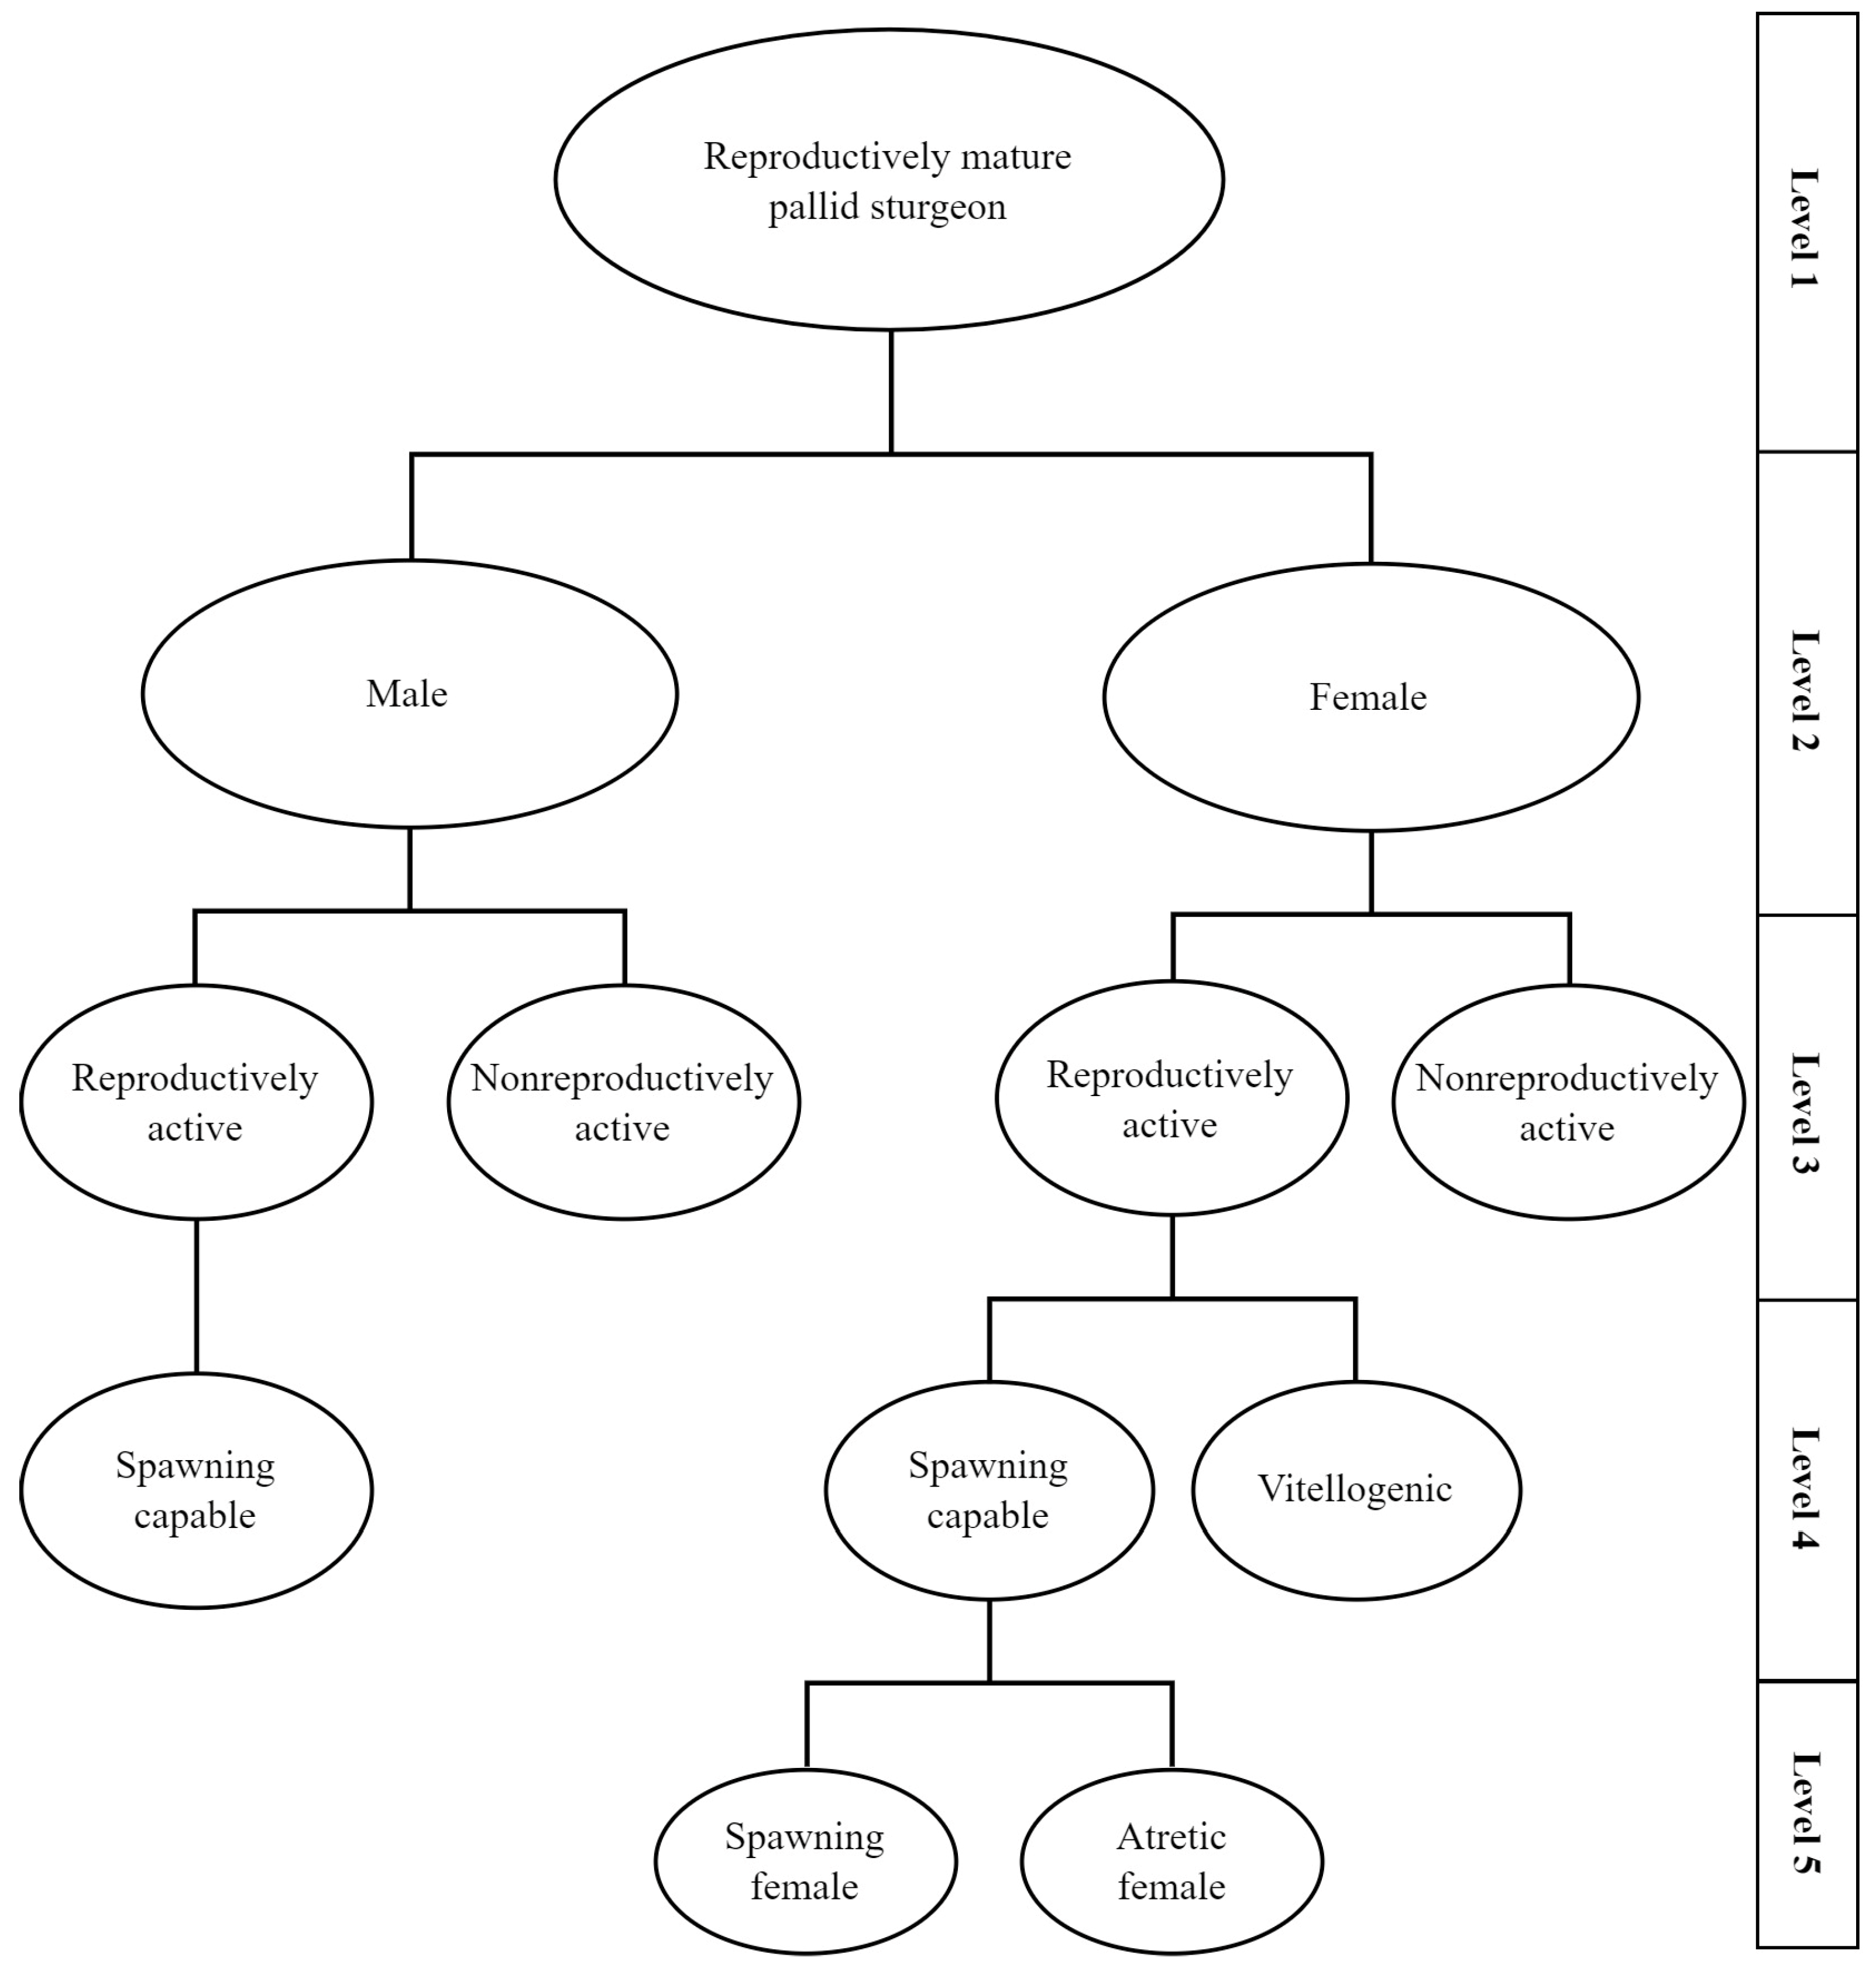
2.3. Sex and Stage Determination
2.4. Tracking
2.5. Data Analysis
3. Results
4. Discussion
5. Conclusions
Author Contributions
Funding
Institutional Review Board Statement
Data Availability Statement
Acknowledgments
Conflicts of Interest
References
- Scott, G.L.; McCaughey, W.W.; Izlar, K. Guidelines for Whitebark Pine Planting Prescriptions; U.S. Department of Agriculture, Forest Service, Rocky Mountain Research Station: Fort Collins, CO, USA, 2011; Volume 63, pp. 362–364.
- Amaral, M.; Kozol, A.; French, T. Conservation Status and Reintroduction of the Endangered American Burying Beetle. Northeast. Nat. 1997, 4, 121. [Google Scholar] [CrossRef]
- Walters, J.R.; Derrickson, S.R.; Michael Fry, D.; Haig, S.M.; Marzluff, J.M.; Wunderle, J.M. Status of the California Condor (Gymnogyps californianus) and Efforts to Achieve Its Recovery. Auk 2010, 127, 969–1001. [Google Scholar] [CrossRef]
- Jachowski, D.S.; Lockhart, J.M. Reintroducing the Black-Footed Ferret Mustela Nigripes to the Great Plains of North America. Small Carniv. Conserv. 2009, 41, 58–64. [Google Scholar]
- Griffiths, R.A.; Pavajeau, L. Captive Breeding, Reintroduction, and the Conservation of Amphibians: Amphibian Captive Breeding. Conserv. Biol. 2008, 22, 852–861. [Google Scholar] [CrossRef]
- Schooley, J.D.; Marsh, P.C. Stocking of Endangered Razorback Suckers in the Lower Colorado River Basin over Three Decades: 1974–2004. N. Am. J. Fish. Manag. 2007, 27, 43–51. [Google Scholar] [CrossRef]
- Lumsden, H.G.; Drever, M.C. Overview of the Trumpeter Swan Reintroduction Program in Ontario, 1982–2000. Waterbirds 2002, 25, 301–312. [Google Scholar]
- Al-Chokhachy, R.; Heki, L.; Loux, T.; Peka, R. Return of a Giant: Coordinated Conservation Leads to the First Wild Reproduction of Lahontan Cutthroat Trout in the Truckee River in Nearly a Century. Fisheries 2020, 45, 63–73. [Google Scholar] [CrossRef]
- Bezold, J.; Peterson, D.L. Assessment of Lake Sturgeon Reintroduction in the Coosa River System, Georgia–Alabama. Am. Fish. Soc. Symp. 2008, 62, 1–16. [Google Scholar]
- Crossman, J.A.; Korman, J.; McLellan, J.G.; Howell, M.D.; Miller, A.L. Competition Overwhelms Environment and Genetic Effects on Growth Rates of Endangered White Sturgeon from Conservation Aquaculture. Can. J. Fish. Aquat. Sci. 2023, in press. [Google Scholar] [CrossRef]
- Marsh, P.C.; Dowling, T.E.; Kesner, B.R.; Turner, T.F.; Minckley, W.L. Conservation to Stem Imminent Extinction: The Fight to Save Razorback Sucker Xyrauchen texanus in Lake Mohave and Its Implications for Species Recovery. Copeia 2015, 103, 141–156. [Google Scholar] [CrossRef]
- Cochran-Biederman, J.L.; Wyman, K.E.; French, W.E.; Loppnow, G.L. Identifying Correlates of Success and Failure of Native Freshwater Fish Reintroductions: Native Freshwater Fish Reintroduction. Conserv. Biol. 2015, 29, 175–186. [Google Scholar] [CrossRef] [PubMed]
- Álvarez, D.; Nicieza, A.G. Predator Avoidance Behaviour in Wild and Hatchery-Reared Brown Trout: The Role of Experience and Domestication: Predator avoidance in juvenile trout. J. Fish Biol. 2003, 63, 1565–1577. [Google Scholar] [CrossRef]
- Jackson, C.D.; Brown, G.E. Differences in Antipredator Behaviour between Wild and Hatchery-Reared Juvenile Atlantic Salmon (Salmo salar) under Seminatural Conditions. Can. J. Fish. Aquat. Sci. 2011, 68, 2157–2166. [Google Scholar] [CrossRef]
- Serrano, I.; Larsson, S.; Eriksson, L.-O. Migration Performance of Wild and Hatchery Sea Trout (Salmo Trutta L.) Smolts—Implications for Compensatory Hatchery Programs. Fish. Res. 2009, 99, 210–215. [Google Scholar] [CrossRef]
- Hagelin, A.; Calles, O.; Greenberg, L.; Piccolo, J.; Bergman, E. Spawning Migration of Wild and Supplementary Stocked Landlocked Atlantic Salmon (Salmo salar): Spawning migration of wild and stocked salmon. River Res. Appl. 2016, 32, 383–389. [Google Scholar] [CrossRef]
- Brown, C.; Laland, K. Social Enhancement and Social Inhibition of Foraging Behaviour in Hatchery-Reared Atlantic Salmon. J. Fish Biol. 2002, 61, 987–998. [Google Scholar] [CrossRef]
- USFWS (United States Fish and Wildlife Service). Revised Recovery Plan for the Pallid Sturgeon (Scaphirhynchus Albus); Fish and Wildlife Service: Denver, CO, USA, 2014.
- Holmquist, L.M. (Montana Fish, Wildlife and Parks, Lewistown, MT, USA). Personal Communication, 2020.
- Braaten, P.J.; Fuller, D.B.; Holte, L.D.; Lott, R.D.; Viste, W.; Brandt, T.F.; Legare, R.G. Drift Dynamics of Larval Pallid Sturgeon and Shovelnose Sturgeon in a Natural Side Channel of the Upper Missouri River, Montana. N. Am. J. Fish. Manag. 2008, 28, 808–826. [Google Scholar] [CrossRef]
- Guy, C.S.; Treanor, H.B.; Kappenman, K.M.; Scholl, E.A.; Ilgen, J.E.; Webb, M.A.H. Broadening the Regulated-River Management Paradigm: A Case Study of the Forgotten Dead Zone Hindering Pallid Sturgeon Recovery. Fisheries 2015, 40, 6–14. [Google Scholar] [CrossRef]
- Holmquist, L.M.; Guy, C.S.; Tews, A.; Trimpe, D.J.; Webb, M.A.H. Reproductive Ecology and Movement of Pallid Sturgeon in the Upper Missouri River, Montana. J. Appl. Ichthyol. 2019, 35, 1069–1083. [Google Scholar] [CrossRef]
- Goodman, B.J.; Guy, C.S.; Camp, S.L.; Gardner, W.M.; Kappenman, K.M.; Webb, M.A.H. Shovelnose Sturgeon Spawning in Relation to Varying Discharge Treatments in a Missouri River Tributary. River Res. Appl. 2013, 29, 1004–1015. [Google Scholar] [CrossRef]
- Chiotti, J.A.; Holtgren, J.M.; Auer, N.A.; Ogren, S.A. Lake Sturgeon Spawning Habitat in the Big Manistee River, Michigan. N. Am. J. Fish. Manag. 2008, 28, 1009–1019. [Google Scholar] [CrossRef]
- Scott, M.L.; Auble, G.T.; Friedman, J.M. Flood Dependency of Cottonwood Establishment along the Missouri River, Montana, USA. Ecol. Appl. 1997, 7, 677–690. [Google Scholar] [CrossRef]
- NWE (North Western Energy) Hydro Operational Requirments from FERC License Articles and SOP Agreements with Agencies for NWE’s 11 Hydropower Dams (3 FERC Licenses); NWE: Sioux Falls, SD, USA, 2016.
- DNRC (Montana Department of Natural Resource and Conservation) Toston Dam (Broadwater-Missouri); DNRC: Helena, MT, USA, 2014.
- Bovee, K.D.; Scott, M.L. Implications of Flood Pulse Restoration for Populus Regeneration on the Upper Missouri River. River Res. Appl. 2002, 18, 287–298. [Google Scholar] [CrossRef]
- Leathe, S. Effects of Great Falls Reservoirs on Missouri River Water Temperature; NWE: Sioux Falls, SD, USA, 2018.
- Stober, Q.J. Some Limnological Effects of Tiber Reservoir on the Marias River. Master’s Thesis, Montana State University, Bozeman, MT, USA, 1962. [Google Scholar]
- Richards, R.R. Movement of Scaphirhynchus Species in the Missouri River above Fort Peck Reservoir, Montana. Master’s Thesis, Montana State University, Bozeman, MT, USA, 2011. [Google Scholar]
- Morris, G.L. Classification of Management Alternatives to Combat Reservoir Sedimentation. Water 2020, 12, 861. [Google Scholar] [CrossRef]
- Fuller, D.B.; Jaeger, M.E.; Webb, M.A.H. Spawning and Associated Movement Patterns of Pallid Sturgeon in the Lower Yellowstone River; MTFWP: Helena, MT, USA, 2008.
- DeLonay, A.J.; Jacobson, R.B.; Chojnacki, K.A.; Braaten, P.J.; Buhl, K.J.; Eder, B.L.; Elliott, C.M.; Erwin, S.O.; Fuller, D.B.; Haddix, T.M.; et al. Ecological Requirements for Pallid Sturgeon Reproduction and Recruitment in the Missouri River—Annual Report 2013; USGS: Reston, VA, USA, 2016.
- Kappenman, K.M.; Webb, M.A.H.; Greenwood, M. The Effect of Temperature on Embryo Survival and Development in Pallid Sturgeon Scaphirhynchus albus (Forbes & Richardson 1905) and Shovelnose Sturgeon S. Platorynchus (Rafinesque, 1820). J. Appl. Ichthyol. 2013, 29, 1193–1203. [Google Scholar] [CrossRef]
- USFWS (United States Fish and Wildlife Service). Biological Procedure and Protocols for Researchers and Managers Handling Pallid Sturgeon; USFWS: Denver, CO, USA, 2012.
- Webb, M.A.H.; Van Eenennaam, J.P.; Crossman, J.A.; Chapman, F.A. A Practical Guide for Assigning Sex and Stage of Maturity in Sturgeons and Paddlefish. J. Appl. Ichthyol. 2019, 35, 169–186. [Google Scholar] [CrossRef]
- Fitzpatrick, M.S.; Redding, J.M.; Ratti, F.D.; Schreck, C.B. Plasma Testosterone Concentration Predicts the Ovulatory Response of Coho Salmon (Oncorhynchus kisutch) to Gonadotropin-Releasing Hormone Analog. Can. J. Fish. Aquat. Sci. 1987, 44, 1351–1357. [Google Scholar] [CrossRef]
- Fitzpatrick, M.S.; Van Der Kraak, G.; Schreck, C.B. Profiles of Plasma Sex Steroids and Gonadotropin in Coho Salmon, Oncorhynchus kisutch, during Final Maturation. Gen. Comp. Endocrinol. 1986, 62, 437–451. [Google Scholar] [CrossRef]
- Feist, G.; Schreck, C.B.; Fitzpatrick, M.S.; Redding, J.M. Sex Steroid Profiles of Coho Salmon (Oncorhynchus kisutch) during Early Development and Sexual Differentiation. Gen. Comp. Endocrinol. 1990, 80, 299–313. [Google Scholar] [CrossRef]
- Croghan, C.; Egeghy, P.P. Methods of Dealing with Values below the Limit of Detection Using SAS. South. SAS User Group 2003, 22, 24. [Google Scholar]
- Hunter, J.R.; Macewicz, B.J.; Chyan-Huel Lo, N.; Kimbrell, C.A. Fecundity, Spawning, and Maturity of Female Dover Sole Microstomus pacificus, with an Evaluation of Assumptions and Precision. Fish. Bull. 1992, 90, 101–128. [Google Scholar]
- Kaeser, A.J.; Litts, T.L. A Novel Technique for Mapping Habitat in Navigable Streams Using Low-Cost Side Scan Sonar. Fisheries 2010, 35, 163–174. [Google Scholar] [CrossRef]
- U.S. Geological Survey USGS Water Data for the Nation: U.S. Geological Survey National Water Information System Database. Available online: https://waterdata.usgs.gov/nwis (accessed on 15 March 2023).
- Holmquist, L.; Schilz, M.; Beattie, R. Middle Missouri River Radio Telemetry Project 2018 and 2019 Progress Report; MTFWP: Helena, MT, USA, 2021.
- Cherr, G.N.; Clark, W.H. Jelly Release in the Eggs of the White Sturgeon, Acipenser transmontanus: An Enzymatically Mediated Event. J. Exp. Zool. 1984, 230, 145–149. [Google Scholar] [CrossRef]
- Elliott, C.M.; DeLonay, A.J.; Chojnacki, K.A.; Jacobson, R.B. Characterization of Pallid Sturgeon (Scaphirhynchus albus) Spawning Habitat in the Lower Missouri River. J. Appl. Ichthyol. 2020, 36, 25–38. [Google Scholar] [CrossRef]
- Paragamian, V.L.; Kruse, G.; Wakkinen, V. Spawning Habitat of Kootenai River White Sturgeon, Post-Libby Dam. N. Am. J. Fish. Manag. 2001, 21, 22–33. [Google Scholar] [CrossRef]
- Rapp, T.; Shuman, D.A.; Graeb, B.D.S.; Chipps, S.R.; Peters, E.J. Diet Composition and Feeding Patterns of Adult Shovelnose Sturgeon (Scaphirhynchus platorynchus) in the Lower Platte River, Nebraska, USA: Diet Composition and Feeding Patterns. J. Appl. Ichthyol. 2011, 27, 351–355. [Google Scholar] [CrossRef]
- Gosch, N.J.C.; Civiello, A.P.; Gemeinhardt, T.R.; Bonneau, J.L.; Long, J.M. Are Shovelnose Sturgeon a Valid Diet Surrogate for Endangered Pallid Sturgeon during the First Year of Life? J. Appl. Ichthyol. 2018, 34, 39–41. [Google Scholar] [CrossRef]
- Porreca, A.P.; Hintz, W.D.; Garvey, J.E. Do Alluvial Sand Dunes Create Energetic Refugia for Benthic Fishes? An Experimental Test with the Endangered Pallid Sturgeon: Alluvial Dunes Reduce Energy Costs. River Res. Appl. 2017, 33, 690–696. [Google Scholar] [CrossRef]
- Talbott, M.J.; Van Eenennaam, J.P.; Linares-Casenave, J.; Doroshov, S.I.; Guy, C.S.; Struffenegger, P.; Webb, M.A.H. Investigating the Use of Plasma Testosterone and Estradiol-17β to Detect Ovarian Follicular Atresia in Farmed White Sturgeon, Acipenser Transmontanus. Aquaculture 2011, 315, 283–289. [Google Scholar] [CrossRef]
- Munakata, A.; Amano, M.; Ikuta, K.; Kitamura, S.; Aida, K. Involvement of Sex Steroids, Luteinizing Hormone and Thyroid Hormones in Upstream and Downstream Swimming Behavior of Land-Locked Sockeye Salmon Oncorhynchus Nerka. Fish. Sci. 2012, 78, 81–90. [Google Scholar] [CrossRef]


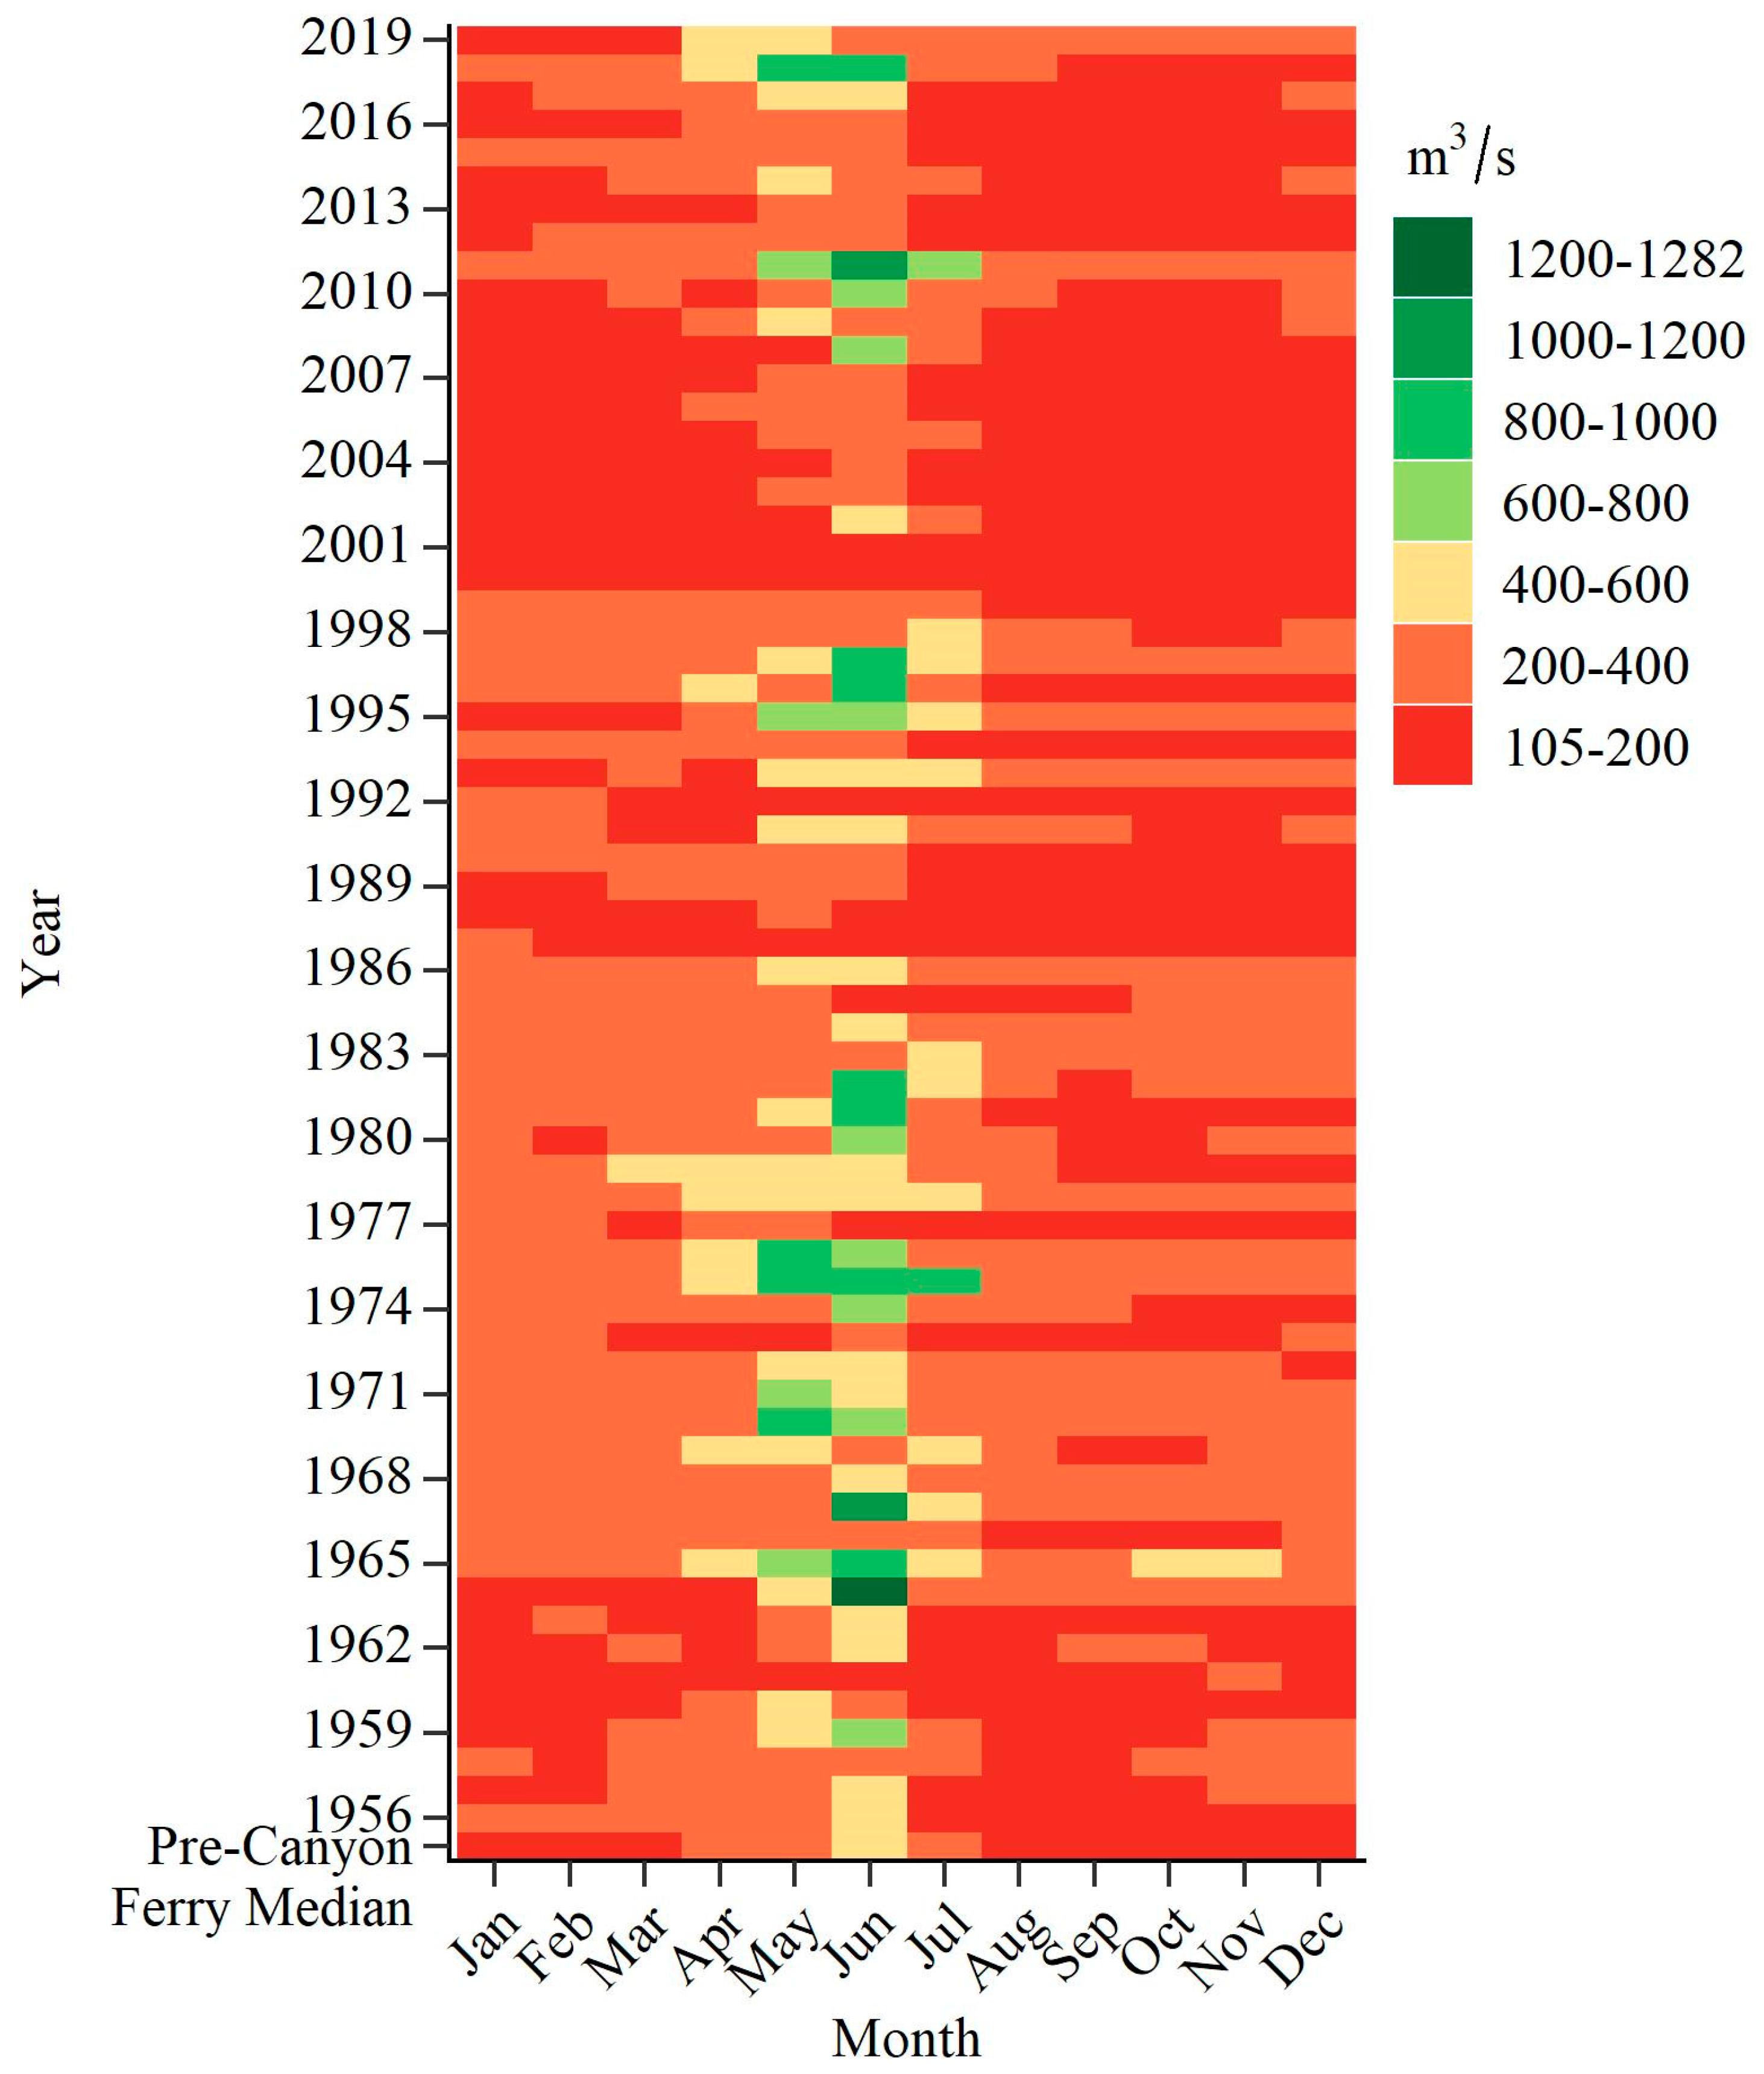
| Month | 1956–2019 | 2015 | 2016 | 2018 | 2019 | ||||
|---|---|---|---|---|---|---|---|---|---|
| 10th | 25th | Median | 75th | 90th | Median | ||||
| April | 152.3 | 196.4 | 246.2 | 293.1 | 408.3 | 210.7 | 205.3 | 511.1 | 406.3 |
| May | 187.3 | 253.2 | 351.1 | 441.0 | 610.2 | 209.5 | 280.9 | 869.3 | 487.0 |
| June | 194.3 | 299.5 | 407.1 | 653.1 | 868.8 | 301.6 | 238.7 | 831.1 | 375.2 |
| July | 139.8 | 173.5 | 248.2 | 332.0 | 512.0 | 184.3 | 171.3 | 322.8 | 303.0 |
| Month | Median Water Temperature (°C) | |||
|---|---|---|---|---|
| 2015 | 2016 | 2018 | 2019 | |
| April | -- | 11.4 | -- | 10.4 |
| May | 14.0 | 14.8 | 13.8 | 12.0 |
| June | 19.9 | 20.7 | -- | 19.0 |
| July | 21.4 | 23.8 | 23.5 | 22.7 |
| Month | 1960–1972 and 2001–2019 | 2015 | 2016 | 2018 | 2019 | ||||
|---|---|---|---|---|---|---|---|---|---|
| 10th | 25th | Median | 75th | 90th | Median | ||||
| April | 11.5 | 14.0 | 15.2 | 27.1 | 37.1 | 15.7 | 14.0 | 81.8 | 18.9 |
| May | 13.3 | 14.9 | 30.9 | 40.2 | 56.6 | 15.1 | 13.9 | 90.3 | 20.4 |
| June | 13.7 | 18.0 | 34.5 | 54.4 | 79.2 | 18.3 | 13.6 | 50.7 | 20.4 |
| July | 10.0 | 15.2 | 19.4 | 39.7 | 57.6 | 18.2 | 14.9 | 21.5 | 75.3 |
| Month | Median Water Temperature (°C) | |||
|---|---|---|---|---|
| 2015 | 2016 | 2018 | 2019 | |
| April | 10.7 | 11.0 | 6.0 | 9.6 |
| May | 14.7 | 15.6 | 11.9 | 12.3 |
| June | 20.3 | 20.4 | 16.5 | 18.9 |
| July | 20.8 | 22.8 | 20.0 | 19.9 |
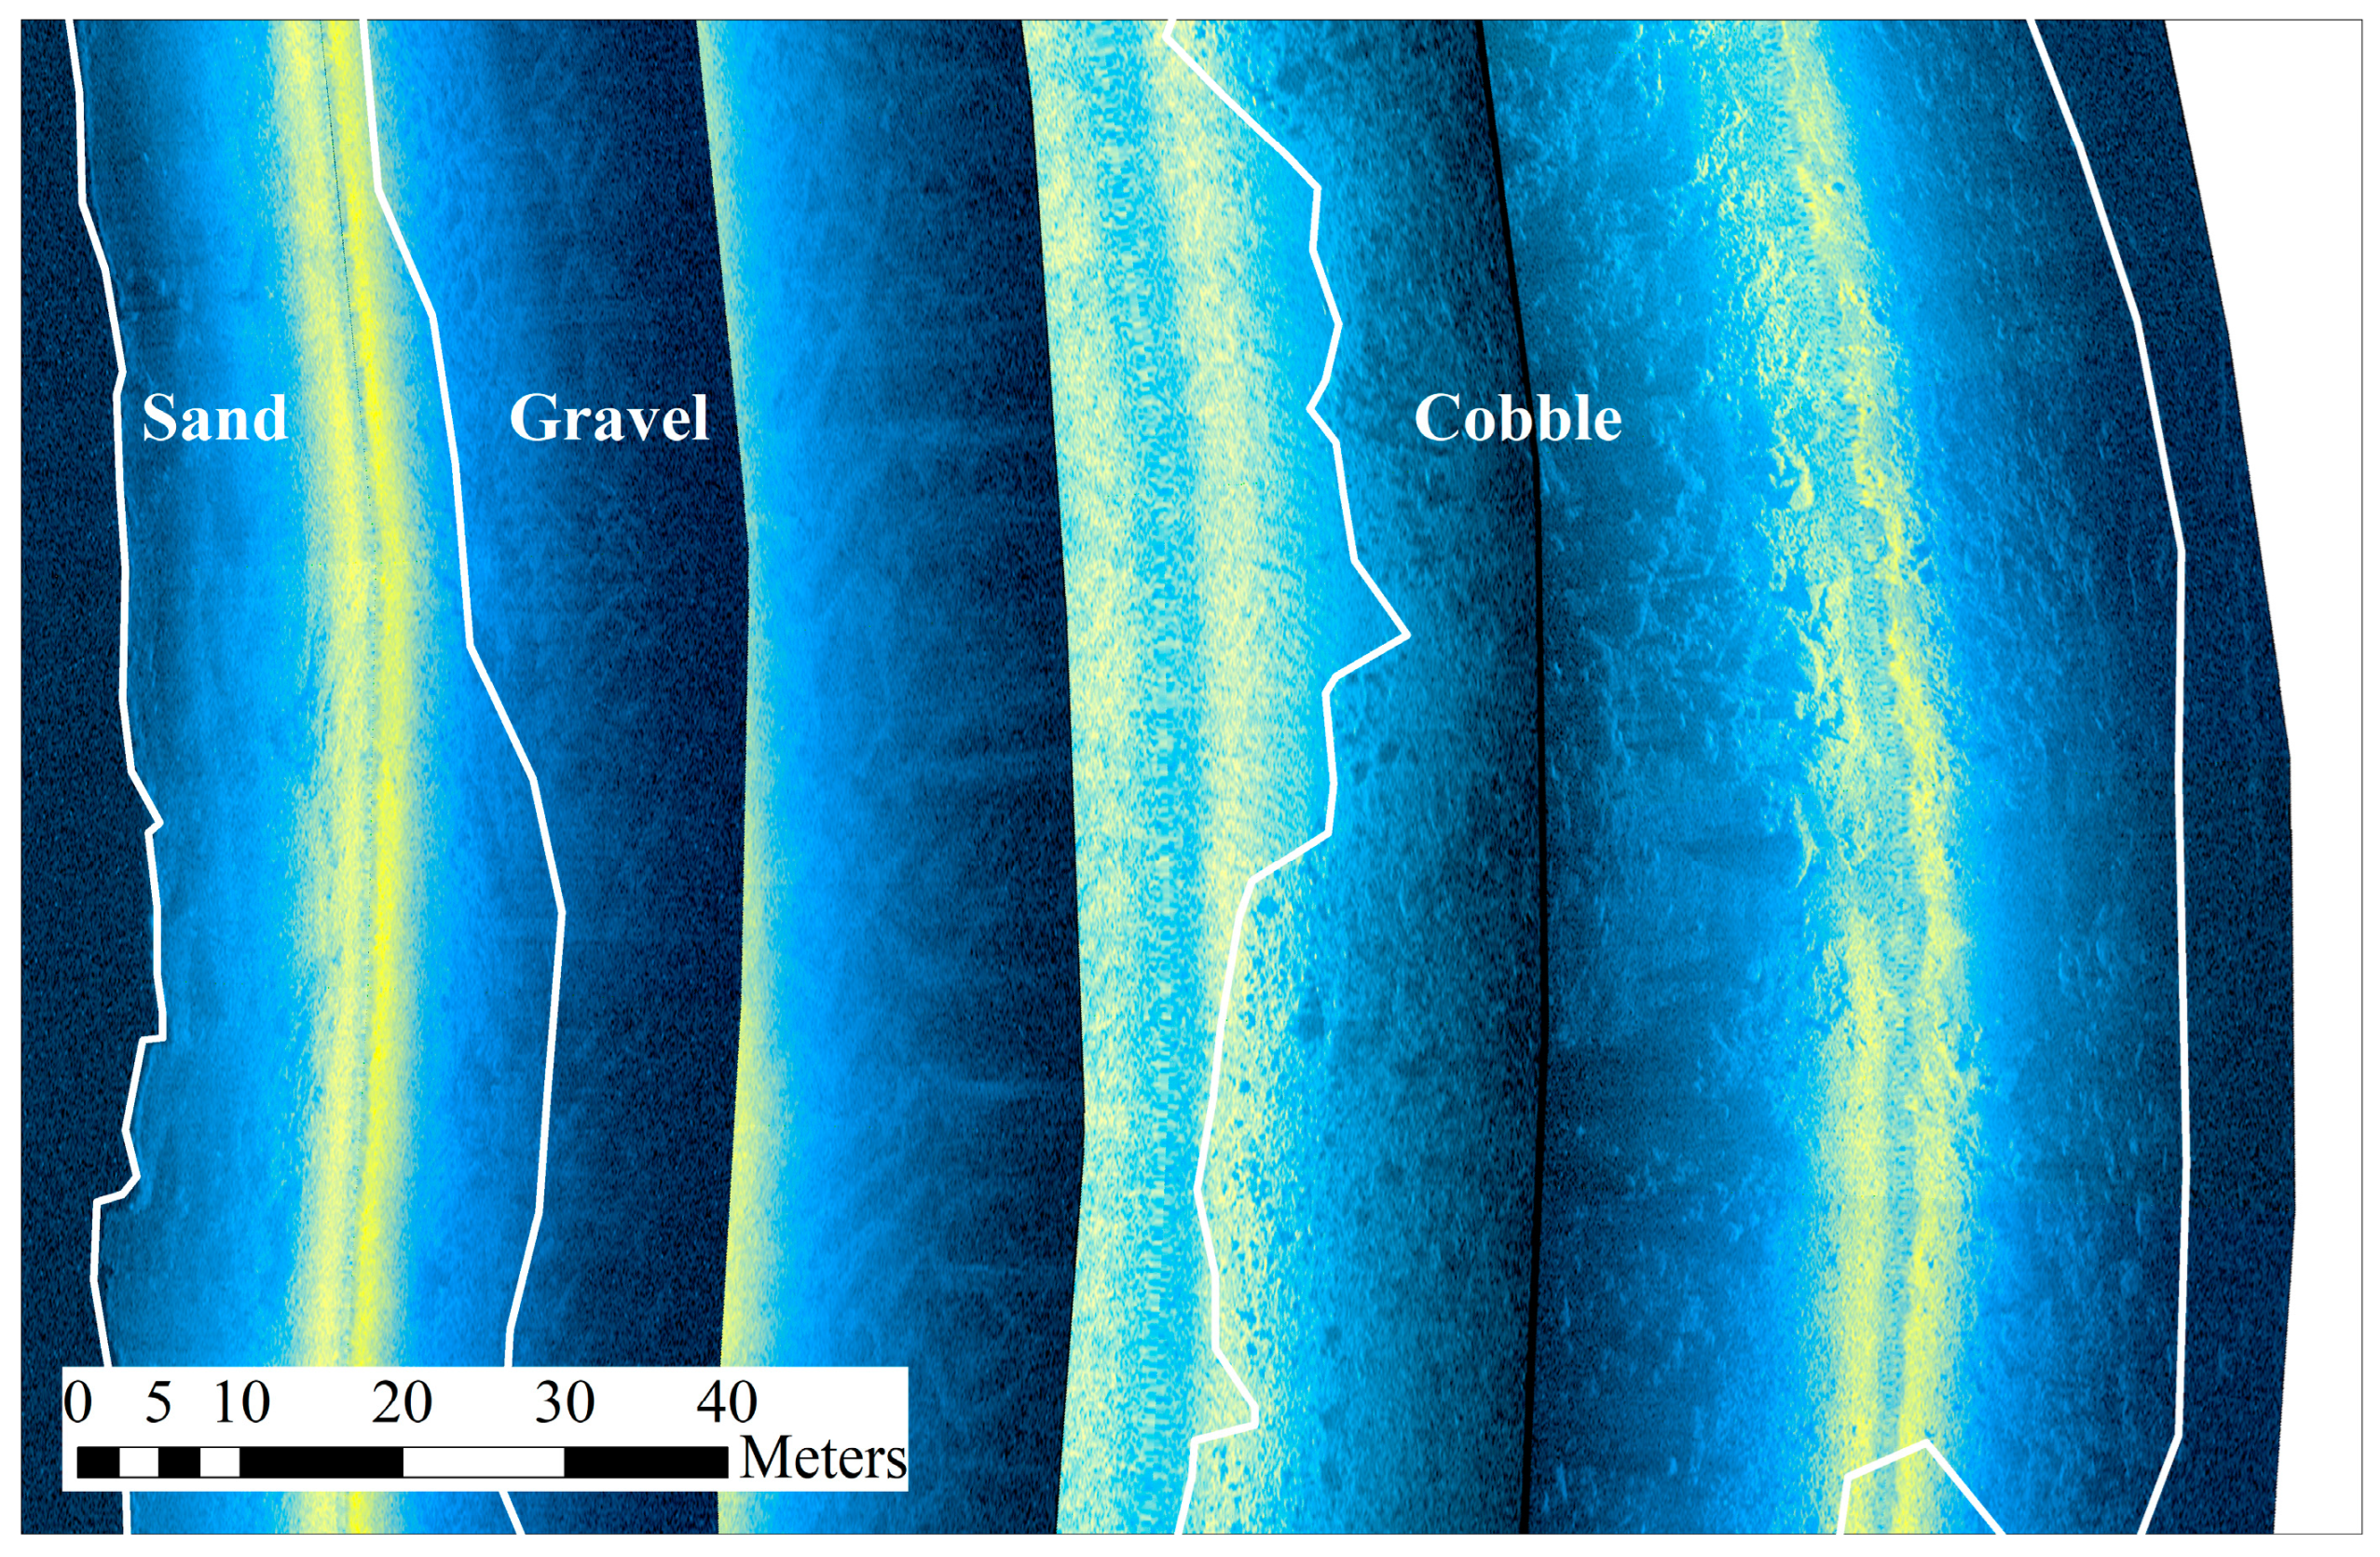
| Mapped Reach (rkm) | Proportion Substrate Type | ||
|---|---|---|---|
| Sand | Gravel | Cobble | |
| 3081.5–3084.0 | 0.43 | 0.56 | 0.01 |
| 3088.0–3090.0 | 0.41 | 0.53 | 0.06 |
| 3117.5–3119.0 a | 0.38 | 0.49 | 0.13 |
| Median (IQR) | 0.41 (0.02) | 0.53 (0.04) | 0.06 (0.06) |
Disclaimer/Publisher’s Note: The statements, opinions and data contained in all publications are solely those of the individual author(s) and contributor(s) and not of MDPI and/or the editor(s). MDPI and/or the editor(s) disclaim responsibility for any injury to people or property resulting from any ideas, methods, instructions or products referred to in the content. |
© 2023 by the authors. Licensee MDPI, Basel, Switzerland. This article is an open access article distributed under the terms and conditions of the Creative Commons Attribution (CC BY) license (https://creativecommons.org/licenses/by/4.0/).
Share and Cite
Cox, T.L.; Guy, C.S.; Holmquist, L.M.; Webb, M.A.H. Spawning Locations of Pallid Sturgeon in the Missouri River Corroborate the Mechanism for Recruitment Failure. Fishes 2023, 8, 243. https://doi.org/10.3390/fishes8050243
Cox TL, Guy CS, Holmquist LM, Webb MAH. Spawning Locations of Pallid Sturgeon in the Missouri River Corroborate the Mechanism for Recruitment Failure. Fishes. 2023; 8(5):243. https://doi.org/10.3390/fishes8050243
Chicago/Turabian StyleCox, Tanner L., Christopher S. Guy, Luke M. Holmquist, and Molly A. H. Webb. 2023. "Spawning Locations of Pallid Sturgeon in the Missouri River Corroborate the Mechanism for Recruitment Failure" Fishes 8, no. 5: 243. https://doi.org/10.3390/fishes8050243
APA StyleCox, T. L., Guy, C. S., Holmquist, L. M., & Webb, M. A. H. (2023). Spawning Locations of Pallid Sturgeon in the Missouri River Corroborate the Mechanism for Recruitment Failure. Fishes, 8(5), 243. https://doi.org/10.3390/fishes8050243