Article

Quantitative Analysis of Ovarian Dynamics of European Sardine Sardina pilchardus (Walbaum, 1792) during Its Spawning Period

by
Eleni Servou
1,2,*,
Eudoxia Schismenou
1,* and
Stylianos Somarakis
1
1
Institute of Marine Biological Resources and Inland Waters (IMBRIW), Hellenic Centre for Marine Research (HCMR), 71500 Heraklion, Greece
2
Biology Department, University of Crete, 70013 Heraklion, Greece
*
Authors to whom correspondence should be addressed.
Fishes 2023, 8(5), 226; https://doi.org/10.3390/fishes8050226
Submission received: 17 March 2023 / Revised: 14 April 2023 / Accepted: 16 April 2023 / Published: 25 April 2023

Abstract

:
Fish with indeterminate fecundity spawn multiple times throughout a protracted reproductive period. During that period several ovulation events succeed one another, and different oocyte developmental stages co-occur in the ovaries with new oocytes consistently recruiting from one growth phase to the next to form the sequential batches. In this study, we examined in detail the oocyte recruitment and development pattern of the sequential batches in a commercially important fish with indeterminate fecundity, the European sardine. The numbers and sizes of oocytes at different developmental stages were estimated for four phases of the ovulatory cycle (ovarian stages) and during the main spawning season (November–March) by applying the oocyte packing density theory in combination with stereological techniques. General linear models (GLMs) were used to test for changes in oocyte sizes as well as relative oocyte numbers per developmental stage within the different ovarian stages in the successive spawning months. A temporal association between several transition events of the oocyte development process was revealed. Specifically, the final maturation of the advanced batch triggered (a) the recruitment of oocytes from primary to secondary growth phase, (b) de novo vitellogenesis and (c) a surge of yolk deposition in primary vitellogenic oocytes. Oocyte recruitment was completed two days after the ovulation of the advanced batch and relative numbers of primary and secondary growth oocytes were thereafter stable until the next final maturation event. This pattern of oocyte recruitment and growth remained unchanged during the course of the spawning season. This study advances our knowledge on oocyte recruitment and development in fish with indeterminate fecundity, which is key to understanding reproduction and its drivers at the individual and population level.
Key Contribution: An array of methods and techniques were used for the precise quantification of ovarian dynamics of European sardine. Within an ovulatory cycle, oocyte recruitment from primary to secondary growth phase and de novo vitellogenesis were synchronized and triggered by final maturation of the advanced batch. The pattern of batch formation and fecundity remained unchanged during the spawning season.

Graphical Abstract

1. Introduction

Understanding the dynamics of oocyte recruitment and development is an important step towards determining fish reproductive output at the individual level and how the reproductive potential of the population may change with thermal habitat, trophic conditions, geographic range, and, ultimately, climate change. Furthermore, detailed knowledge of ovarian dynamics is a requisite for designing and applying a suitable egg production method for spawning biomass estimation.
Oocytes in all teleosts undergo the same fundamental processes for oogenesis: oogonial proliferation and early mitotic division, oocyte growth, final maturation and ovulation [1,2]. Oocyte growth is divided into the primary growth phase (PG), during which the Balbiani body (Bb) complex is formed [3] and the secondary growth (SG) phase which includes cortical alveoli formation and vitellogenesis [2,4]. However, even though the general oocyte development process is the same, there is a great variety in the pattern of its dynamics. In fishes with determinate fecundity, the total number of oocytes to be released during the spawning season are recruited into vitellogenesis prior to the onset of the spawning period, while in those with indeterminate fecundity, oocytes continue to recruit into vitellogenesis after the start of the spawning season [5,6].
In batch spawners with indeterminate fecundity, during the spawning season, several ovulation events follow one after another and different oocyte developmental stages co-occur in the ovaries, with new oocytes consistently recruiting from one growth phase to the next to form the sequential batches [2,7]. The development of the advanced batch and the process of oocyte recruitment from primary to secondary growth phase have been studied and used to describe the different reproductive strategies [2,5,7]. Recent developments in fish reproductive biology, such as the oocyte packing density (OPD) theory and automated whole mount analyses have greatly advanced oocyte quantification, especially for the early oocyte developmental stages [8,9,10,11,12,13,14,15], thus providing new, useful and reliable tools to study oogenesis in detail.
Schismenou et al. [10] using the above-mentioned methods showed that in European anchovy (Engraulis encrasicolus) the hydration of the advanced batch activates the recruitment of oocytes into vitellogenesis which occurs in rapid pulses of less than 24 h. Mouchlianitis et al. [15] have found that in Alosa macedonica, another fish with indeterminate fecundity, oocyte recruitment from primary to secondary growth phase occurs in a stepwise manner in parallel with the ovulation, while Somarakis et al. [16] showed that, in Etrumeus golanii, during the final maturation of the advanced batch, a new batch starts to recruit quickly to sizes > 500 μm and after ovulation, it grows rapidly to form the new advanced batch. However, such studies usually do not examine how these processes may change during the course of a protracted spawning period.
The objective of the present study was to describe the recruitment and development pattern of the sequential spawning batches in Sardina pilchardus during its spawning season in the Eastern Mediterranean Sea. The European sardine is a commercially important small pelagic fish that spawns multiple times along a protracted reproductive period in winter, using energy stored mainly in spring–summer [17,18]. The active spawning females ovulate from 19:00 to 23:00 every 11–12 days [19]. The spawning batch is fully separated in size from the remaining population of smaller oocytes at the final stage of vitellogenesis (tertiary vitellogenic oocyte stage) [20].
For the purpose of this study, we applied the OPD theory [8,9] along with a suite of methods and techniques in fish reproductive biology (histology, stereology, whole mount analysis) to estimate the numbers and sizes of oocytes at different developmental stages. A series of general linear models (GLMs) were fitted to assess variations in oocytes’ relative numbers and sizes, at two temporal scales, i.e., within the ovulatory cycle and during the spawning season.

2. Materials and Methods

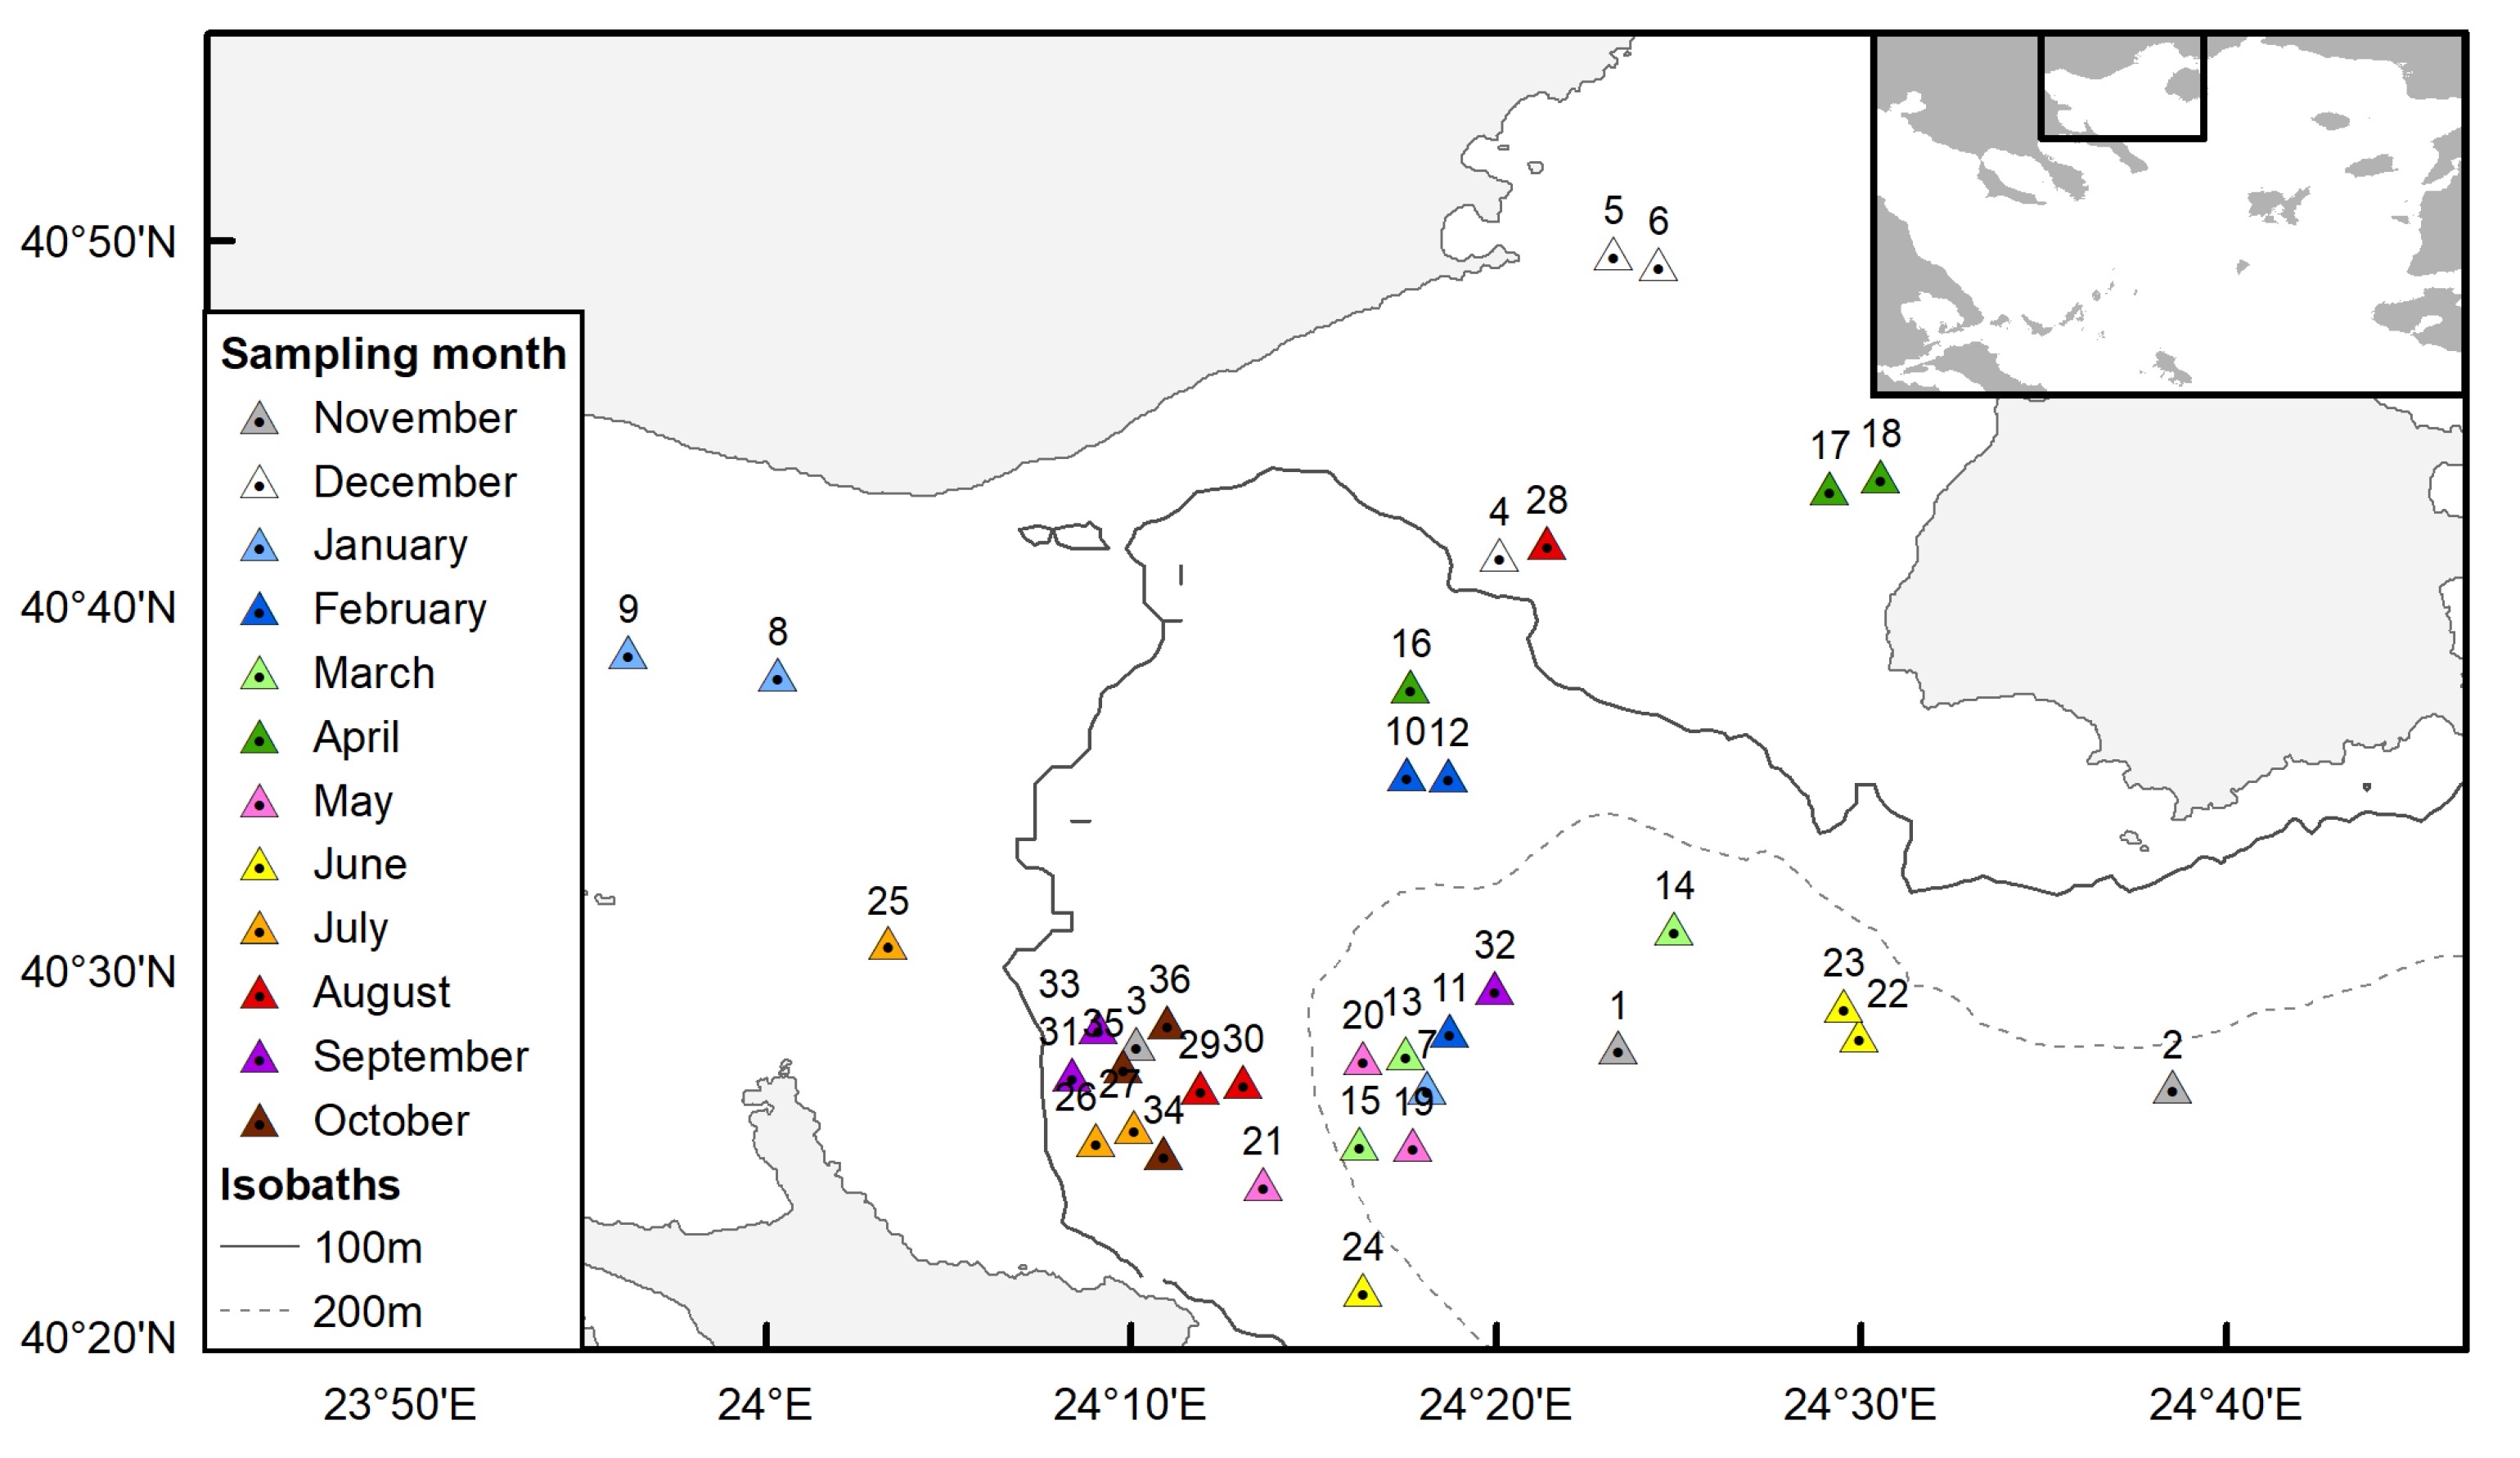
2.1. Ovarian Sampling and Processing

Female sardines were sampled monthly in the North Aegean Sea (Figure 1) on board local purse-seiners for one year (November 2018–October 2019). Each month, three samples of ~50 fish were randomly collected and the ovaries of 14–25 females were immediately removed after capture and preserved in 10% buffered formalin. Fish were then stored (−20 °C) for subsequent processing in the laboratory. The latter included measurements of total length (TL, mm), total or gonad-free weight in the case of females with gonads removed (TW or GFW, g), eviscerated weight (EW, g) and formalin-preserved gonad weight (GWformalin, 0.001 g) (Table S1).
In total, 770 ovaries were collected and subjected to histological analysis. One lobe of each ovary was dehydrated in gradually increasing ethanol solutions (70–96%), cut into 2–4 pieces and embedded in glycol methacrylate resin (Technovit 7100; Heraeus, Kulzer, Germany). Histological sections (4 μm) were cut using a microtome (Shandon Finesse ME+, Thermo Scientific, Uppsala, Sweden) and stained with methylene blue/azure II/basic fuchsin [21]. The sections were examined under a light microscope considering that sardine’s ovaries are homogenous [22]. Histological scoring included the developmental stage of the most advanced group of oocytes, the presence/age of postovulatory follicles (POFs) and the incidence/prevalence of atresia. Ovaries were then assigned into ovarian phases according to Brown-Peterson et al. [4].
Oocytes were classified into nine developmental stages (Figure 2) according to published descriptions of sardine oocyte developmental stages and characteristics of early oocyte development [1,3,20,23]. Oocytes at primary growth phase (PG) were divided into two stages, PG1 and PG2. Early primary growth oocytes (PG1) were smaller with homogenous, densely stained cytoplasm, while late primary growth oocytes (PG2) were larger and characterized by the appearance of zona radiata and a granular asymmetric cytoplasm. The appearance of the latter has been found to be associated with the formation of the Bb complex and the adjacent perinuclear ring [3,23]. Cortical alveoli oocytes (CA) were classified into early cortical alveoli (CA1), with vesicles appearing at the periphery of the cytoplasm forming a single layer, and late cortical alveoli oocytes (CA2), with larger vesicles forming multiple layers and fully formed follicular layers [1]. The subsequent oocyte developmental stages were assigned following Ganias et al. [20] and the terminology was adjusted to Brown-Peterson et al.’s [4] i.e., primary vitellogenic oocytes (Vtg1), with small yolk granules extending up to ¾ of the distance from the periphery to the perinuclear zone, secondary vitellogenic oocytes (Vtg2), with yolk granules increased in number and size filling the entire cytoplasm along with oil droppers, tertiary vitellogenic oocytes (Vtg3), with yolk globules all over the cytoplasm and oil droplets only in the periphery of the germinal vesicle, germinal vesicle migration oocytes (GVM) and hydrated oocytes (HYD).
Ageing of POFs (Day-0, Day-1 and Day-2) was based on Ganias et al.’s [19] descriptions given that during the months of the spawning season sardine samples were collected from late afternoon to up to few hours after midnight (see Section 3 and Table S1). Briefly, POFs-0 had no signs of degeneration and were always substantially larger and more looped than the next classes; POFs-1 were almost half in size compared to POFs-0 with a few or no loops; and POFs-2 were very small, had no folds and their shape was triangular [19]. Finally, gonads were assigned to atretic states 0, 1, 2, and 3, having 0%, <50% and ≥50% of vitellogenic oocytes with α-atresia, and no vitellogenic oocytes but β-atresia, respectively [24].

2.2. Oocyte Packing Density Theory

Based on the histological analysis, ovaries sampled one and two days after ovulation with Vtg2 oocytes as the most advanced group (Vtg2, POF-1 and Vtg2, POF-2, respectively), ovaries with Vtg3 oocytes and ovaries with GVM oocytes as the most advanced group were selected to cover the time interval between two sequential ovulation events (ovulation cycle). For each one of the four selected gonad stages (Vtg2, POF-1; Vtg2, POF-2; Vtg3 and GVM) three ovaries of atretic state 0 were chosen for each month of the spawning season (November-March; see Section 3) as shown in Table 1.
The number of oocytes per gram of ovary (oocyte packing density, OPD) was estimated theoretically [9] for each oocyte stage i in each one of the chosen ovaries j, using the equation of Korta et al. [8]:
log OPD ij = log V V ij × 1 ρ ο × 1 + k ij 3 8 × k ij + 12.28 3 log ( cOD V ij ) ,
where OPDij is number of stagei oocytes per gram of ovary j, (g−1), VVij is volume fraction of stagei oocytes in ovary j, ρο is ovarian density, (g cm−3), kij is shape factor, the mean ratio of long (L) to short (S) diameter of stagei oocytes in ovary j, and cODvij is volume-based mean oocyte diameter of stagei oocytes in ovary j corrected for histology shrinkage [10,25].
The sum of OPDij of all stage i oocytes in the ovary was the total number of oocytes per gram of ovary j (OPDj).

2.2.1. Volume Fraction

Volume fractions (VVij) for each stage i oocytes were estimated in each ovary j following the Delesse principle, according to which, area fraction is proportional to volume fraction [26]. Each histological preparation was photographed (Micropublisher five RTVCamera, QImaging, Canada, 1.202 pixel μm−1) and at least six photos/counting fields of 3.402 mm2 were used per individual, a sufficient number for calculations accuracy [8,25]. Volume fractions were calculated using a Weibel Grid with 256 points (software ImageJ [27], plugin ObjectJ [28]) hitting stagei oocytes, “other” (which includes ovarian wall, stroma, blood capillaries and POFs) or empty space. Vvi for every oocyte stagei or “other” was computed as the ratio between grid points hitting stagei oocytes (or “other”) and total points hitting the sectioned ovary (excluding hits on empty space) so that the sum of all estimated volume fractions in each individual was added up to one.

2.2.2. Ovarian Density

Ovary volume was estimated based on the ‘Scherle principle’ [29] for 83 well-preserved and intact ovaries of the four gonad stages. The combined ovary displaced weight (mw) was measured by suspending the fixed ovaries in saline water of known density (ρw) resting on balance, and ovary volume was calculated as GVformalin = mww. Ovarian density was determined from ovary mass and volume (ρo = GWformalin/GVformalin, g cm−3). Analysis of variance (ANOVA) was performed to test differences in ovarian density between gonads with Vtg2, Vtg3 and GVM oocytes as the most advanced group of oocytes.

2.2.3. Volume-Based Oocyte Diameter

Volume-based oocyte diameters were measured in the same histological preparations. In each female, for the 2–23 largest oocytes of each stagei sectioned through the nucleus, the long (L) and short (S) diameters were measured manually using the ‘elliptical oocyte project’ (software ImageJ [27], plugin ObjectJ [28]). These measurements were used to estimate individual shape factor Kind = L/S and individual oocyte diameter (ODind = (L + S)/2) of each oocyte. Subsequently, the mean oocyte stagei shape factor (Kij) was estimated, and a correction factor (see next paragraph) was applied to ODind to rectify for oocyte shrinkage during histological processing. The shrinkage-corrected individual oocytes’ diameters (cODind) in each ovary j represented the actual oocyte dimensions in formalin-preserved ovaries, and were used to calculate the corrected volume-based mean stagei oocyte diameter (cODVij) of the OPDij formula [8,9]:
cOD V ij = α = 1 n ij cOD ind ij 3 n ij 1 3 ,

2.2.4. Correction for Oocyte Shrinkage—Whole Mount Analysis

Oocyte diameters were measured in 30 formalin-preserved ovaries [those in Table 1 and nine more with PG (PG1 or PG2, n = 3), CA (CA1 or CA2, n = 3) and Vtg1 (n = 3) oocytes as the most advanced developmental oocyte stage] to calculate the histology shrinkage factor (HSF). For each ovary, a subsample of 2–10 mg (PG to Vtg1 ovaries) or 10–20 mg (Vtg2 to GVM ovaries) was used for whole mount analysis. Oocyte diameters were measured from pictures with a resolution of 0.1207 pixels μm−1 taken with a FLEXCAM C1 camera mounted on a Leica M80 stereoscope using transmitted light. Both short (Sformalin) and long (Lformalin) axes were measured using again the ‘elliptical oocyte project’. Oocytes’ individual diameters were calculated as ODind;formalin = (Sformalin + Lformalin)/2. For the previtellogenic ovaries, only the larger oocytes were measured manually (>150 oocytes); for Vtg1 only the vitellogenic (dark) oocytes were measured using automatic particle analysis (>150 oocytes) and for Vtg2 to GVM the vitellogenic oocytes were measured automatically, and then the remaining oocytes (mostly transparent previtellogenic oocytes) with long axes larger than 80 μm were measured manually (>330 oocytes in total) in order to construct oocyte size frequency distributions (OSFDs).
Subsequently, for each ovary the 10 largest individual oocyte diameters (ODind; formalin) were averaged (mean formalin individual diameter, ODformalin). For the same ovaries, the individual oocyte diameters of the most advanced oocyte stage measured in the histological sections (ODind, see above) were also averaged (mean histological individual dimeter, ODhistology). ODhistology was also calculated for the nine ovaries not included in the stereological analysis. The % HSF was calculated for each oocyte stagei as:
%   HSF i = 1 OD formalin OD histology × 100 ,
ANOVA was performed to test differences in %HSF among the oocyte developmental stages. The final shrinkage factors were used to convert histological (ODind) to formalin-preserved diameters (cODind).

2.2.5. Stagei Oocytes in the Whole Ovary

The total number of stage i oocytes in each ovary j was calculated from OPDij and the formalin-fixed gonad weight (GWj, formalin) as:
Ν ij = OPD ij × GW j , formalin ,
To validate the OPD method, NVtg3 and NGVM values estimated from OPD were tested against batch fecundity estimations for the same ovaries. Batch fecundity was estimated using the traditional gravimetric method [30] for 19 of the studied ovaries at Vtg3 and GVM gonad stages [20] by counting the advanced batch oocytes in three pre-weighed subsamples from each ovary. Similar oocyte numbers predictions would confirm the method’s accuracy.

2.3. Trends along Ovulation Cycle and Reproductive Period

2.3.1. Oocyte Size Trends

Mean estimated diameter (cODvi) of each oocyte stagei at an average fish size (log10GFW) was examined for fluctuations during the ovulation cycle (Gonad stage) and during the spawning season (Month) by fitting the following GLM model for each mean stage i oocyte diameter:
log10(cODVi) = a + b1 × log10(GFW) + b2 × (Gonad stage) + b3 × (Month) + b4 × log10(GFW) × (Gonad stage) + b5 × log10(GFW) × (Month) + b6 × (Gonad stage) × (Month),

2.3.2. Oocyte Number Trends

The trends of stagei oocyte numbers were studied using the adjusted means of the relative numbers of stagei oocyte (Ni/Ntotal, Ni: number of stagei oocytes in an ovary, Ntotal: total number of oocytes of all stages in the ovary) as estimated for each ovarian stage (Gonad stage) and month of the spawning season (Month), by fitting a GLM:
Ni/Ntotal = a + b1 × (Gonad stage) + b2 × (Month)+ b3 × (Gonad stage) × (Month),
for the oocyte stages that were observed in all gonads examined i.e., PG1, PG2, CA1, CA2 and Vtg1, as well as for selected combinations of oocyte stages (see Section 3). In a preliminary analysis, average fish size (log10GFW) had no significant effect in the relative oocyte numbers and was not included in the final GLMs.
Finally, batch fecundity (BF) estimated from OPD method (NVtg3 and NGVM in the respective gonad stages) was examined for potential changes across the months of the spawning season (Month), adjusted for the effect of fish size (log10(GFW)) using the model:
log10(BF) = a + b1 × (Month) + b2 × log10(GFW) + b3 × log10(GFW) × (Month),
All the GLM analyses were performed using backward stepwise selection and only significant terms (p < 0.05) were retained in the final models. All assumptions, i.e., normal distribution of errors and homogeneity of variance, were met [16,31,32]. When no significant model could be fitted, sample means were used.

3. Results

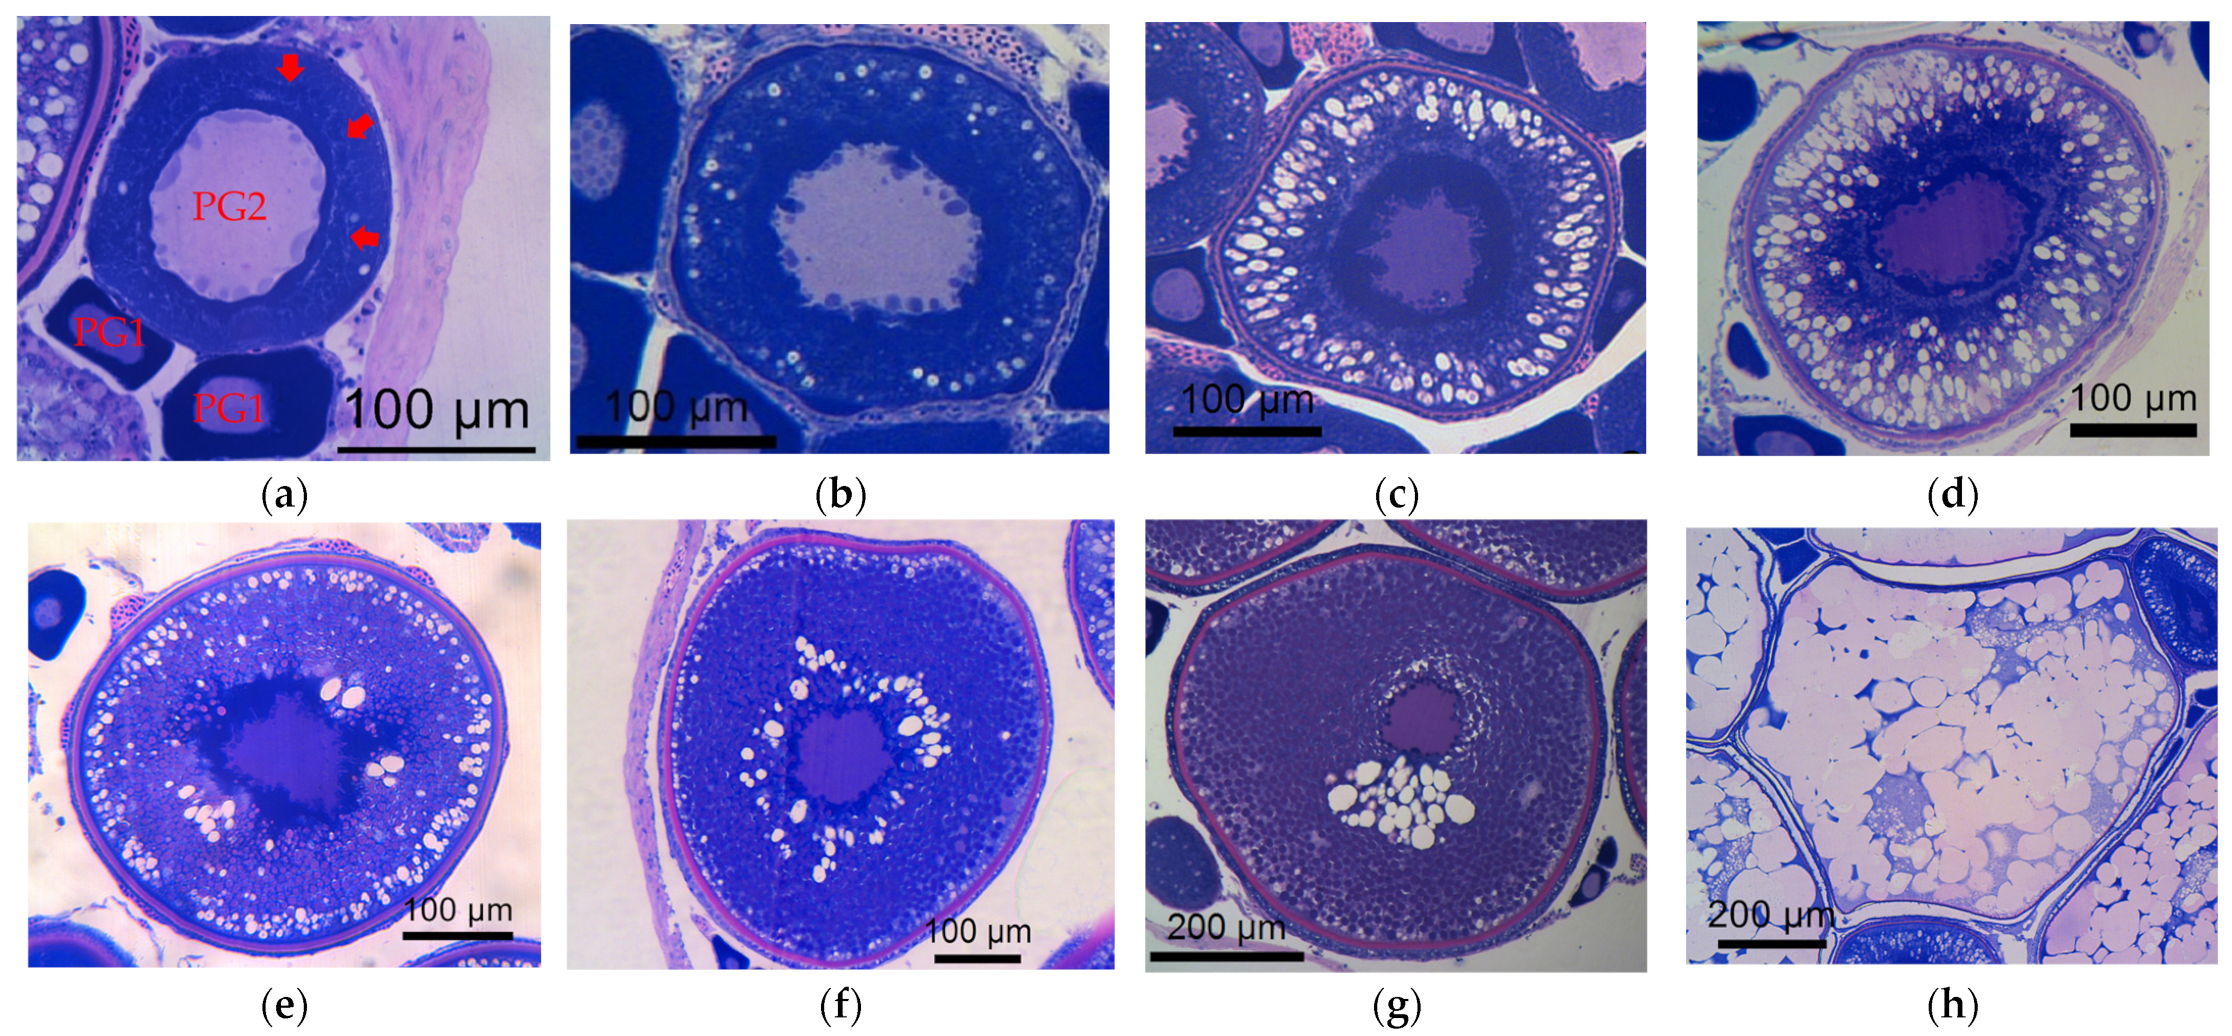
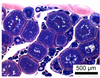
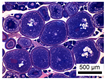
3.1. Histological Analysis

Actively spawning sardines were found from November to March (Table 2). In April, there was a high incidence of atresia signifying the cessation of the spawning period. From May to August, female gonads were at immature/resting phase, containing only primary growth oocytes. In September, ovaries were either at immature/resting phase or developing, while in October they were mostly developing.

3.2. Oocyte Packing Density Theory Parameters

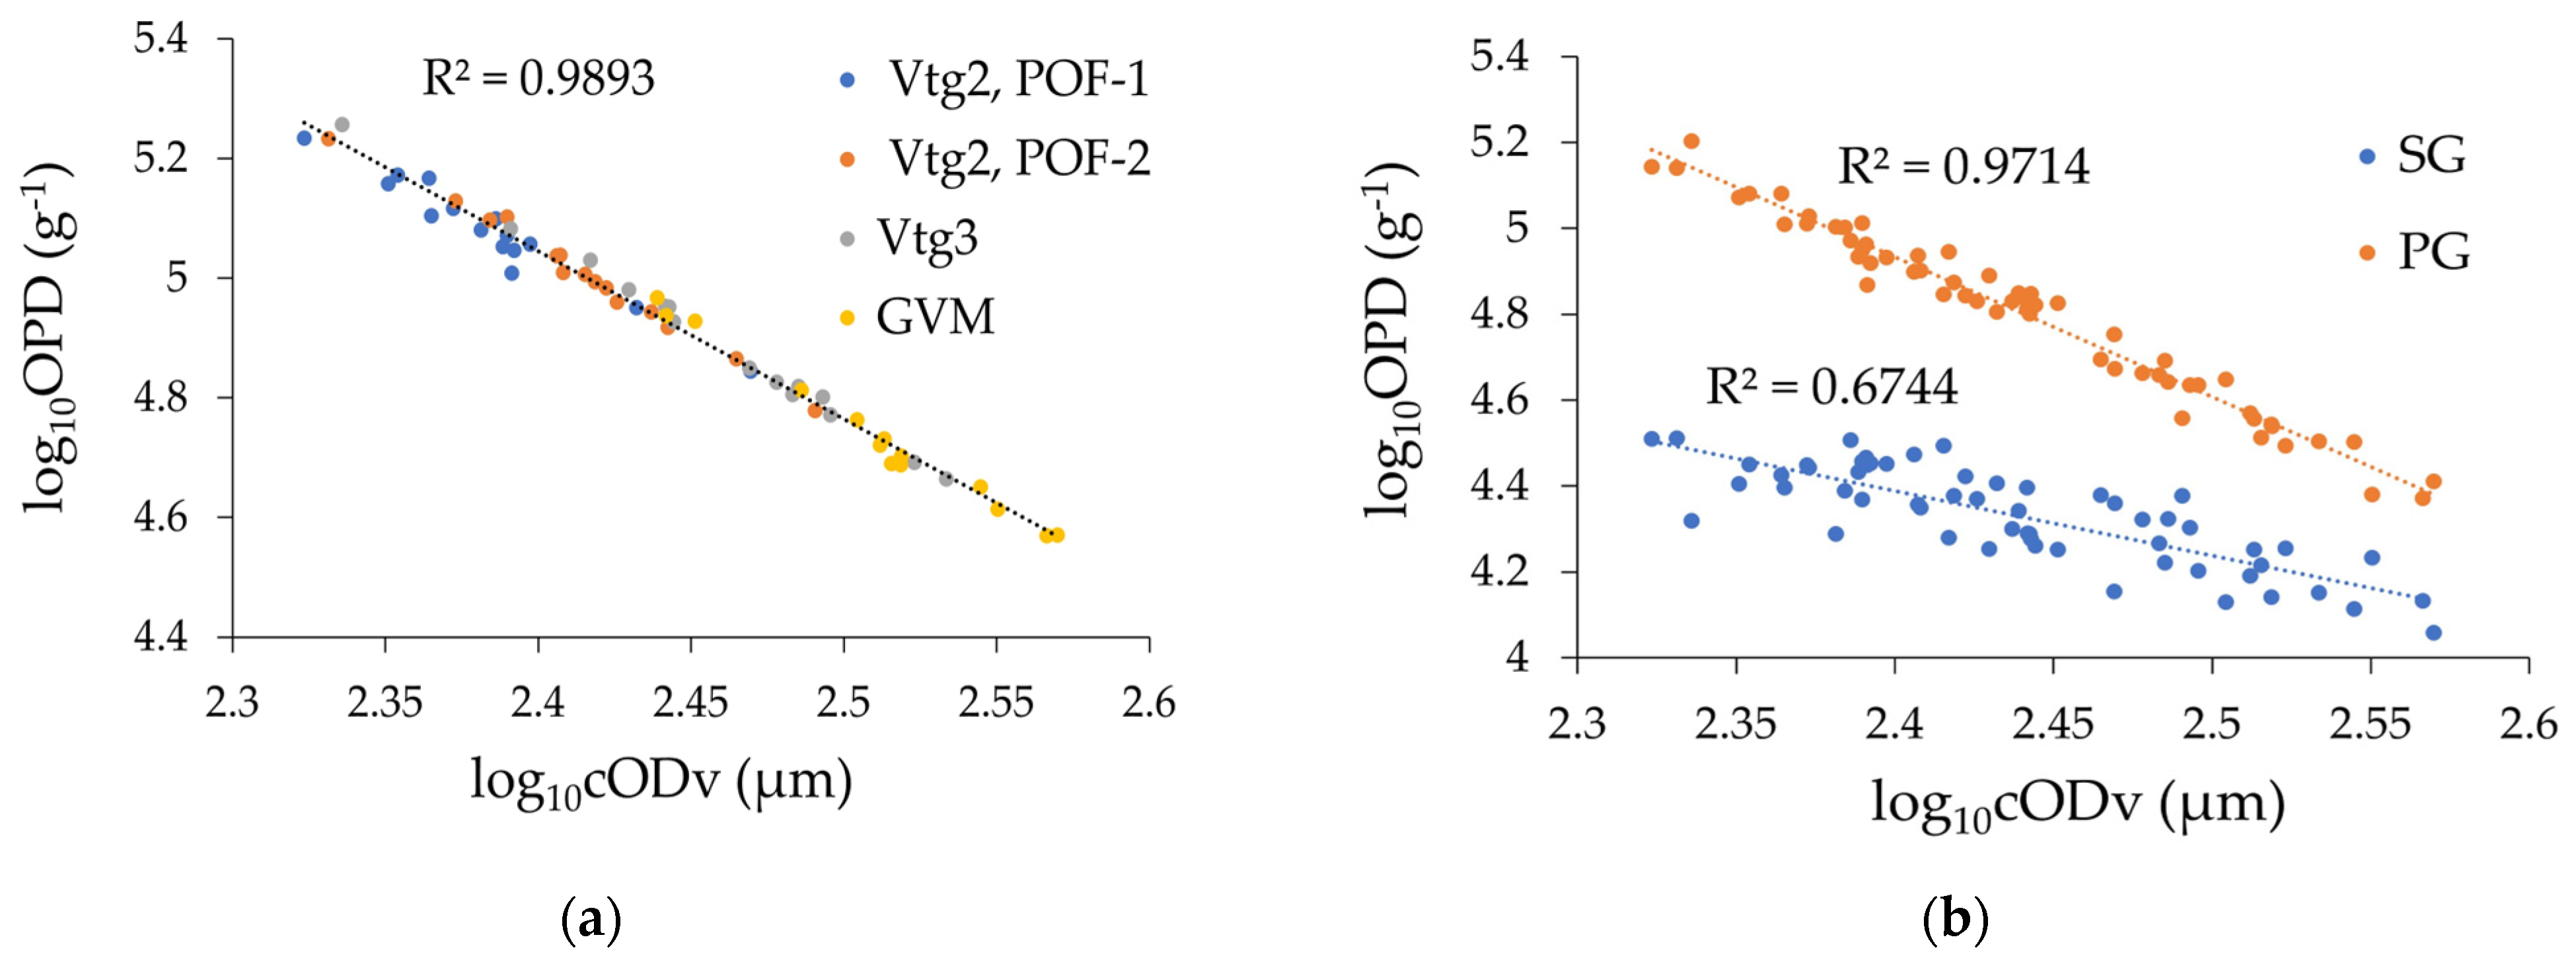
3.2.1. Ovarian Density

Ovarian density was set at the overall mean value 1.062 g cm−3 for all gonad stages as the ANOVA indicated that there was no significant difference (F(2,80) = 2.79, p = 0.067) in mean ovarian density between gonads with Vtg2, Vtg3 and GVM oocytes as the most advanced group.

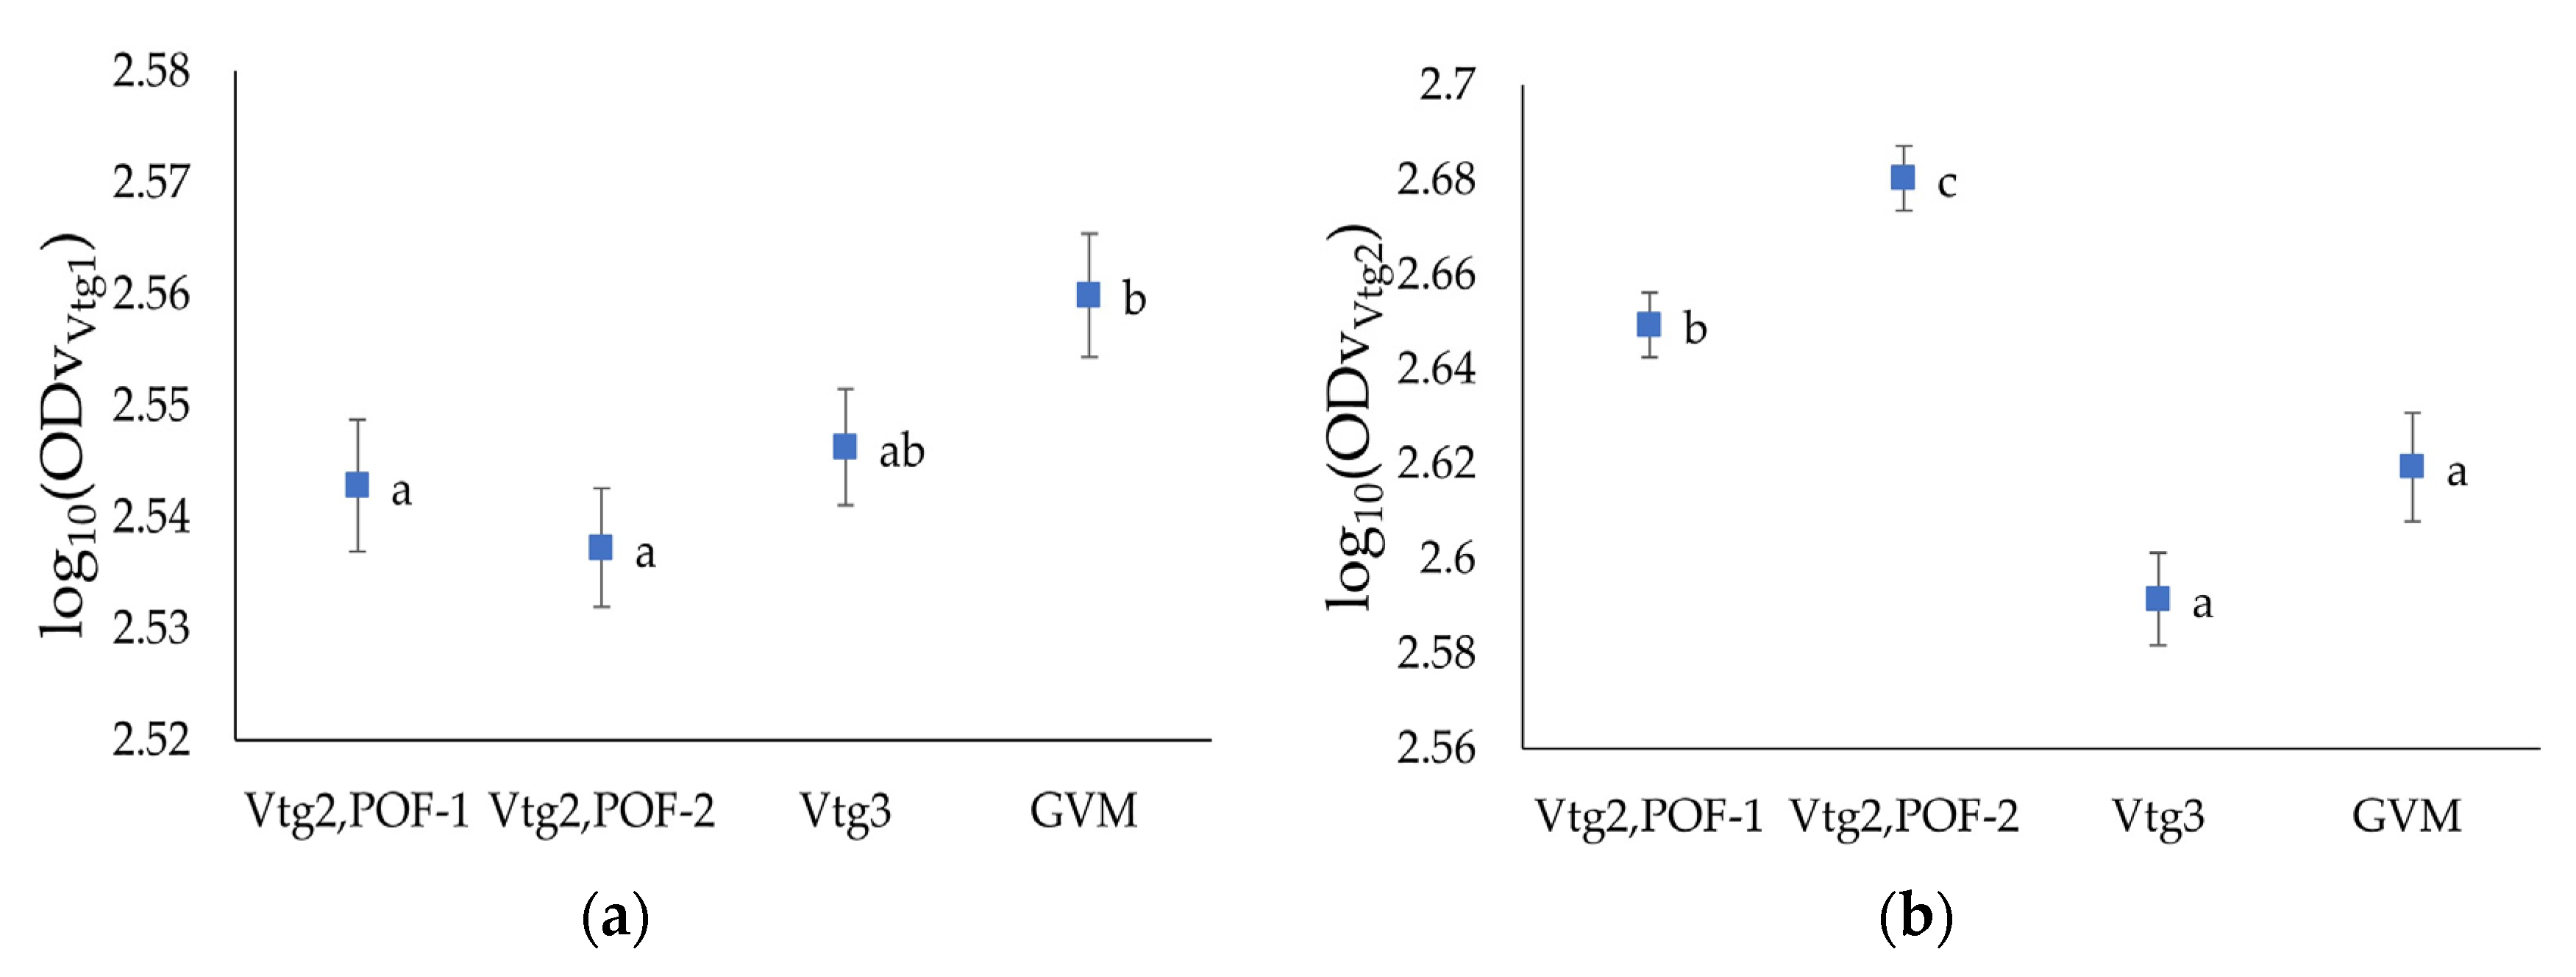
3.2.2. Volume Fraction

Volume fractions were estimated for each oocyte stage i separately. Oocytes from PG1 to Vtg1 developmental stages were present in all gonad stages while Vtg2 oocytes only in some of the Vtg3 and GVM gonads. Females that had spawned the night before sampling (Vtg2, POF-1) had the lowest oocyte volume fractions (Vvmean = 0.87) and as POFs degenerated (Vtg2, POF-2), oocytes volume fraction slightly increased (Vvmean = 0.91). Vtg3 and GVM gonad stages exhibited the highest total oocyte volume fractions (Vvmean = 0.95 and 0.96, respectively).

3.2.3. Histology Shrinkage Factor

Oocytes at different developmental stages shrank dissimilarly during histological processing (ANOVA, F(5,24) = 9.30, p < 0.001). A post hoc Student–Neuman–Keuls test revealed two homogenous groups: pre-vitellogenic oocytes (PGs and CAs) with 6.08% mean %HSF and vitellogenic oocytes (Vtg1 to GVM) with 20.08% mean %HSF. The above % HSFs were used to correct the oocyte diameters measured in histological sections.

3.3. Oocyte Sizes

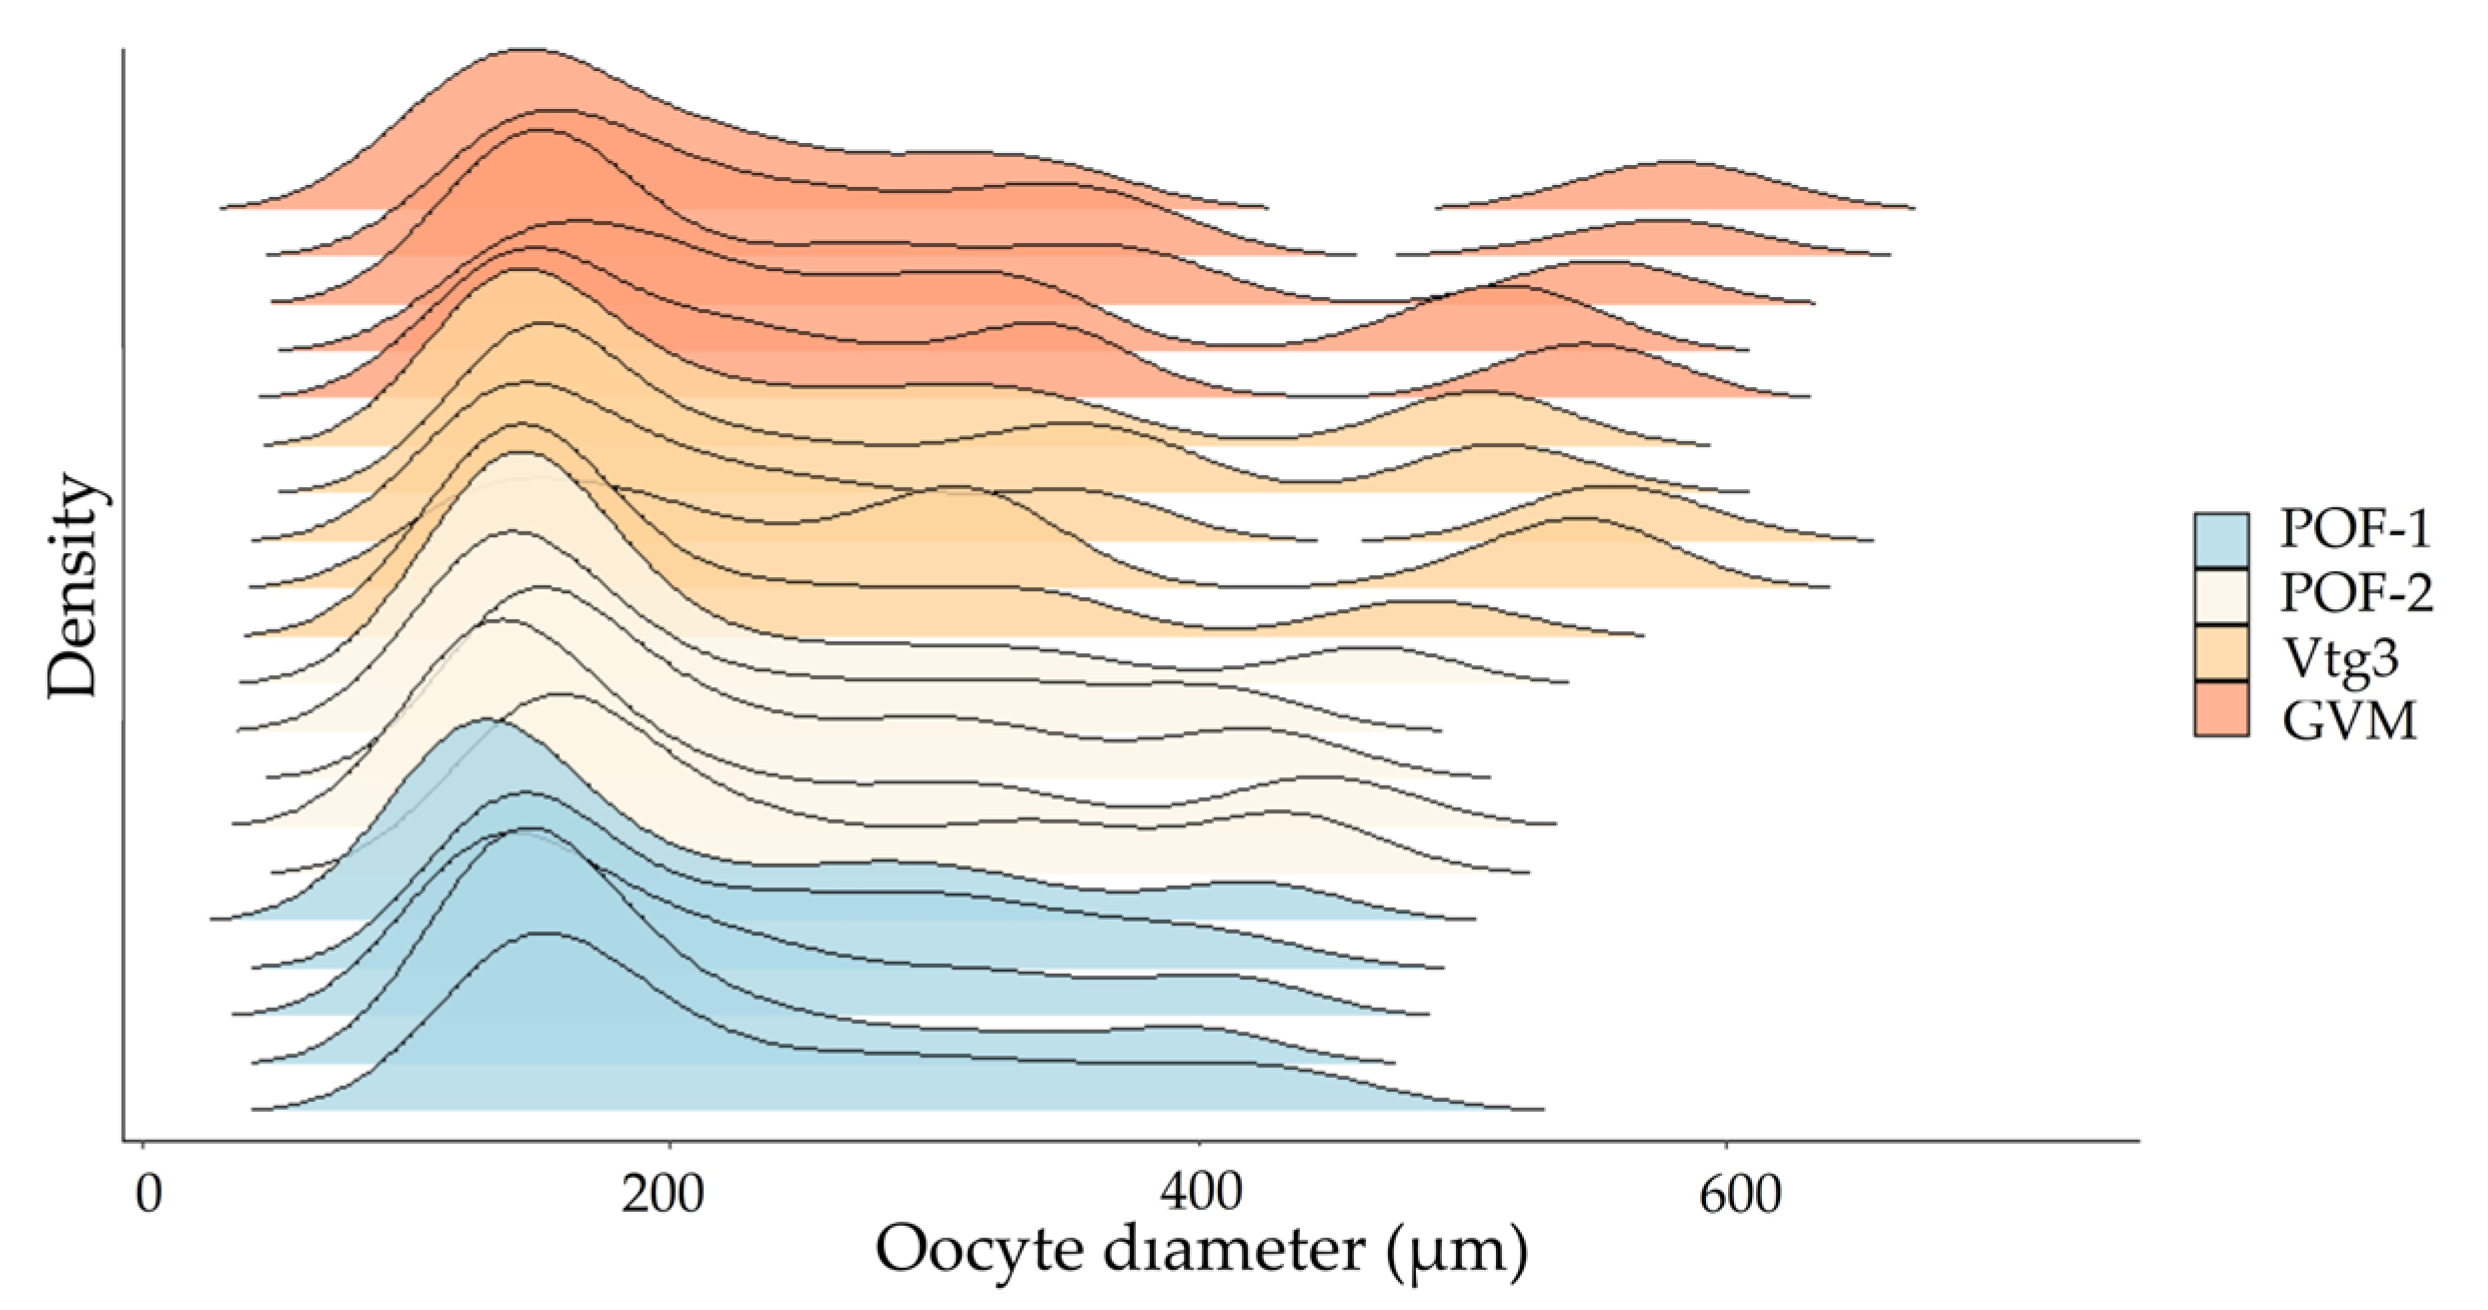
3.3.1. Oocyte Size Frequency Distributions

OSFDs (Figure 3) clearly demonstrated the size-hiatus that was established at Vtg3 gonad stage when the advanced batch fully separated in size from the adjacent population of smaller oocytes [20]. A large number of small oocytes (<200 μm) was constantly present during the ovulatory cycle in all months of the reproductive period; oocytes at 300–400 μm increased in number after the vitellogenesis completion of the advanced batch (Vtg3 gonad stage).

3.3.2. Oocyte Size Trends

The mean oocyte diameter of pre-vitellogenic oocytes (PG1 to CA2 stages) did not change across gonad stages or during the spawning season, as none of the dependent variables of the GLMs was statistically significant. Specifically, the corrected volume-based oocyte diameter (cODvi) averaged X ± SD = 133 ± 12 μm, n = 58 in PG1, 178 ± 12 μm, n = 58 in PG2, 263 ± 19 μm, n = 58 in CA1 and 360 ± 25 μm, n = 58 in CA2.
Vtg1 and Vtg2 corrected volume-based mean oocyte diameters changed significantly among the different gonad stages (Figure 4). Vtg1 oocytes gradually grew in size from the Vtg2 ovarian stages (Vtg2, POF-1 and Vtg2, POF-2 ovaries) to the GVM stage. On the other hand, the Vtg2 oocytes were larger when they constituted the most advanced group of oocytes in the gonad (Vtg2, POF-1 and Vtg2, POF-2 ovaries). Both Vtg1 and Vtg2 mean oocyte diameters increased significantly from November to March (Figure 5). Vtg3 and GVM oocytes were only present in the corresponding gonad stages; Vtg3 oocyte size remained unchanged across the spawning season (averaged X ± SD = 558 ± 40 μm) while GVM mean oocyte diameter increased through the spawning season (Figure 5). The final GLMs for the vitellogenic oocytes Vtg1, Vtg2 and GVM are presented in Table S2.

3.4. Oocyte Numbers

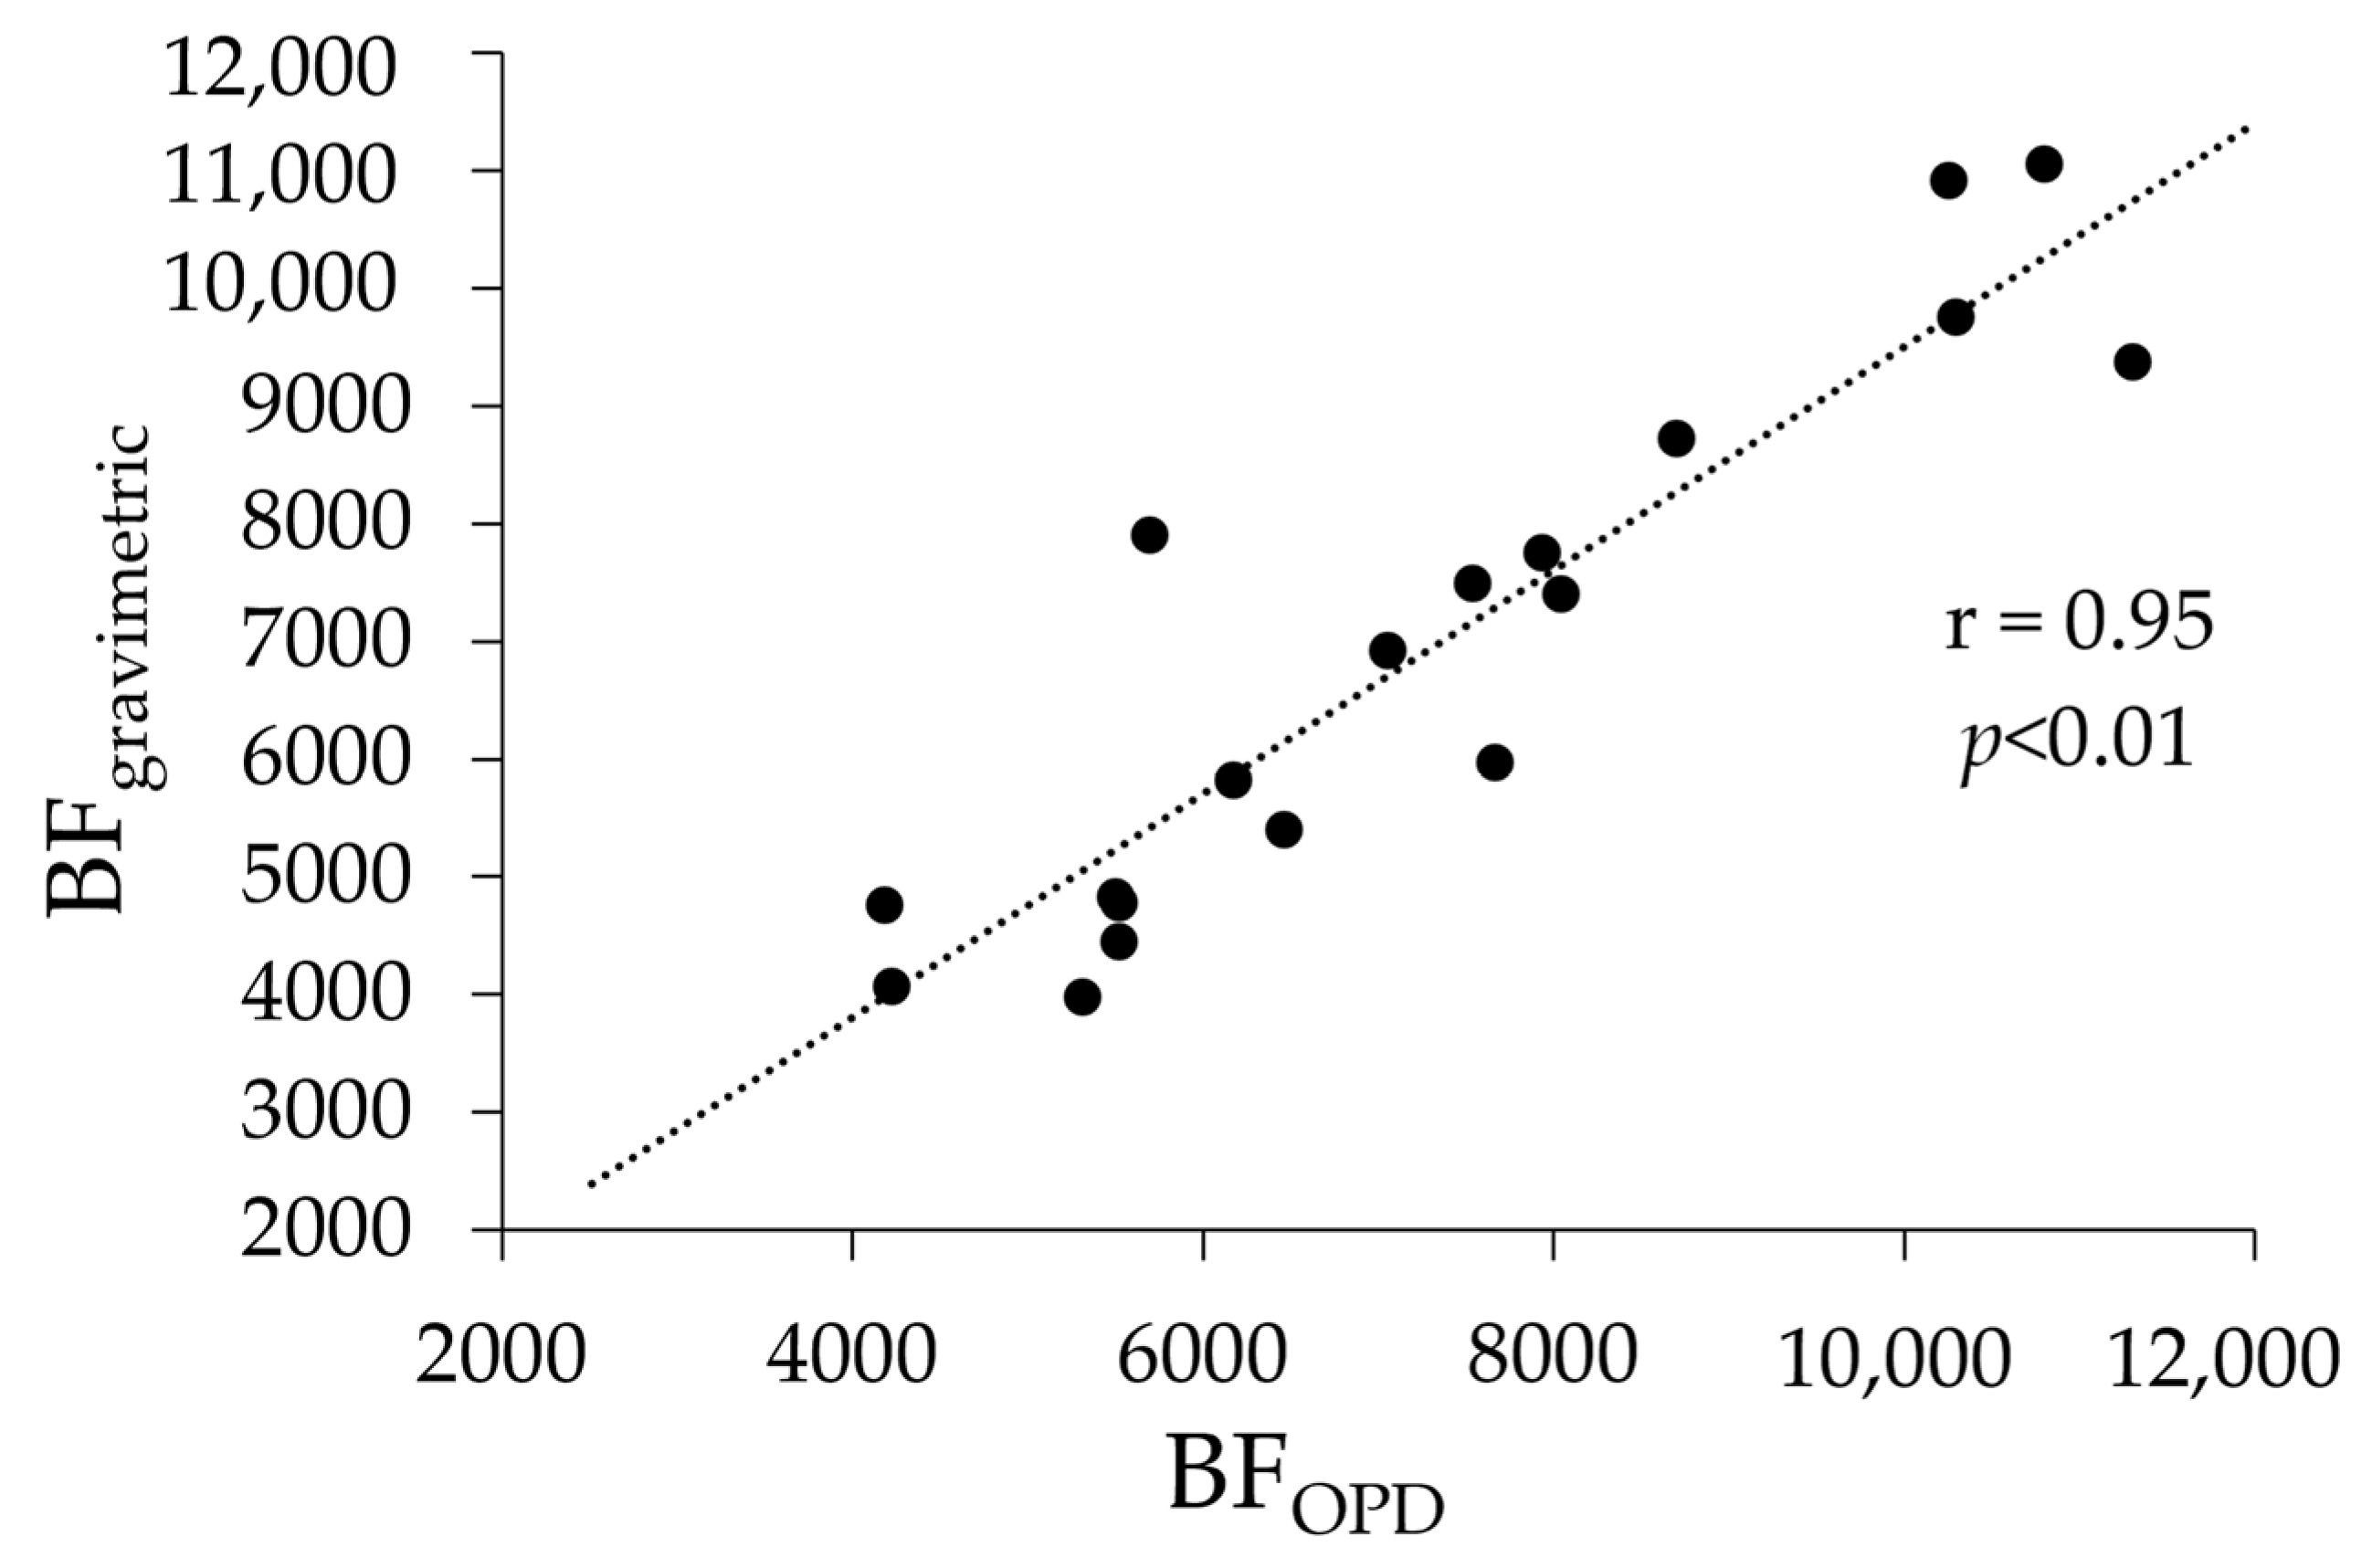
3.4.1. Oocyte Packing Density and Batch Fecundity

OPDi estimations were generally very high and the total number of oocytes per gram of ovary showed an extremely high correlation with corrected volume-based mean oocyte diameter (Figure 6a). When we examined this relationship separately for the PG oocytes and the SG oocytes, we found a higher correlation between the PG oocytes and corrected volume-based mean oocyte diameter (Figure 6b).
Batch fecundity estimations using the OPD and gravimetric methods produced similar results (paired t-test: t = 1.979, p = 0.064) and the accuracy of the OPD method was validated by the high correlation (Pearson correlation coefficient, r = 0.95) between the fecundity values (Figure 7).
Batch fecundity was then measured for 29 females using the oocyte number of the advanced batch as estimated from the OPD theory. Based on the GLM analysis, relative batch fecundity did not vary during the course of the spawning season and the mean relative batch fecundity was estimated at 391 eggs g−1. The relationship between batch fecundity and GFW was finally described as:
log10(BF) = 1.998 + 1.477 × log10(GFW), R2 = 0.667, p < 0.001

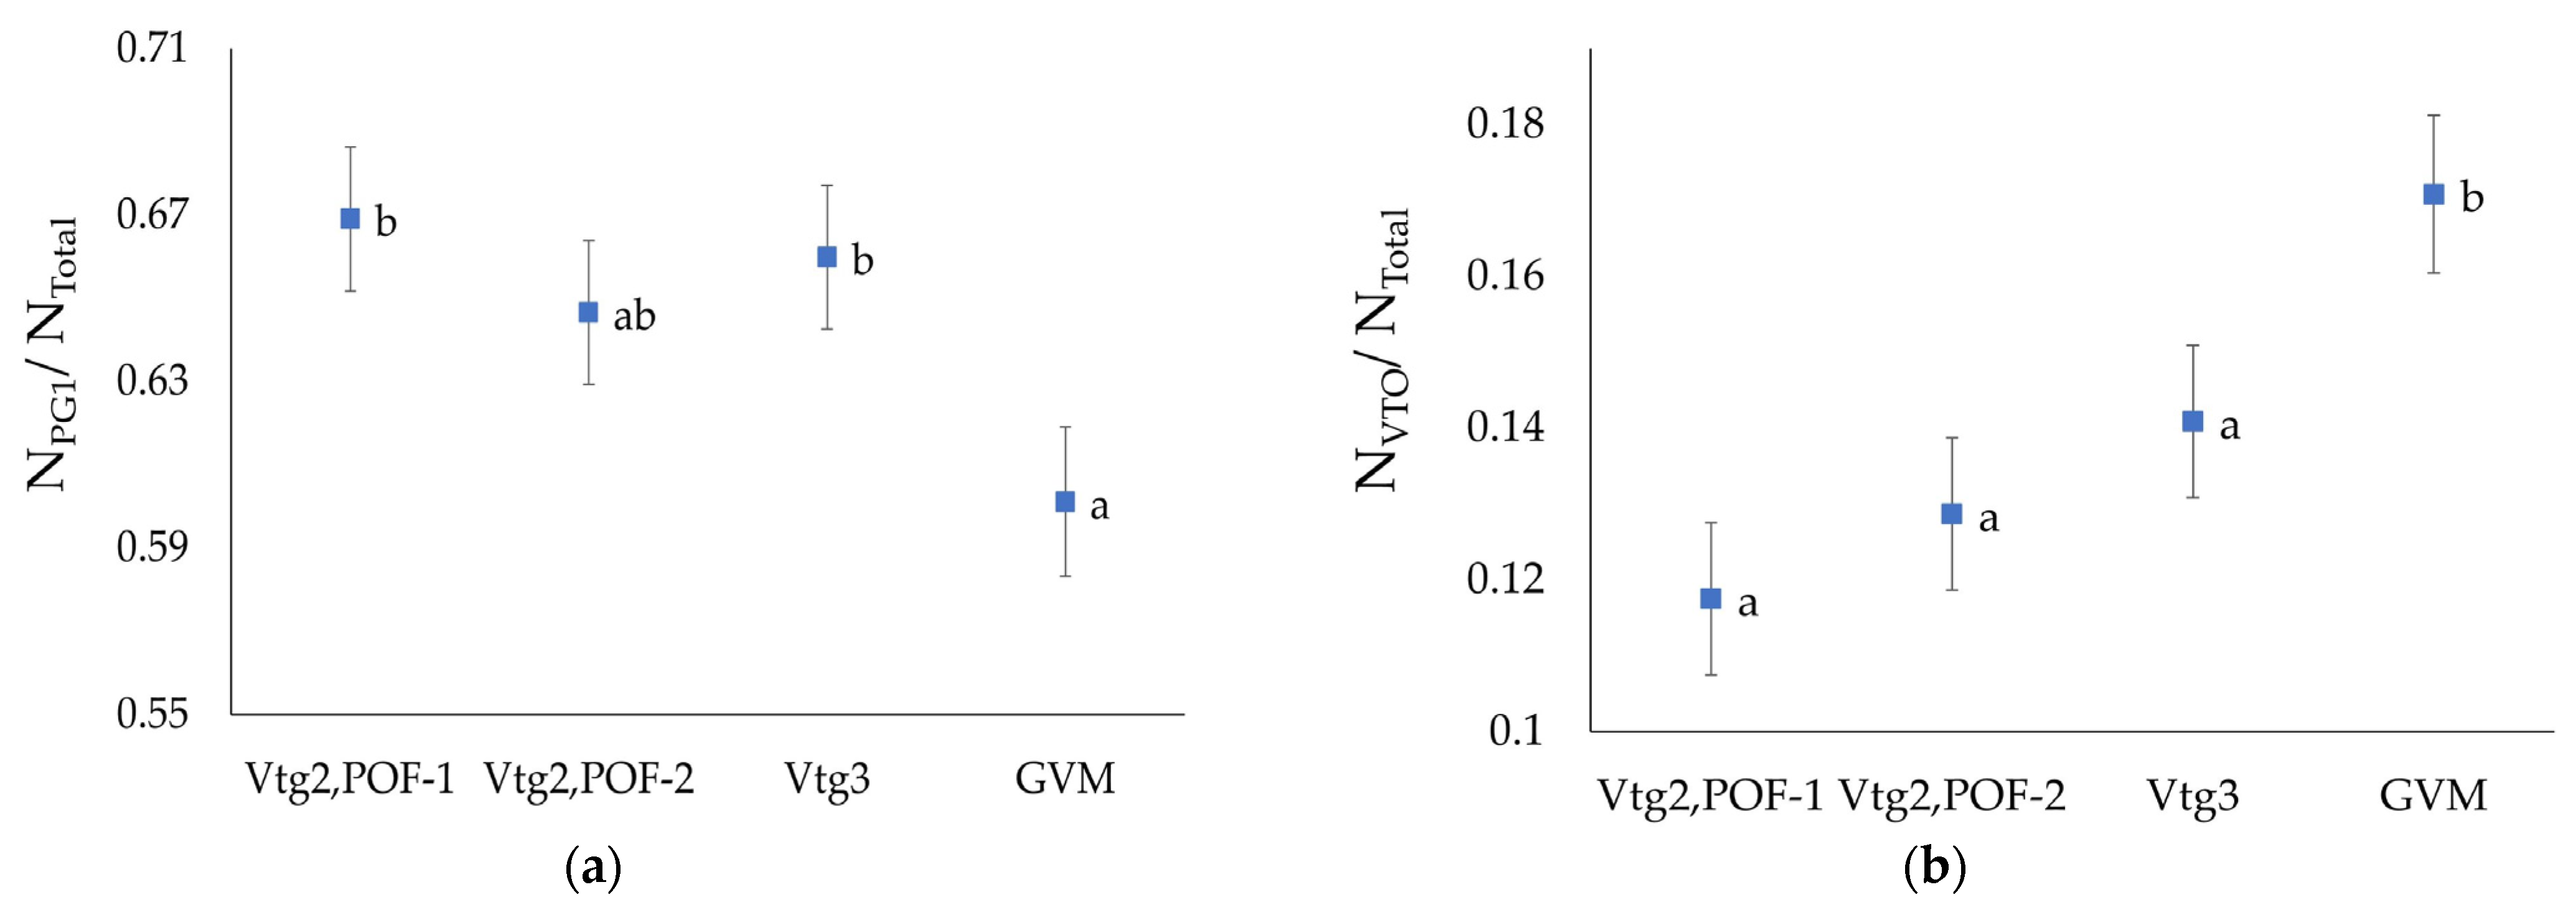
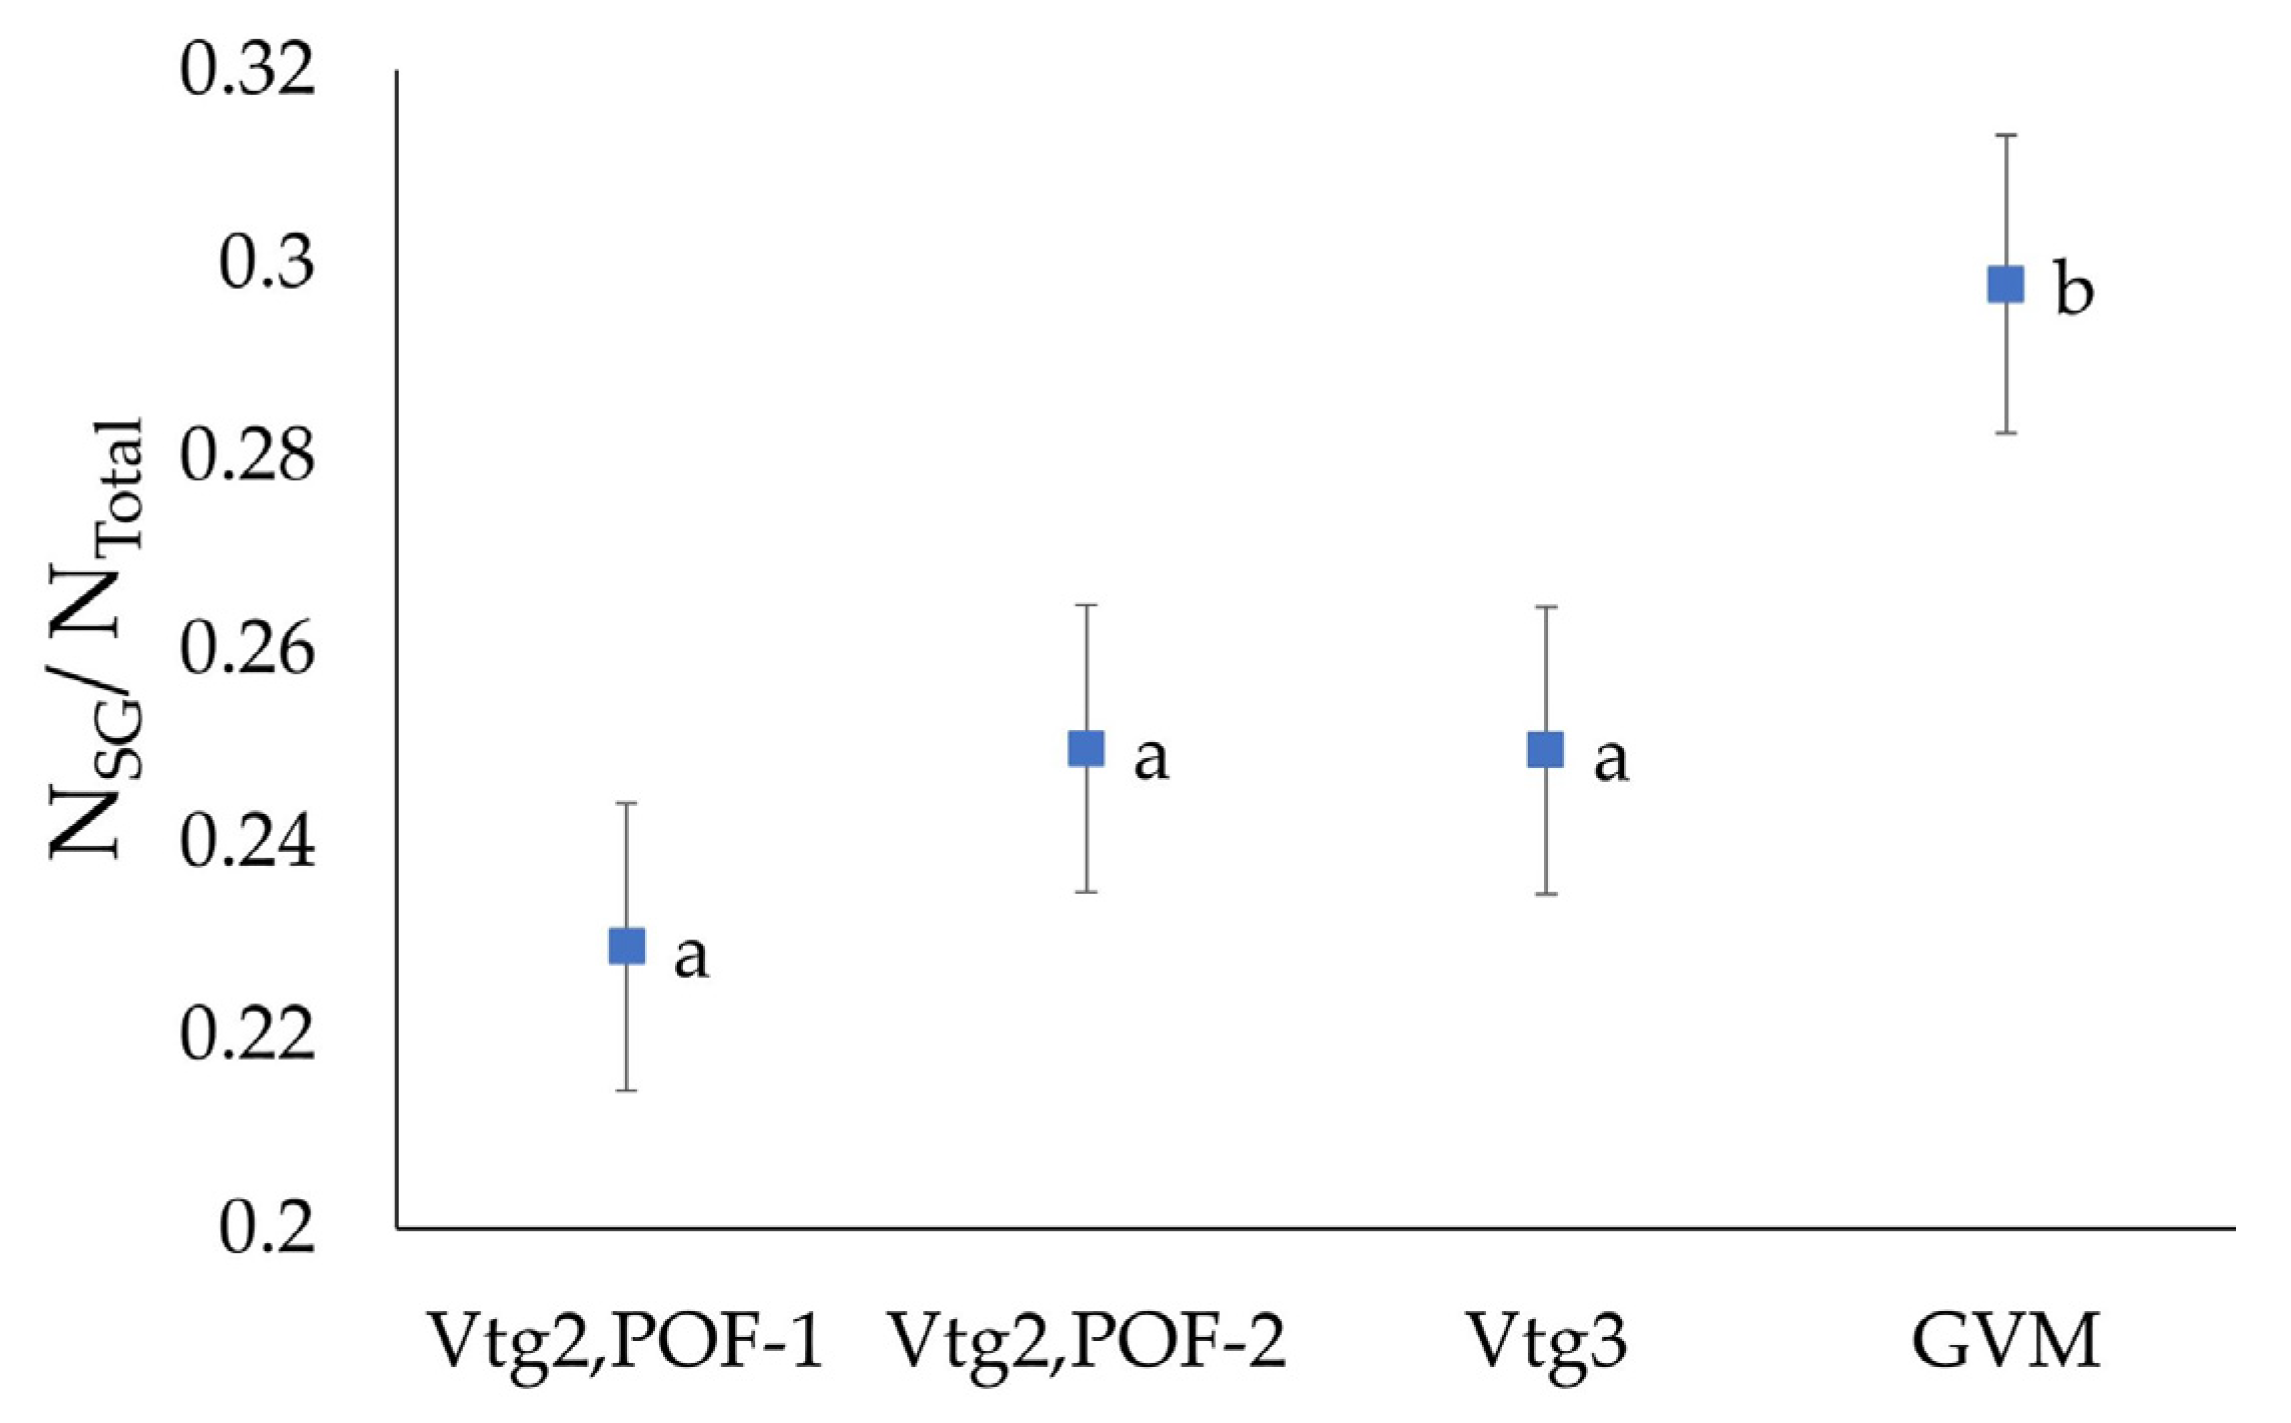
3.4.2. Oocyte Numbers Trends

The relative oocyte number of PG2, CA1 and CA2 oocytes did not change significantly across gonad stages or during the spawning season (no significant GLM model was fitted for these stages). GLM results for the PG1 oocytes showed that when the advanced batch entered the final maturation phase (GVM gonad stage) the relative number of PG1 oocytes decreased significantly (Figure 8a and Table 3).
In the final GLM for Vtg1 oocytes the term ‘Month’ had a significant effect, as the Vtg1 relative numbers significantly changed among months; they were low in November and high in March (Figure S1), a pattern probably associated with the beginning and end of the spawning season. Hence, in order to study de novo vitellogenesis we examined the relative number of all ‘vitellogenic’ oocytes (VTO = Vtg1 + Vtg2 + Vtg3 + GVM); in this case ‘Month’ was not a significant predictor. An increase in the relative number of VTOs would indicate de novo vitellogenesis, i.e., newly formed Vtg1 oocytes entering the vitellogenic oocyte clutch increasing their relative number. Indeed, GLM results showed that when the advanced batch entered the final maturation (GVM gonad stage) the relative number of vitellogenic oocytes significantly increased (Figure 8b and Table 3).
Finally, we examined the trend of the ‘secondary’ growth oocytes (SG = CA1 + CA2 + Vtg1 + Vtg2 + Vtg3+ GVM) across the ovulatory cycle. Results showed that when the advanced batch entered the final maturation phase (GVM gonad stage) the relative number of SG oocytes increased (Figure 9). After the ovulation of the advanced batch (Vtg2, POF-1 gonad stage) their relative number decreased; however, two days later (Vtg2, POF-2 gonad stage) and until the end of vitellogenesis of the subsequent batch (Vtg3 gonad stage) their relative number remained unchanged (Table 3). The final models of relative oocyte numbers for PG1, VTO and SG oocytes are presented in Table S3.

4. Discussion

In the present work we combined an array of methods and analyses to measure and quantify oocytes of different developmental stages at different phases of the European sardine’s ovulatory cycle across its spawning season. We successfully described the development process of the sequential batches in sardine’s ovaries and revealed the association between oocyte recruitment and the formation of the advanced batch. In addition, this study provided an opportunity to revisit well-studied sardine reproductive characteristics and parameters (i.e., duration of spawning season, OSFDs pattern, batch fecundity).
The year-round sampling of sardine females facilitated the determination of the exact duration of the sardine’s spawning season. Histological analysis showed that oocytes gradually entered into secondary growth phase in September–October; from November to March females had histological signs of imminent/recent spawning, and in April mass prevalence of atresia signified the cessation of sardine reproduction. This is in line with previous observations for sardine spawning period in the Greek seas and the Mediterranean Sea [33,34]. However, it should be noted that the exact onset and duration may differ inter-annually as a result of environmental factors [34]; in the central Aegean Sea spawning may be extended up to May [17].
In our study, we used the OPD method to estimate oocyte numbers of different developmental stages with high accuracy as indicated by the validation exercise. Several technical details contributed to this return. The use of resin as an embedding medium helped tissues to maintain their morphology and limited shrinkage, providing more appropriate counting fields with few empty points caused by the tissue’s discontinuities [25]. The division of primary growth and cortical alveolar oocytes into two oocyte stages each, limited mean oocyte diameter variance, the most influential factor for OPD estimates [9]. As far as we know, such a division in PG oocytes was used for the first time in routine light microscopy observations of sardine oocytes, and it was achieved due to the use of the methylene blue/azure II/basic fuchsin stain that unveiled structures not always apparent [23]. Correction for histological oocyte shrinkage was also applied, providing more realistic estimates [10,25].
The GLM analysis of oocyte size trends showed that in most cases fish size did not affect the mean oocyte diameter of the different oocyte developmental stages. It was only in the GLM for Vtg1 oocytes that the interaction of ‘Month’ and ‘GFW’ was significant. Somarakis et al. [35] have made a similar observation for European sardine in Greek waters; the authors mentioned that oocyte diameter at the completion of vitellogenesis (tertiary yolk globule and migration nucleus stages) did not change significantly with fish size. In the present study, this observation is extended to include almost all oocyte stages that were examined, from PG to GVM.
The mean oocyte diameter of pre-vitellogenic oocytes (PG1 to CA2 stages) did not change across gonad stages or during the spawning season. On the contrary, the oocyte size of most vitellogenic oocyte stages (Vtg1, Vtg2 and GVM) significantly increased from November to March. European sardine egg size has been found to increase towards the end of the spawning season [36,37]. Daoulas and Economou [36] proposed that low temperatures may delay the growth rate in relation to the differentiation rate of the oocytes, resulting in larger egg size. Indeed, in February and March, when the lowest sea surface temperature values were observed (Table S1), the mean oocyte size of Vtg1, Vtg2 and GVM was increased.
The estimated total number of oocytes per gram of ovary (OPD) was very high, probably due to the inclusion of very small PG oocytes in the estimates. The very strong relationship between log10(OPD) and log10(cODv) was analogous to the one reported for European anchovy [10] with the OPD values decreasing as cODv increased. This relationship was mainly driven by the numerous small primary growth oocytes (Figure 6) that maintained their numbers during the reproductive period. Indeed, even though PG to SG oocyte recruitment occurs throughout the spawning season in sardine (see below), Charitonidou et al. [38] showed that the meiotic activity which leads to the formation of PG oocytes continues to take place during the spawning in the Mediterranean sardine.
The GLM analysis for batch fecundity based on the advanced batch numbers showed that sardine female weight had a significant effect on batch fecundity. Somarakis et al. [33], in an analysis that included several Sardina and Sardinops stocks from around the world, showed that there was a significant linear relationship between batch fecundity and female weight, suggesting that ‘sardine batch fecundity is mainly a function of size, regardless of stock, subspecies, species or genus’.
Sardine relative batch fecundity was estimated at 391 eggs g−1; this estimate is very similar to estimates (324–369 eggs g−1) from previous studies on sardine fecundity in the Greek seas [20,33]. Relative batch fecundity did not change during the course of the spawning season, i.e., it was unaffected by changing environmental conditions. Somarakis et al. [33] also showed that Sardina pilchardus and other species of the genus Sardina and Sardinops around the world maintained their mean relative batch fecundity during the peak of the spawning season regardless of ecosystem type, implying that environmental conditions do not influence relative batch fecundity.
GLM results showed that the final maturation of the advanced batch triggered the oocyte recruitment from PG to SG phase. This process was fully completed two days after the ovulation of the advanced batch (Vtg2, POF-2 ovarian stage) and relative numbers of PG (PG1 + PG2) and SG oocytes remained stable until the next final maturation event (Table 3). In European anchovy, recruitment from PG to SG occurred in hydrated ovaries [10] while the same transition from PG to SG in Alosa macedonica was activated with the ovulation of the advanced batch [15].
The significant increase in vitellogenic oocytes relative number that coincided with the final maturation of the advanced batch was indicative of de novo vitellogenesis. At the same time (i.e., at final maturation of the advanced batch) Vtg1 average oocyte size increased significantly, indicating that, apart from de novo vitellogenesis, there was also a significant increase in yolk deposition rate in Vtg1 oocytes. These Vtg1 oocytes that started to increase in size just after the completion of vitellogenesis of the advanced batch will form the subsequent batch in the next ovulatory cycle.
Schismenou et al. [10] have also shown that in the European anchovy de novo vitellogenesis occurred in parallel with PG to SG recruitment, while Wallace and Selman [2] mentioned that in the daily spawner medaka fish (Oryzias latipes), during the recruitment of oocytes into maturation, a new clutch of oocytes was recruited into vitellogenesis. In Etrumeus golanii, Somarakis et al. [16] found that the final maturation of the advanced batch triggered the recruitment of oocytes into the subsequent batch, and after ovulation they started rapidly to grow in size to form the new advanced batch, a pattern similar to the one described here.
All the above corroborate the assumption that in multiple spawners there is a temporal association of several transition events of the oocyte growth process (recruitment of PG to SG, de novo vitellogenesis, surge of yolk deposition) with the final maturation of the advanced batch. In the case of sardine, the absence of correlation between fish size and the relative oocyte numbers implied that the recruitment pattern described here does not change with fish growth.
Finally, our GLM results showed that PG2, CA1 and CA2 oocytes maintained their relative numbers during the parallel processes of oocyte recruitment from PG to SG phase and de novo vitellogenesis. This pattern probably indicated that the transitions between PG2, CA1 and CA2 oocyte stages were fast and continuous, making it impossible to detect them.
Understanding in detail the formation process of the sequential batches in fish with indeterminate fecundity is a key aspect to fully understand reproduction at the individual level. However, environmental conditions such as temperature and food availability and parameters such as fish condition can act synergistically and affect reproductive characteristics (oocyte size, oocyte recruitment, spawning frequency, batch fecundity, duration of spawning period, etc.), thus influencing a fish population’s reproductive outcomes [18,34,36,39,40,41,42,43]. Knowledge of ovarian dynamics and how they are influenced by environmental factors is very important, not only for applying egg production methods for fisheries stock assessments and management [44,45] but also for understanding and predicting impacts of climate change. Recent studies [46,47,48] have shown that longevity, sizes-at-age and somatic condition of European sardine have been decreasing during the last two decades in the Mediterranean Sea, which has been attributed to increasing temperature and changing plankton composition. Such environmental changes related to climate change are likely to reduce the reproductive potential of sardine stocks, through for example the dependence of fecundity on fish size and the effect of temperature on egg size shown in this study. Future research should focus on holistic and comparative studies in order to fully understand the impact of the environment on individual fish fecundity and therefore on population dynamics.

5. Conclusions

The array of methods and techniques used in this study allowed for the precise quantification of ovarian dynamics (oocyte recruitment and development) during the course of the spawning period in the Mediterranean sardine. Except for oocyte sizes, the pattern of batch formation and fecundity were conservative and remained unchanged from November to March despite the seasonal changes in environmental conditions (e.g., temperature). Within an ovulatory cycle, oocyte recruitment from primary to secondary growth phase and de novo vitellogenesis were synchronized and triggered by final maturation of the advanced batch. The methodology presented in this study can be used to investigate quantitatively the oogenesis and fecundity of other species.

Supplementary Materials

The following supporting information can be downloaded at: https://www.mdpi.com/article/10.3390/fishes8050226/s1, Table S1: Date and time of sample collection of Sardina pilchardus. NT: number of fish collected, NH: number of females processed for histological analysis, TLH: mean value and range of total length of females used in histological analysis. Monthly sea surface temperature (SST, °C) was extracted from the Copernicus Marine Service (CCMS, http://marine.copernicus.eu/) averaged over the broader sampling area; Table S2: ANOVA tables of final general linear models for the corrected volume-based oocyte diameters (log10(cODVi) of stages Vtg1, Vtg2 and GVM; Table S3: ANOVA tables of the final general linear models for Ni/Ntotal of the different oocyte stages or combinations of stages (i); Figure S1: Least square means ± SE of Ni/Ntotal ratio for Vtg1 oocytes in the different months of the spawning season as estimated from the final GLM. a < b < c: homogenous groups (Dunkan test).

Author Contributions

Conceptualization, E.S. (Eudoxia Schismenou) and S.S.; formal analysis, E.S. (Eleni Servou), E.S. (Eudoxia Schismenou) and S.S.; data curation, E.S. (Eleni Servou); writing—original draft preparation, E.S. (Eleni Servou) and E.S. (Eudoxia Schismenou); writing—review and editing, S.S.; visualization, E.S. (Eleni Servou); supervision, S.S.; funding acquisition, E.S. (Eudoxia Schismenou). All authors have read and agreed to the published version of the manuscript.

Funding

This research was funded by the General Secretariat for Research and Technology (GSRT) and the Hellenic Foundation for Research and Innovation (HFRI) through the project CLIMAFISH (https://climafish.hcmr.gr/en/ (accessed on 10 March 2023))—‘CLIMAte change and FISHeries impacts on small pelagic fish: dynamic, spatially explicit models in the service of the ecosystem-based fisheries management’ within the framework of the “1st Call for the support of Postdoctoral Researchers” (project number: 338).

Institutional Review Board Statement

Not applicable.

Data Availability Statement

The data presented in this study are available on request from the corresponding authors.

Acknowledgments

The authors would like to thank Katianna Malamidou for the collection of fish samples.

Conflicts of Interest

The authors declare no conflict of interest. The funders had no role in the design of the study; in the collection, analyses, or interpretation of data; in the writing of the manuscript; or in the decision to publish the results.

References

  1. Tyler, C.R.; Sumpter, J.P. Oocyte growth and development in teleosts. Rev. Fish. Biol. Fish. 1996, 6, 287–318. [Google Scholar] [CrossRef]
  2. Wallace, R.A.; Selman, K. Cellular and Dynamic Aspect of Oocyte Growth in Teleosts. Am. Zool. 1981, 21, 325–343. [Google Scholar] [CrossRef]
  3. Guraya, S.S. Recent Advances in the Morphology, Cytochemistry, and Function of Balbiani’s Vitelline Body in Animal Oocytes. Int. Rev. Cytol. 1979, 59, 249–321. [Google Scholar]
  4. Brown-Peterson, N.J.; Wyanski, D.M.; Saborido-Rey, F.; Macewicz, B.J.; Lowerre-Barbieri, S.K. A Standardized Terminology for Describing Reproductive Development in Fishes. Mar. Coast. Fish. 2011, 3, 52–70. [Google Scholar] [CrossRef]
  5. Hunter, R.J.; Macewicz, B.J.; Chyan-huel Lo, N.; Kimbrell, C.A. Fecundity, spawning, and maturity of female Dover sole Microstomus pacificus, with an evaluation of assumptions and precision. Fish. Bull. 1992, 90, 101–128. [Google Scholar]
  6. Murua, H.; Saborido-Rey, F. Female Reproductive Strategies of Marine Fish Species of the North Atlantic. J. Northwest Atl. Fish. Sci. 2003, 33, 23–31. [Google Scholar] [CrossRef]
  7. Ganias, K.; Lowerre-Barbieri, S. Oocyte recruitment and fecundity type in fishes: Refining terms to reflect underlying processes and drivers. Fish Fish. 2018, 19, 562–572. [Google Scholar] [CrossRef]
  8. Korta, M.; Murua, H.; Kurita, Y.; Kjesbu, O.S. How are the oocytes recruited in an indeterminate fish? Applications of stereological techniques along with advanced packing density theory on European hake (Merluccius merluccius L.). Fish. Res. 2010, 104, 56–63. [Google Scholar] [CrossRef]
  9. Kurita, Y.; Kjesbu, O.S. Fecundity estimation by oocyte packing density formulae in determinate and indeterminate spawners: Theoretical considerations and applications. J. Sea Res. 2009, 61, 188–196. [Google Scholar] [CrossRef]
  10. Schismenou, E.; Somarakis, S.; Thorsen, A.; Kjesbu, O.S. Dynamics of de novo vitellogenesis in fish with indeterminate fecundity: An application of oocyte packing density theory to European anchovy, Engraulis encrasicolus. Mar. Biol. 2012, 159, 757–768. [Google Scholar] [CrossRef]
  11. Serrat, A.; Saborido-Rey, F.; Garcia-Fernandez, C.; Muñoz, M.; Lloret, J.; Thorsen, A.; Kjesbu, O.S. New insights in oocyte dynamics shed light on the complexities associated with fish reproductive strategies. Sci. Rep. 2019, 9, 18411. [Google Scholar] [CrossRef] [PubMed]
  12. Dos Santos Schmidt, T.C.; Thorsen, A.; Slotte, A.; Nøttestad, L.; Kjesbu, O.S. First thorough assessment of de novo oocyte recruitment in a teleost serial spawner, the Northeast Atlantic mackerel (Scomber scombrus) case. Sci. Rep. 2021, 11, 21795. [Google Scholar] [CrossRef]
  13. Thorsen, A.; Kjesbu, O.S. A rapid method for estimation of oocyte size and potential fecundity in Atlantic cod using a computer-aided particle analysis system. J. Sea Res. 2001, 46, 295–308. [Google Scholar] [CrossRef]
  14. Mouchlianitis, F.A.; Belo, A.F.; Vieira, A.R.; Quintella, B.R.; Almeida, P.R.; Ganias, K. Primary and secondary oocyte growth dynamics in anadromous semelparous Allis shad Alosa alosa. J. Fish. Biol. 2019, 95, 1447–1456. [Google Scholar] [CrossRef]
  15. Mouchlianitis, F.A.; Minos, G.; Ganias, K. Timing of oocyte recruitment within the ovulatory cycle of Macedonian shad, Alosa macedonica, a batch spawning fish with indeterminate fecundity. Theriogenology 2020, 146, 31–38. [Google Scholar] [CrossRef]
  16. Somarakis, S.; Giannoulaki, M.; Markakis, K.; Tsiaras, K.; Schismenou, E.; Peristeraki, P. Ovarian dynamics, batch fecundity and spawning phenology of the Lessepsian migrant Etrumeus golanii DiBattista, Randall & Bowen, 2012 (Clupeidae: Dussumieriinae). Mediterr. Mar. Sci. 2021, 22, 466–479. [Google Scholar] [CrossRef]
  17. Ganias, K.; Somarakis, S.; Koutsikopoulos, C.; Machias, A. Factors affecting the spawning period of sardine in two highly oligotrophic Seas. Mar. Biol. 2007, 151, 1559–1569. [Google Scholar] [CrossRef]
  18. Somarakis, S.; Tsoukali, S.; Giannoulaki, M.; Schismenou, E.; Nikolioudakis, N. Spawning stock, egg production and larval survival in relation to small pelagic fish recruitment. Mar. Ecol. Prog. Ser. 2019, 617, 113–139. [Google Scholar] [CrossRef]
  19. Ganias, K.; Somarakis, S.; Machias, A.; Theodorou, A.J. Evaluation of spawning frequency in a Mediterranean sardine population (Sardina pilchardus sardina). Mar. Biol. 2003, 142, 1169–1179. [Google Scholar] [CrossRef]
  20. Ganias, K.; Somarakis, S.; Machias, A.; Theodorou, A. Pattern of oocyte development and batch fecundity in the Mediterranean sardine. Fish. Res. 2004, 67, 13–23. [Google Scholar] [CrossRef]
  21. Bennett, H.S.; Wyrick, A.D.; Lee, S.W.; McNeil, H. Science and art in preparing tissues embebbed in plastic for light microscopy, with special reference to glycol methacrylate, glass knives and simple stains. Stain. Technol. 1976, 51, 71–94. [Google Scholar] [CrossRef] [PubMed]
  22. Pèrez, N.; Figueiredo, I.; Lo, N.C.H. Batch fecundity of Sardina pilchardus (Walb.) off the Atlantic Iberian coast. Bol. Ins. Esp. Oceanogr. 1992, 8, 155–162. [Google Scholar]
  23. Charitonidou, K.; Panteris, E.; Ganias, K. Balbiani body formation and cytoplasmic zonation during early oocyte development in two Clupeiform fishes. J. Fish. Biol. 2022, 100, 1223–1232. [Google Scholar] [CrossRef]
  24. Hunter, R.J.; Macewicz, B.J. Measurement of Spawning Frequency in Multiple Spawning Fishes. NOAA Tech. Rep. 1985, 36, 79–94. [Google Scholar]
  25. Saber, S.; Macías, D.; Ortiz de Urbina, J.; Kjesbu, O.S. Stereological comparison of oocyte recruitment and batch fecundity estimates from paraffin and resin sections using spawning albacore (Thunnus alalunga) ovaries as a case study. J. Sea Res. 2015, 95, 226–238. [Google Scholar] [CrossRef]
  26. Howard, V.; Reed, M.G. Unbiased Stereology: Three-Dimensional Measurement in Microscopy, 1st ed.; BIOS Scientific Publishers: Oxford, UK, 1998. [Google Scholar]
  27. ImageJ. Available online: https://imagej.nih.gov/ij/ (accessed on 27 July 2021).
  28. ObjectJ. Available online: https://sils.fnwi.uva.nl/bcb/objectj/ (accessed on 27 July 2021).
  29. Emerson, L.S.; Greer, M.; Witthames, P.R. A stereological method for estimating fish fecundity. J. Fish. Biol. 1990, 36, 721–730. [Google Scholar] [CrossRef]
  30. Hunter, R.J.; Lo, N.C.H.; Leong, R.J.H. Batch Fecundity in Multiple Spawning Fishes. NOAA Tech. Rep. 1985, 36, 67–77. [Google Scholar]
  31. Gkanasos, A.; Somarakis, S.; Tsiaras, K.; Kleftogiannis, D.; Giannoulaki, M.; Schismenou, E.; Sofianos, S.; Triantafyllou, G. Development, application and evaluation of a 1-D full life cycle anchovy and sardine model for the North Aegean Sea (Eastern Mediterranean). PLoS ONE 2019, 14, e0219671. [Google Scholar] [CrossRef]
  32. Geladakis, G.; Nikolioudakis, N.; Koumoundouros, G.; Somarakis, S. Morphometric discrimination of pelagic fish stocks challenged by variation in body condition. ICES J. Mar. Sci. 2018, 75, 711–718. [Google Scholar] [CrossRef]
  33. Somarakis, S.; Ganias, K.; Siapatis, A.; Koutsikopoulos, C.; Machias, A.; Papaconstantinou, C. Spawning habitat and daily egg production of sardine (Sardina pilchardus) in the eastern Mediterranean. Fish Oceanogr. 2006, 15, 281–292. [Google Scholar] [CrossRef]
  34. Tsikliras, A.C.; Antonopoulou, E.; Stergiou, K.I. Spawning period of Mediterranean marine fishes. Rev. Fish Biol. Fish. 2010, 20, 499–538. [Google Scholar] [CrossRef]
  35. Somarakis, S.; Ganias, K.; Tserpes, G.; Koutsikopoulos, C. Ovarian allometry and the use of the gonosomatic index: A case study in the Mediterranean sardine, Sardina pilchardus. Mar. Biol. 2004, 146, 181–189. [Google Scholar] [CrossRef]
  36. Daoulas, C.; Economou, A.N. Seasonal variation of egg size in the sardine, Sardina pilchardus Walb., of the Saronikos Gulf: Causes and a probable explanation. J. Fish. Biol. 1986, 28, 449–457. [Google Scholar] [CrossRef]
  37. Mandić, M.; Regner, S. Variation in fish egg size in several pelagic fish species. Stud. Mar. 2014, 17, 31–46. [Google Scholar]
  38. Charitonidou, K.; Panteris, E.; Ganias, K. Oogonial proliferation and early oocyte dynamics during the reproductive cycle of two Clupeiform fish species. J. Fish. Biol. 2022, 102, 44–52. [Google Scholar] [CrossRef] [PubMed]
  39. Charitonidou, K.; Kjesbu, O.S.; Nunes, C.; Angélico, M.M.; Dominguez-Petit, R.; Garabana, D.; Ganias, K. Linking the dynamic organization of the ovary with spawning dynamics in pelagic fishes. Mar. Biol. 2022, 169, 47. [Google Scholar] [CrossRef]
  40. Ganias, K.; Lowerre-Barbieri, S.K.; Cooper, W. Understanding the determinate-indeterminate fecundity dichotomy in fish populations using a temperature dependent oocyte growth model. J. Sea Res. 2015, 96, 1–10. [Google Scholar] [CrossRef]
  41. Dos Santos Schmidt, T.C.; Slotte, A.; Kennedy, J.; Sundby, S.; Johannessen, A.; Óskarsson, G.J.; Kurita, Y.; Kjesbu, O.S. Oogenesis and reproductive investment of Atlantic herring are functions of not only present but long-ago environmental influences as well. Proc. Natl. Acad. Sci. USA 2017, 114, 2634–2639. [Google Scholar] [CrossRef]
  42. Ganias, K. Linking sardine spawning dynamics to environmental variability. Estuar. Coast. Shelf Sci. 2009, 84, 402–408. [Google Scholar] [CrossRef]
  43. Thomé, R.G.; Domingos, F.F.T.; Santos, H.B.; Martinelli, P.M.; Sato, Y.; Rizzo, E.; Bazzoli, N. Apoptosis, cell proliferation and vitellogenesis during the folliculogenesis and follicular growth in teleost fish. Tissue Cell. 2012, 44, 54–62. [Google Scholar] [CrossRef]
  44. Bernal, M.; Somarakis, S.; Witthames, P.R.; van Damme, C.J.G.; Uriarte, A.; Lo, N.C.H.; Dickey-Collas, M. Egg production methods in marine fisheries: An introduction. Fish. Res. 2012, 117, 1–5. [Google Scholar] [CrossRef]
  45. Dickey-Collas, M.; Somarakis, S.; Witthames, P.R.; van Damme, C.J.G.; Uriarte, A.; Lo, N.C.H.; Bernal, M. Where do egg production methods for estimating fish biomass go from here? Fish. Res. 2012, 117, 6–11. [Google Scholar] [CrossRef]
  46. Saraux, C.; Van Beveren, E.; Brosset, P.; Queiros, Q.; Bourdeix, J.H.; Dutto, G.; Gasset, E.; Jac, C.; Bonhommeau, S.; Fromentin, J.M. Small pelagic fish dynamics: A review of mechanisms in the Gulf of Lions. Deep Sea Res. Part. II Top. Stud. Oceanogr. 2019, 159, 52–61. [Google Scholar] [CrossRef]
  47. Brosset, P.; Fromentin, J.-M.; Van Beveren, E.; Lloret, J.; Marques, V.; Basilone, G.; Bonanno, A.; Carpi, P.; Donato, F.; Čikeš Keč, V.; et al. Spatio-temporal patterns and environmental controls of small pelagic fish body condition from contrasted Mediterranean areas. Prog. Oceanogr. 2017, 151, 149–162. [Google Scholar] [CrossRef]
  48. Albo-Puigserver, M.; Pennino, M.G.; Bellido, J.M.; Colmenero, A.I.; Giráldez, A.; Hidalgo, M.; Gabriel Ramírez, J.; Steenbeek, J.; Torres, P.; Cousido-Rocha, M.; et al. Changes in life history traits of small pelagic fish in the western Mediterranean sea. Front. Mar. Sci. 2021, 8, 570354. [Google Scholar] [CrossRef]
Figure 1. Map of the North Aegean Sea showing the location of purse seine fishing operations and Sardina pilchardus sample collections. Numbers correspond to the samples presented in Table S1.
Fishes 08 00226 g001
Figure 2. Oocytes of Sardina pilchardus at different developmental stages: (a) early (PG1) and late (PG2) primary growth oocytes; the perinuclear ring of PG2 oocytes is demonstrated (arrows); (b) early cortical alveoli oocyte (CA1); (c) late cortical alveoli oocyte (CA2); (d) primary vitellogenic oocyte (Vtg1); (e) secondary vitellogenic oocyte (Vtg2); (f) tertiary vitellogenic oocyte (Vtg3); (g) germinal vesicle migration oocyte (GVM); (h) hydrated oocyte (HYD).
Fishes 08 00226 g002
Figure 3. Smoothed oocyte size frequency distributions of 20 selected females at the different gonad stages of the ovulation cycle. They are presented in order of month (November–March) of the spawning season (nested inside gonad stage). Density: number of oocytes.
Fishes 08 00226 g003
Figure 4. Least-square means (±SE) of corrected volume-based oocyte diameters (cODv) of: (a) Vtg1; (b) Vtg2 oocytes in the different gonad stages of the ovulation cycle. a < b < c: homogeneous groups (Duncan test).
Fishes 08 00226 g004
Figure 5. Least-square means (±SE) of corrected volume-based oocyte diameters (cODv) of: (a) Vtg1; (b) Vtg2; (c) GVM oocytes in the different months of the spawning season. a < b < c: homogeneous groups (Duncan test).
Fishes 08 00226 g005
Figure 6. (a) Oocyte packing density (OPD) against corrected volume-based mean oocyte diameter (cODv) after logarithmic transformations. Different colors denote different gonad stages; (b) The same relationship separately for primary (PG) and secondary growth (SG) oocytes.
Fishes 08 00226 g006
Figure 7. Validation of the OPD method. Comparison of batch fecundity (BF) estimates (number of oocytes in the advanced oocyte stage) for Vtg3 and GVM gonads (NVtg3 and NGVM respectively) between the OPD method and the gravimetric method, for the same gonads (N = 19).
Fishes 08 00226 g007
Figure 8. Least square means ± SE of Ni/Ntotal ratio for (a) PG1 oocytes; and (b) VTO oocytes in the different gonad stages. a < b: homogenous groups (Duncan test). VTO = Vtg1 + Vtg2 + Vtg3 + GVM.
Fishes 08 00226 g008
Figure 9. Least square means ± SE of Ni/Ntotal ratio for SG oocytes in the different gonad stages. a < b: homogenous groups (Duncan test).
Fishes 08 00226 g009
Table 1. Number of ovaries used in the oocyte packing density (OPD) calculations per month of the spawning season and per gonad stage based on the developmental stage of the most advanced oocytes and the presence/age of postovulatory follicles (POFs). WM: numbers of ovaries used in whole-mount oocyte size measurements. Corresponding ovarian phases based on Brown-Peterson et al. [4] are also included.
Ovarian PhaseGonad StageOocyte StageMonthOPDWM
Fishes 08 00226 i001Spawning capableSecondary with POF-1,(Vtg2, POF-1)
Spawned the previous night
Vtg2November32
December31
January31
February31
March31
Fishes 08 00226 i002Spawning capableSecondary with POF-2,(Vtg2, POF-2)
Spawned two days before sampling
Vtg2November31
December31
January31
February31
March31
Fishes 08 00226 i003Spawning capableTertiary, (Vtg3)Vtg3November31
December31
January31
February31
March31
Fishes 08 00226 i004Spawning capable
(Active spawning subphase)
Germinal vesicle migration, (GVM)GVMNovember31
December21
January31
February31
March31
Total 5921
Table 2. Breakdown of female monthly samples into ovarian phases based on the histological analysis (most advanced oocyte stage, prevalence of atresia, presence of POFs) and following Brown-Peterson et al.’s [4] description of ovarian phases. IR: percentage of immature or regenerating females, D: percentage of developing females, SC: percentage of spawning capable females, AS: percentage of females at the actively spawning subphase, R: percentage of regressing females, and N: total number of histologically analyzed females.
YearMonthOvarian Phase
IRDSC (+AS)RΝ
2018November-40.3%43.0% (+16.7%)-72
2018December-57.5%39.7% (+2.7%)-73
2019January-31.9%58.3% (+9.7%)-72
2019February-24.6%43.1% (+32.3%)-65
2019March-26.9%64.2% (+8.9%)-67
2019April6.8%16.9%27.1%49.2%59
2019May84.4%0.44%-11.1%45
2019June100%---62
2019July100%---64
2019August100%---64
2019September69.4%30.6%--62
2019October10.8%80%7.7%1.5%65
Table 3. Least square means ± SE of Νitotal ratios for PG1, PG2, VTO and SG oocytes per gonad stage as estimated from the GLM models. SG = CA1 + CA2 + Vtg1 + Vtg2 + Vtg3 + GVM.
Gonad StagePG1/Total (±SE)PG2/Total (±SE)(VTO)/Total (±SE)(SG)/Total (±SE)
Vtg2, POF-10.669 (±0.017)0.102 (±0.009)0.117 (±0.01)0.229 (±0.015)
Vtg2, POF-20.646 (±0.017)0.104 (±0.009)0.129 (±0.01)0.25 (±0.015)
Vtg30.66 (±0.017)0.091 (±0.009)0.141 (±0.01)0.25 (±0.015)
GVM0.601 (±0.018)0.101 (±0.01)0.171 (±0.01)0.298 (±0.015)
Disclaimer/Publisher’s Note: The statements, opinions and data contained in all publications are solely those of the individual author(s) and contributor(s) and not of MDPI and/or the editor(s). MDPI and/or the editor(s) disclaim responsibility for any injury to people or property resulting from any ideas, methods, instructions or products referred to in the content.

