Article

Age and Growth of European Sardine (Sardina pilchardus) in the Central Mediterranean Sea: Implication for Stock Assessment

1
Consiglio Nazionale delle Ricerche (CNR)—Istituto per lo Studio Degli Impatti Antropici e Sostenibilità in Ambiente Marino (IAS) S.S. di Capo Granitola—Campobello di Mazara (TP), 91021 Campobello di Mazara, Italy
2
Consiglio Nazionale delle Ricerche (CNR)—Istituto di Scienze Marine (ISMAR) S.S. di Napoli, 80133 Napoli, Italy
*
Authors to whom correspondence should be addressed.
Fishes 2023, 8(4), 202; https://doi.org/10.3390/fishes8040202
Submission received: 9 March 2023 / Revised: 4 April 2023 / Accepted: 10 April 2023 / Published: 13 April 2023

Abstract

:
Understanding the drivers of fish growth is essential for predicting productivity, stability, and resilience of exploited populations. For the European sardine (Sardina pilchardus) in the Strait of Sicily (Central Mediterranean Sea, GSA16), growth parameters or length at age estimates have never been published before. To fill this data gap, the length and age as well as the von Bertalanffy parameters (the most widely used growth model) were estimated. Data from landing samples during the period 2009–2019 were collected by two methods (purse seine and mid-water pelagic trawl). Temporal trends in average length at age, as well as an overall age-length key were obtained and compared with other areas across the geographical distribution range of sardine in the Mediterranean Sea. The observed age range was 0–3 years with most of the individuals belonging to Age 1 (52%) and Age 2 (43%). The mean length at age, for the entire study period, was 11.7 (±0.08) cm for Age 0; 13.4 (±0.09) cm for Age 1; 15 (±0.1) cm for Age 2; and 16.6 (±0.11) cm for Age 3. Furthermore, during the considered period, a reduction in the length at age was observed in the older classes (Age 2 and Age 3). The estimated parameters of the von Bertalanffy growth model were Linf = 18 (±1.15) cm, K= 0.459 (±0.018), and t0 = −1.99 (±0.008) and, accordingly, the mortality vector was obtained according to Gislason’s model, for each age class, these values were 0.99 (0.98–1.02) C at Age 0; 0.71 (0.7–0.73) y−1 at Age 1; 0.6 (0.59–0.62) y−1 at Age 2; 0.54 (0.53–0.56) y−1 at Age 3; and 0.51 (0.49–0.53) y−1 at Age 4. Results appeared in agreement with literature from other areas of the Mediterranean Sea and suggested a poor condition status of the sardine stock in the GSA16.
Key Contribution: The main warnings from this study for the sardine stock status in the Strait of Sicily are the decrease in length at age along the period 2009–2019; as well as the contraction in the population structure based only on Age 1 and Age 2 groups. These results strongly suggest both a suffering population and new efforts for finding a compromise between the sampling program of commercial and scientific surveys to obtain representative information on the stock.

1. Introduction

Small pelagic fishes (SPF) account for about 25% of global fish catches and, due to their abundance and position in the trophic web, constitute an important link between the lower and the upper trophic levels, thus representing both an economically and ecologically important group [1,2]. Among the SPF species, the European sardine (Sardina pilchardus, Walbaum 1792) plays a key role in maintaining ecological processes in marine systems, occupying an essential intermediate trophic level in pelagic ecosystems [3]. The European sardine, belonging to the Clupeidae family, lives from the North Sea to Senegal in the eastern Atlantic waters, as well as in the Mediterranean Sea [4]. It is a schooling fish, usually resident on the continental shelf [5,6], with a significant commercial value as it represents the second species (after anchovy, Engraulis encrasicolus) most important for fish landings, contributing to 14% of total catches including crustaceans and molluscs in the Mediterranean Sea (GFCM area of application) [7]. In terms of species contribution, it is worth nothing the strong reduction of landing quantities from 2018 (190,248 tons) to 2020 (139,576 tons).
Sardine populations show high variability in terms of recruitment, biomass, and spatial distribution, which mainly depend on environmental and climatic conditions [8,9,10]. As with other life history traits, growth and age depend on the interaction between genetic characteristics and environmental influences, such as geographic and/or reproductive isolation, temperature, and food availability [11,12]. In particular, growth represents an important piece of information for assessing population productivity and resilience [13,14]; nonetheless, despite their relevance, the life history of most SPF is poorly understood in several areas of the Mediterranean Sea [15,16], and only few studies have focused on the growth of sardines in this area [12,17]. Furthermore, as life history traits are adaptive and may change in response to changing environmental conditions [18,19,20,21,22], it is advisable that such parameters are updated on annual basis, in order to feed stock assessment models with the most recent estimates. Recently, the sardine stock in GSA 16 displayed low biomass levels and it was considered overexploited, thus the advice to reduce fishing mortality [23].
In this study, an 11-year time series of age and growth data from catch sampling of sardine in the Strait of Sicily was analysed to provide robust estimates of the growth parameters and fishing mortality during the study period. Warnings about the stock status are provided, based on the obtained results.

2. Material and Methods

For 11 years (2009–2019), samples of European sardine were collected from purse seiner (PS) and mid-water pelagic trawl (PTM) vessels in the most important harbours along the south Sicilian coast [GSA 16 [24]; Figure 1]. The sampling design was based on monthly sampling, or at least one sample for each quarter in a year, collected by each type of gear (i.e., PS and PTM) in the study area [25]. At the laboratory, individuals were dissected, sexed, and measured for total body length (TL; to nearest 1 mm), total body weight (TW; to nearest 0.1 g), and gonadic weight (GW; to nearest 0.01 g). Otoliths (sagittae) were removed from a sub-sample of a maximum five individuals per length class (0.5 cm length intervals). Then otoliths were cleaned, dried, and stored in black-plastic labelled moulds.

2.1. Age Estimation

Otolith readings were revised according to latest protocols and guidelines, agreed within international expert working groups [26,27,28]. The whole otolith was immersed in a 30% alcohol solution, with the distal surface turned up, and analysed under a dissecting microscope with reflected light against a black background at 25× magnification. The annulus was identified by the brightest contrast between the preceding translucent and the subsequent opaque zone deposited in the following year. To reduce misidentification of false and true annual rings, the measurements of subsequent annual growth zone widths were also carried out by a micrometre fitted in the eyepiece of the microscope. Only agreed readings between two experienced readers were used for the analysis, considering the high percentage of agreement between these readers in the Strait of Sicily (96%) and the relatively low coefficient of variation [29]. Finally, age assignment was made according to the conventional birthday (set at 1st of January for this species) and the date of capture, following the interpretation of the growth development of the annual zones over the course of a year [30].
The edge marginal analysis was used for corroborating the periodicity of growth increment formation, based on complete randomization of samples and age specificity [31]. The edge was classified as opaque (O) or hyaline (H), according to the criteria described in literature ([26] and references therein). Since the start of opaque growth on the margin may vary among age groups, the method was applied for the Age 1 group, as the most representative of the population.
Plots of edge state analysis for the Age 1 class by month were obtained, fitting the proportion by means of generalized additive models (GAM). The error distribution and link function used in the model were from the family of binomial distributions with logit linkage.

2.2. Growth and Mortality

Due to the lack of a marked sexual dimorphism in this species, the assessment as well as management measures were taken on both sexes. Therefore, to avoid gaps in the length range on yearly basis, growth models, age-length keys (ALK), and mortality parameters were estimated on combined sexes.
The traditional von Bertalanffy growth (VBG) model was preferred to other models mainly for its diffusion in literature, allowing direct comparisons with other areas. To estimate the von Bertalanffy growth curve, the Bayesian approach was used [32]. More details on this approach are available at the website https://fishecology.shinyapps.io/B-VBGM/_w_f961b92d/#tab-8771–2 (accessed on 28 March 2023). This approach assumes that all individuals come hierarchically from the same population with a common normal distribution and also considers the Bayesian confidence intervals (2.5–97.5%) of the posterior distribution of each parameter, while the priors for the growth parameter estimation were: t0 = −2.2; k = 0.1 and Linf = 15.20 cm.
The estimated parameters on a yearly basis were obtained together with a diagnostic statistic, which provided an objective tool to highlight those years with higher uncertainty. The upper and lower quartiles of the Bayesian confidence intervals (2.5–97.5%) to the mean estimate ratio, expressed in percentage (itv), were used to select the acceptable annual estimates of growth parameters, by setting a threshold of 20%. Such a threshold was mainly based on the assumption that an estimate with mean uncertainty of 20% is reasonable to accept a fitting estimation. Accordingly, all those years with mean itv higher than 20% were considered uncertain.
Natural mortality by age (M) was calculated for sardine in GSA 16 using the VBG parameters, obtained by the Bayesian approach and based on Gislason’s Second Estimator [33]. The Bayesian confidence intervals (2.5–97.5%) of the posterior distribution of each parameter were used to set the confidence intervals for both growing and growth-propagated information on the estimates of the natural mortality vector. Gislason’s equation was used also to obtain lower and upper mortality estimations by means of the higher and lower lengths at age predicted by the VBG-estimated final model.
All computations were performed in R environment [34].

3. Results

During the study period (2009–2019), a total amount of 4700 sardines was analysed to provide the age and growth information (Table 1). The monthly sampling was poorly represented in 2013, 2017, 2018, and 2019, when a lower number of fish was available for age assignment purposes (Table 1).
The data obtained by quarter and gear showed relevant gaps in some years; in particular from 2016 up to 2018, when very few samples per gear and quarter were available (Table 2).
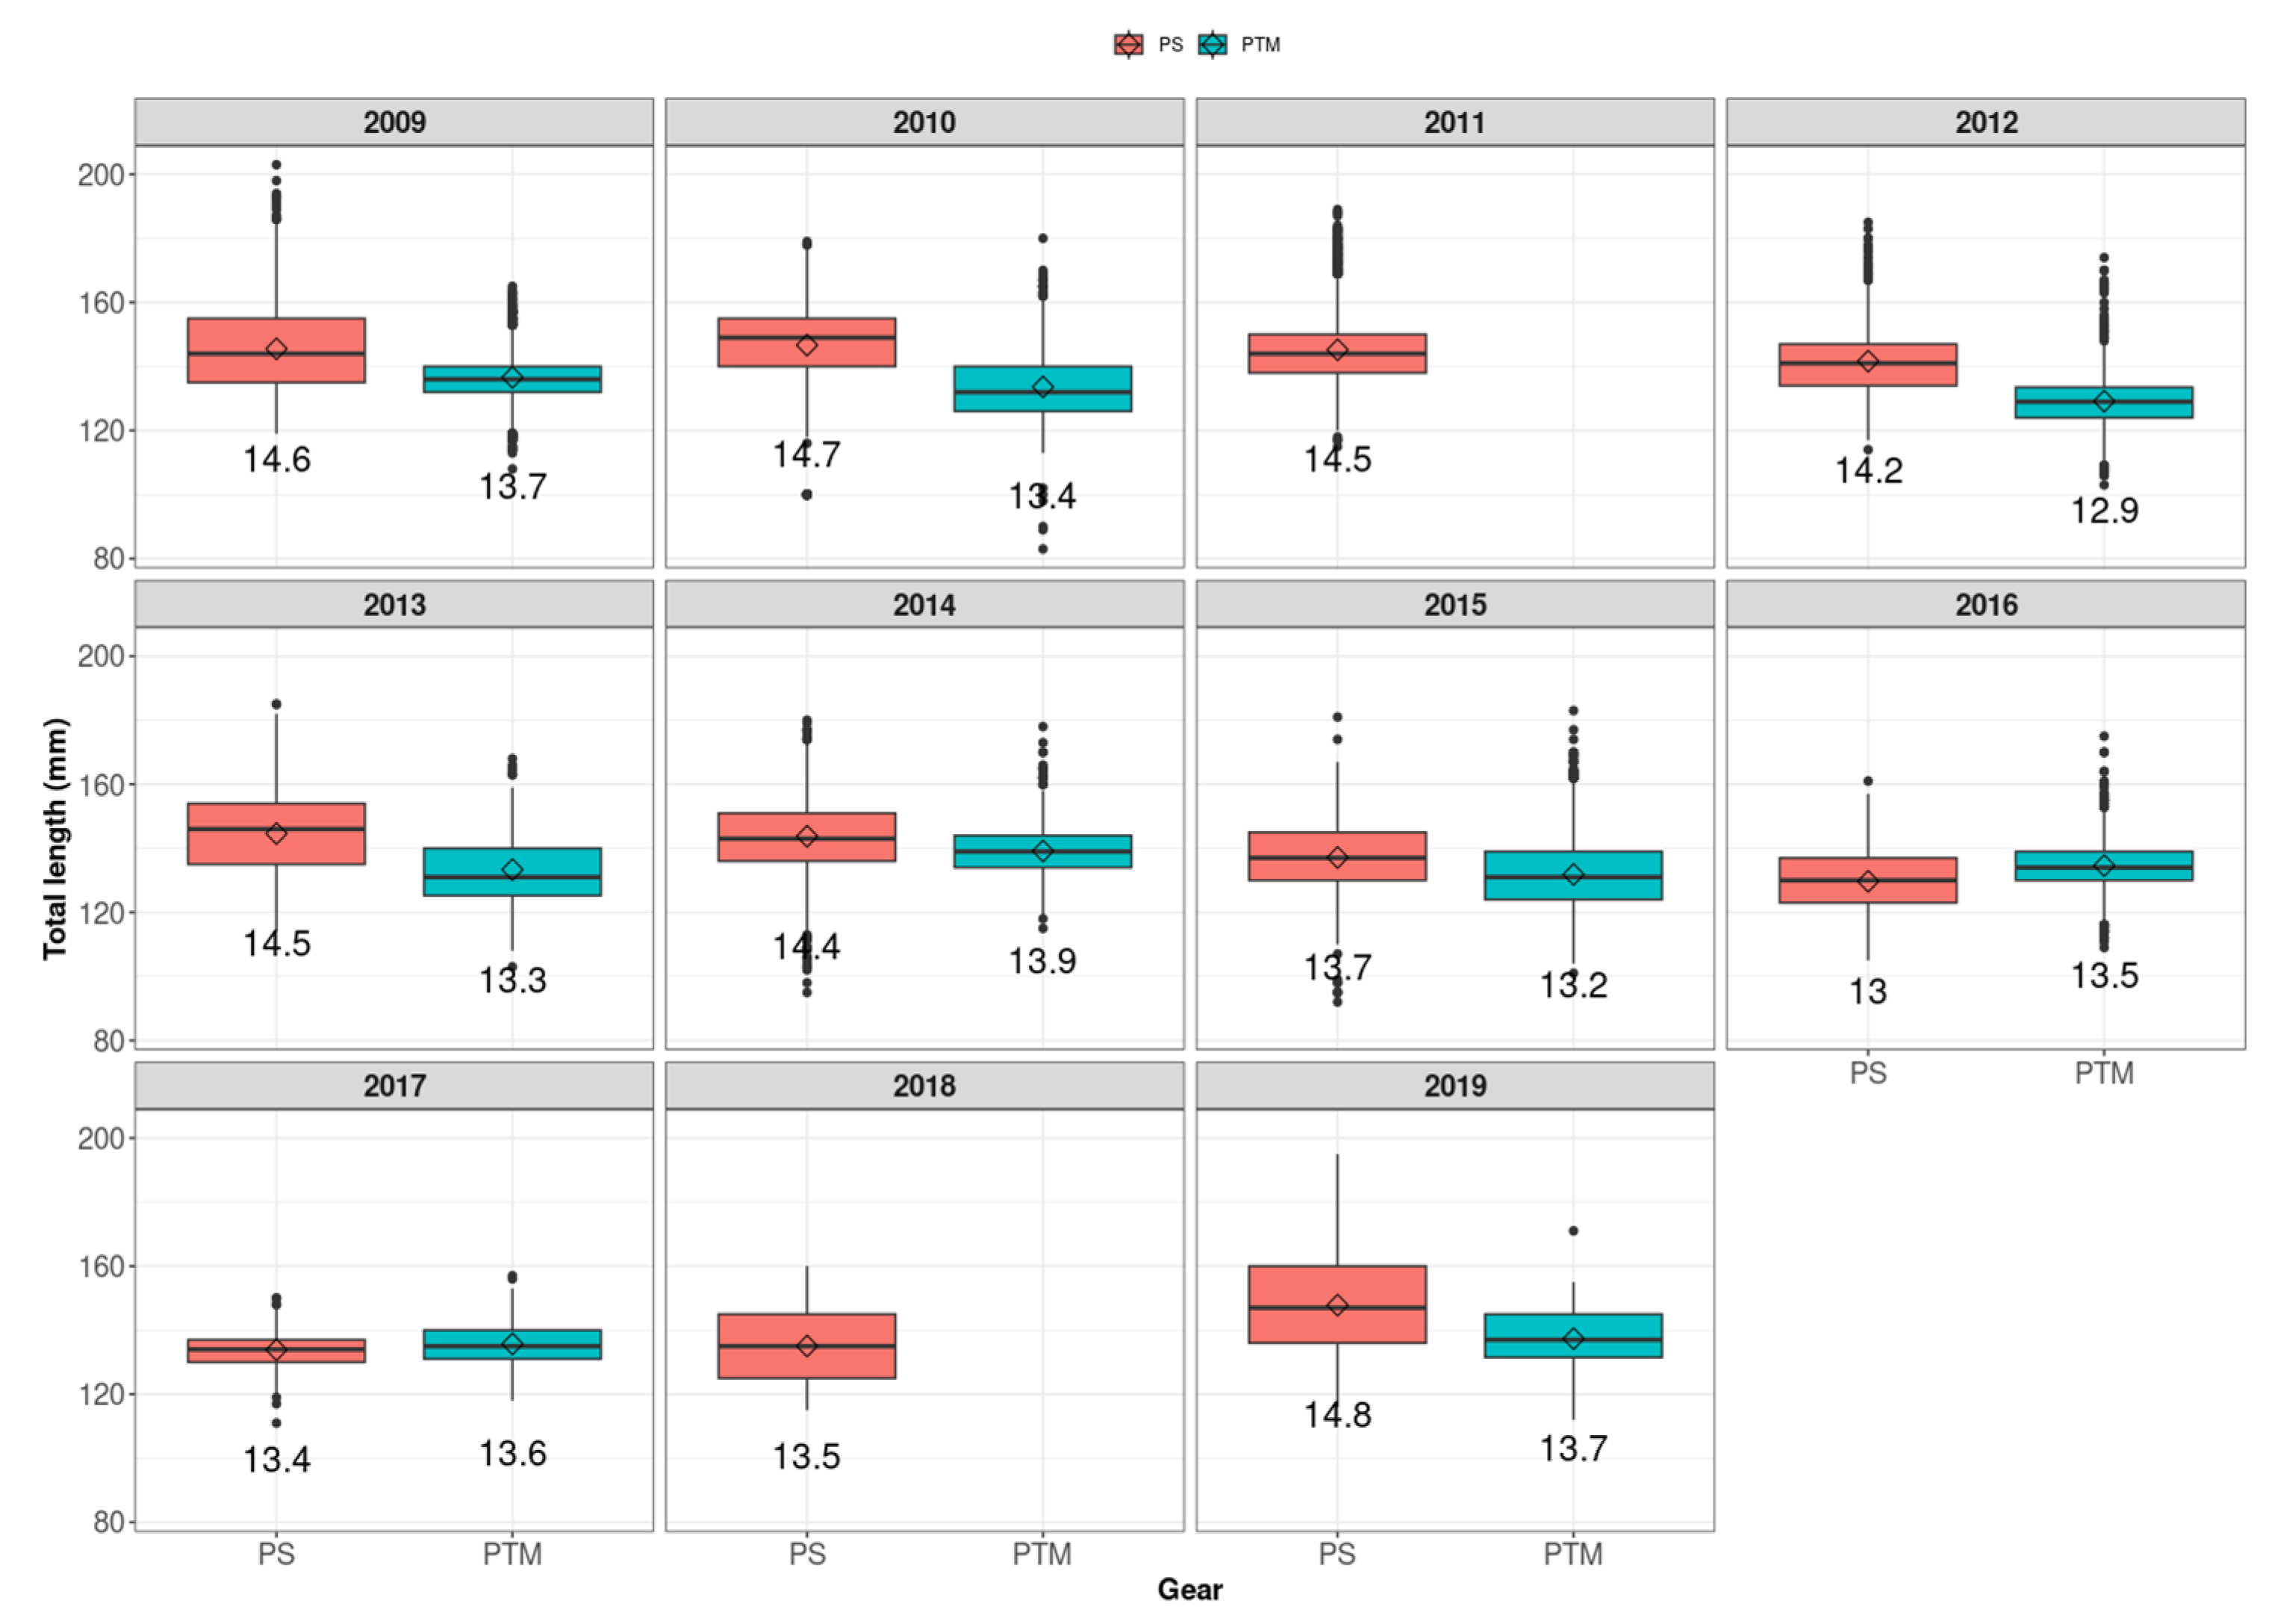
Moreover, in 2011 and 2018, only the purse seine fleet was sampled, therefore the sampling resulted in an imbalance of length frequencies, since the PS fleet targets a different length range (bigger fishes) than PTM (Figure 2).
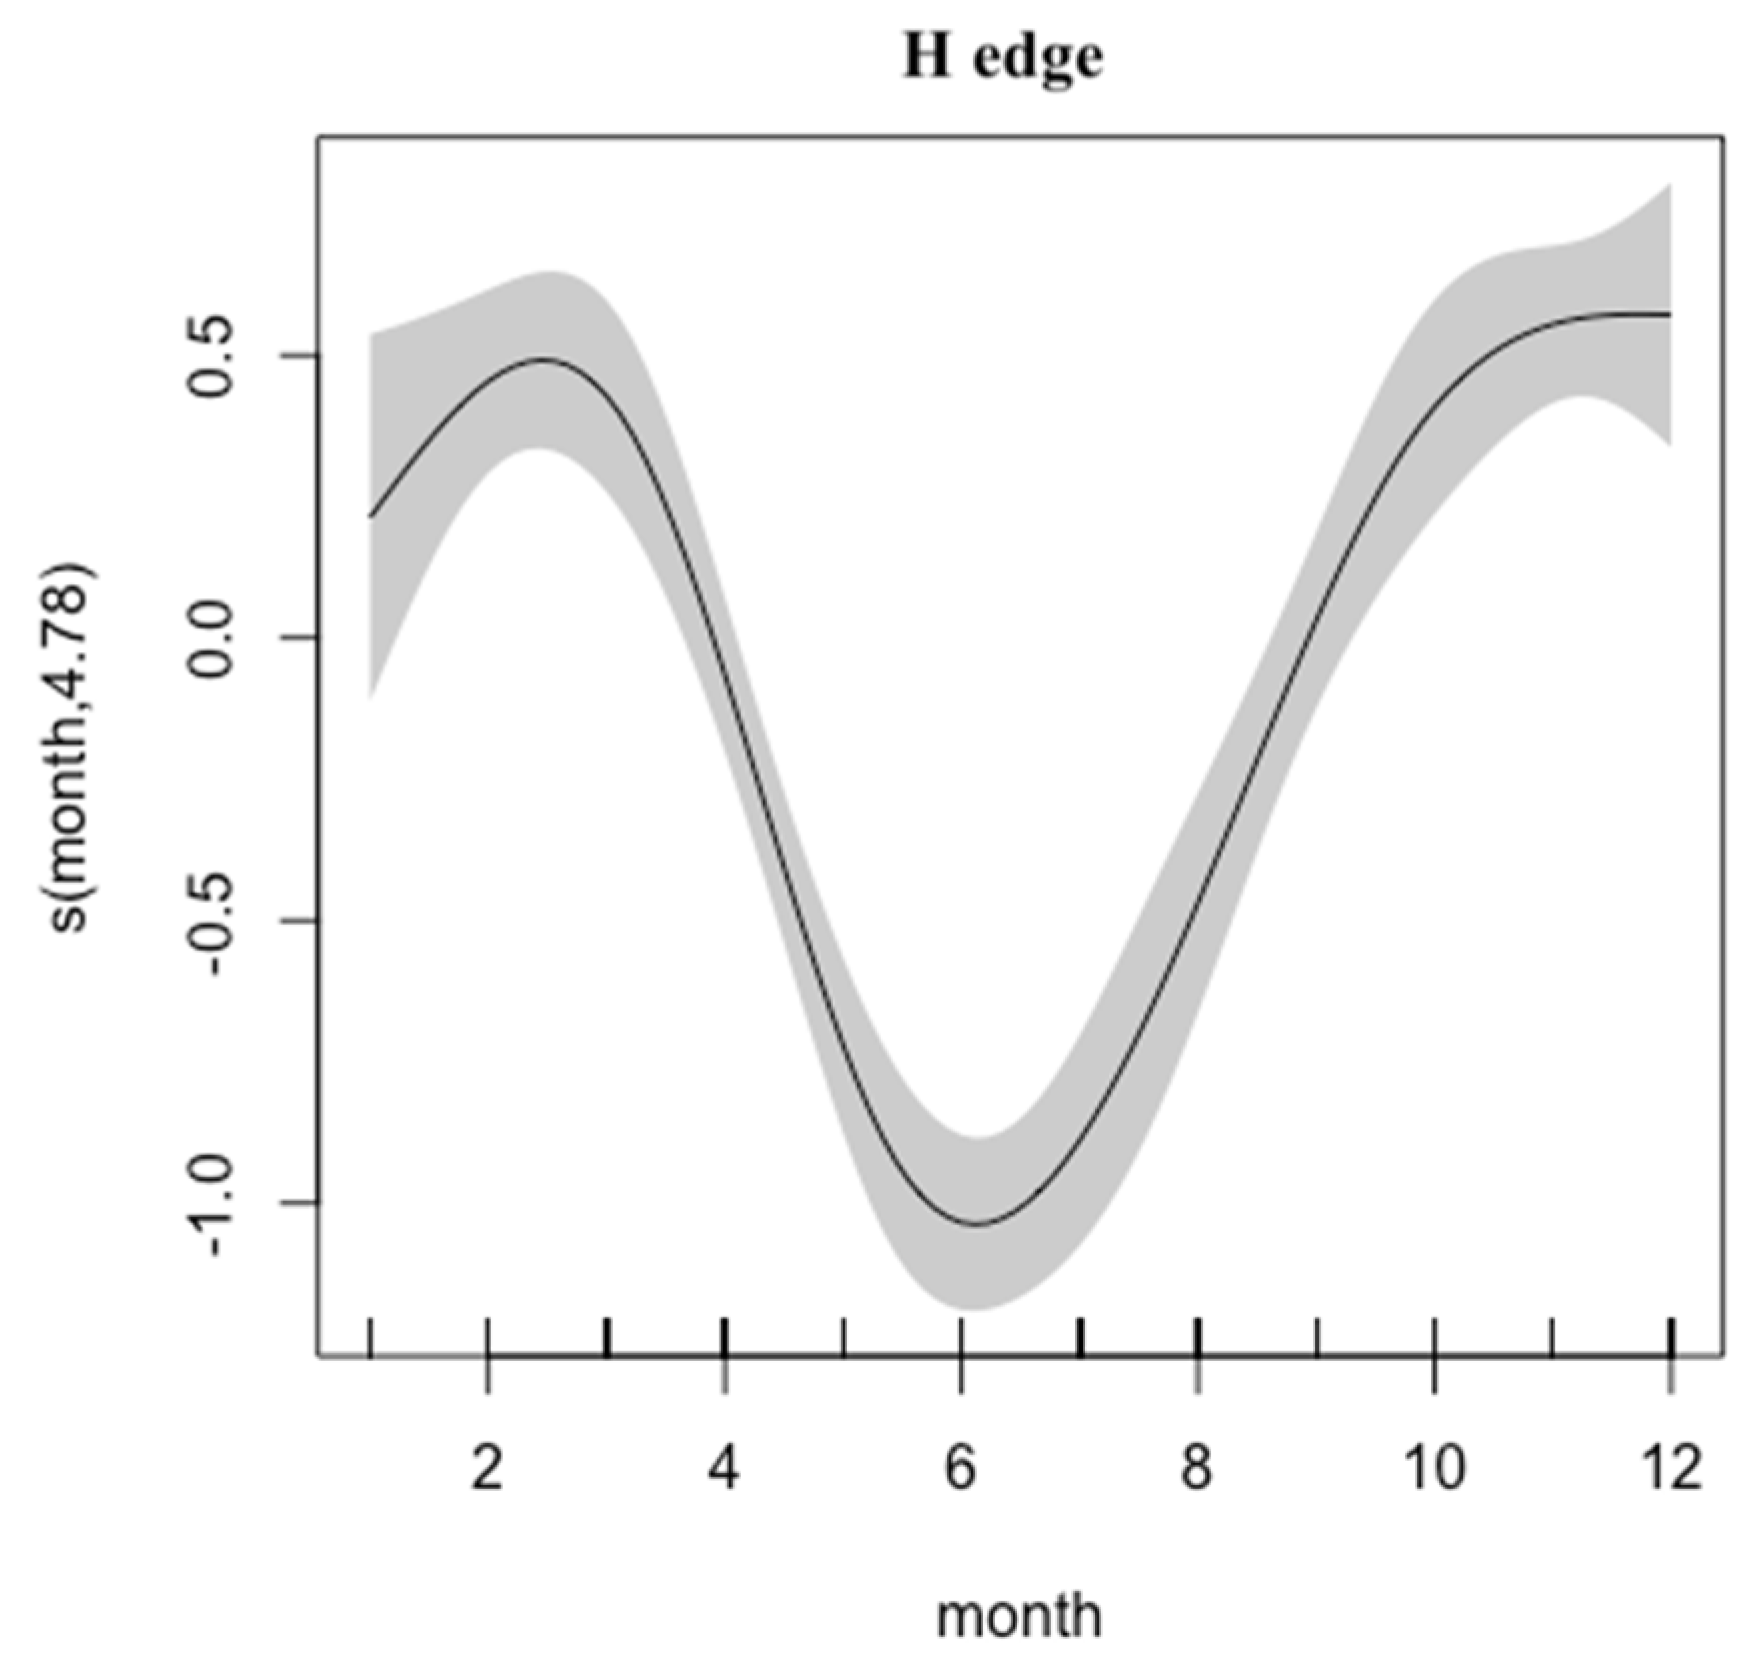
The analysis of the otolith edge morphology on 1-year-old individuals showed a clear yearly cycle (Figure 3). The shape of the relation of hyaline margin occurrence displayed one clear minimum in June/July, and higher values between November and February, corroborating the validation of the first annulus formation ([26] and references therein).
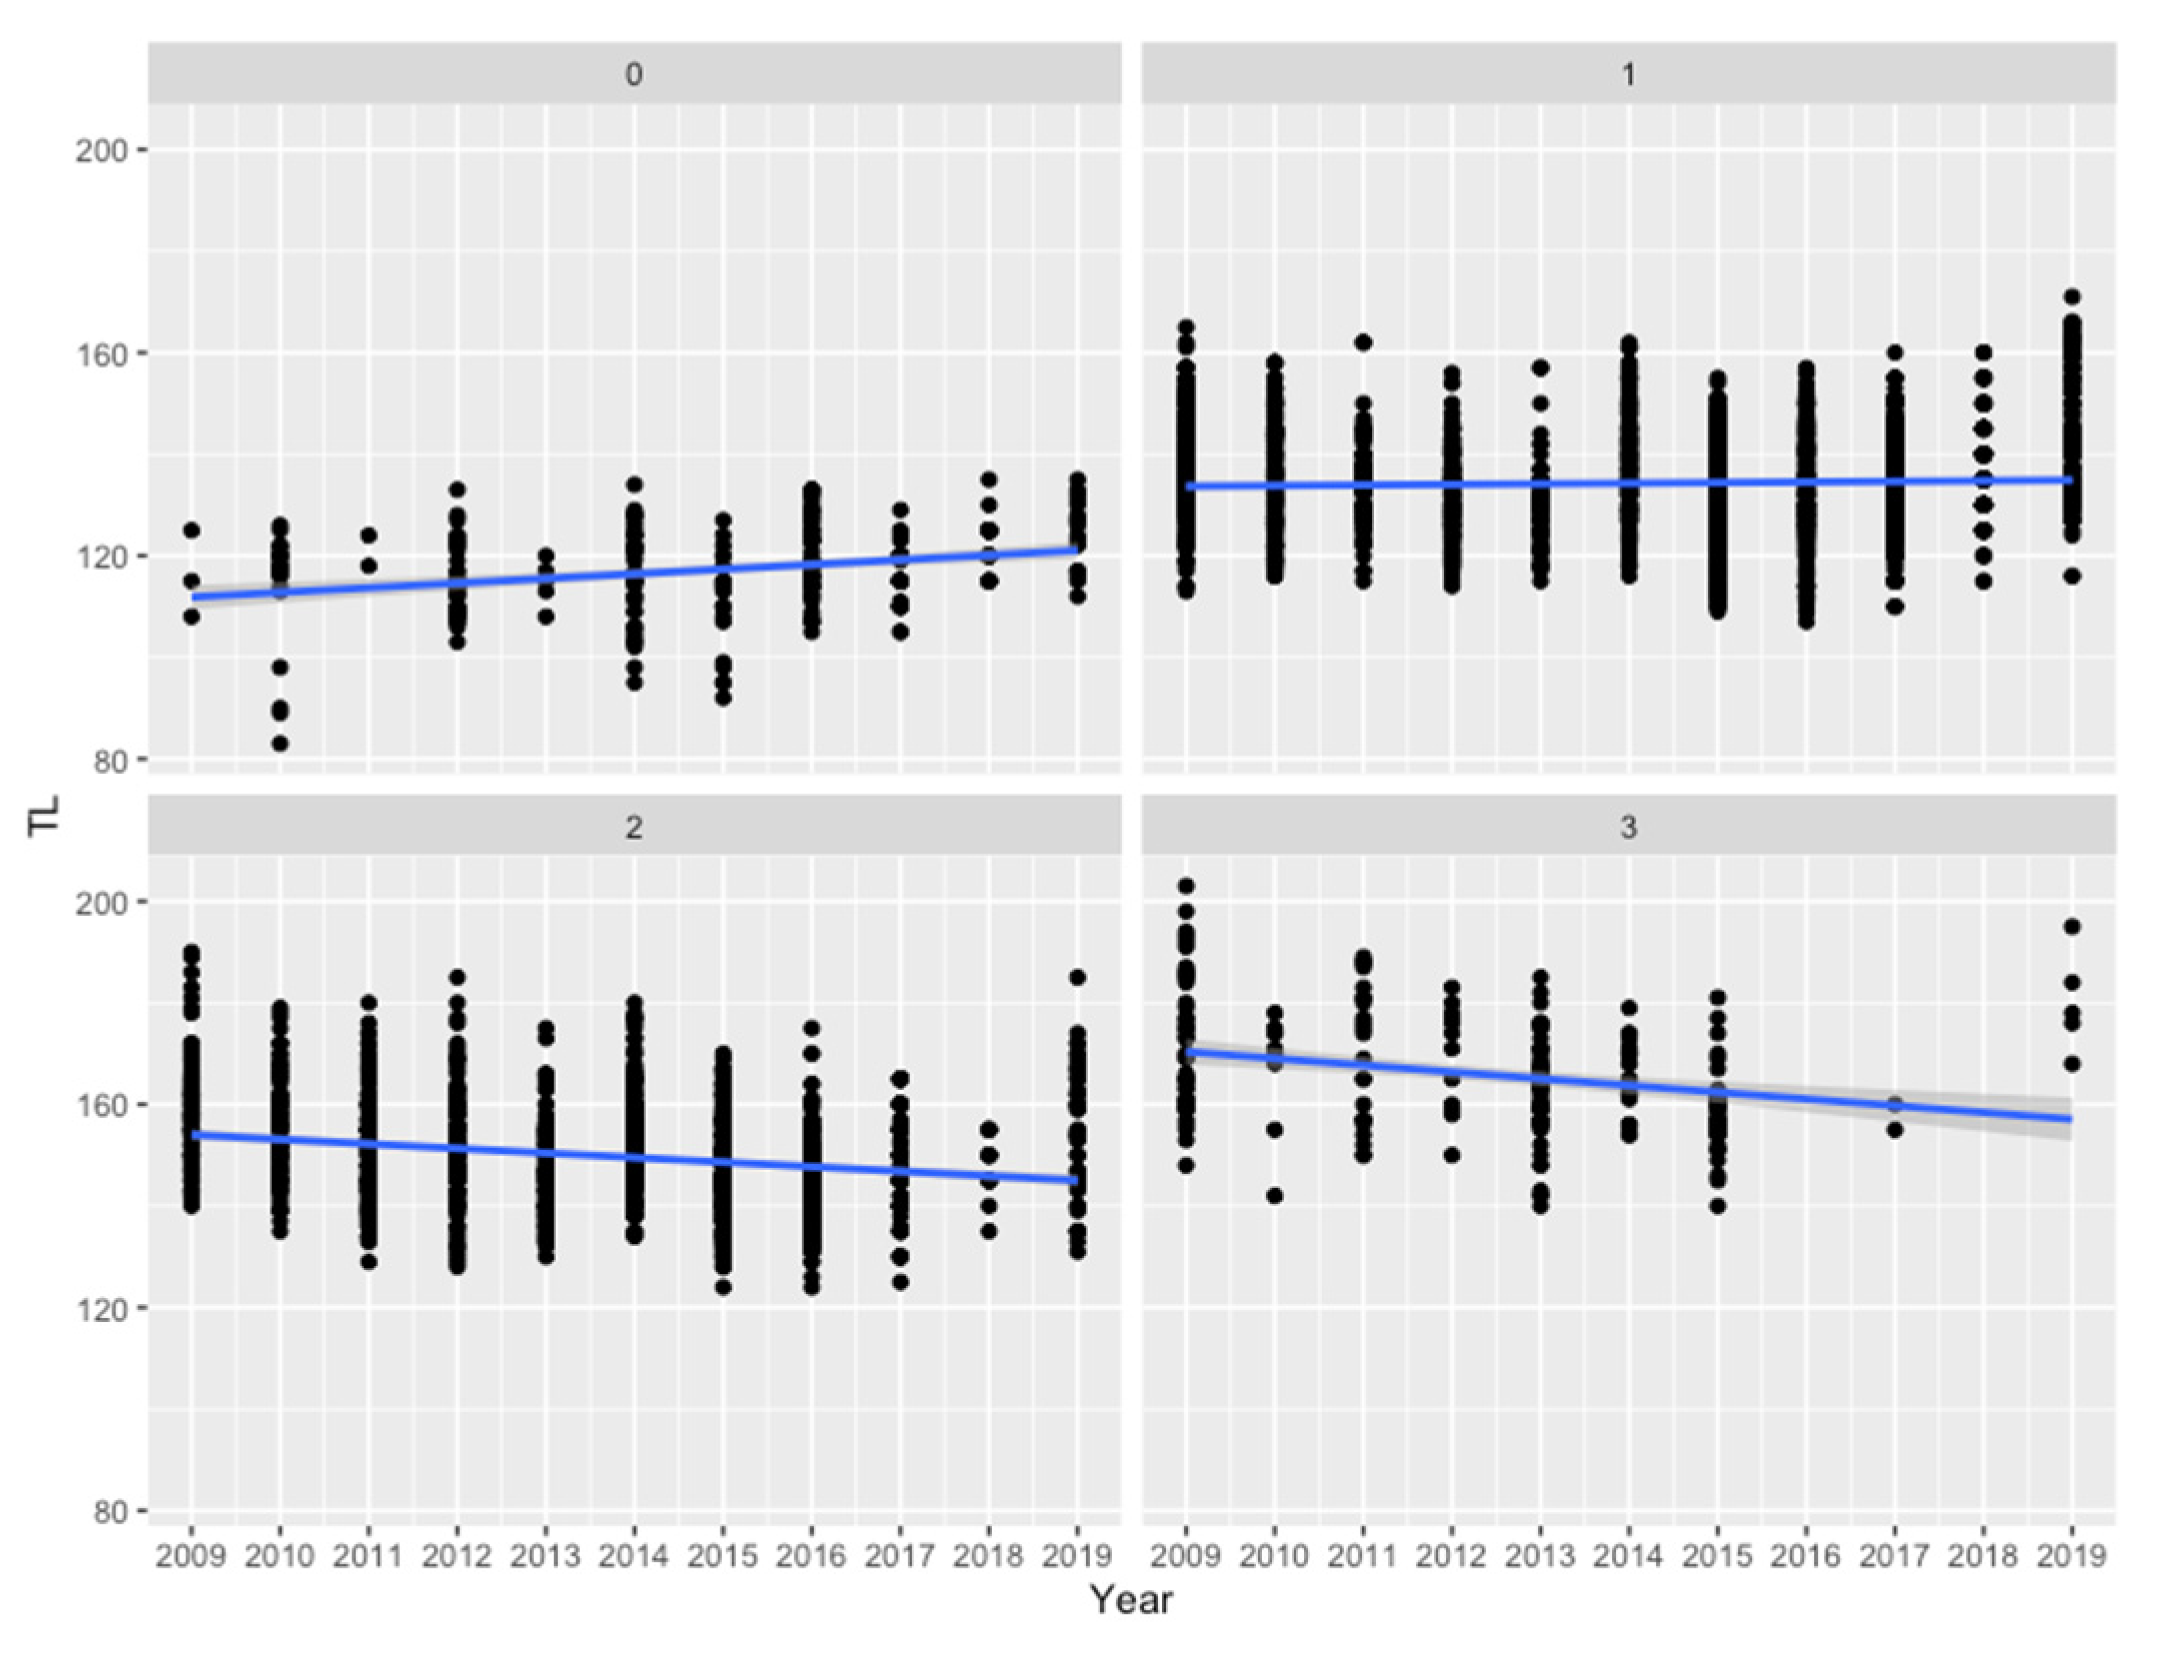
Significant trends in length along the time series by age class were also evaluated (Figure 4; Table 3). In particular, the Age 0 class showed a significant positive trend; however, excluding the year 2019, no trend was recorded for Age 0 or for Age 1 (with or without 2019; results not shown). Otherwise, in the older age classes (Age 2 and Age 3) the decreasing trend is stronger and significant.
The trend of decreasing length observed at Age 3 from the beginning of the study period is evident until the latest year (Figure 4). In 2019, higher lengths appear linked to the higher number of samples retrieved from PS gear that year (Table 2), when landings had a higher mean length compared to the PTM (Figure 2).
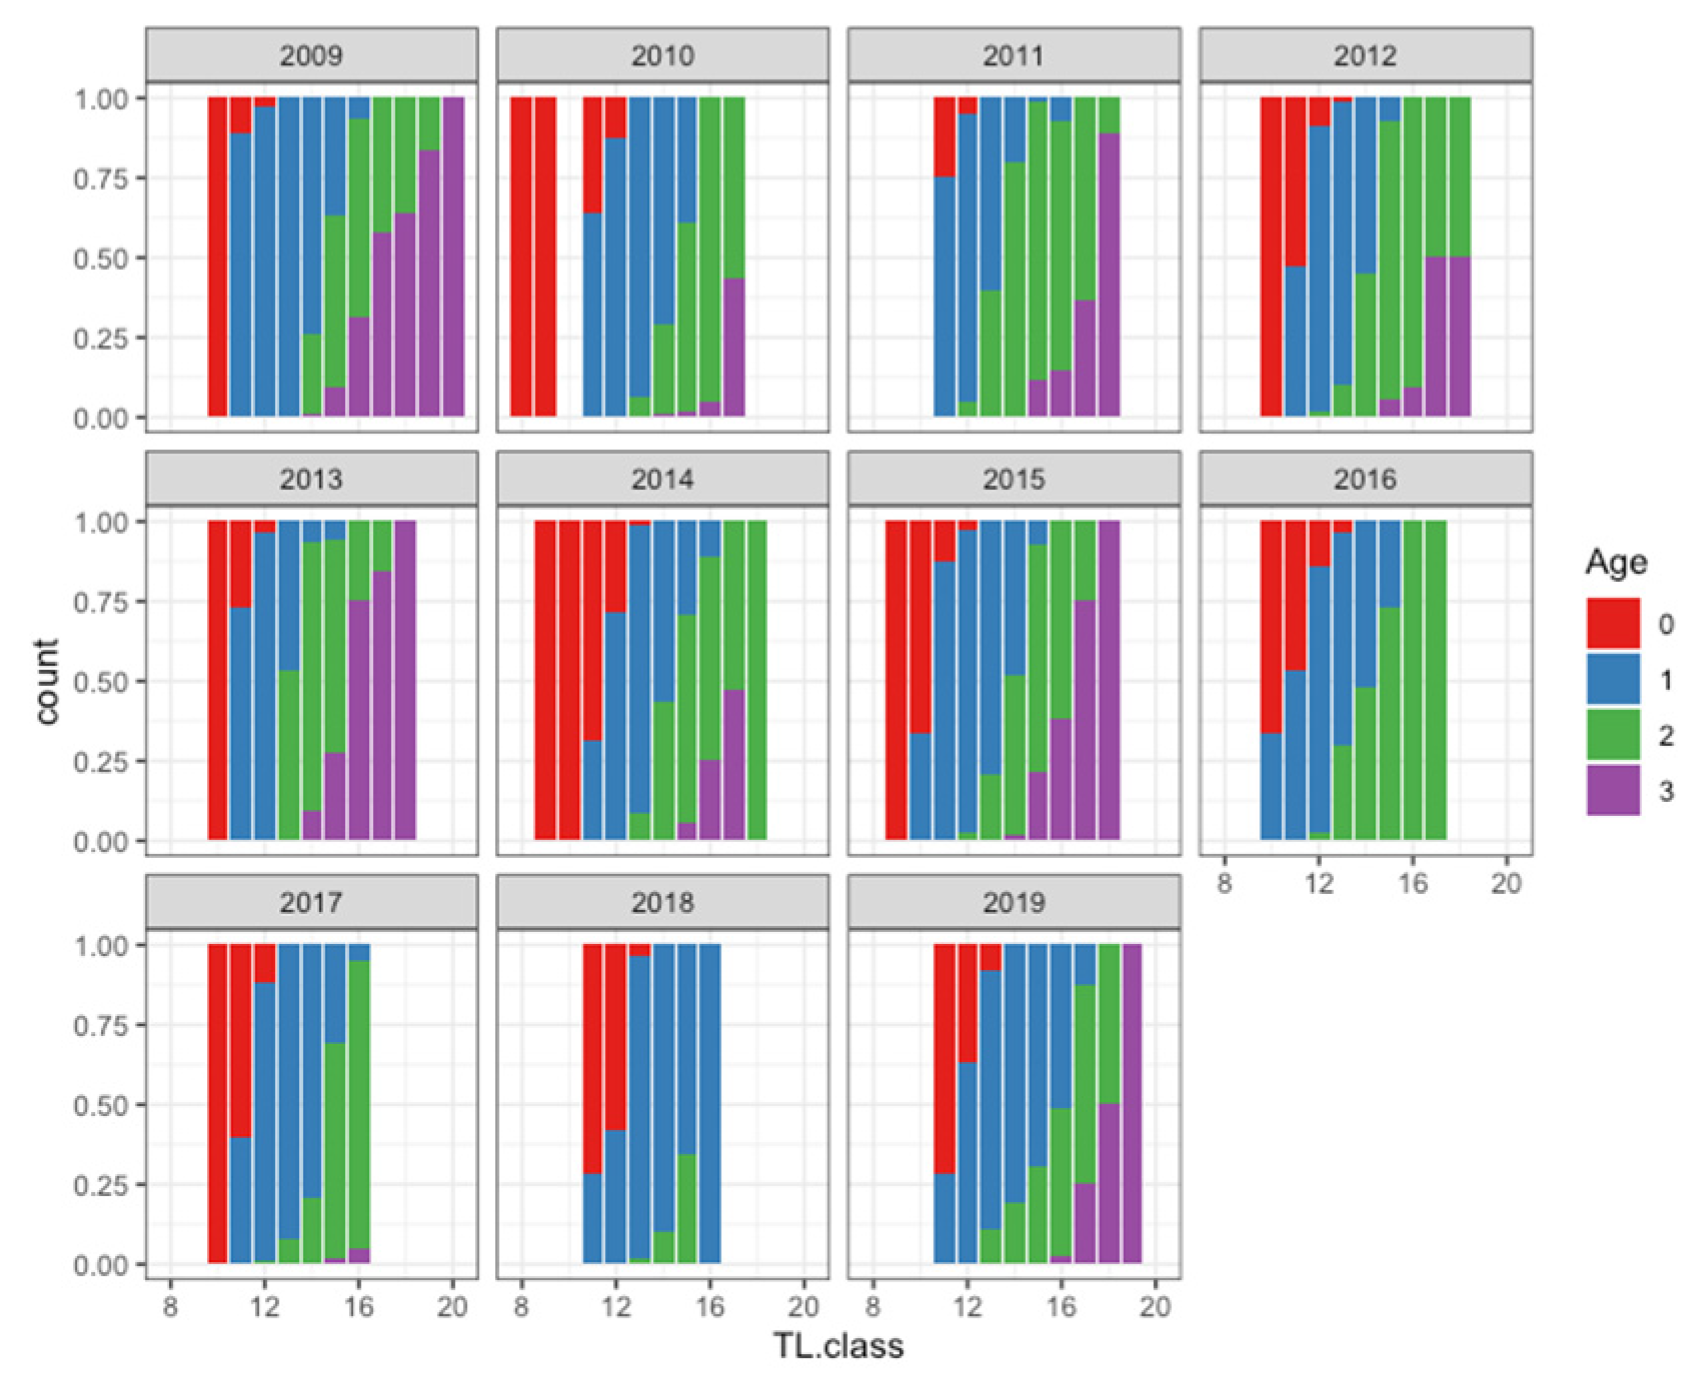
The age-length key was built on an annual basis (Figure 5). The visual inspections of the ALK highlighted the effects of sample gaps on the representativeness of the collected data relative to the population, by reducing the length range and number of age classes available, as was observed in 2011, 2017, and 2018 (Figure 5).
The ALKs obtained by year displayed ages from 0 to 3 years old with a higher proportion of individuals of Age 1 and Age 2 (respectively, 59% and 30%), while Age 0 and Age 3 were poorly represented in the landed catches with 6% and 5%, respectively (Table 4). However, the low proportion of Age 0 in the ALKs must be interpreted in the light of the minimum landing length, which is set to 11 cm for this species in the study areas, as also shown by landing length range in Figure 2.
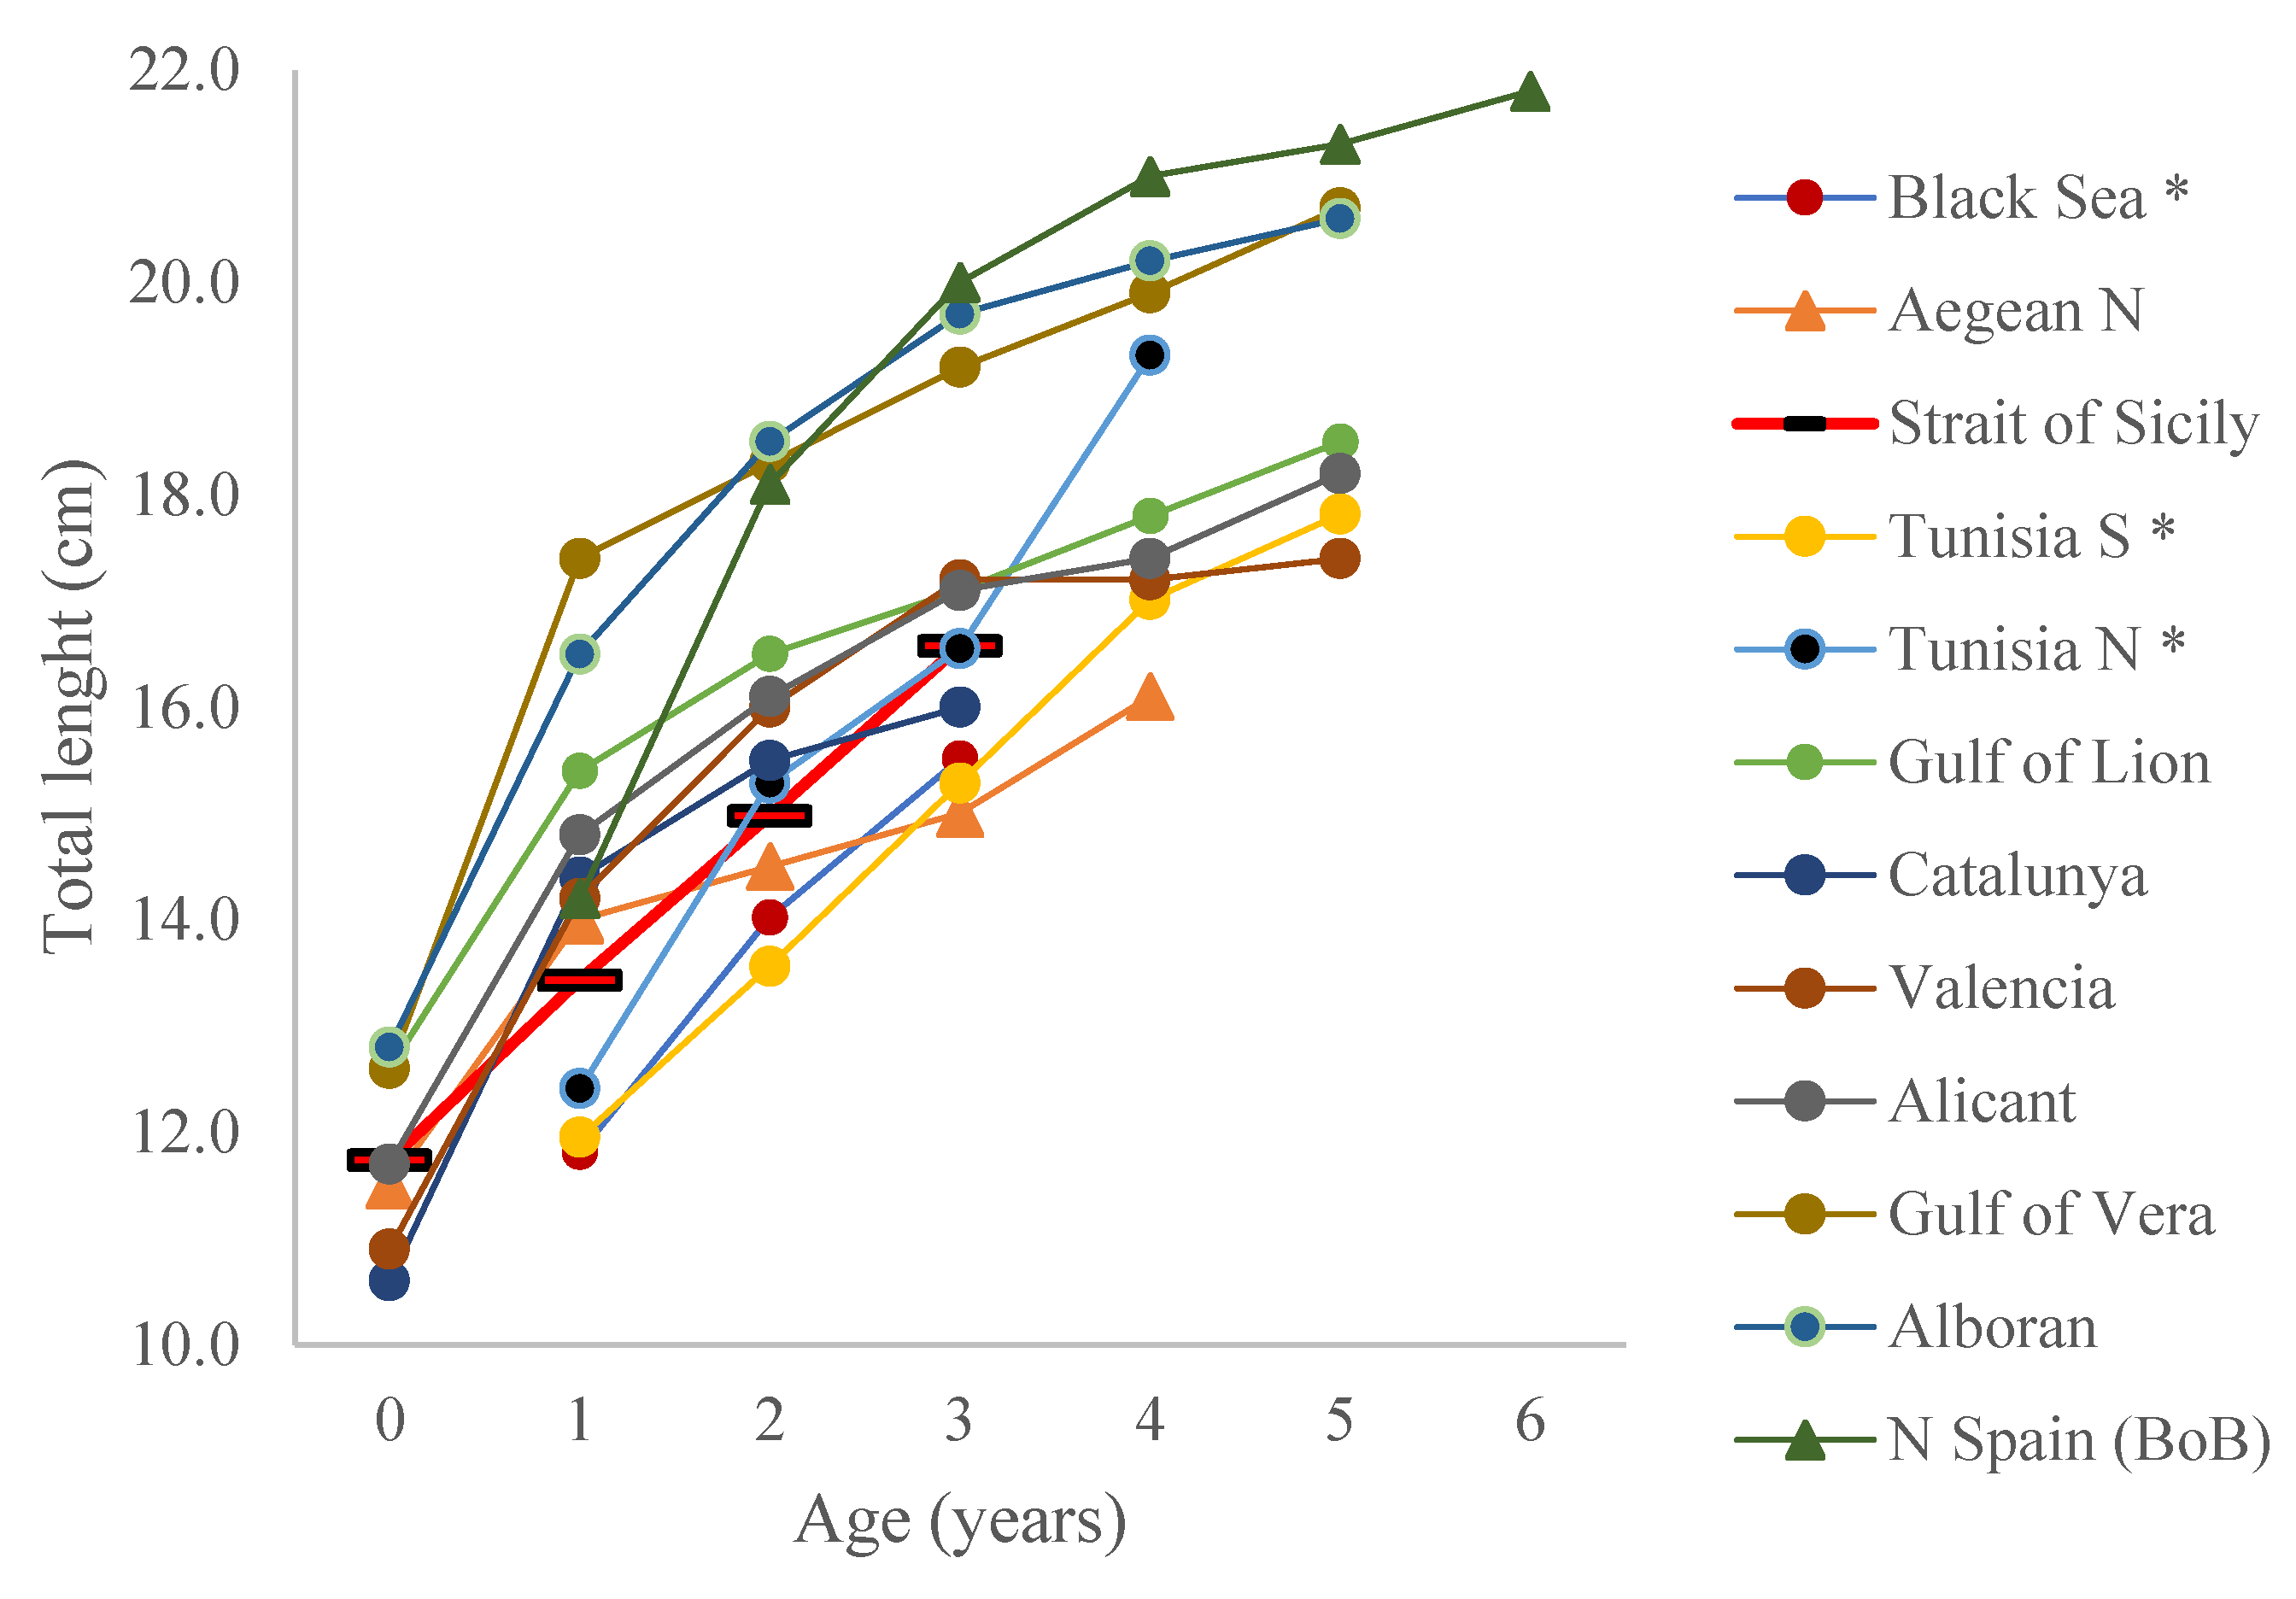
The mean lengths at age over the whole study period were 11.7 cm for Age 0; 13.4 cm for Age 1; 15 cm for Age 2; and 16.6 cm for Age 3. These values of length at age plotted together with similar estimates from several studies showed wide agreement with the literature (Figure 6).
The years with higher itv and higher sampling gaps (2011, 2018 and 2019) were excluded from the overall fitting of the Bayesian growth model (Table 5), as well as those years (2016 and 2017) characterized by a reduced age range (i.e., no Age 3; Table 4).
The values obtained from the model fitted over the selected years (2009–2015 excluding 2011) were Linf = 18 cm, k = 0.459 y−1 and t0 = −1.99 y (Table 6).
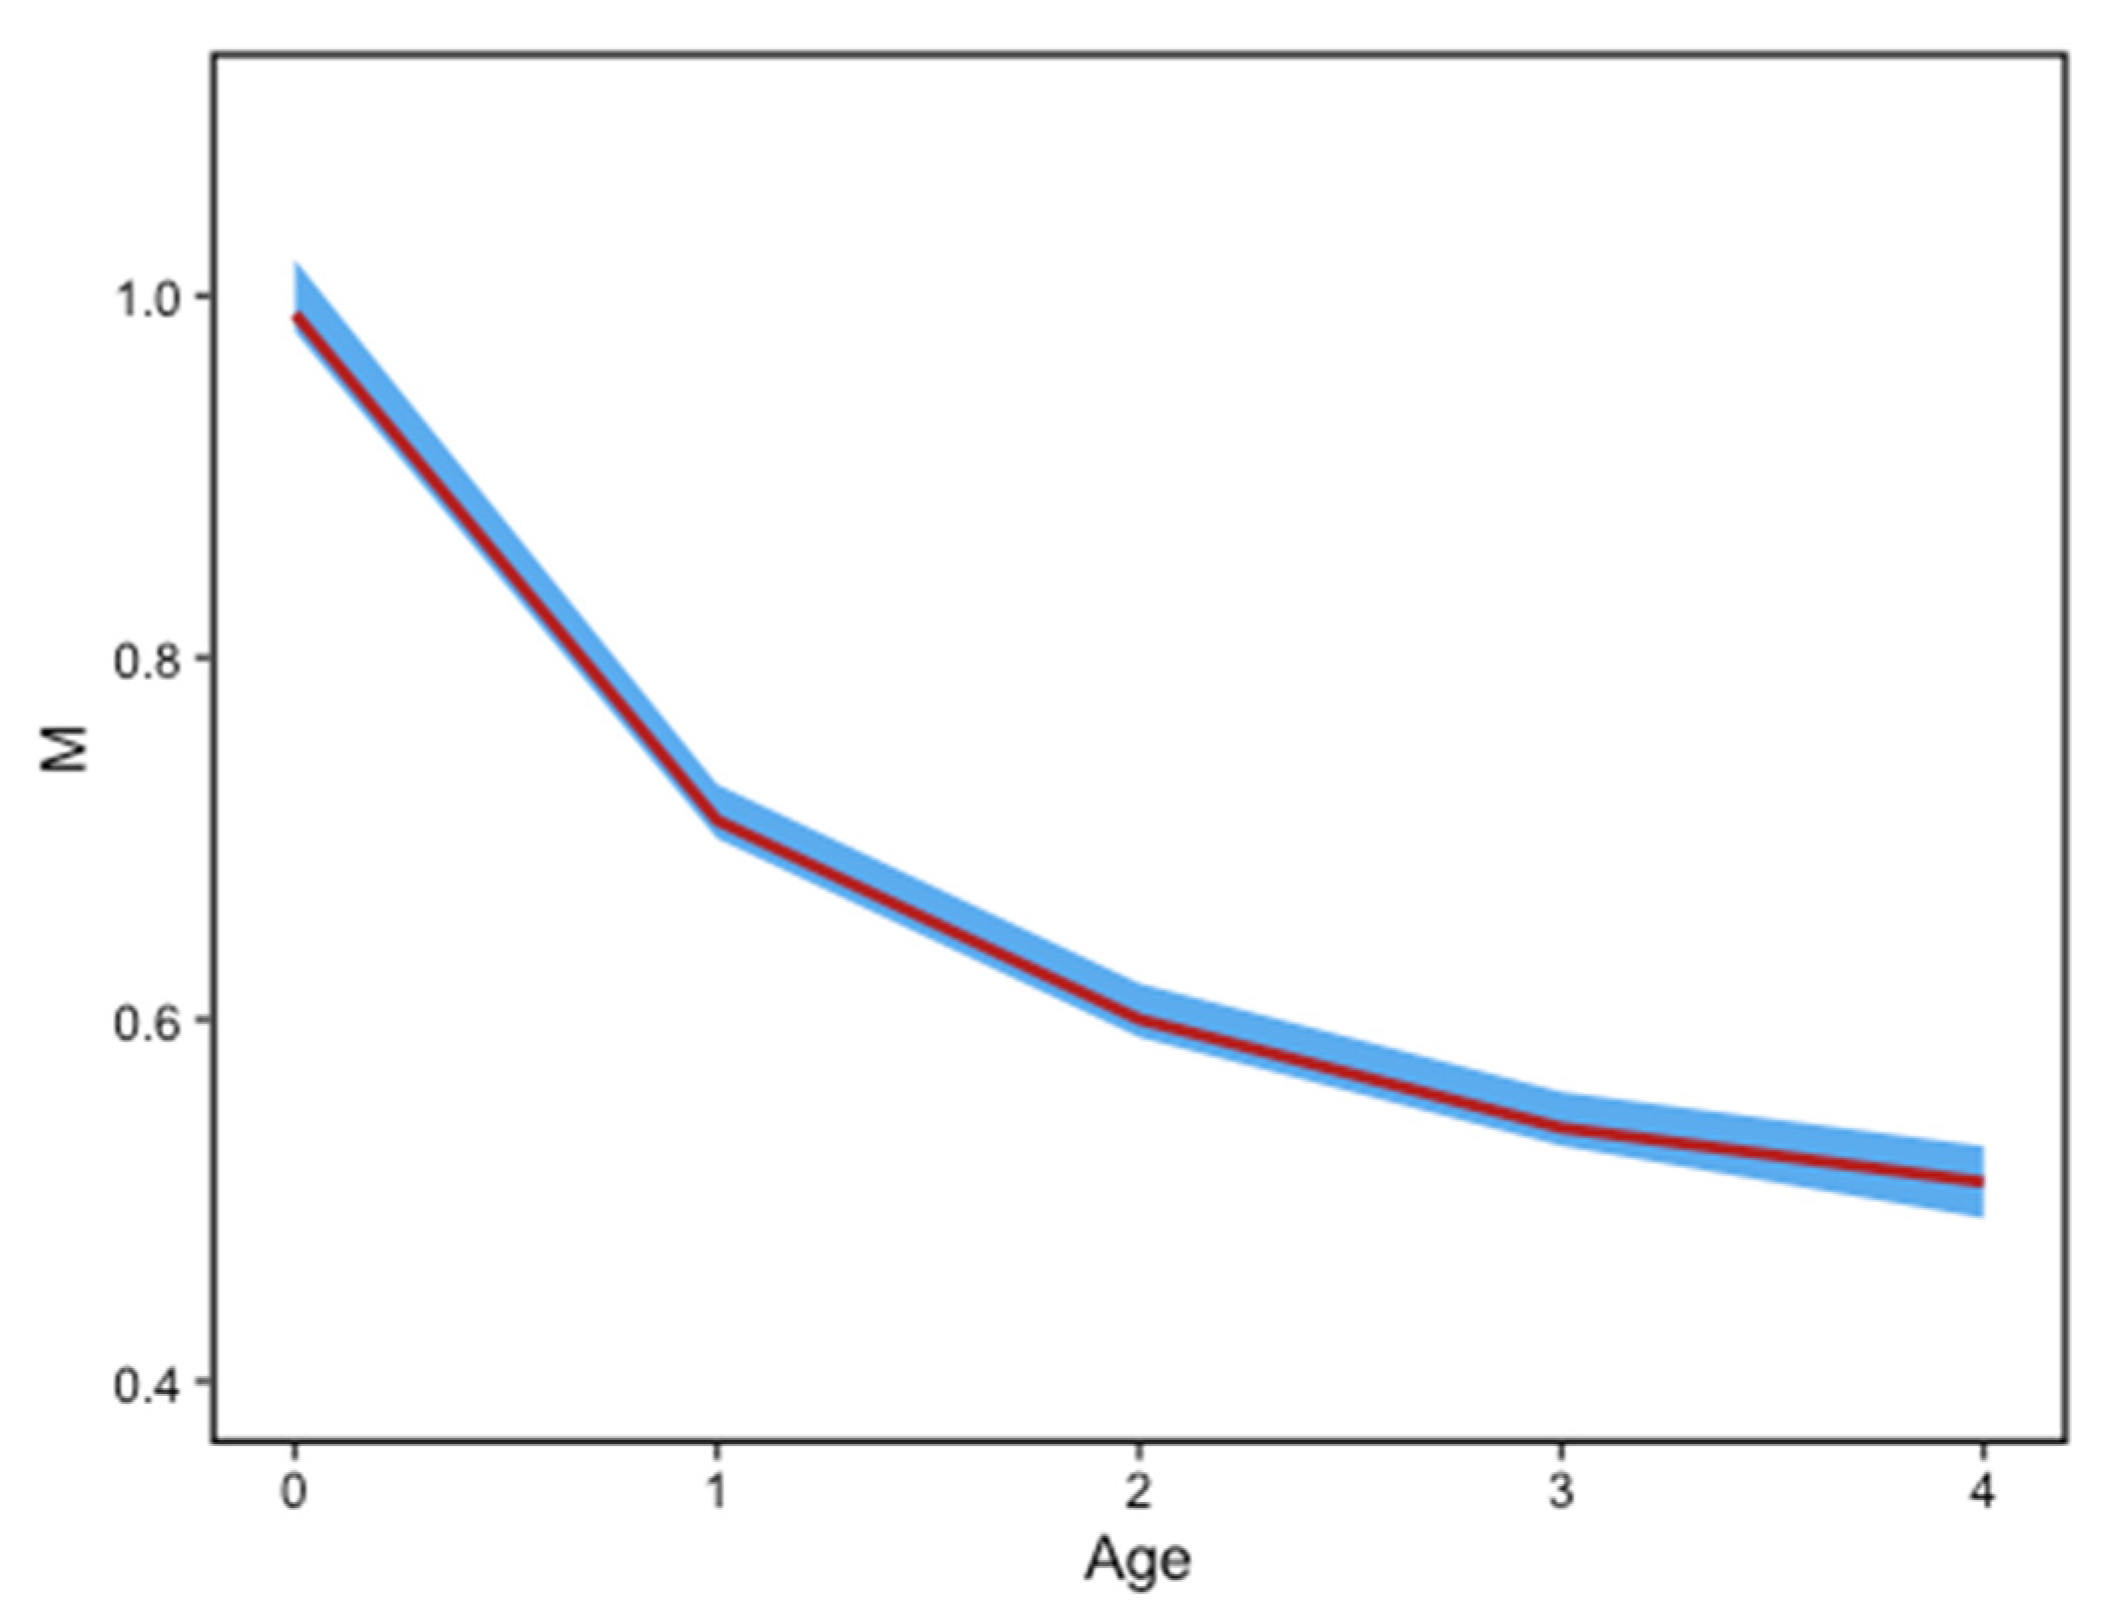
Natural mortality (M) was obtained according to Gislason’s model, with relative lower and upper confidence intervals for each age class, particularly 0.99 (0.98 −1.02) y−1 at Age 0; 0.71 (0.7–0.73) y−1 at Age 1; 0.6 (0.59–0.62) y−1 at Age 2; 0.54 (0.53–0.56) y−1 at Age 3; and 0.51 (0.49–0.53) y−1 at Age 4. These estimates were calculated taking into account the Bayesian VBGM parameters and the average length at age for each age class during the selected years (2009–2015 excluding 2011) (Figure 7).

4. Discussion

Age validation studies on sardine are still a matter of concern for many stocks and areas [39], while in the case of European anchovy the verification of increment periodicity for most populations and the corroboration of the first growth ring have been carried out, providing a valid support for the accuracy of age data [26,39]. Nevertheless, the adoption of an internationally agreed age-reading protocol allows a better comparison with age data from different areas and laboratories [39]. In the present study, the edge morphology analysis further corroborated the first annulus formation.
The age range during the whole study period showed sardines not older than 3 years, although in the Mediterranean Sea age ranges have displayed higher ages, in some studies even up 8 years old ([40] and references therein). Since these previous observations mainly rely on age reading of scales instead of otoliths, this evidence may invalidate a tight comparison of results with otolith-based studies [36,41]. Otolith-based studies recorded a maximum age of 5 years old among individuals in the western Mediterranean [36], while in the eastern part of the basin the age ranges were closer to the present study with fish not older than 4 years [42]. Although sardines have been observed to reach ages of up to 13 years in oceanic waters, they have also shown greater lengths than in the Mediterranean, with total lengths of 24–27 cm [38]. However, more recently, a contraction of the age classes was observed with individuals not older than 4 years in sardine stocks across the Mediterranean Sea, together with a decline in landings and overexploitation of this important resource [7]. A reduction in the age of landings was also observed in the present results, due to the reduction in the number of older individuals (i.e., Age 3) in recent years (2016 onwards). Although the sampling gaps of the last few years may also be responsible for the under-sampling of the older age classes, the structure of the population in the study area appeared mainly based on two classes (i.e., Age 1 + Age 2 = 90%), suggesting a population decline. Furthermore, a warning on the stock status is also indicated by the reduction in the average length at age along the time series analysed.
Significant trends were detected for the oldest age classes; such behaviour suggests a poorer condition in these age classes along the time series, most likely due to the higher fishing mortality on older/bigger individuals, especially those targeted by the PS fleet. However, it is not possible to exclude the concurrent effects of the environmental drivers, which appeared to worsen the body conditions of older age classes and increase their natural mortality [39,42]. Over the past two decades, European sardines have shown a decrease in average length in the Mediterranean Sea for each age class and this was linked to higher fishing pressure [43,44,45]. Moreover, as observed in the present study, this decrease in length at age is concomitant with a disappearance of older individuals [46].
A comparison with the available literature data for this species in Mediterranean and Atlantic waters (Figure 6) highlighted the observed average length at age for GSA16 falls between the estimates of Tunisia, Aegean and Black Seas (lower values) and the other areas (Spain, France, and the Bay of Biscay [38]). In northern Tunisian waters (which are the area closest to the study area), similar lengths at age have been found for sardines [37]. However, spatial variability in length at age has been observed in literature, with a latitudinal decline along the eastern Atlantic coast. Moreover, a west-east oriented gradient was also observed in the Mediterranean basin, with greater length toward the west [38]. Differences in sardine growth have also been recorded between northern and southern Tunisian waters, due to the coexistence of two different populations [37].
Difficulties in fitting the growth models appear to be related to the very large number of gaps in the sampling of landings in the years 2011, 2018, and 2019, while in 2016 and 2017 a reduced age range did not permit an adequate sample for fitting. However, the growth model parameter estimates, with their confidence intervals, showed values within the range observed in the literature for European sardine in the Mediterranean Sea [47] and references therein, especially if the present results are compared with other growth studies based on the otolith examination [36,42]. However, the present study results clearly fall within an Atlantic to Mediterranean gradient, with larger body length and longer lifespans in western areas (NE Atlantic and western Mediterranean) decreasing toward the Greek waters [47].
Uncertainty in estimating natural mortality can have a strong impact on stock assessments, especially in the case of short-lived species, such as sardines [42,48]. A wide range of variations in natural mortality values has been found in the literature, depending on the method and data used [49]. With regard to the selection of the best estimation method for natural mortality (M), a review study showed that none of the existing methods can provide robust evaluation for every species and none appears to be accurate enough to be used in analytical stock assessments, while many models provide such poor results that they have no practical application [49]. However, the same author noted that Gislason’s first and second estimators appear to be the most useful for a wide variety of finfishes to delimit the mean M of a population. Certainly, the M values reported in the literature for the European sardine in the Mediterranean Sea have shown a high variability even among different areas and ecosystems, but sometimes it is difficult to disentangle the portion of habitat variability from other factors [49]. The M estimates of several Mediterranean regions showed a consistent variability by area, that was related to the variability and uncertainty in the growth parameters used as the basic input of Gislason’s M estimator [50]. Due to the relative paucity of up-to-date studies on sardine mortality, authors have sometimes referred to theoretical values between 0.8 and 1, but without substantial evidence for such a choice [51]. However, current mortality estimates appeared in agreement with the literature [42,52].

5. Conclusions

Growth and mortality of European sardine were evaluated for GSA16, providing useful information for the management of this important resource. The main warnings from this study for the stock status in the GSA16 are the decrease in length at age along the study period, as well as the contraction in the population structure based only on Age 1 and Age 2 groups. These results, accordingly to the latest GFCM-WGSASP Report [23], strongly suggest a suffering population that appears not capable (over the study period) of returning to safe limits for a healthy stock. Homogenously sampling throughout the year is a well-accepted prerequisite for obtaining a reliable estimate of the population age structure (e.g., also including fish below the legal minimum length). Therefore, new efforts would be devoted to finding a compromise between the sampling program of commercial and scientific surveys to obtain representative information on the stock. Well-balanced temporal and gear sampling, along with the presence of observers on board the fishing vessels to obtain also smaller length individuals, would provide a better picture of the stock structure, which could be reflected in more accurate stock evaluation and more precise control rules.

Author Contributions

Data curation, R.F. and G.B.; Formal analysis, G.B. and M.B.; Funding acquisition, A.B.; Investigation, R.F., G.B. and S.A.; Methodology, G.B. and S.G.; Project administration, A.B.; Software, S.A.; Supervision, G.B.; Validation, S.G., R.F. and G.B.; Writing—original draft, R.F. and G.B.; Writing—review & editing, M.B., S.A., A.B. and S.G. All authors have read and agreed to the published version of the manuscript.

Funding

Sampling were financed by the Consiglio Nazionale delle Ricerche and the European Union through the Data Collection Framework (DCF—Reg. Ce. No 199/2008, No 665/2008 and Commission Decision No 949/2008).

Institutional Review Board Statement

No use of live animals has been required for this study and no specific permissions were needed for the sampling activities in all of the investigated areas, because the target species is commercially harvested (neither endangered nor protected) and it was caught in areas where fishing is allowed.

Informed Consent Statement

Not applicable.

Data Availability Statement

The data analyzed in this study is subject to the following licenses/restrictions: Due to the data policy of the Research Project (Piano di lavoro Raccolta Dati Alieutici-REG. (UE) N. 508/2014 relativo al Fondo europeo per gli affari marittimi e la pesca (FEAMP) e REG. (EU) N. 2017/1004) the datasets analyzed in this article cannot be made publicly available. Requests to access these datasets should be directed to https://dcf-italia.cnr.it/web/#/request-data.

Acknowledgments

The authors are grateful to the scientists involved on data collection and lab analyses, as well as to the manuscript Editor and reviewers for the valuable advice that has improved this paper.

Conflicts of Interest

The authors declare no conflict of interest. The funders had no role in the design of the study; in the collection, analyses, or interpretation of data; in the writing of the manuscript, or in the decision to publish the results.

References

  1. Ganias, K. Biology and Ecology of Sardines and Anchovies; CRC Press Tayole&Francis Group: Boca Raton, FL, USA, 2014. [Google Scholar]
  2. Lleonart, J.; Maynou, F. Fish Stock Assessments in the Mediterranean: State of the Art. Sci. Mar. 2003, 67, 37–49. [Google Scholar] [CrossRef] [Green Version]
  3. Bakun, A. Fronts and Eddies as Key Structures in the Habitat of Marine Fish Larvae: Opportunity, Adaptive Response and Competitive Advantage. Sci. Mar. 2006, 70, 105–122. [Google Scholar] [CrossRef]
  4. Parrish, R.H.; Serra, R.; Grant, W.S. The Monotypic Sardines, Sardina and Sardinops: Their Taxonomy, Distribution, Stock Structure, and Zoogeography. Can. J. Fish. Aquat. Sci. 1989, 46, 2019–2036. [Google Scholar] [CrossRef] [Green Version]
  5. D’Elia, M.; Patti, B.; Bonanno, A.; Fontana, I.; Giacalone, G.; Basilone, G.; Fernandes, P.G. Analysis of Backscatter Properties and Application of Classification Procedures for the Identification of Small Pelagic Fish Species in the Central Mediterranean. Fish. Res. 2014, 149, 33–42. [Google Scholar] [CrossRef]
  6. Iglesias, M. Spatio-Temporal Patterns and Morphological Characterisation of Multispecies Pelagic Fish Schools in the North-Western Mediterranean Sea. Aquat. Living Resour. 2003, 16, 541–548. [Google Scholar] [CrossRef]
  7. FAO. The State of Mediterranean and Black Sea Fisheries 2022; General Fisheries Commission for the Mediterranean; FAO: Rome, Italy, 2022; ISBN 978-92-5-137370-5. [Google Scholar]
  8. Alheit, J.; Licandro, P.; Coombs, S.; Garcia, A.; Giráldez, A.; Santamaría, M.T.G.; Slotte, A.; Tsikliras, A.C. Reprint of “Atlantic Multidecadal Oscillation (AMO) Modulates Dynamics of Small Pelagic Fishes and Ecosystem Regime Shifts in the Eastern North and Central Atlantic”. J. Mar. Syst. 2014, 133, 88–102. [Google Scholar] [CrossRef] [Green Version]
  9. Bonanno, A.; Barra, M.; Basilone, G.; Genovese, S.; Rumolo, P.; Goncharov, S.; Popov, S.; Buongiorno Nardelli, B.; Iudicone, D.; Procaccini, G.; et al. Environmental Processes Driving Anchovy and Sardine Distribution in a Highly Variable Environment: The Role of the Coastal Structure and Riverine Input. Fish. Oceanogr. 2016, 25, 471–490. [Google Scholar] [CrossRef]
  10. Tsikliras, A.C.; Licandro, P.; Pardalou, A.; McQuinn, I.H.; Gröger, J.P.; Alheit, J. Synchronization of Mediterranean Pelagic Fish Populations with the North Atlantic Climate Variability. Deep Sea Res. Part II Top. Stud. Oceanogr. 2019, 159, 143–151. [Google Scholar] [CrossRef]
  11. Begg, G.A.; Campana, S.E.; Fowler, A.J.; Suthers, I.M. Otolith Research and Application: Current Directions in Innovation and Implementation. Mar. Freshw. Res. 2005, 56, 477. [Google Scholar] [CrossRef] [Green Version]
  12. Sinovčić, G.; Keč, V.Č.; Zorica, B. Population Structure, Size at Maturity and Condition of Sardine, Sardina Pilchardus (Walb., 1792), in the Nursery Ground of the Eastern Adriatic Sea (Krka River Estuary, Croatia). Estuar. Coast. Shelf Sci. 2008, 76, 739–744. [Google Scholar] [CrossRef]
  13. Campana, S.E.; Thorrold, S.R. Otoliths, Increments, and Elements: Keys to a Comprehensive Understanding of Fish Populations? Can. J. Fish. Aquat. Sci. 2001, 58, 30–38. [Google Scholar] [CrossRef]
  14. Nazir, A.; Khan, M.A. Stock-Specific Assessment of Precise Age and Growth in the Long-Whiskered Catfish Sperata Aor from the Ganges River. Mar. Freshw. Res. 2020, 71, 1693. [Google Scholar] [CrossRef]
  15. Abaunza, P.; Gordo, L.; Karlou-Riga, C.; Murta, A.; Zimmermann, C.; Hammer, C.; Lucio, P.; Iversen, S.A.; Molloy, J.; Gallo, E. Growth and Reproduction of Horse Mackerel, Trachurus Trachurus (Carangidae). Rev. Fish Biol. Fish. 2003, 13, 27–61. [Google Scholar] [CrossRef]
  16. Checkley, D.M., Jr.; Alheit, J.; Oozeki, Y.; Roy, C. Climate Change and Small Pelagic Fish; Cambridge University Press: Cambridge, UK, 2009; ISBN 978-0-521-88482-2. [Google Scholar]
  17. Silva, A.; Santos, M.B.; Caneco, B.; Pestana, G.; Porteiro, C.; Carrera, P.; Stratoudakis, Y. Temporal and Geographic Variability of Sardine Maturity at Length in the Northeastern Atlantic and the Western Mediterranean. ICES J. Mar. Sci. 2006, 63, 663–676. [Google Scholar] [CrossRef] [Green Version]
  18. Ganias, K. Determining the Indeterminate: Evolving Concepts and Methods on the Assessment of the Fecundity Pattern of Fishes. Fish. Res. 2013, 138, 23–30. [Google Scholar] [CrossRef]
  19. Ganias, K.; Lowerre-Barbieri, S.K.; Cooper, W. Understanding the Determinate–Indeterminate Fecundity Dichotomy in Fish Populations Using a Temperature Dependent Oocyte Growth Model. J. Sea Res. 2015, 96, 1–10. [Google Scholar] [CrossRef]
  20. Gordo, L.S.; Costa, A.; Abaunza, P.; Lucio, P.; Eltink, A.T.G.W.; Figueiredo, I. Determinate versus Indeterminate Fecundity in Horse Mackerel. Fish. Res. 2008, 89, 181–185. [Google Scholar] [CrossRef]
  21. Kjesbu, O.S.; Witthames, P.R. Evolutionary Pressure on Reproductive Strategies in Flatfish and Groundfish: Relevant Concepts and Methodological Advancements. J. Sea Res. 2007, 58, 23–34. [Google Scholar] [CrossRef]
  22. McBride, R.S.; Wuenschel, M.J.; Nitschke, P.; Thornton, G.; King, J.R. Latitudinal and Stock-Specific Variation in Size- and Age-at-Maturity of Female Winter Flounder, Pseudopleuronectes Americanus, as Determined with Gonad Histology. J. Sea Res. 2013, 75, 41–51. [Google Scholar] [CrossRef]
  23. GFCM. Working Group on Stock Assessment of Small Pelagic Species (WGSASP), Online Meeting, 17–22 January 2022. p. 65. Available online: https://www.fao.org/gfcm/technical-meetings/detail/en/c/1542569/ (accessed on 28 February 2023).
  24. GFCM. Establishment of Geographical Sub-Areas in the GFCM Area Amending the Resolution GFCM/31/2007/2; 23–27 March 2009; FAO: Rome, Italy, 2009. [Google Scholar]
  25. SIBM. Linee Guida per la Raccolta dei dati Biologici Sullo Stato delle Risorse da Pesca. Data Collection Framework, Commissione Europea; SIBM: Genova, Italy, 2010; p. 70. [Google Scholar]
  26. Basilone, G.; Barra, M.; Ferreri, R.; Mangano, S.; Pulizzi, M.; Giacalone, G.; Fontana, I.; Aronica, S.; Gargano, A.; Rumolo, P.; et al. First Annulus Formation in the European Anchovy; a Two-Stage Approach for Robust Validation. Sci. Rep. 2020, 10, 1079. [Google Scholar] [CrossRef] [Green Version]
  27. Basilone, G.; Mangano, S.; Pulizzi, M.; Fontana, I.; Giacalone, G.; Ferreri, R.; Gargano, A.; Aronica, S.; Barra, M.; Genovese, S.; et al. European Anchovy (Engraulis Encrasicolus) Age Structure and Growth Rate in Two Contrasted Areas of the Mediterranean Sea: The Paradox of Faster Growth in Oligotrophic Seas. Mediterr. Mar. Sci. 2017, 18/3, 504–516. [Google Scholar] [CrossRef] [Green Version]
  28. ICES. Report of the Workshop on Age Estimation of European Anchovy (Engraulis Encrasicolus); WKARA2 2016 Report 28 November–2 December 2016. Pasaia, Spain. ICES CM 2016/SSGIEOM:17. 2017, p. 223. Available online: https://ices-library.figshare.com/articles/report/Report_of_the_Workshop_on_Age_estimation_of_European_anchovy_Engraulis_encrasicolus_/18615329 (accessed on 28 February 2023).
  29. Villamor, B.; Uriarte, A.; Basilone, G. Report of Otolith Exchange Analysis for Anchovy. ICES CM 2018/EOSG:07. 2018, p. 95. Available online: https://smartdots.ices.dk/sampleImages/2018/81/Anchovy%20Exchange%202018%20report_FINAL_20032019.pdf (accessed on 28 February 2023).
  30. ICES. Report of the Working Group on Acoustic and Egg Surveys for Sardine and Anchovy in ICES Areas 7, 8, and 9. WGACEGG Report 2016 Capo, Granitola, Sicily, Italy, 14–18 November 2016. ICES CM 2016/SSGIEOM:31. 2017, p. 326. Available online: https://ices-library.figshare.com/articles/report/Report_of_the_Working_Group_on_Acoustic_and_Egg_Surveys_for_Sardine_and_Anchovy_in_ICES_Areas_7_8_and_9_WGACEGG_/18615275 (accessed on 28 February 2023).
  31. Campana, S.E. Accuracy, Precision and Quality Control in Age Determination, Including a Review of the Use and Abuse of Age Validation Methods. J. Fish Biol. 2001, 59, 197–242. [Google Scholar] [CrossRef]
  32. Catalán, I.A.; Alós, J.; Díaz-Gil, C.; Pérez-Mayol, S.; Basterretxea, G.; Morales-Nin, B.; Palmer, M. Potential Fishing-Related Effects on Fish Life History Revealed by Otolith Microchemistry. Fish. Res. 2018, 199, 186–195. [Google Scholar] [CrossRef]
  33. Gislason, H.; Daan, N.; Rice, J.C.; Pope, J.G. Size, Growth, Temperature and the Natural Mortality of Marine Fish: Natural Mortality and Size. Fish Fish. 2010, 11, 149–158. [Google Scholar] [CrossRef]
  34. R Core Team. R: A Language and Environment for Statistical Computing; R Foundation for Statistical Computing: Vienna, Austria, 2022. [Google Scholar]
  35. Erdogan, Z.; Torcu-Koç, H.; Gicili, S.; Ulunehir, G. Age, Growth and Mortality of European Pilchard, Sardina Pilchardus in Edremit Bay (Northern Aegean Sea, Turkey). Cybium 2010, 34, 185–193. [Google Scholar]
  36. Alemany, F.; Álvarez, F. Growth Differences among Sardine (Sardina Pilchardus Walb.) Populations in Western Mediterranean. Sci. Mar. 1993, 57, 229–234. [Google Scholar]
  37. Gaamour, A.; Khemiri, S. Evaluation of Growth Differences in Populations of Sardina Pilchardus (Walbum, 1792) from Two Regions along the Tunisian Costs. Cah. Biol. Mar. 2010, 51, 101–108. [Google Scholar] [CrossRef]
  38. Silva, A.; Carrera, P.; Massé, J.; Uriarte, A.; Santos, M.B.; Oliveira, P.B.; Soares, E.; Porteiro, C.; Stratoudakis, Y. Geographic Variability of Sardine Growth across the Northeastern Atlantic and the Mediterranean Sea. Fish. Res. 2008, 90, 56–69. [Google Scholar] [CrossRef] [Green Version]
  39. ICES. Workshop on Age Validation Studies of Small Pelagic Species (WKVALPEL). Sci. Rep. 2020, 2, 76pp. [Google Scholar] [CrossRef]
  40. Tsikliras, A.C.; Koutrakis, E.T. Growth and Reproduction of European Sardine, Sardina Pilchardus (Pisces: Clupeidae), in Northeastern Mediterranean. Cah. Biol. Mar. 2013, 54, 365–374. [Google Scholar]
  41. Basilone, G.; Guisande, C.; Patti, B.; Mazzola, S.; Cuttitta, A.; Bonanno, A.; Kallianiotis, A. Linking Habitat Conditions and Growth in the European Anchovy (Engraulis Encrasicolus). Fish. Res. 2004, 68, 9–19. [Google Scholar] [CrossRef]
  42. Antonakakis, K.; Giannoulaki, M.; Machias, A.; Somarakis, S.; Sanchez, S.; Ibaibarriaga, L.; Uriarte, A. Assessment of the Sardine (Sardina Pilchardus Walbaum, 1792) Fishery in the Eastern Mediterranean Basin (North Aegean Sea). Mediterr. Mar. Sci. 2011, 12, 333. [Google Scholar] [CrossRef] [Green Version]
  43. Brosset, P.; Fromentin, J.-M.; Van Beveren, E.; Lloret, J.; Marques, V.; Basilone, G.; Bonanno, A.; Carpi, P.; Donato, F.; Čikeš Keč, V.; et al. Spatio-Temporal Patterns and Environmental Controls of Small Pelagic Fish Body Condition from Contrasted Mediterranean Areas. Prog. Oceanogr. 2017, 151, 149–162. [Google Scholar] [CrossRef] [Green Version]
  44. Hattab, T.; Gucu, A.; Ventero, A.; De Felice, A.; Machias, A.; Saraux, C.; Gašparević, D.; Basilone, G.; Costantini, I.; Leonori, I.; et al. Temperature Strongly Correlates with Regional Patterns of Body Size Variation in Mediterranean Small Pelagic Fish Species. Mediterr. Mar. Sci. 2021, 22, 800. [Google Scholar] [CrossRef]
  45. Menu, C.; Pecquerie, L.; Bacher, C.; Doray, M.; Hattab, T.; van der Kooij, J.; Huret, M. Testing the Bottom-up Hypothesis for the Decline in Size of Anchovy and Sardine across European Waters through a Bioenergetic Modeling Approach. Prog. Oceanogr. 2023, 210, 102943. [Google Scholar] [CrossRef]
  46. Saraux, C.; Van Beveren, E.; Brosset, P.; Queiros, Q.; Bourdeix, J.-H.; Dutto, G.; Gasset, E.; Jac, C.; Bonhommeau, S.; Fromentin, J.-M. Small Pelagic Fish Dynamics: A Review of Mechanisms in the Gulf of Lions. Deep Sea Res. Part II Top. Stud. Oceanogr. 2019, 159, 52–61. [Google Scholar] [CrossRef]
  47. Dimarchopoulou, D.; Tsikliras, A.C. Linking Growth Patterns to Sea Temperature and Oxygen Levels across European Sardine (Sardina Pilchardus) Populations. Environ. Biol. Fishes 2022, 105, 1335–1345. [Google Scholar] [CrossRef]
  48. Quinn, T.J.; Deriso, R.B. Quantitative Fish Dynamics; Oxford University Press: Oxford, UK, 1999; ISBN 0-19-536040-0. [Google Scholar]
  49. Kenchington, T.J. Natural Mortality Estimators for Information-Limited Fisheries. Fish Fish. 2014, 15, 533–562. [Google Scholar] [CrossRef]
  50. Executive Agency for Small and Medium sized Enterprises. SPELMED, Evaluation of the Population Status and Specific Management Alternatives for the Small Pelagic Fish Stocks in the Northwestern Mediterranean Sea; Publications Office of the European Union: Luxembourg, 2020; Volume 89. [CrossRef]
  51. Pertierra, J.P.; Perrotta, R.G. On the Population Dynamics of Sardine, Sardina Pilchardus, from the Catalan Sea (North-Western Mediterranean Sea). Sci. Mar. 1993, 57, 235–241. [Google Scholar]
  52. Silva, A.; Garrido, S.; Ibaibarriaga, L.; Pawlowski, L.; Riveiro, I.; Marques, V.; Ramos, F.; Duhamel, E.; Iglesias, M.; Bryère, P.; et al. Adult-Mediated Connectivity and Spatial Population Structure of Sardine in the Bay of Biscay and Iberian Coast. Deep Sea Res. Part II Top. Stud. Oceanogr. 2019, 159, 62–74. [Google Scholar] [CrossRef]
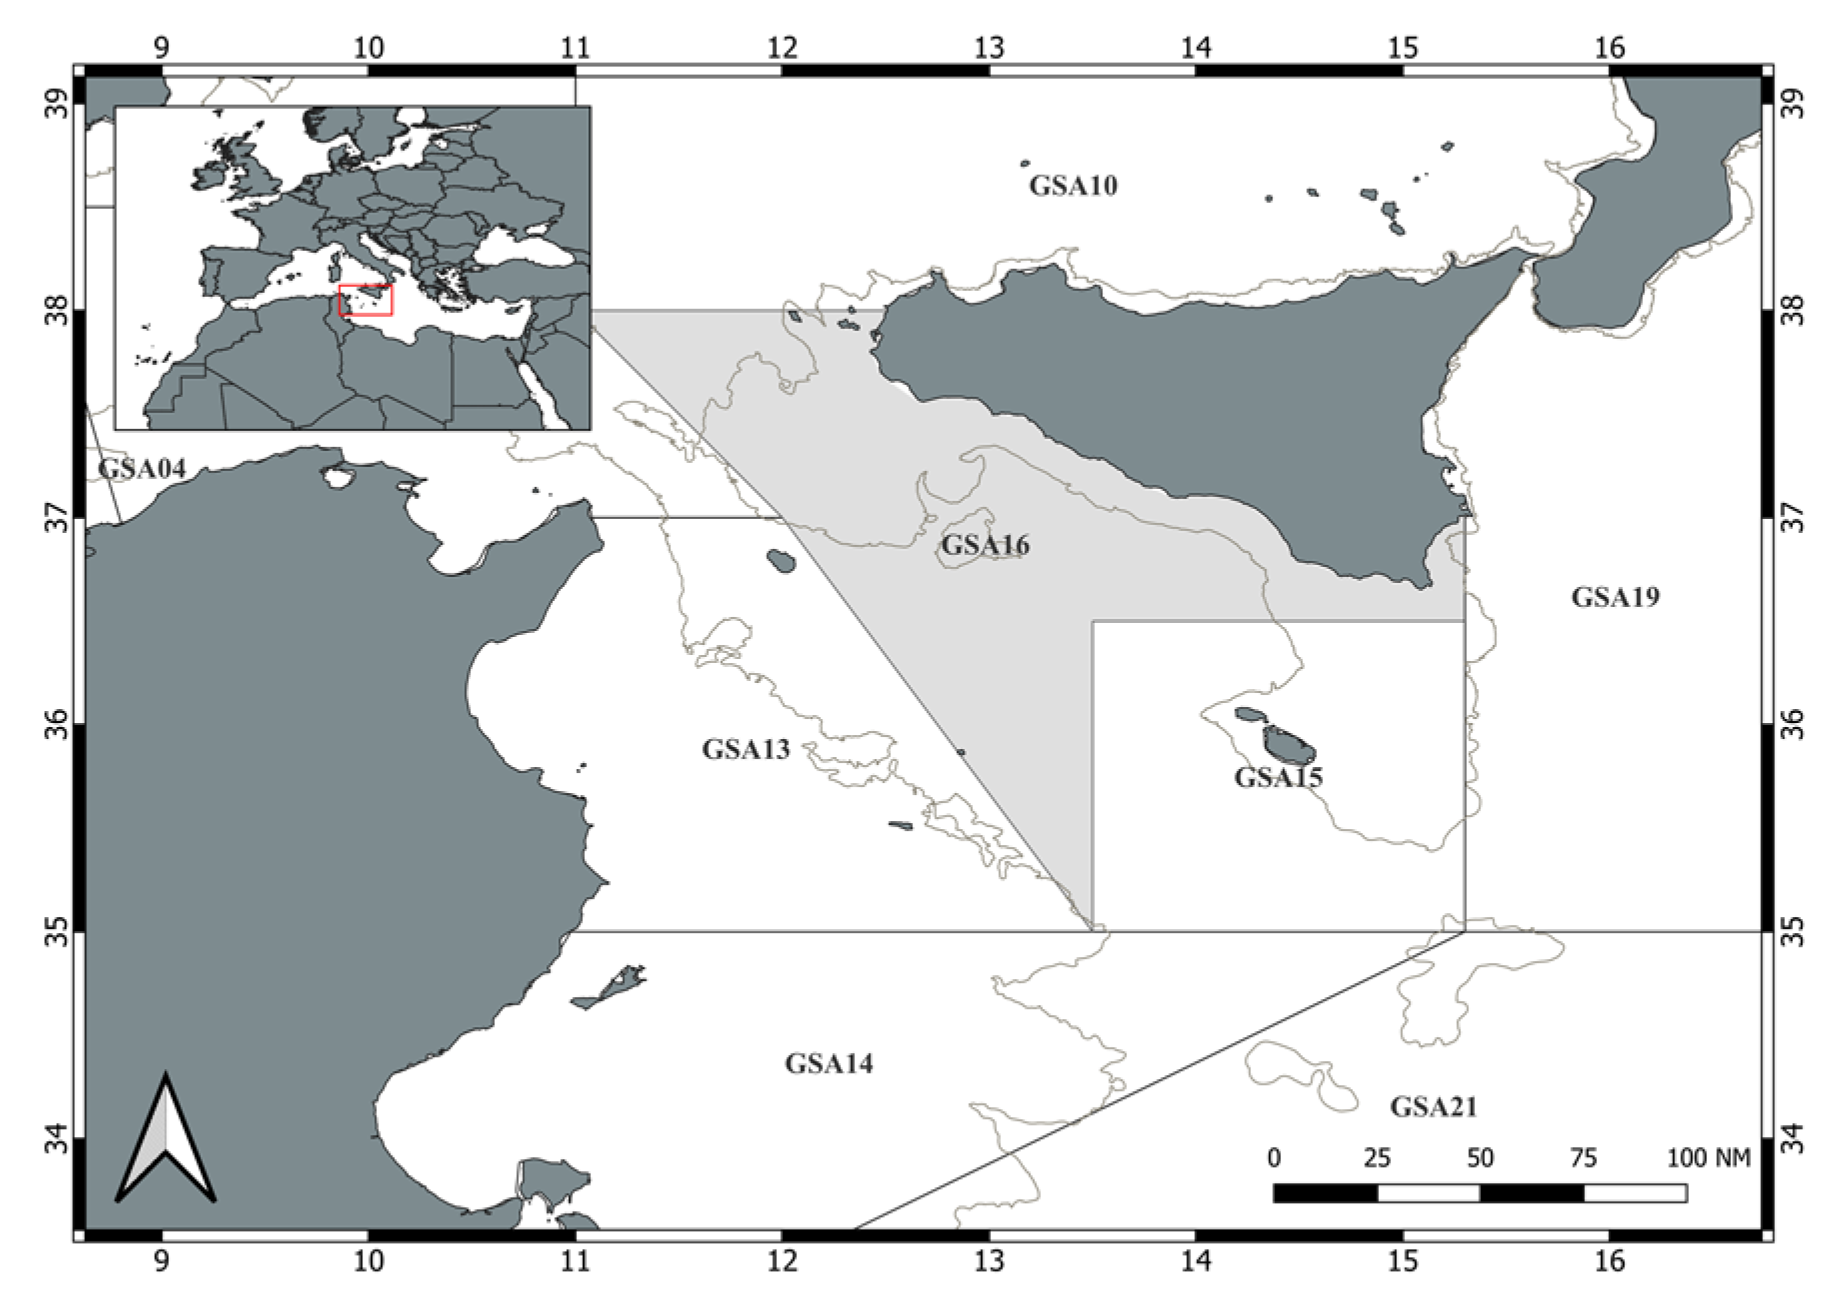
Figure 1. Strait of Sicily (GSA 16) map with the study area (shadowed). The grey line represents the 250 m isobath.
Fishes 08 00202 g001
Figure 2. Boxplot of sardine total length categorized by gear (PS: purse seine; PTM: pelagic pair trawl). The average total length (cm) is reported for each year and gear.
Fishes 08 00202 g002
Figure 3. Plot of the proportion of hyaline (H) edges for the Age 1 class by month.
Fishes 08 00202 g003
Figure 4. Temporal trend in the average length (Total length, TL in mm) per age class during the study period.
Fishes 08 00202 g004
Figure 5. The age-length key (ALK) for sardine estimated during the study period (11 years: 2009–2019). Total length (TL) is in cm.
Fishes 08 00202 g005
Figure 6. Length-age comparison plot of areas along an east-west longitudinal gradient from the otolith-based literature selection and current study results: Black Sea [35]; North Aegean Sea [36]; North and South Tunisia [37]; South of Sicily males and females (present study); Gulf of Lyon, Catalunya, Valencia, Alicante, Gulf of Vera Alboran Sea [36]; Bay of Biscay Eastern Atlantic [38]. * The values from Black Sea and Tunisian waters were converted from fork to total length (TL) for comparison purposes, using the total vs. fork length linear relationship obtained by present study data (TL = 1.1502 × fork length + 3.3413; r2 = 0.98).
Fishes 08 00202 g006
Figure 7. Sardine natural mortality (M) in GSA 16 based on Bayesian VBG parameters of selected years (2009–2015 excluding 2011): mean values, and lower and upper confidence intervals when uncertainty about the estimates of VBGP is propagated in the estimation of natural mortality using Gislason’s Second Estimator.
Fishes 08 00202 g007
Table 1. Number of fish sampled per month for age reading purposes along the study period.
Month20092010201120122013201420152016201720182019Total
January 44 198 242
February50 45 5849 49 251
March377932662758776456 39535
April44353127 5352 30272
May 37 52 3111264107 30433
June35412818 496162 30324
July 44 3153119 247
August 8568 6364 280
September9043963476766065 30570
October53 404435163 40375
November45643343468982 23470 706
December 40 9877 7613539465
Total3543392644542615257976895742052384700
Table 2. Distribution and availability of biological samples collected from landings per quarter (1 to 4), gear (PS: purse seine; PTM: mid-water pelagic trawl) and year (2009 to 2019).
QuarterGear20092010201120122013201420152016201720182019
IPS2232 222 1
II2231 13 2 2
III2 52311 1
IV4123353 31
IPTM11 112212
II44 3 332 1
III45 34434
IV 3 16 1
Table 3. Linear regression carried out to detect TL trends among years by Age. Estimated coefficients for each linear regression model were provided together with the F statistics for each age class.
Age ClassCoefficientEstimateStd. Errort ValuePr
(>|t|)
F Valued.fp-Value
0(Intercept)−1729.61370.56−4.675 × 10−624.841, 2881.1 × 10−6
Year0.920.184.98 1 × 10⁻⁶
1(Intercept)−106.31134.32−0.794 × 10−13.211, 27700.07331
Year0.120.071.797 × 10−2
2(Intercept)1957.48209.919.33<2 × 10-1674.161, 1410<2 × 10⁻¹⁶
Year−0.900.10−8.61<2 × 10-16
3(Intercept)2842.05627.154.539 × 10−618.211, 2262.91 × 10−5
Year−1.330.31−4.273 × 10⁻⁵
Table 4. Proportions (%) of individuals by age per sampling year (2009–2019) and average over the whole study period.
Age
Year0123
20091572913
2010665263
2011127639
2012960293
20132274922
2014852345
2015363305
2016960310
2017775170
2018187480
2019768232
Average659305
Table 5. VBG Bayesian approach parameter estimates by year. The upper quartile of the Bayesian credibility intervals (2.5%; 97.5%) to the mean estimate ratio, expressed in percentage (itv%).
YearLinf (mm)t0 (Years) K (Years−1)Linf itvt0 itvk itvMean itv
2009197 (188; 205) −1.81(−1.99; −1.49) 0.43 (0.38; 0.53)8.6327.6234.1823.48
2010185 (176; 196)−1.9 (−2; −1.71)0.46 (0.39; 0.54)10.8115.2631.4419.17
2011188 (176; 199)−1.89 (−2; −1.61)0.43 (0.36; 0.54)12.2320.6341.2624.71
2012180 (172; 186)−1.96 (−2; −1.85)0.46 (0.42; 0.52)8.337.6522.2912.76
2013185 (176; 193)−1.9 (−2; −1.68)0.42 (0.37; 0.48)9.1916.8426.8217.62
2014173 (168; 178)−1.93 (−2; −1.8)0.56 (0.51; 0.62)5.7810.3619.7811.97
2015173 (168; 180)−1.94 (−2; −1.79)0.48 (0.43; 0.54)6.9410.8222.8913.55
2016151 (150; 154)−1.96 (−2; −1.85)0.73 (0.69; 0.78)2.657.6512.37.53
2017162 (158; 168)−1.94 (−2; −1.81)0.6 (0.53; 0.67)6.179.7922.9812.98
2018154 (150; 180)−1.88 (−2; −1.63)0.81 (0.49; 0.96)19.4819.6857.4632.21
2019169 (161; 175)−1.87(−1.98; −1.59)0.68 (0.56; 0.83)10.6520.8644.7425.42
Table 6. Bayesian VBG fitting of the selected years (2009–2015 excluding 2011), model parameter estimates with their standard error (sd), lower (LCI), and upper (UCI) confidence intervals.
ParameterMeansdLCI (2.5%)UCI (97.5%)
Linf cm181.1517.818.2
t0 year−1.990.018−2−1.95
K year−10.4590.0080.4480.474
Disclaimer/Publisher’s Note: The statements, opinions and data contained in all publications are solely those of the individual author(s) and contributor(s) and not of MDPI and/or the editor(s). MDPI and/or the editor(s) disclaim responsibility for any injury to people or property resulting from any ideas, methods, instructions or products referred to in the content.