Article

Age and Growth Characteristics of Okamejei kenojei in the West Sea of South Korea According to Coronal Vertebral Microstructure

1
West Sea Fisheries Research Institute, National Institute of Fisheries Science, Incheon 22383, Republic of Korea
2
Department of Aqualife Science, Chonnam National University, Yeosu 59626, Republic of Korea
*
Author to whom correspondence should be addressed.
Fishes 2023, 8(4), 197; https://doi.org/10.3390/fishes8040197
Submission received: 23 March 2023 / Revised: 3 April 2023 / Accepted: 5 April 2023 / Published: 10 April 2023
(This article belongs to the Section Biology and Ecology)

Abstract

:
In this study, the growth and age characteristics of Okamejei kenojei in the West Sea of South Korea were examined, and specimens were collected by bottom trawls from January to December 2019. The relationship between disc width (L) and body weight (W) was W = 6.1 × 10⁻³ L3.40. Age was determined by measuring annuli on the vertebral centrum surface, which forms around June every year. The spawning period was extrapolated from monthly changes of the gonadosomatic index in June–July. The relationship between the vertebral centrum radius and disc width, which was analyzed separately for females and males, was determined as L = 16.159R0.6145 and L = 15.543R0.6851, respectively. Finally, O. kenojei growth, that is, the disc width (L) at a certain age (t), was expressed using the von Bertalanffy growth equation as Lt = 58.70(1 − e−0.21(t+0.12)) for females and Lt = 53.94(1 − e−0.26(t+0.05)) for males. This study provides basic data on the age characteristics of O. kenojei for future research and more efficient fish stock management.
Key Contribution: Growth increments in the vertebrae are used to provide accurate age assessments of Okamejei kenojei in the West Sea of South Korea.

1. Introduction

The ocellate spot skate, Okamejei kenojei (Rajiformes: Rajidae), is a commercially important fish species that inhabits sandy or tidal flat-bottom habitats (depth: 20–100 m) in the Yellow Sea, East China Sea, East Sea of South Korea, and the Sea of Okhotsk. O. kenojei possesses a relatively short snout, wide cartilage that is not easily bent, a round spot at the base of each pectoral fin, with each spot encompassing one to several smaller brown spots, the ventral is white three and there are five rows of dorsal thorns on the tails of males and females, respectively [1].
Information on the age of fish is an important biological parameter for understanding dynamic changes in population growth as it is required to calculate the growth rate, mortality rate, and reproduction [2,3]. The most suitable aging structure may vary from species to species; therefore, the choice of a hard structure for age and growth estimation is vital [4]; age assessment can be divided into four methods: breeding, mark-recapture, estimation of body length composition data, and use of age traits, such as natural growth rings. The age and growth of fish are analyzed using scales, otoliths, vertebrae, and fin rays. Scales and otoliths are used in bony fish; however, if the fish has no scales or the otoliths are too small, vertebrae can be used instead [5], as in a previous study on the age and growth characteristics of Lophius litulon (Jordan, 1902) [6]. Since cartilaginous fish have degenerated scales and otoliths are small and easily broken, age cannot be determined using this structure, so age evaluation is performed using vertebrae. Age assessment using vertebrae includes age determination in Triakis semifasciata [7], age and sexual maturity in Platyrhina sinensis [8], and age and growth estimation in Leucoraja ocellata [9]. Age information is important for monitoring and managing fish stock. However, stock management based on inaccurate age assessments can seriously reduce fish populations; thus, it is crucial to increase the accuracy and precision of age assessment in fish. Precise and accurate fish age assessments require calculations of the agreement rate or coefficient of variation between age indicators and various validation approaches [10,11]. In addition, it is important to verify the entire range of ages, including immature individuals [12]. Verification of the first growth ring or annulus, is particularly important because the position of the first annulus represents the starting point for age assessment; thus, incorrect identification of the first annulus may lead to continuing errors in subsequent age readings. Unfortunately, the first annulus is not easily differentiated from structures that are not annuli, which easily leads to errors during age assessment [10].
Despite previous studies on the age and growth characteristics of species in the family Rajidae, including Raja binoculata, Raja rhina [13], and Raja clavata [14] in British Columbia waters, Beringraja pulchra [15] in the West Sea, and Dipturus kwangtungensis in the northern waters of Taiwan [16], no studies have analyzed the age and growth characteristics of O. kenojei. Moreover, current research on the ecology of O. kenojei is insufficient. Therefore, the aim of this study is to elucidate the growth and life history of O. kenojei. Specifically, we perform age assessments of specimens collected from the West Sea of South Korea using growth increments in the vertebrae. The findings of this study will provide basic data for the rational use and management of O. kenojei resources.

2. Materials and Methods

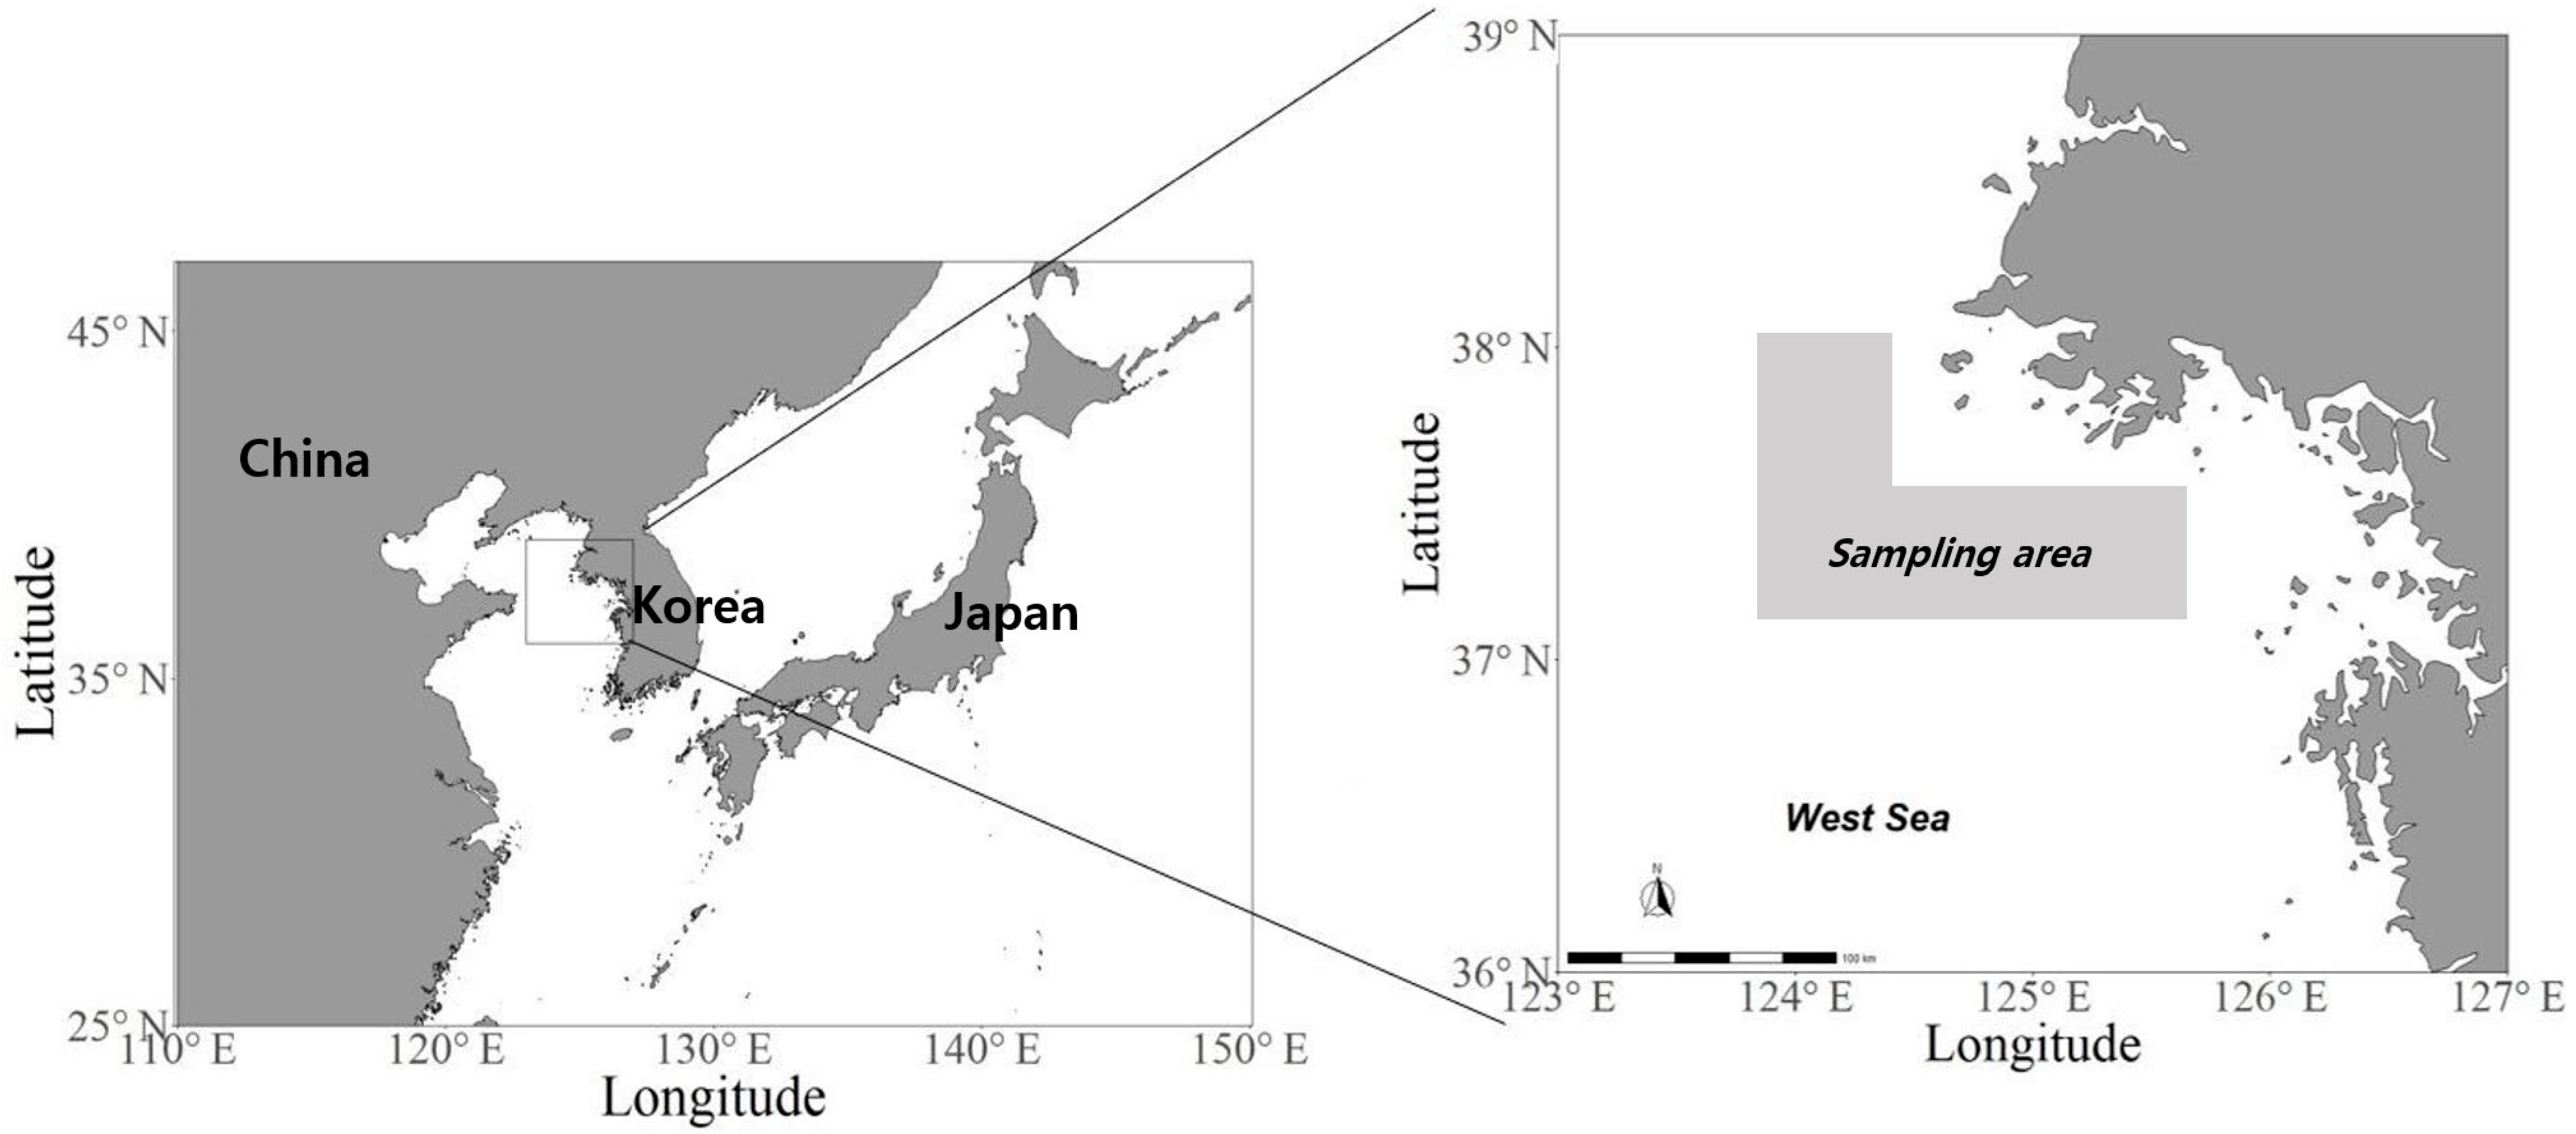
2.1. Fish Sample Collection

Specimens of O. kenojei (n = 651) were collected by large pair trawls from January to December 2019 in the West Sea of South Korea (Figure 1). Samples were then transported to the laboratory for subsequent analysis.

2.2. Analysis Method

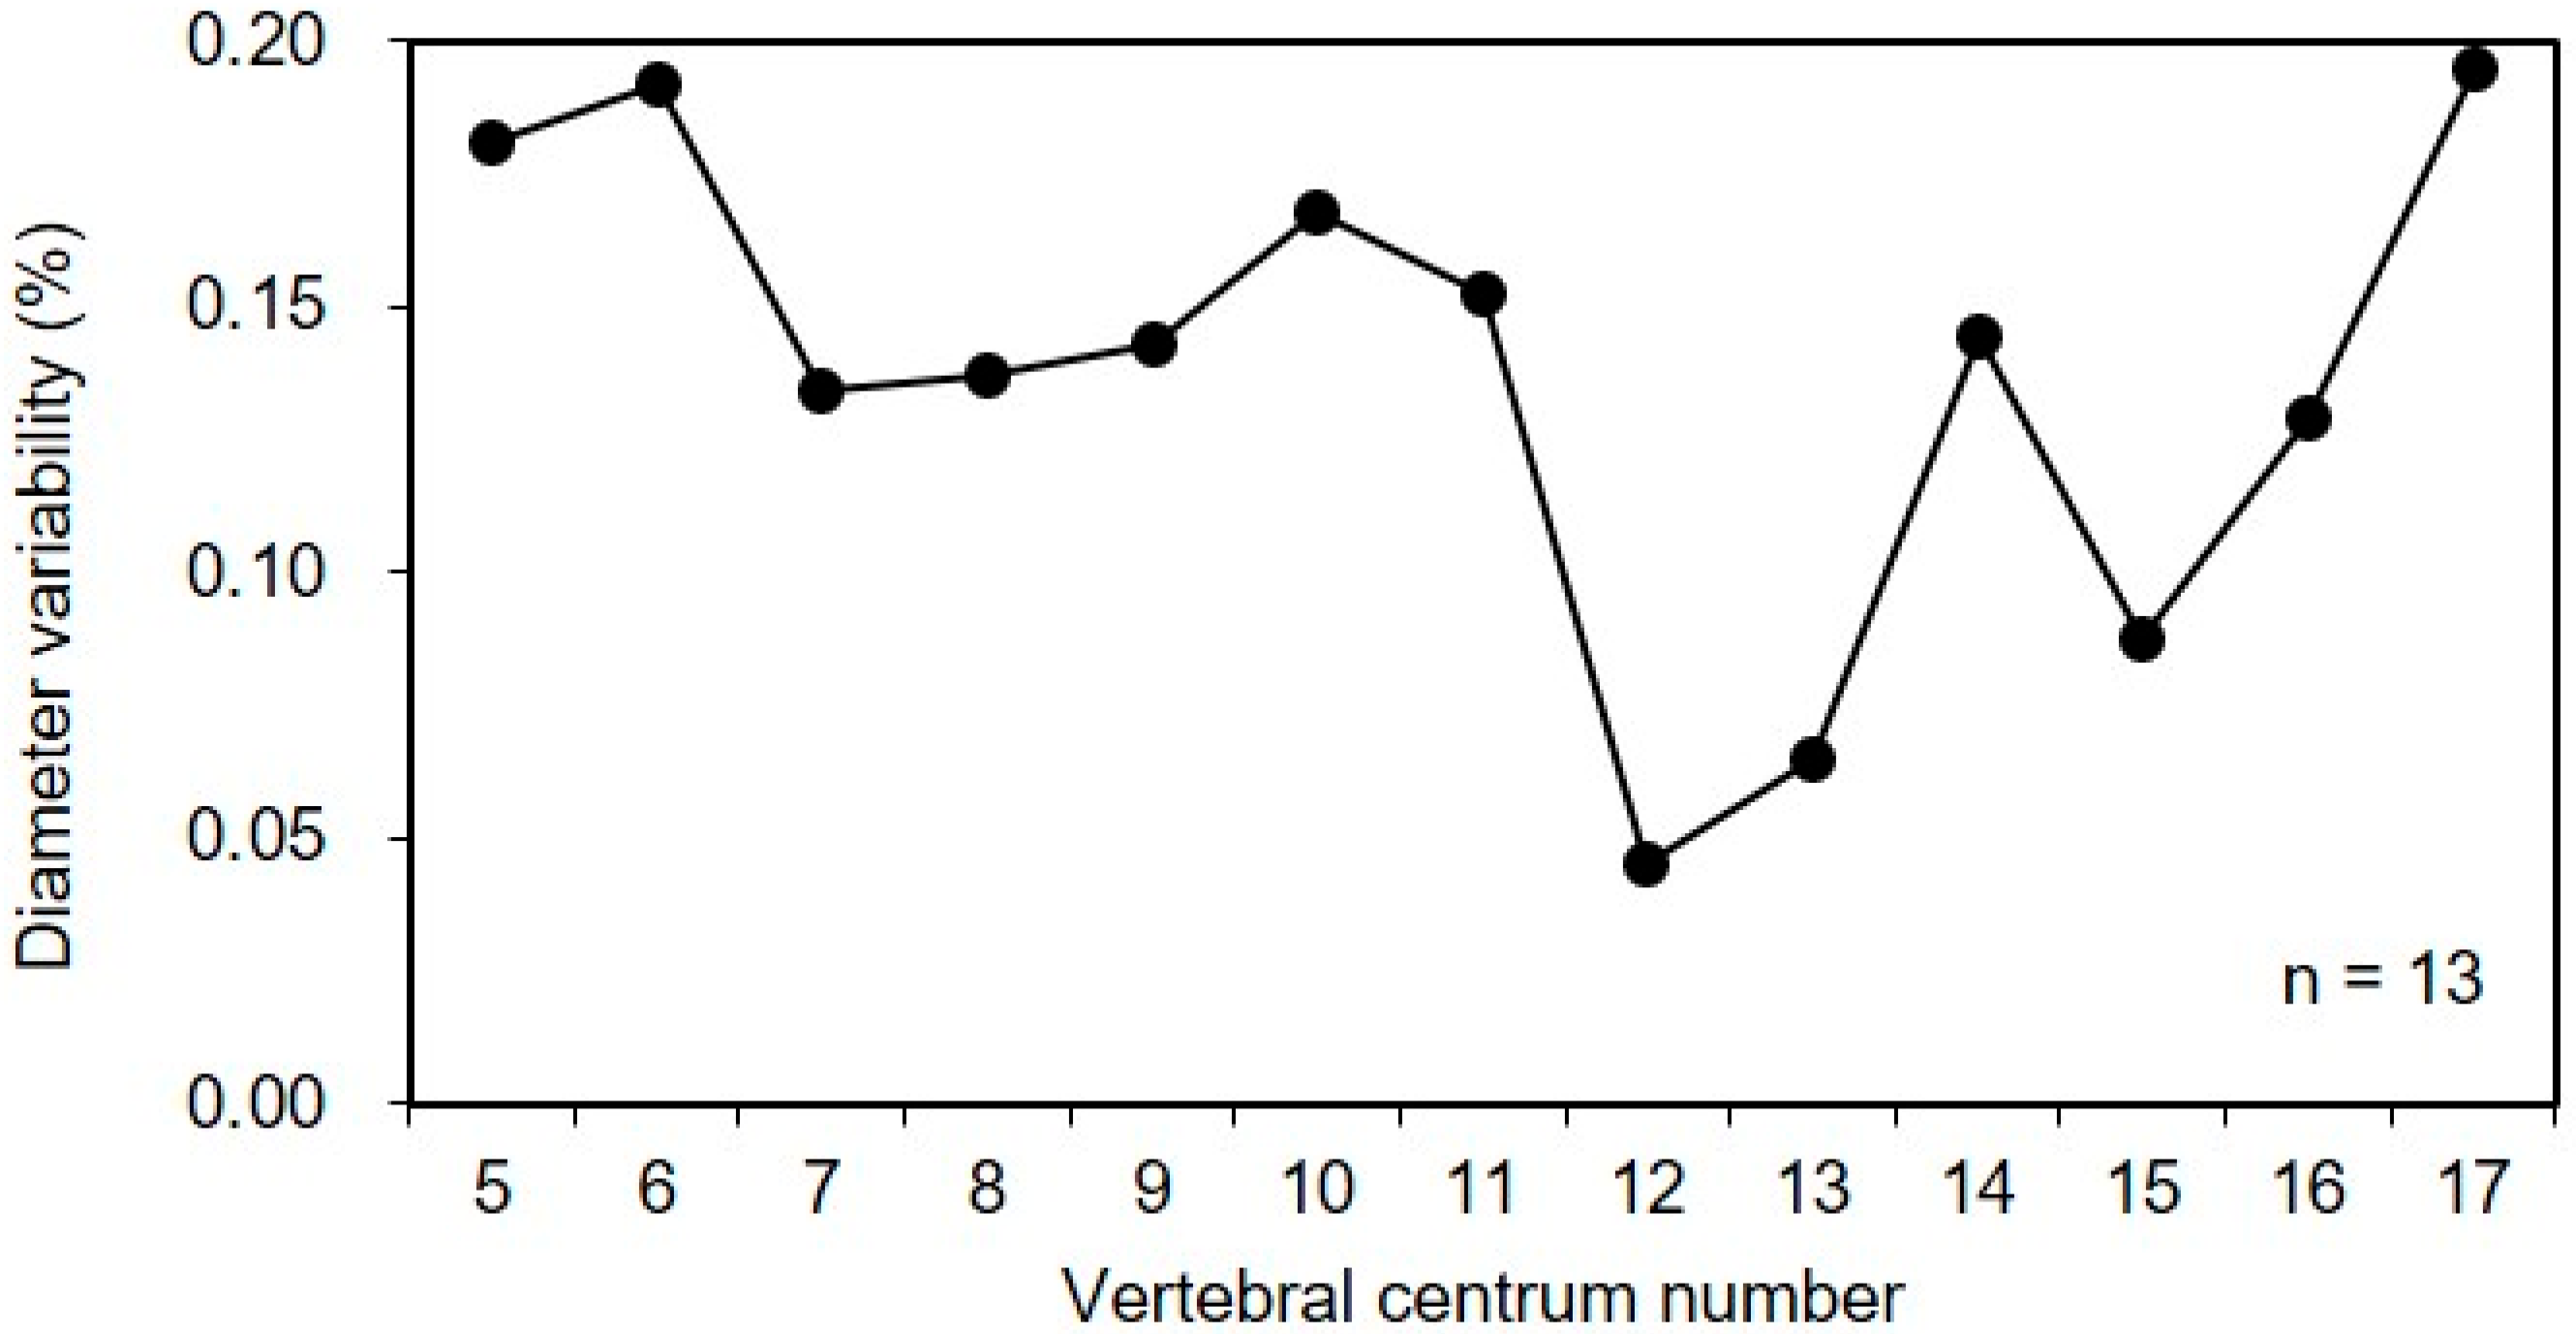
2.2.1. Measurement of Vertebrae Variability

To improve the reliability of the age indicator in this study (annual rings on the vertebrae), we analyzed the variance rate of vertebra size. The diameters of each vertebra were measured in 13 individuals, and the average diameter was obtained for each vertebra. Vertebra 12 exhibited the lowest mean variation in diameter and was used for subsequent age assessment (Figure 2).

2.2.2. Vertebrae Preprocessing

The vertebrae were boiled in boiling water for 5 min to remove large impurities, precipitated in a 4% KOH solution to remove the remaining flesh from the vertebrae, then dried. Each vertebral centrum was then stained with a mixture of Alizarin Red S and 70% ethanol at a concentration of 0.1% (w/v) for 5 min and then dried. The dried vertebral centra were placed in a mold after applying a mold release agent (Silicon Mold Release, BUEHLER Co., Lake Bluff, IL, USA). The molding solution, prepared using resin (Castolite Resin, BUEHLER Co.) and hardener (Castolite Hardener, BUEHLER Co.), was accommodated in a molding containing the vertebral centra and dried for 48 h or longer after removing bubbles using tweezers and pins. The molded vertebral centra were then ground to the center of the cross section with a grinder using sandpaper of various roughness values; the cross sections were polished using polishing powder to ensure accurate stain measurement.

2.2.3. Age Assessment and Verification

A stereo microscope (SZX16, Olympus, Tokyo, Japan) and image analysis program (i-Works 2.0, Nahwoo Trading Co., Daejeon, Republic of Korea) were used to measure the vertebral centrum radius (R) and the distance to each growth band (rn) in mm, and they were measured in three scenarios. A clear boundary was observed between opaque and transparent zones, and the long vertebral centrum radius was confirmed using measurements toward the head of the O. kenojei. The first growth band was designated as the first growth ring, and the beginning of each transparent zone was considered to represent a growth band. The vertebral centrum radius (R) was measured as the baseline distance from the focus of the vertebral centrum to the spine bone end. The distance from the focus to each growth band (rn) was determined along this baseline (Figure 3).

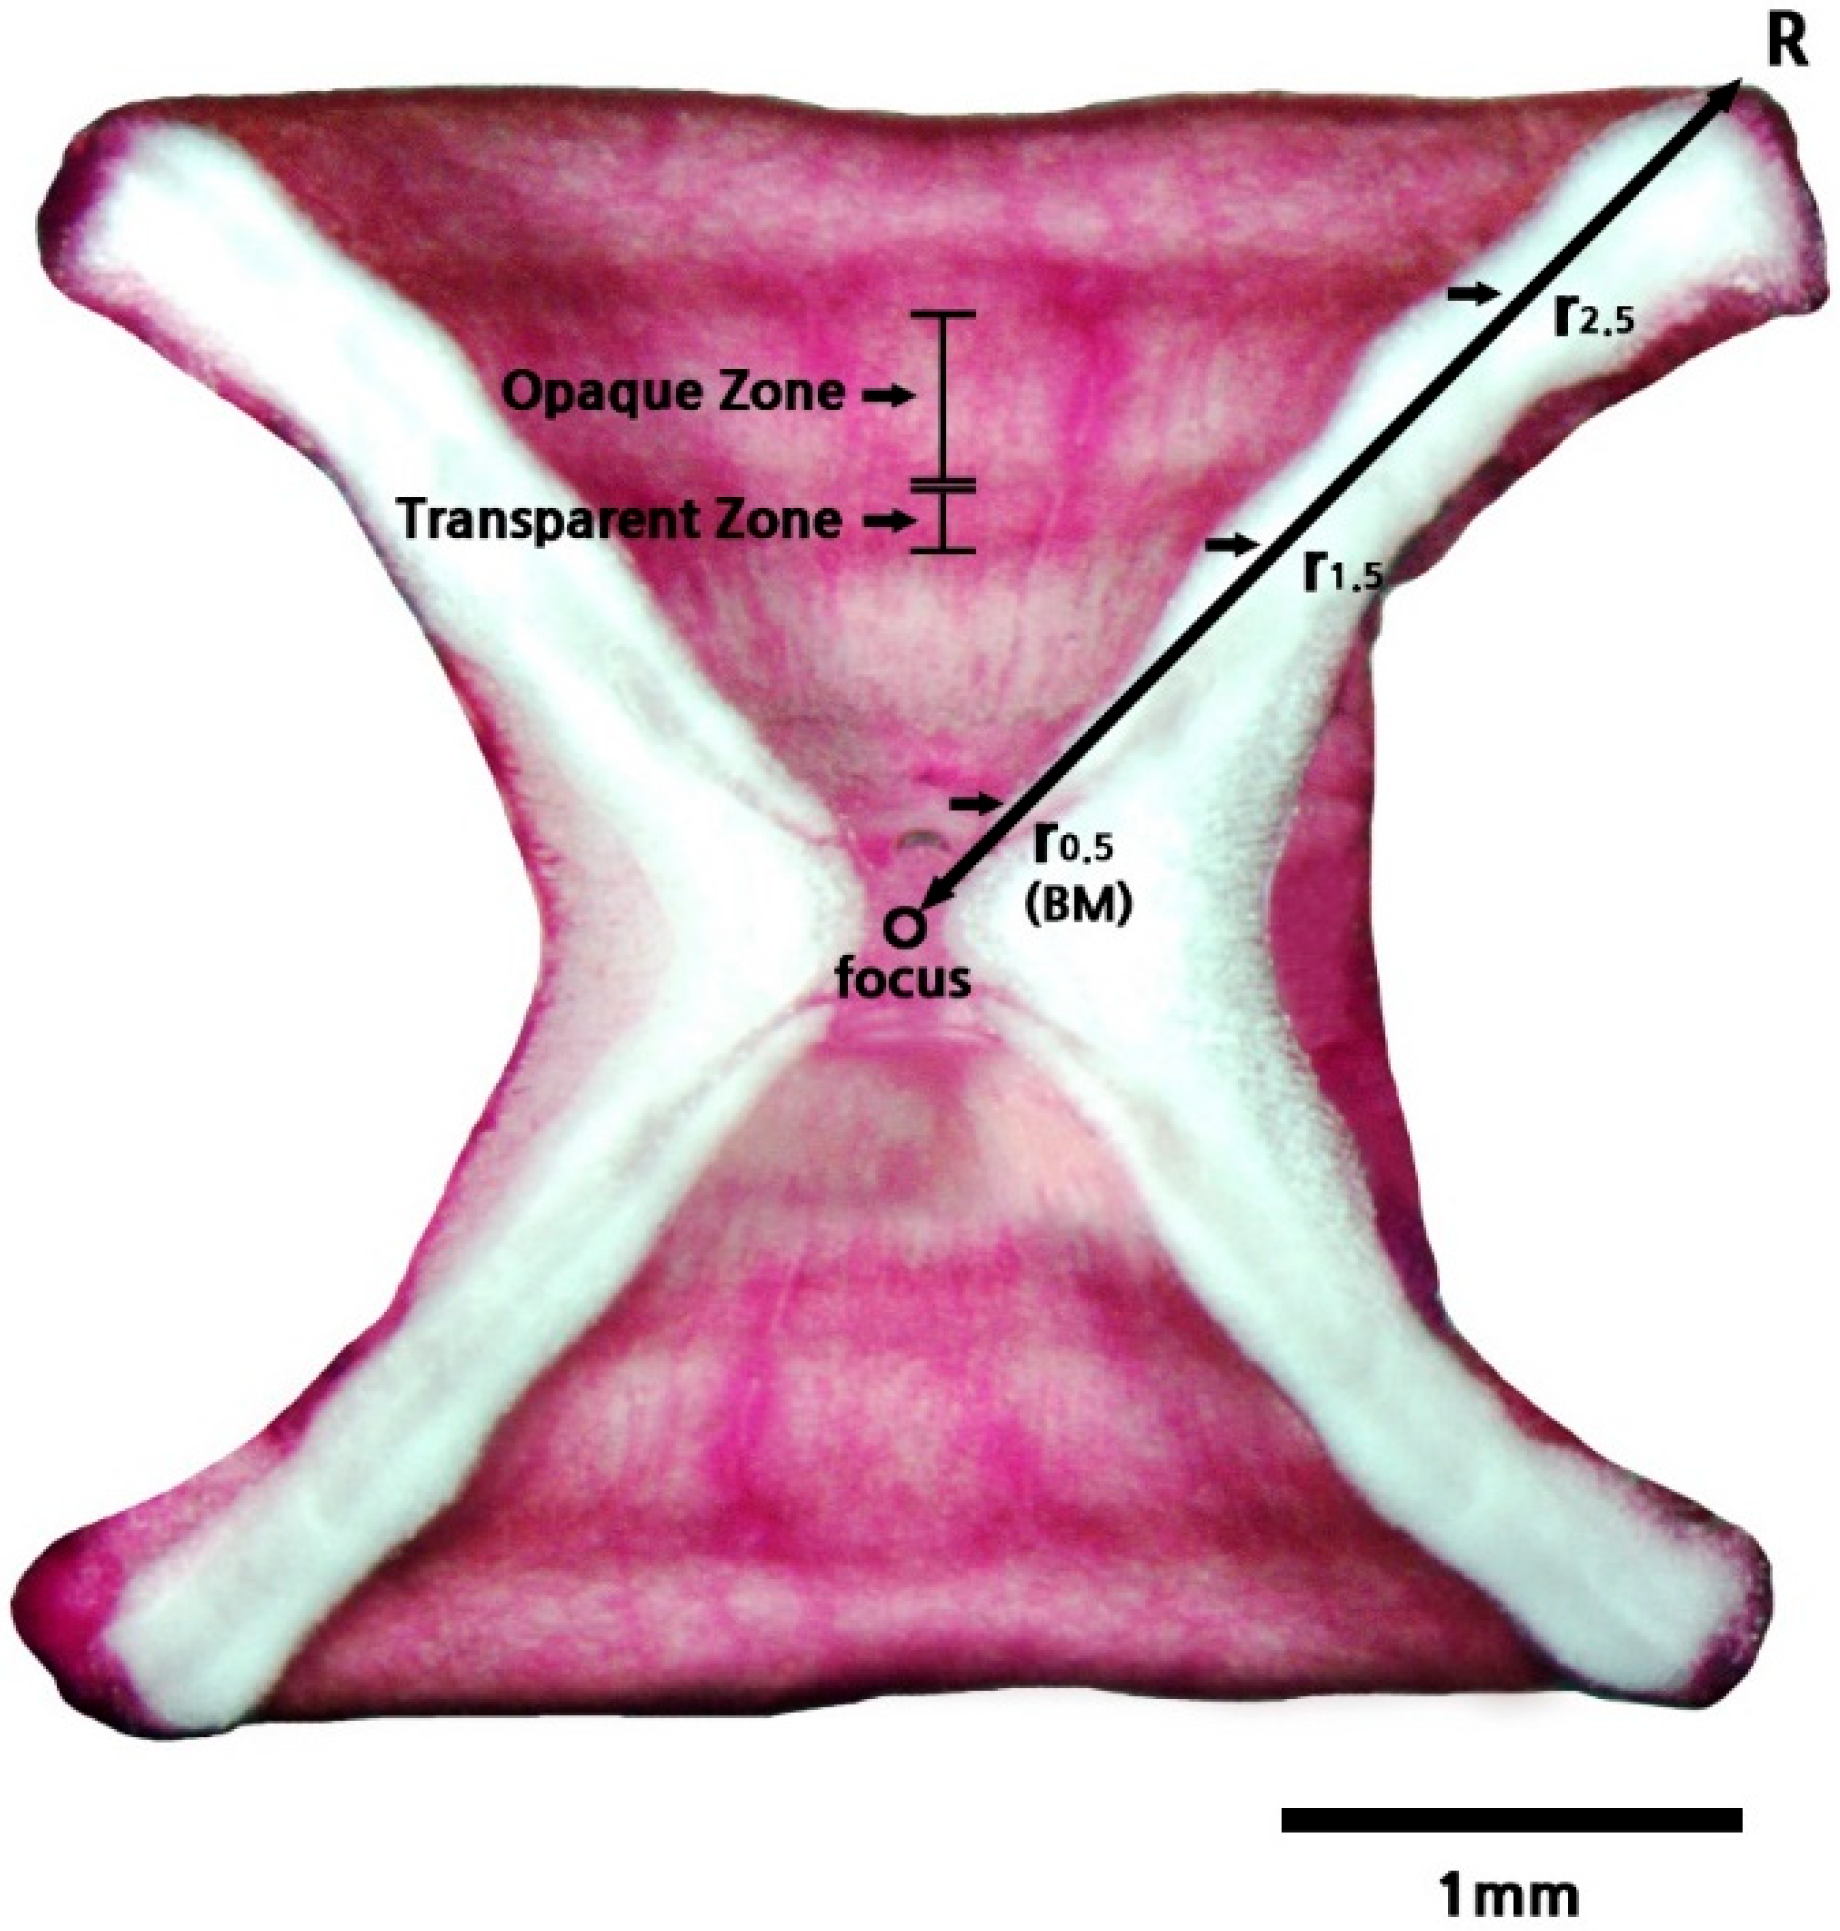
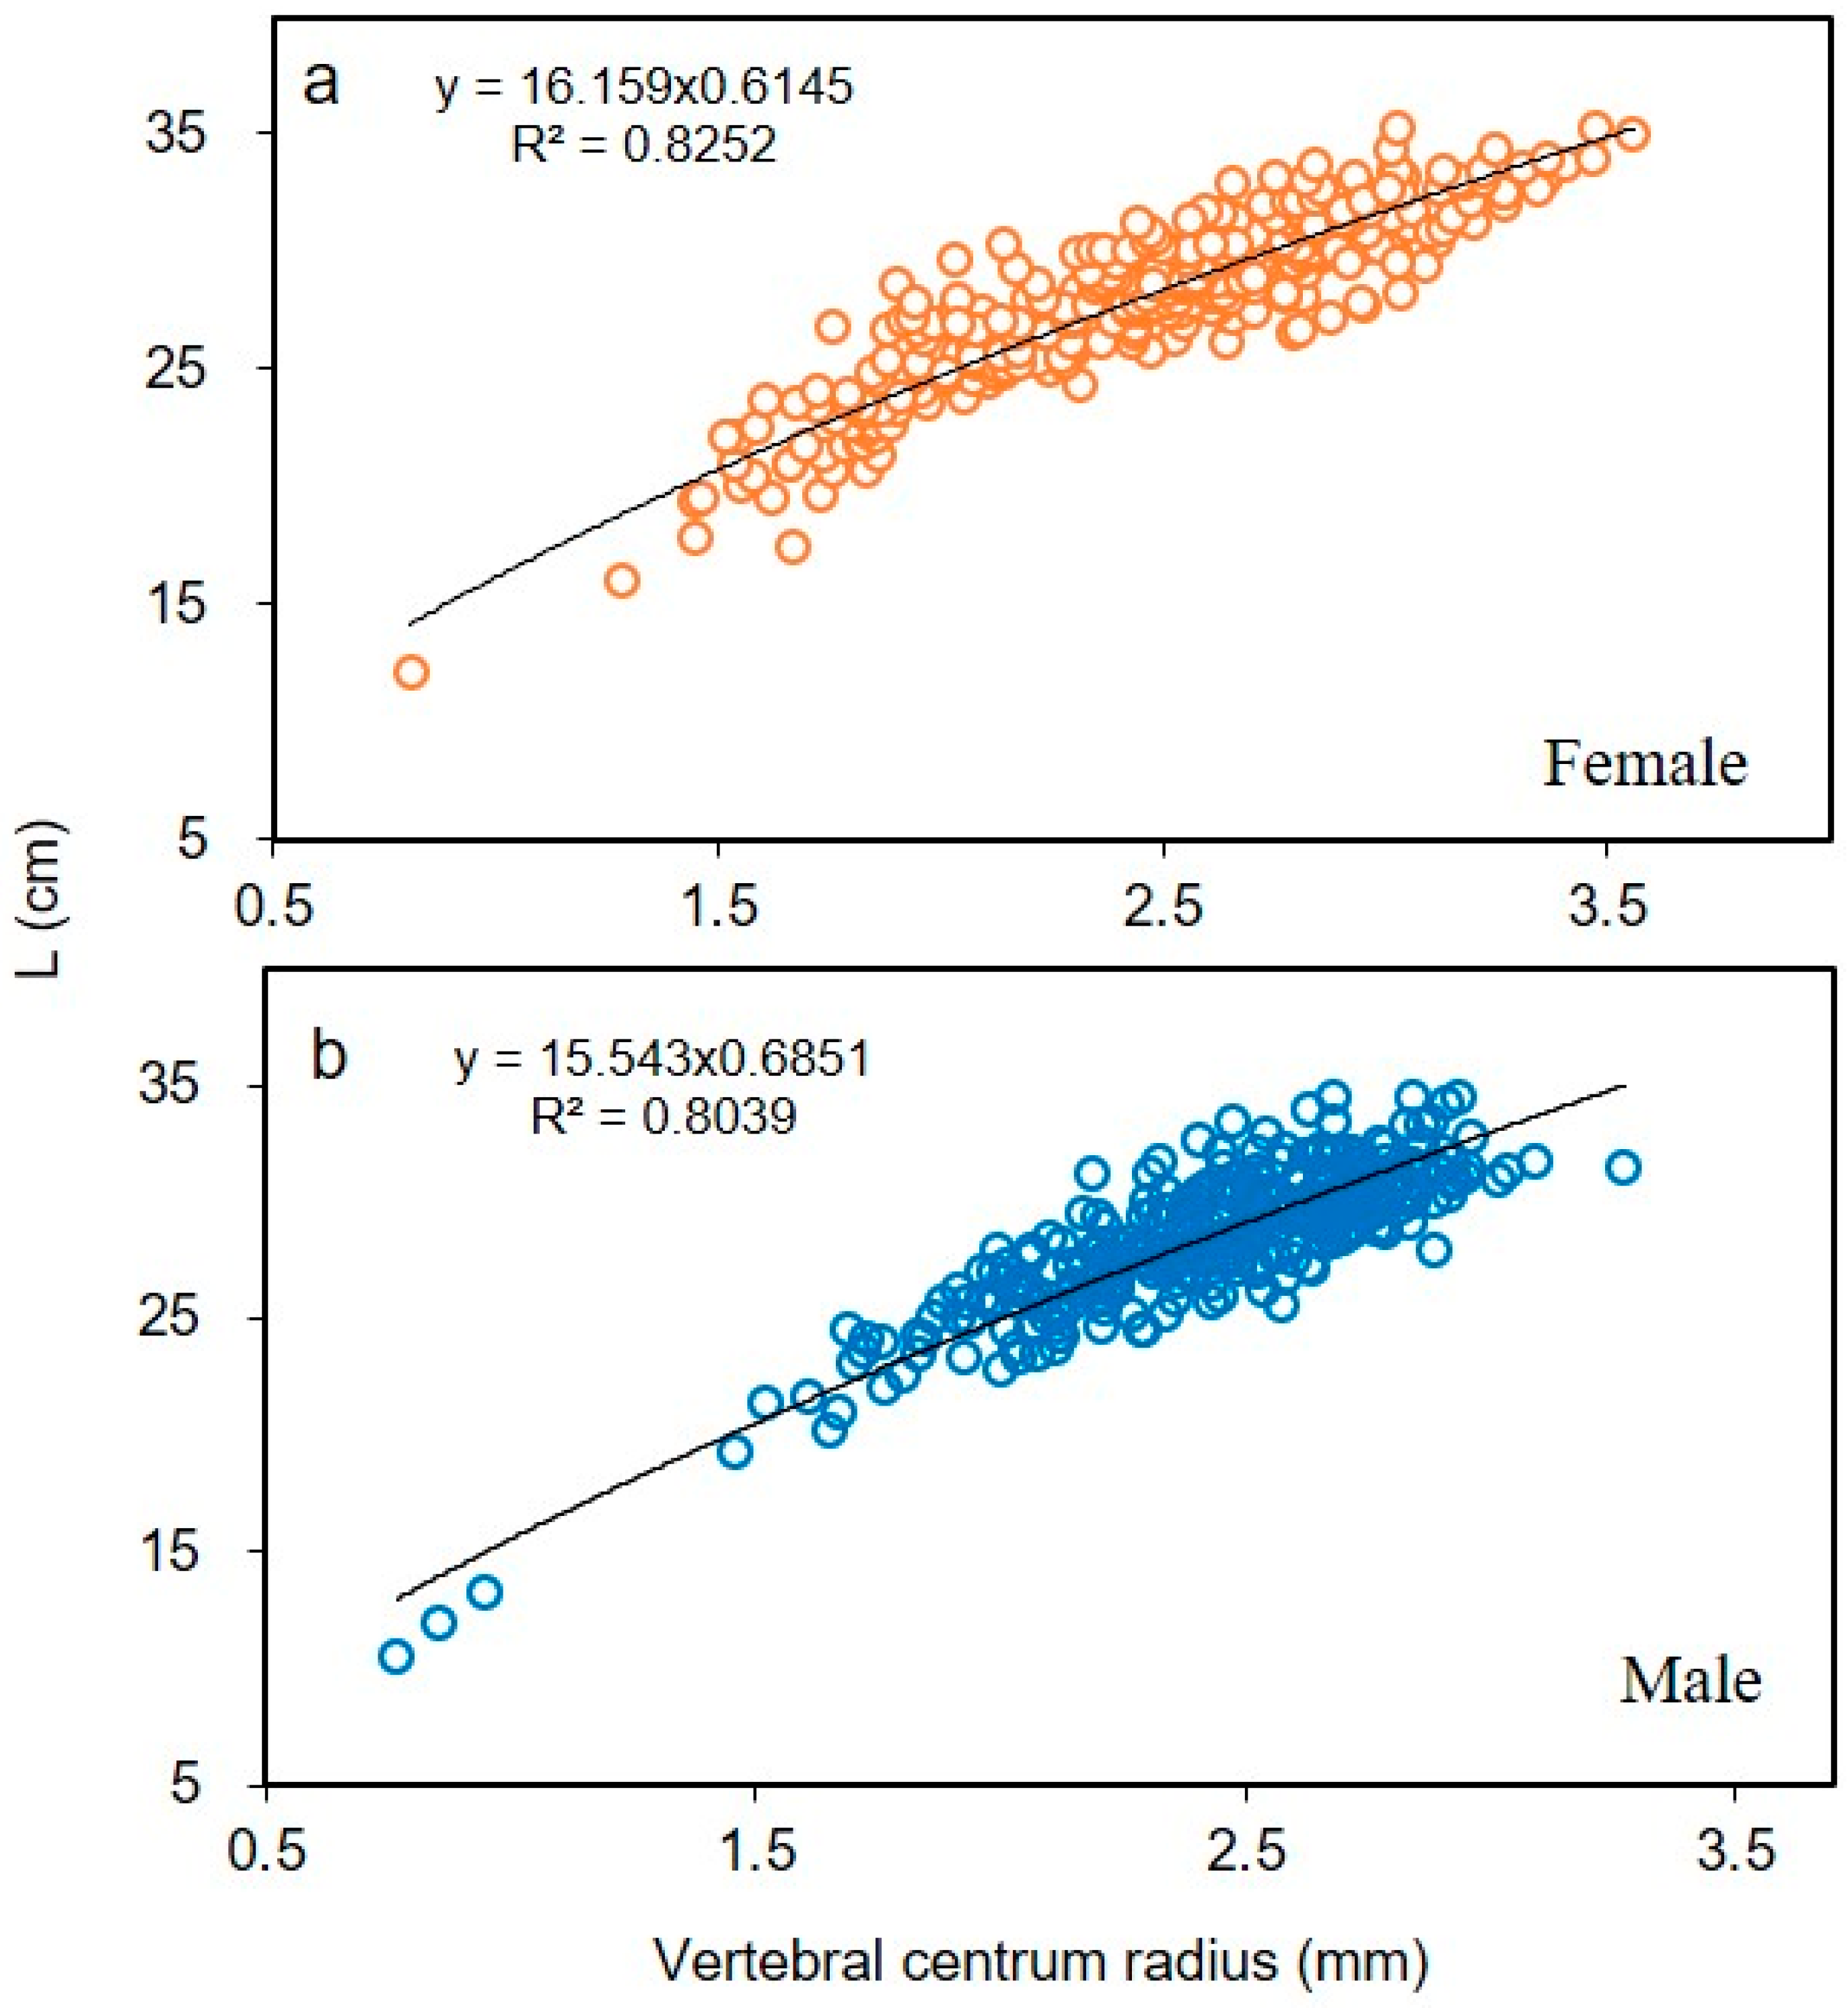
2.3. Identification of Growth Bands

To examine whether the identified growth bands were appropriate age traits for the age assessment of O. kenojei, we verified the agreement between the vertebral centrum radius and the distance from the focus to each growth band, then estimated the band formation time and number of bands according to monthly changes in the marginal index (MI):
M I = R r n r n r n 1
where R denotes the vertebral centrum radius, rn denotes the distance from the focus to the last growth band, and rn−1 denotes the n − 1st growth band.

2.4. Spawning Season

To confirm the relationship between the growth band formation period and the spawning period, we used the gonadosomatic index (GSI) of O. kenojei and egg capsule appearance data [17]. To estimate the spawning period, the disc width (L, 0.1 cm), body weight (BW, 0.1 g), and gonad weight (GW, 0.01 g) of each specimen were measured, and the monthly GSI was estimated as follows:
G S I = G W B W × 100

2.5. Growth Formula

The relationship between the vertebral body radius (R) and disc width (L) was expressed by the following equation:
L = a R b
The von Bertalanffy [18] growth model was used as the growth equation for O. kenojei (Equation (4)), along with the inverse average L:
L t   = L ( 1 e K t t 0 )
Here, Lt denotes the disc width at age t, L denotes the theoretical maximum disc width, Κ denotes the growth factor, and t0 denotes the theoretical age when the disc width is zero. A Microsoft Excel 2016 (Microsoft Inc., Washington, DC, USA) solver was used to determine the mature length value, and the constants were estimated by setting the GRG nonlinear least-squares method as the solution, the degree of convergence to 0.0001, the differential coefficient to the center, the population size to 100, and the random initial value to 0.

2.6. Statistical Analyses

To determine the statistical significance of the results, we performed ANOVA tests using the SPSS statistical program (SPSS Inc., Chicago, IL, USA). Differences were considered significant when p < 0.05 according to post-hoc Tukey’s (t) test.

3. Results

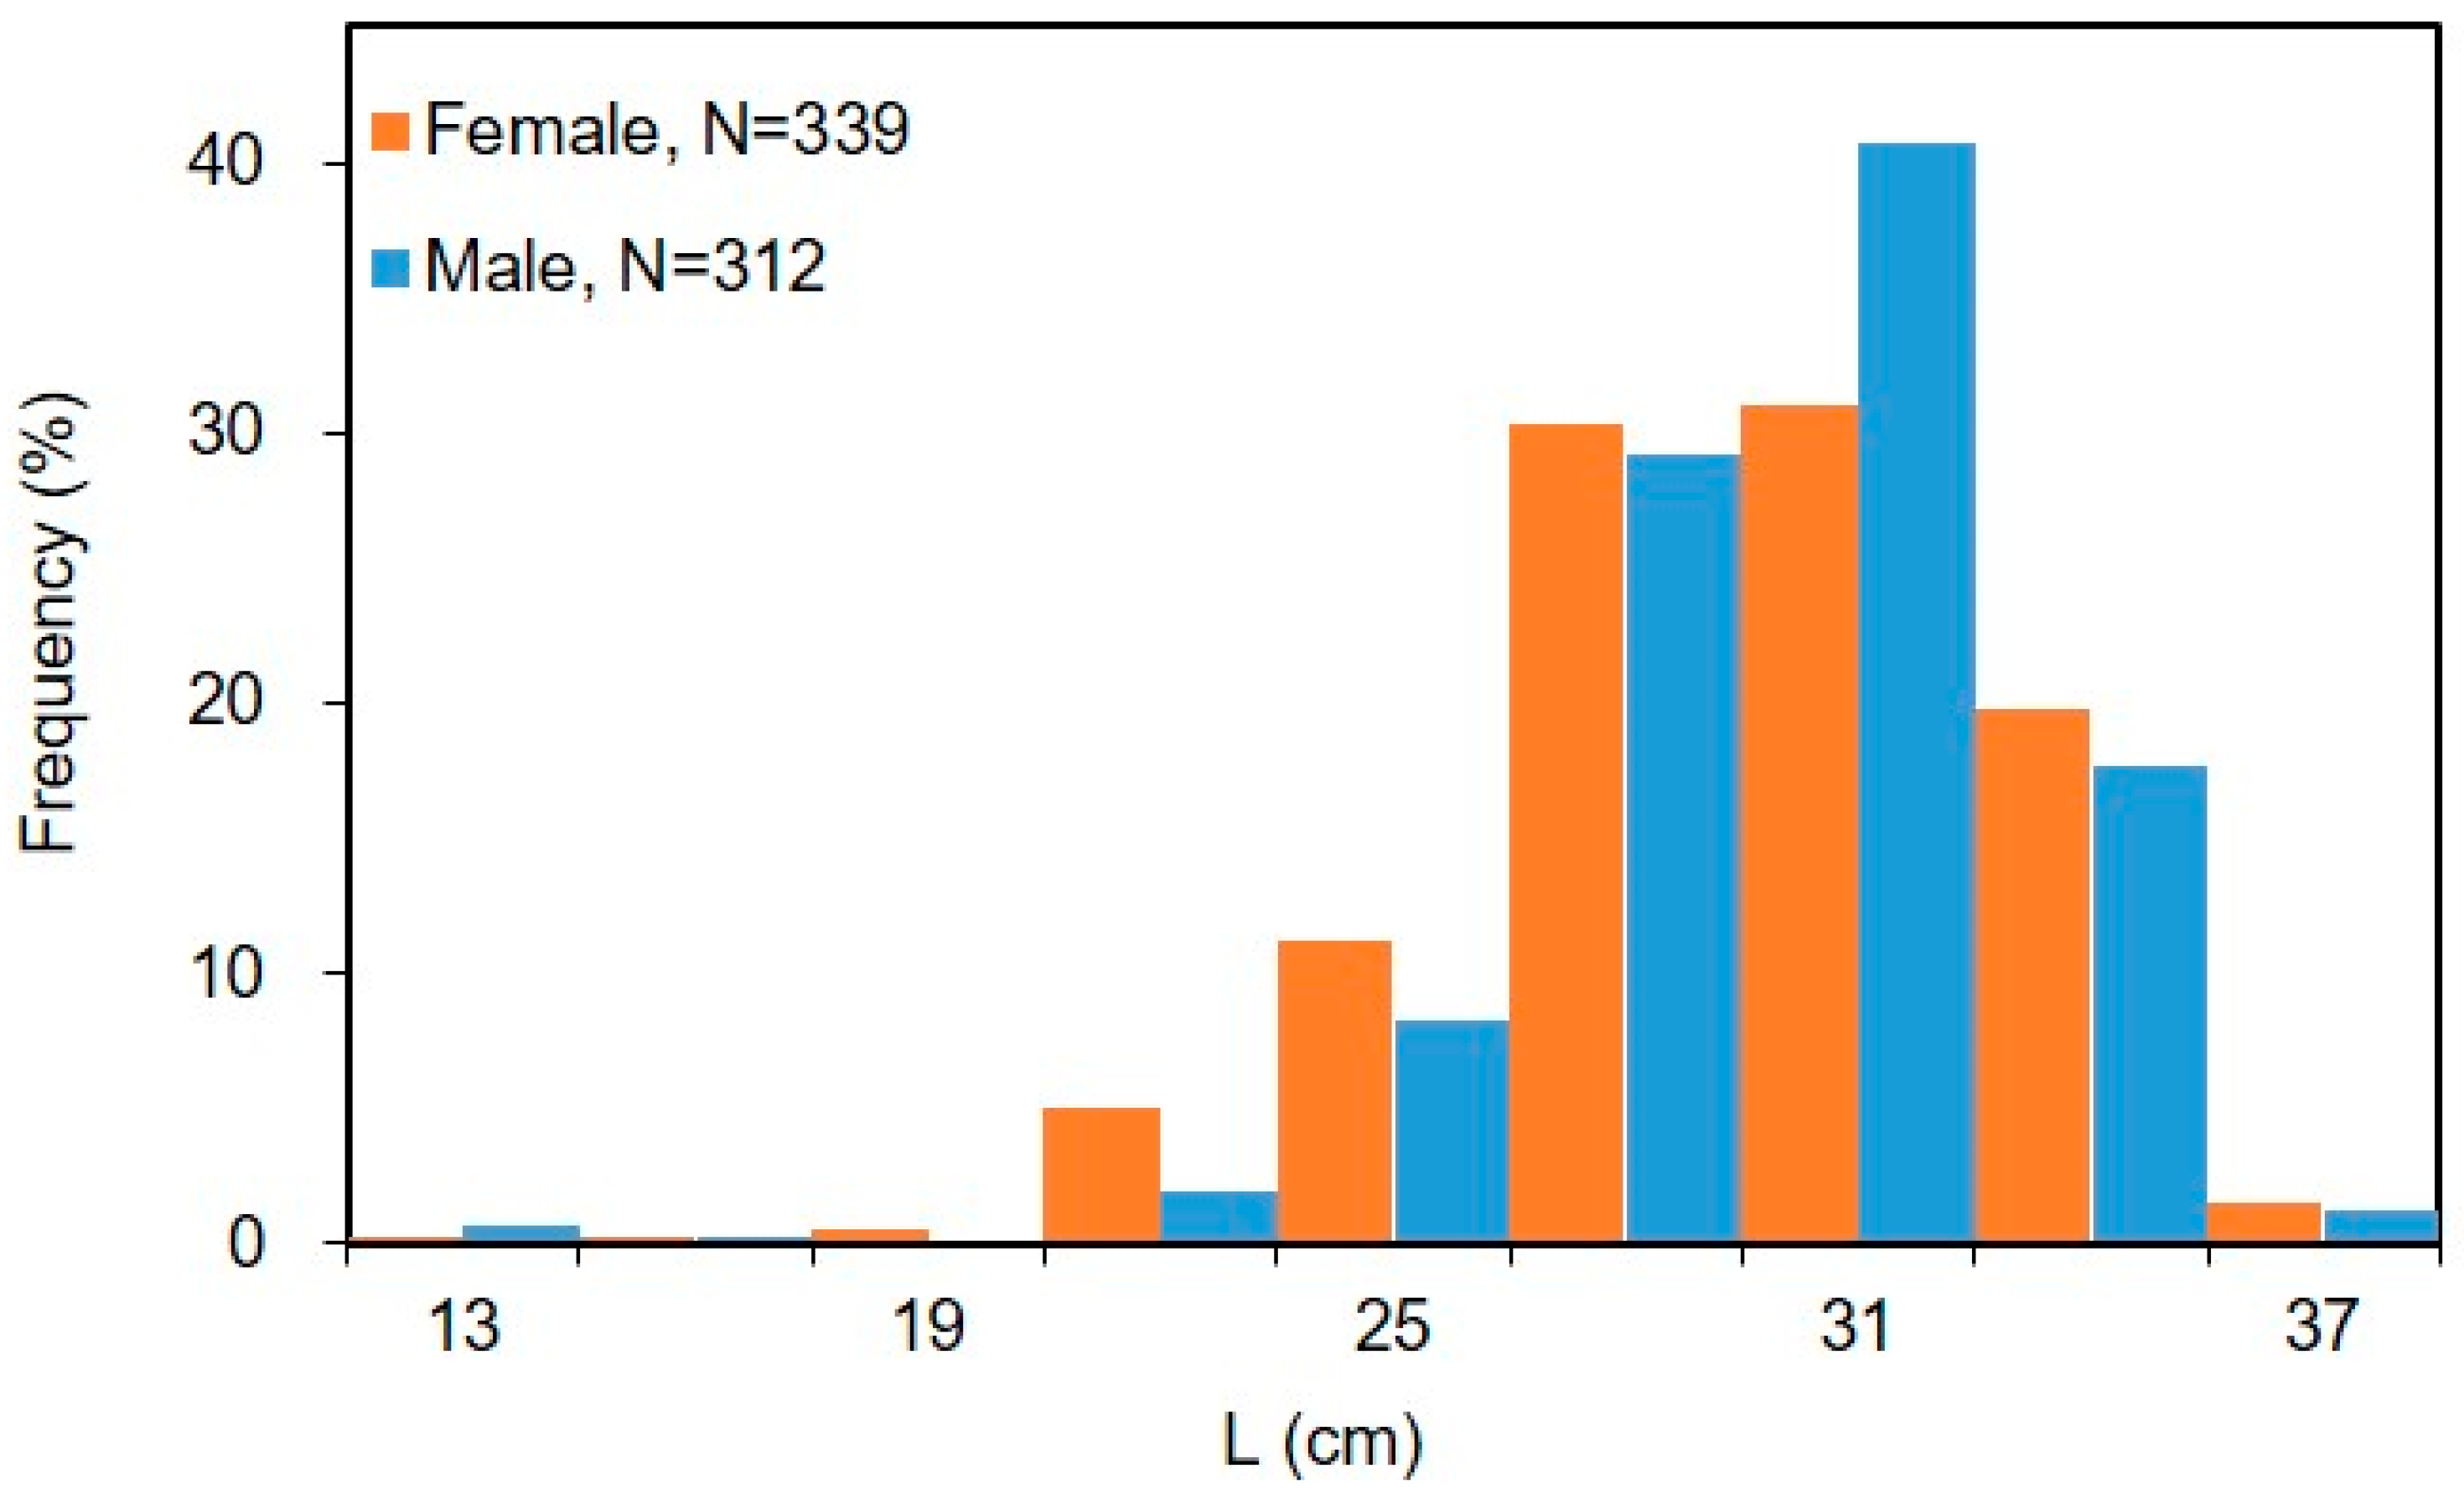
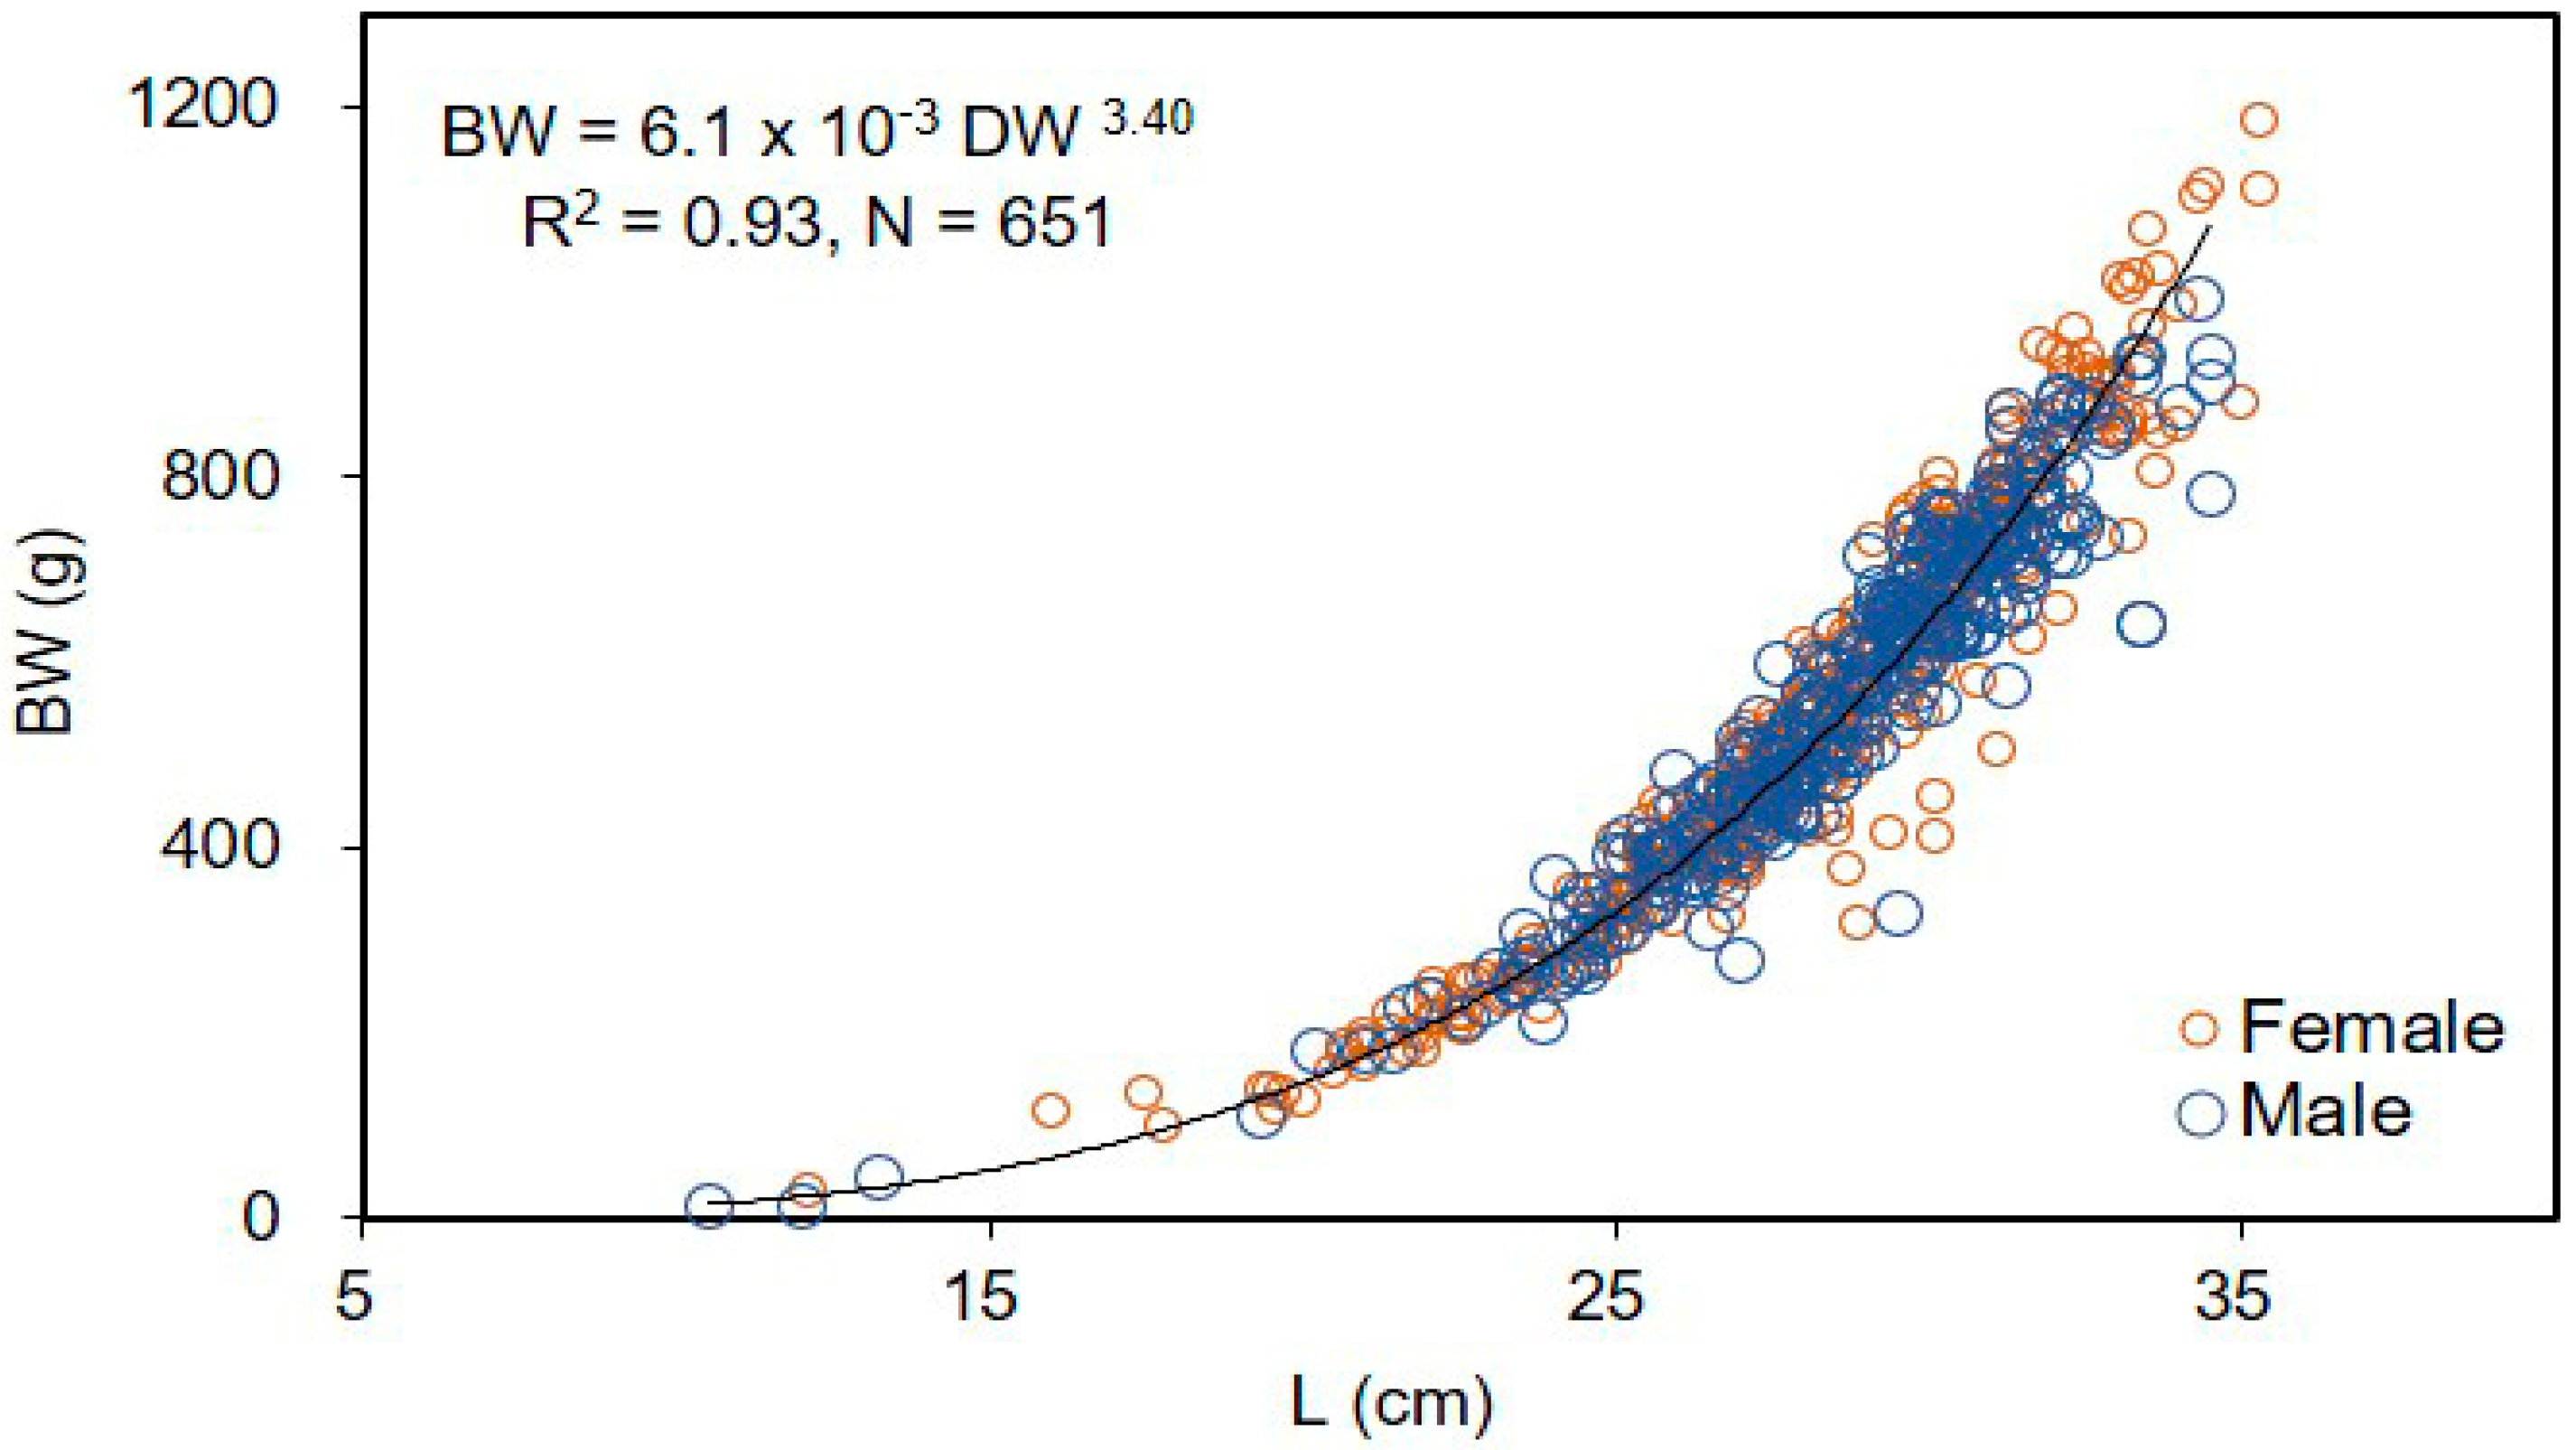
3.1. Size and Weight of Specimens
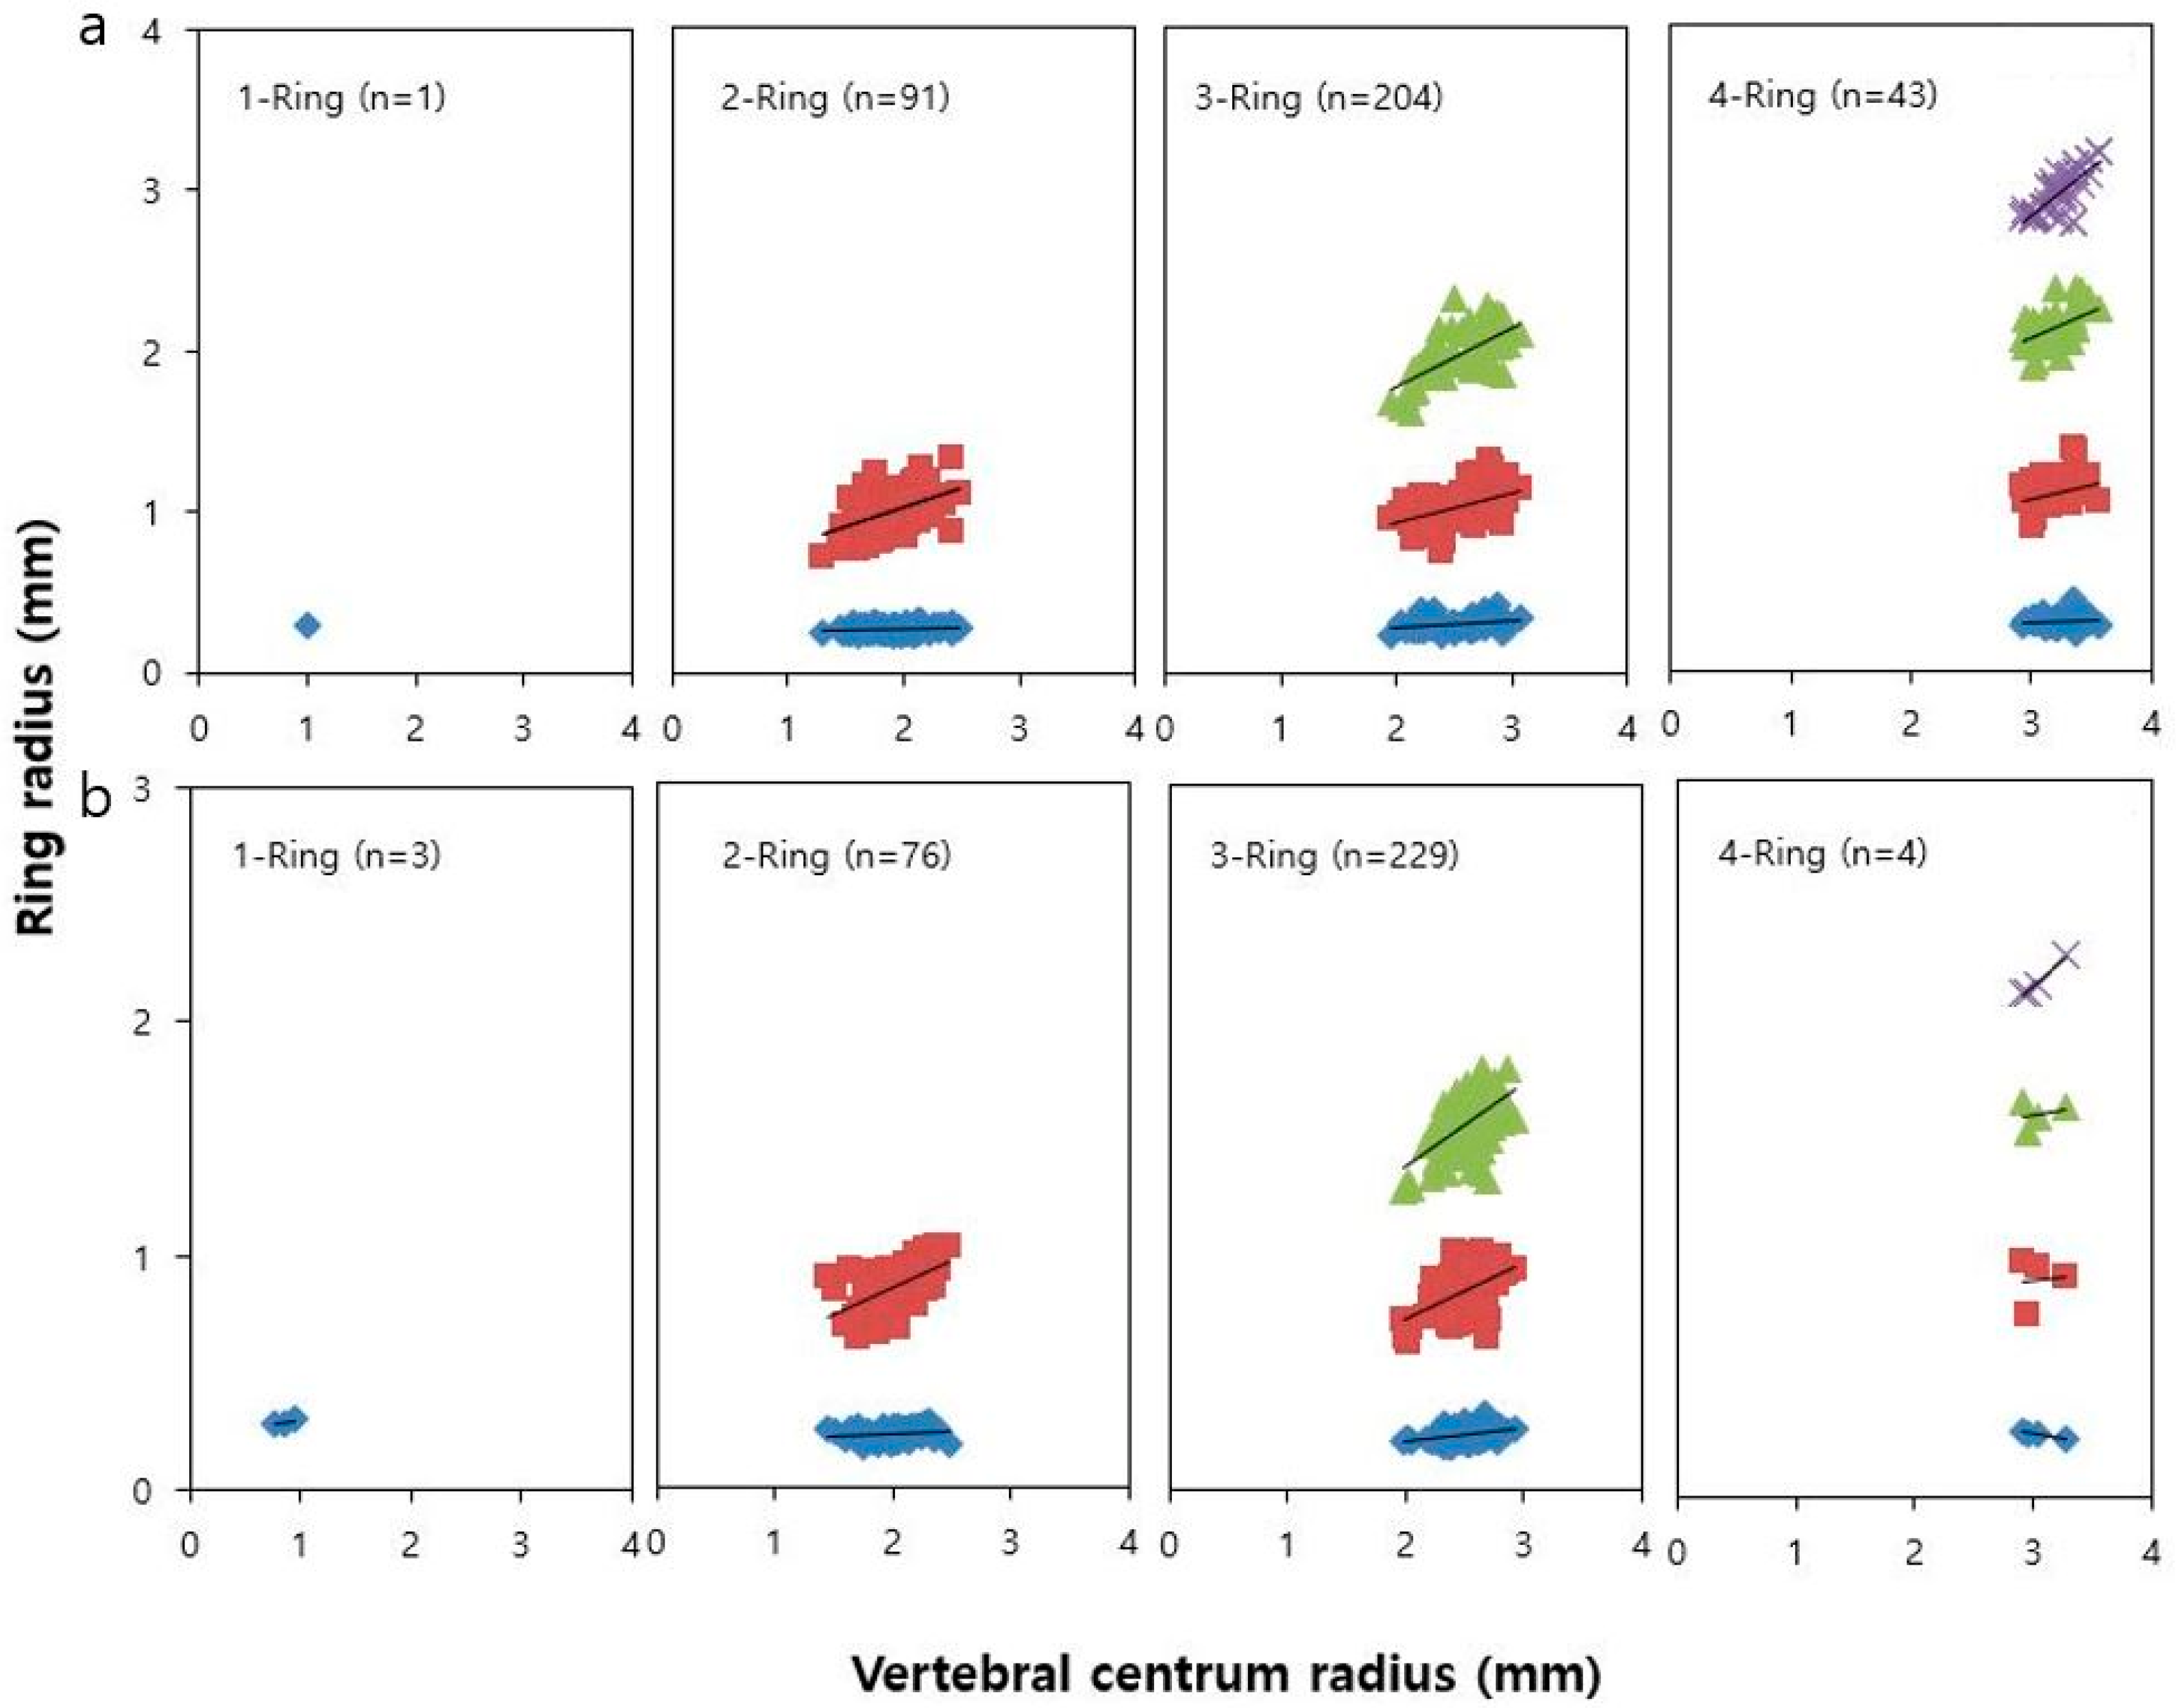
The 651 O. kenojei specimens collected from January to December 2019 included 339 females and 312 males (Table 1). The L range was 12.1–35.3 cm for females (mean: 28.0 cm) and 10.5–34.5 cm for males (mean: 28.3 cm). The most frequent maximum L range was 31.0–31.9 cm for both males and females, followed by 28.0–28.9 cm (Figure 4). We observed no significant difference in the mean L values between male and female specimens (t-test, p > 0.05). The LBW relationships showed no significant difference between sexes (p < 0.05) and could be estimated as follows: BW = 3.4 × 10⁻³ L 3.58 (R2 = 0.93; N = 339; p < 0.05) for females; BW = 5.7 × 10⁻³ L 3.66 (R2 = 0.89; N = 312; p < 0.05) for males; and BW = 6.1 × 10⁻³ L 3.40 (R2 = 0.93; N = 651; p < 0.05) for both sexes (Figure 5).

3.2. Growth Bands

Growth band measurements were derived from a total of 651 vertebral centra (339 females and 312 males). To confirm whether the growth bands on the vertebral centra were suitable for use as annuli and to investigate the accuracy of growth band measurements, we determined the relationship between the vertebral centrum radius and the distance to the growth band (Figure 6). Specimens were clearly distinguished according to the number of rings, and each growth band was separated by rectilinear regression with respect to the vertebral centrum radius.

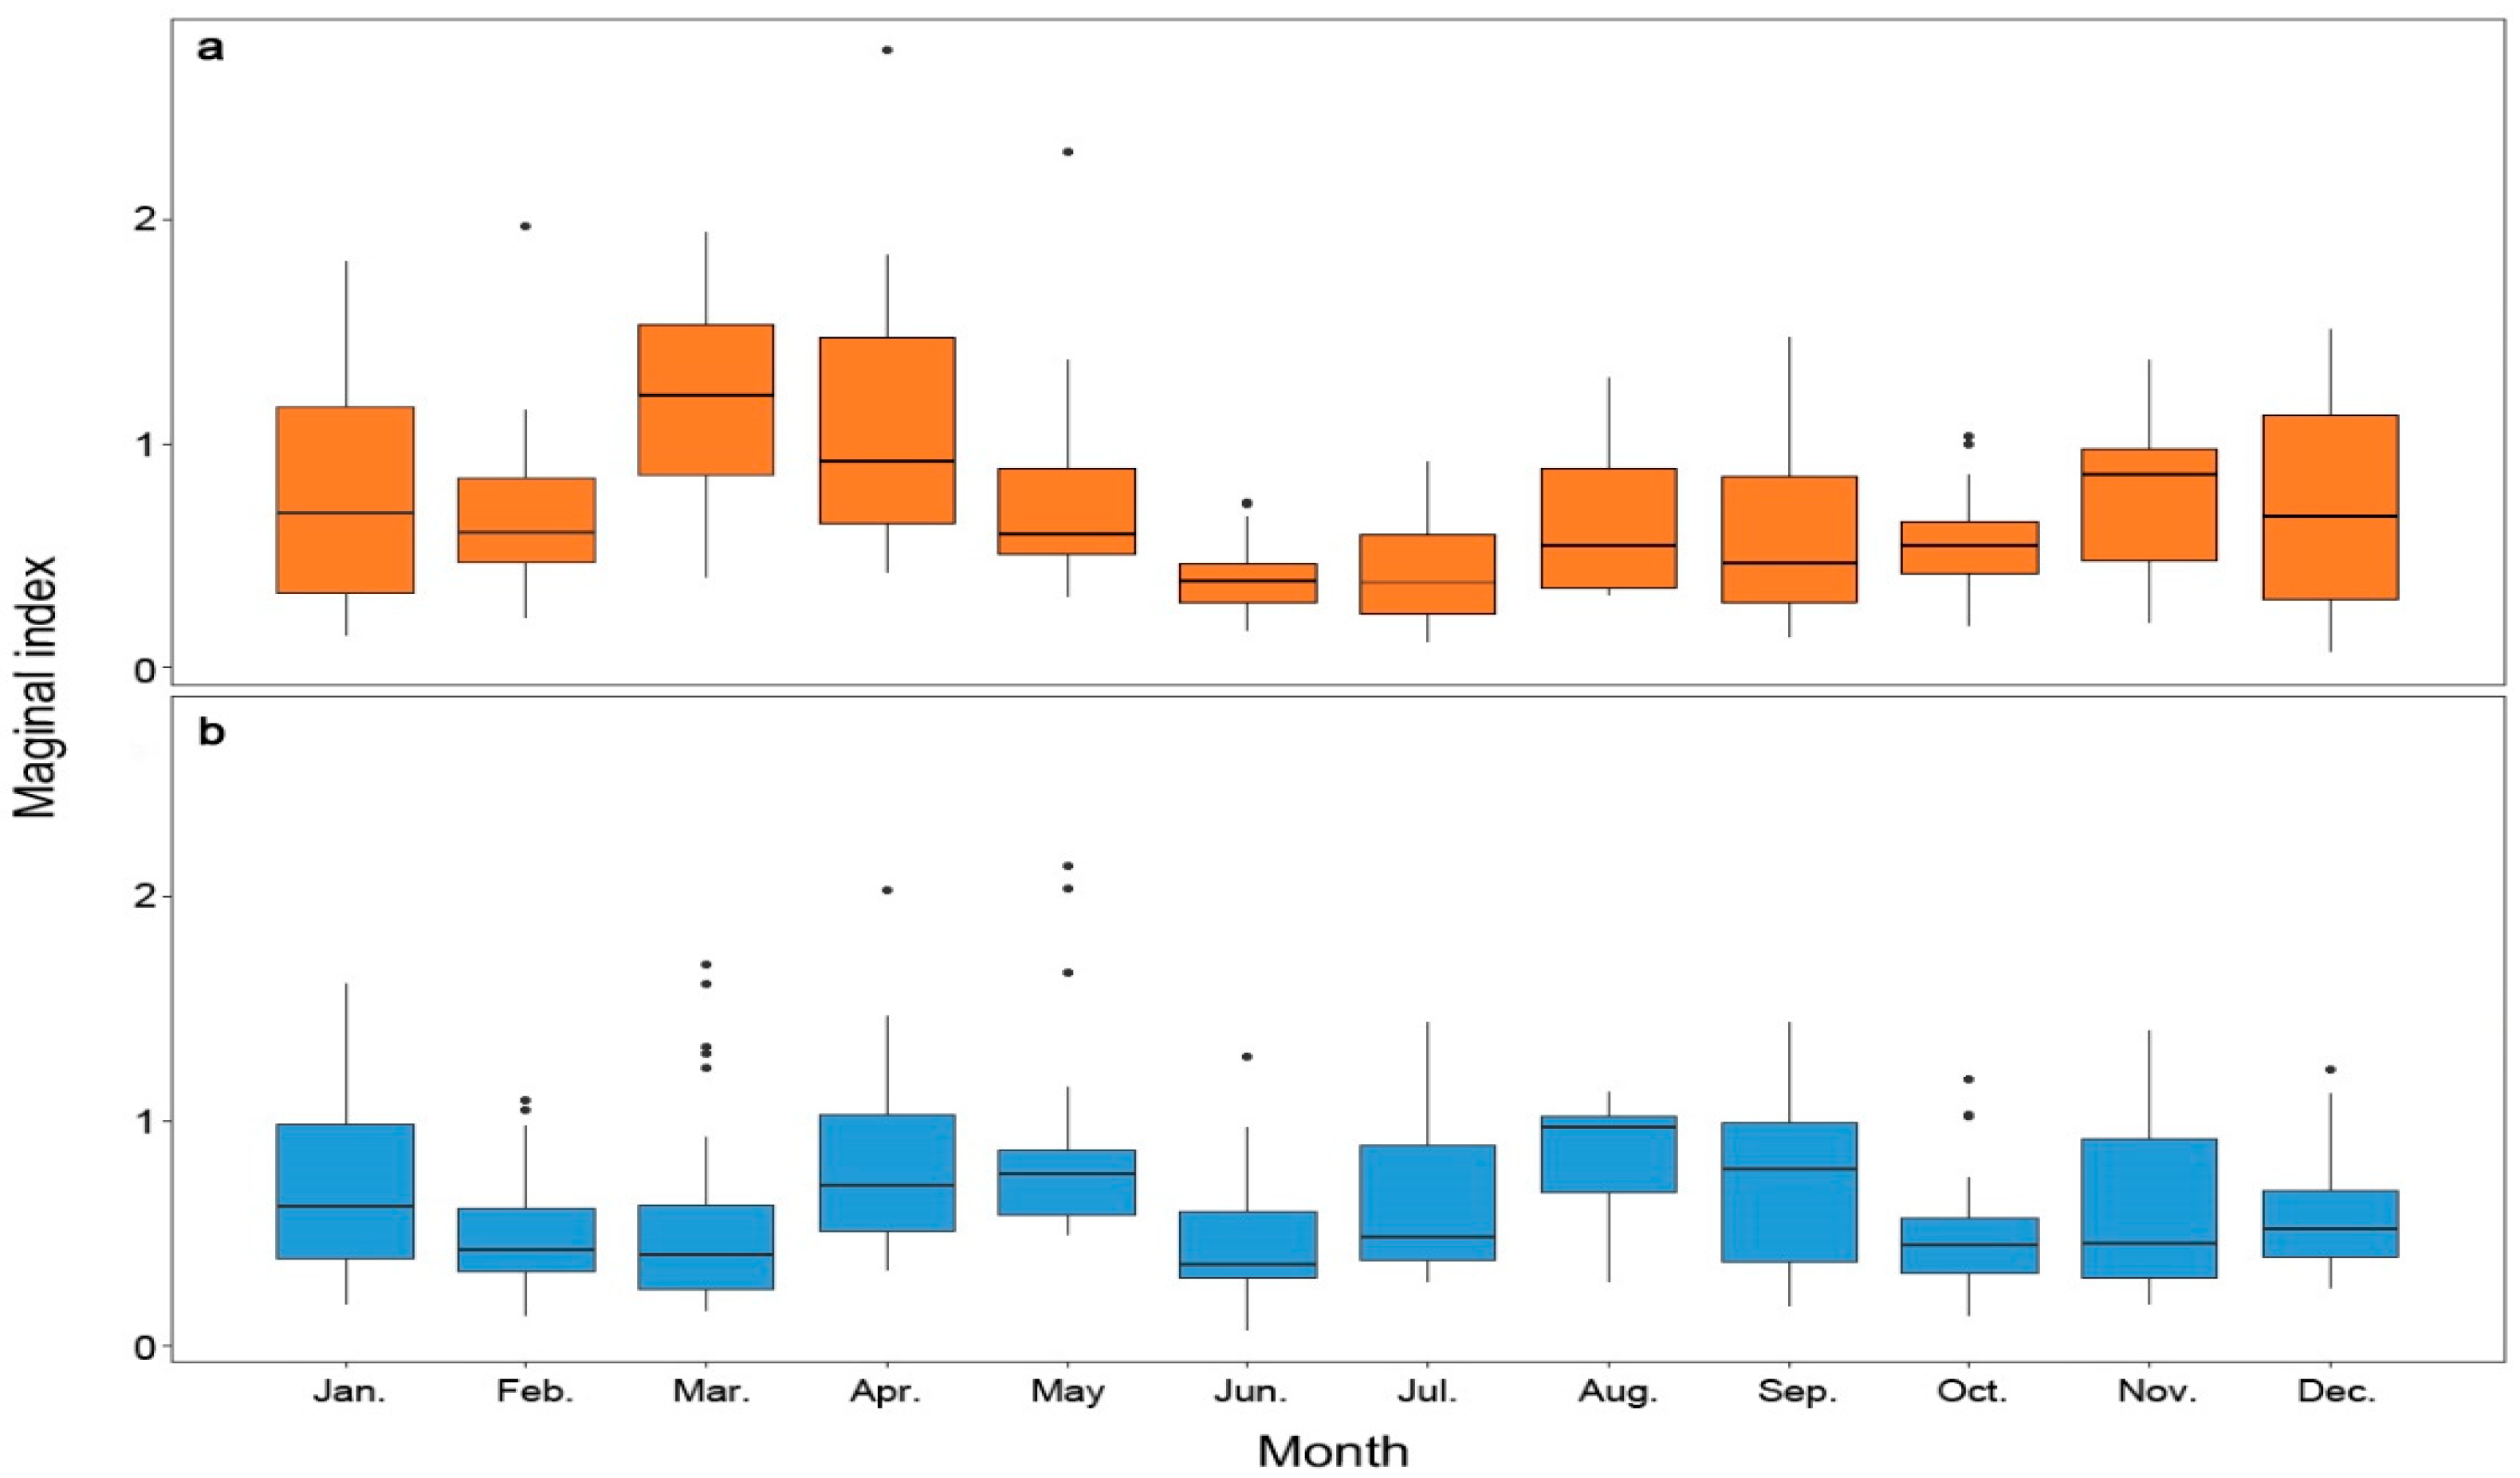
3.3. Monthly Change in Marginal Index

Monthly changes in the marginal index were investigated to confirm the time and number of growth band formations throughout the year. The marginal index of females reached a maximum in April and then gradually decreased, reaching a minimum in June. The marginal index of males started to increase in February and showed the lowest value in June (Figure 7). The Marginal index of males and females showed a minimum value around June, which coincided with the transition between opaque and transparent zones in the images; the growth band formation occurred once a year. Therefore, the growth bands were identified as annual rings.

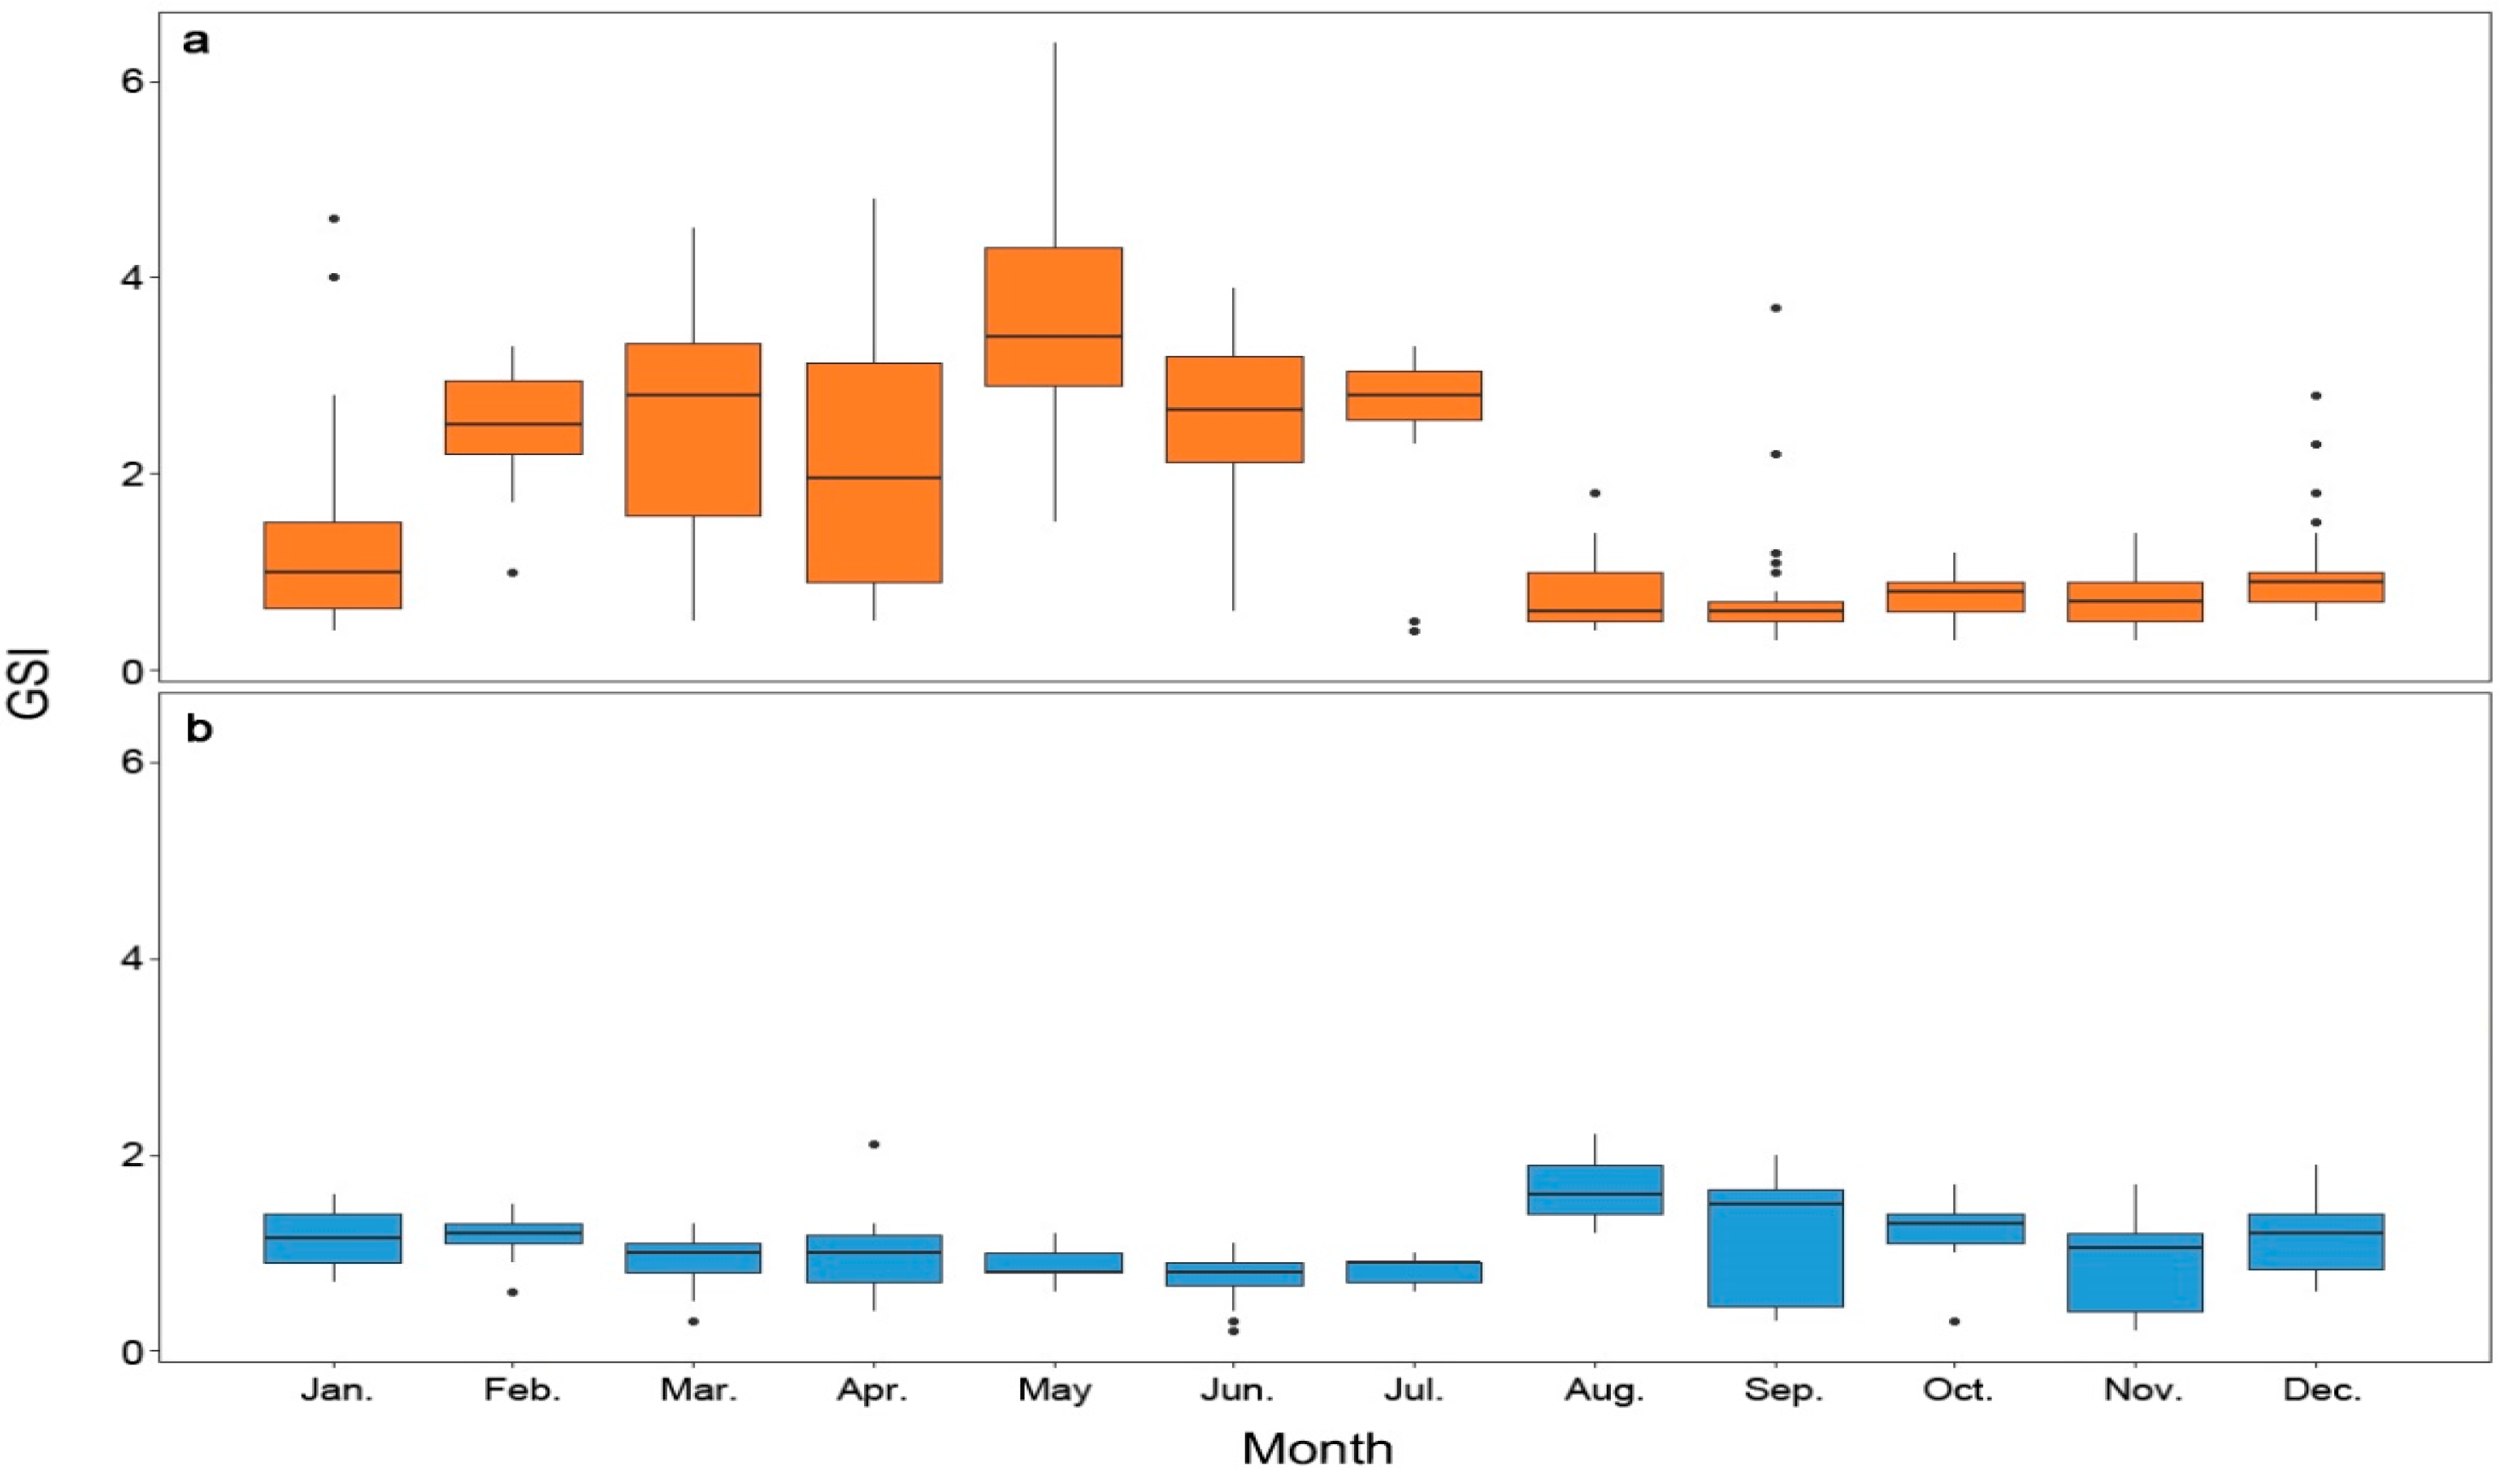
3.4. Monthly Change in Gonadosomatic Index (GSI) and Female Egg Capsule Appearance

Monthly changes in the female GSI and marginal index were analyzed to determine the relationship between the time of the first annulus formation and the spawning period. The GSI started to increase in March, reaching a maximum in May, then gradually started to decrease from May, reaching a minimum in August. Therefore, the spawning season for O. kenojei was estimated as May–August, with the main spawning season in July (Figure 8).
Analysis of the gonads of female O. kenojei revealed that the egg capsule, which can be used as an indicator of the spawning season, did not appear in January–February or October–December but mainly in March–September. Therefore, the main spawning season for O. kenojei, according to egg capsule appearance, was estimated to be May–July (Table 2).

3.5. Back Calculation of Disc Width and Body Weight When Forming a Growth Band

Based on the GSI and egg capsule appearance time of O. kenojei, we estimated that the main spawning season was July, and the annulus formation period was June. Due to it taking an average of five months from spawning to hatching [19], the first annulus formation period was estimated to be June of the following year after hatching. As a result, the estimated age of O. kenojei at the time of the formation of the first annulus was 0.5 years.
To inversely calculate the disc width (L) at the time of crest formation, we determined the relationship between the vertebral centrum radius (R) and L (Figure 9). Using the equations below, we backcalculated the average disc width at the time of formation of female and male growth bands:
F e m a l e : L = 16.159 R 0.6145 r 2 = 0.8252
M a l e : L = 15.543 R 0.6851   ( r 2 = 0.8039 )

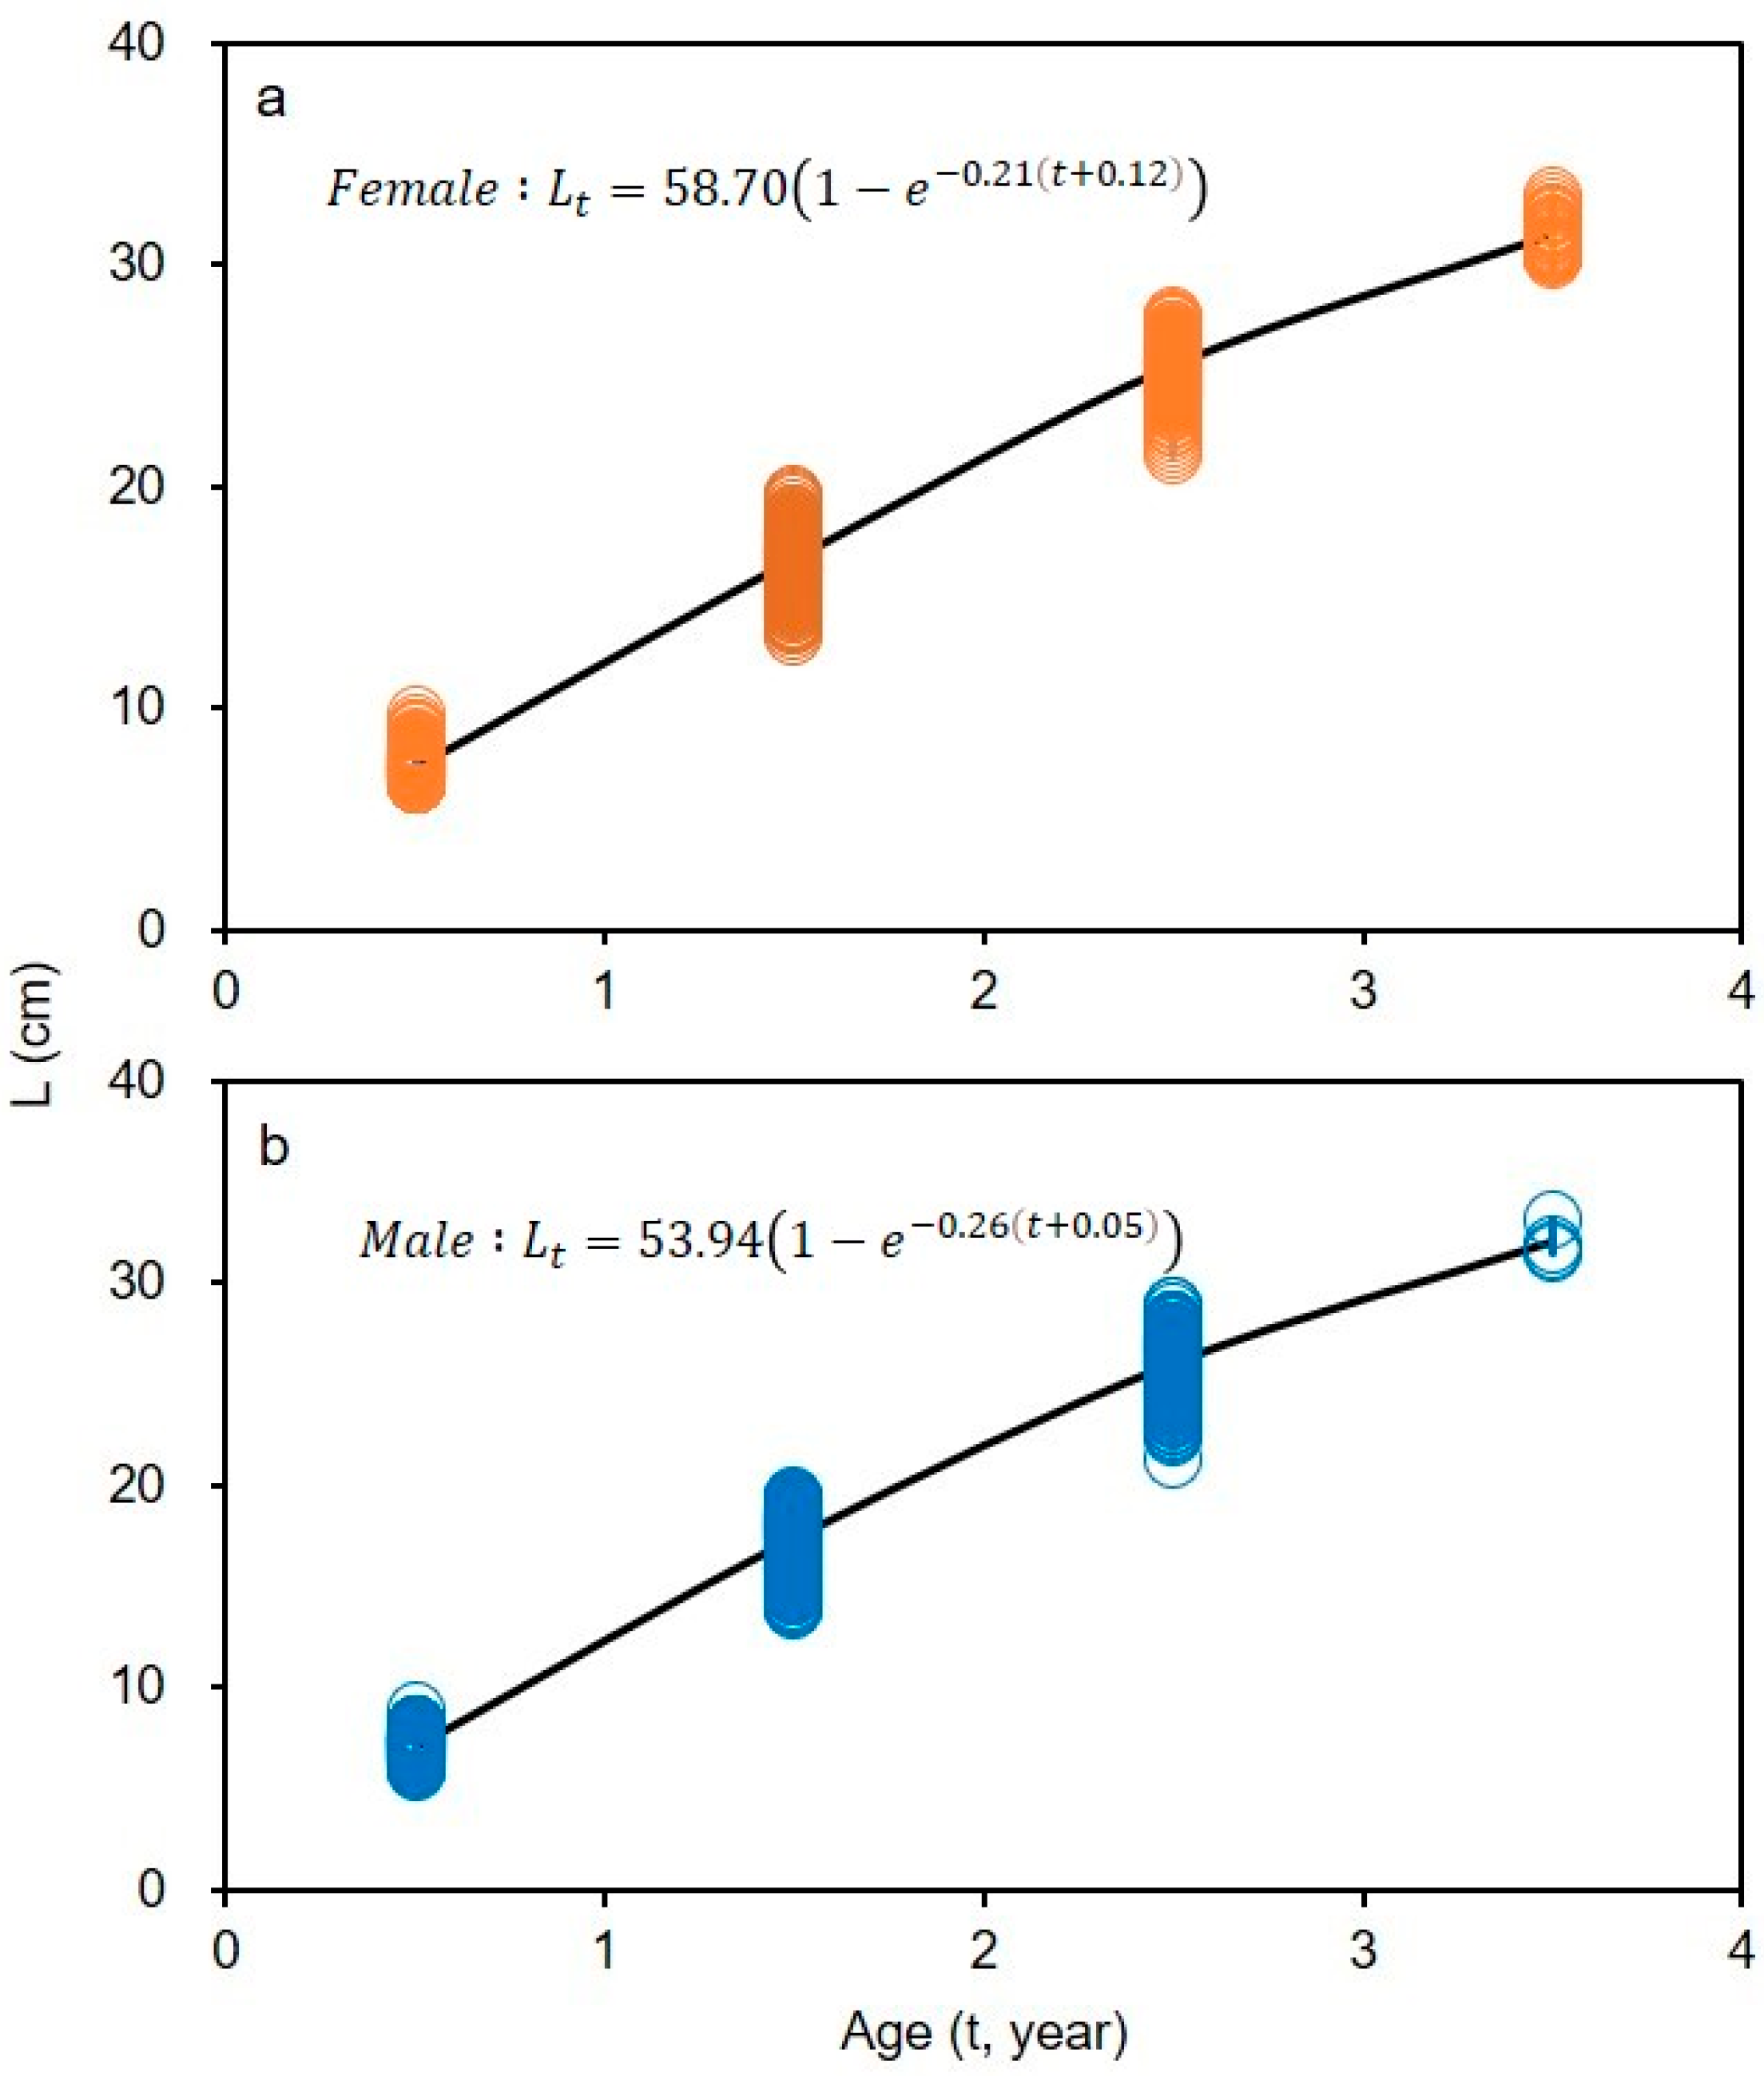
3.6. Growth Equation Estimation

As shown in Table 3, the sum of the squared errors of the growth equation, which represents the error range of the data, was 0.307 for females and 0.108 for males. The theoretical maximum disc width estimated by the von Bertalanffy [18] growth model was 38.88 cm for females and 38.54 cm for males at five years. However, the maximum estimated lengths used in this study were 35.30 cm for females and 34.50 cm for males, which are 3.58 cm and 4.04 cm larger, respectively. The estimated growth coefficient was 0.21 per year for females and 0.26 per year for males, indicating less growth for females than for males, and t0 was −0.12 for females and −0.05 for males (Table 3).
Therefore, the growth equations for males and females for the theoretical maximum disc width estimated using nonlinear regression parameters were as follows:
F e m a l e : L t = 58.70 1 e 0.21 t + 0.12
M a l e : L t = 53.94 1 e 0.26 t + 0.05
Thus, the disc widths by age estimated by the von Bertalanffy [18] growth formula were as follows: L0.5 = 7.22 cm, L1.5 = 17.06 cm, L2.5 = 25.02 cm, and L3.5 = 31.45 cm for females and L0.5 = 7.10 cm, L1.5 = 17.70 cm, L2.5 = 25.91 cm, and L3.5 = 32.06 cm for males (Figure 10).

4. Discussion

Basic data of fish age, composition, and structure are essential for efficient stock management in fisheries; therefore, we present a method for identifying O. kenojei age according to vertebrae annual rings. We found that the annual ring in O. kenojei is formed at the start of June every year. In this study, O. kenojei formation started in June every year as the MI value that was referred to along with the water temperature. Based on the O. kenojei samples collected in 2019, the average water temperature for the past four years was obtained using NIFS data. The average water temperature in June, when growth bands were formed, was confirmed as 9.7 °C, suggesting that the formation of O. kenojei growth bands may be affected by the water temperature. The reason for low catches of O. kenojei in periods of high water temperatures is that activity is low, and feeding is reduced. Therefore, the opaque zones form during periods of slow growth. This behavioral trend has previously been observed in Beringraja pulchra, which is a cold-water fish species [20].
In general, the causes of band formation in fish include spawning, injury, or an irregular diet [21]. However, by comparing the GSI, egg capsule appearance, and time of growth band formation in O. kenojei, we confirmed that the timing of growth band formation and the main spawning season were similar. Therefore, the period between a fish spawning from the mother and developing the first annulus is one year. Moreover, the results indicate that a water temperature increase leads to growth band formation, which indirectly affects the fish spawning season. Similarly, the spawning period and growth band formation period were also similar in previous studies on Lophius litulon [6] off the coast of Korea, Kareius bicoloratus [22] in the West Sea of South Korea, and Mugil cephalus [23] off the coast of Yeosu, South Korea. The growth and spawning seasons of O. kenojei are also considered to be indirectly affected by water temperature.
Currently, many studies are being conducted on the age and growth characteristics of Rajidae fish species; however, no studies have used O. kenojei as the target species. According to a comparison of O. kenojei with other domestic and foreign Rajidae species (Table 4), the maximum age of O. kenojei is 3.5 years, whereas that of Raja pulchra living in South Korea is 4.25 years, with a theoretical maximum disc width (L) for males and females of 101.73 cm and 72.49 cm, respectively [15]. The maximum age of Dipturus chinensis, which lives in the East China Sea, including off of Japan, is 15 years for females and 13 years for males, with L values of 83.1 cm for females and 76.8 cm for males [24]. Unlike these studies, the age assessment of Raja clavata in the North Atlantic was conducted using caudal spines rather than vertebrae. The maximum age and L values for Raja clavata are 10 years and 140.7 cm and 117.1 cm for females and males, respectively [14] (Table 4). In this study, male and female growth rates were estimated to be similar in comparison to those of other fish species. In this study, the growth rates of males and females were comparable to those of other fish species, which may be due to the insufficient number of samples based on skate ages. As of 3.5 years, 43 females and 4 males were sampled, and the failure to sample sufficiently large individuals may have led to the above growth rate, requiring additional research with samples of skates by size. Because of the narrow length range of specimens included in this study, future research should sample a wider range of individuals. Regarding other Rajidae species, Beringraja pulchra, Dipturus chinensis, and Raja clavata are mostly large fish species, with a maximum age exceeding 10 years (except for Raja pulchra). Therefore, unlike in other countries, O. kenojei and Raja pulchra are caught as commercial fish species in South Korea. It may be likely that the maximum age cannot be estimated because of factors affecting fish growth, such as overfishing, the water temperature of habitats in each sea area, prey organisms, and low-quality environments.
The results of this investigation into the age and growth characteristics of O. kenojei have important implications for resource evaluation, resource management, and future research. Moreover, our findings can be used as basic data for future studies on the ecology of O. kenojei and the factors influencing growth.

5. Conclusions

This study was to perform accurate age assessments of O. kenojei using growth increments in the vertebrae. Age was determined by blind slide mid-vertebral surface reading, and an annular ring was formed once a year around June. The spawning season was estimated based on the monthly gonadal constitutional index changes from June to July. The relationship between the central radius of the spine and the intervertebral disc width was analyzed separately according to gender, with L = 16.159 R0.6145 for women and L = 15.543 R0.6851 for men. The research results showed that O. kenojei was 3.5 years old, and the vertebrae could well reflect the age and growth of O. kenojei.

Author Contributions

Conceptualization, B.-I.Y. and M.-J.K.; methodology, B.-I.Y. and D.-H.C.; software, B.-I.Y.; validation, K.-H.H., S.-H.L. and D.-H.C.; formal analysis, B.-I.Y.; investigation, B.-I.Y. and D.-H.C.; resources, K.-H.H.; data curation, B.-I.Y. and D.-H.C.; writing—original draft preparation, B.-I.Y.; writing—review and editing, B.-I.Y. and M.-J.K.; visualization, T.-H.R. and D.-H.K.; supervision, K.-H.H. All authors have read and agreed to the published version of the manuscript.

Funding

This research was a part of the project entitled “Survey of coastal fisheries resources and marine environmental ecology in the Yellow Sea” (R2023009), which was funded by the National Institute of Fisheries Science (NIFS), Republic of Korea.

Institutional Review Board Statement

The study was conducted in accordance with the regulations on research ethics of the National Institute of Fisheries Science. We only used specimens from the fish market which were already dead.

Data Availability Statement

Not applicable.

Acknowledgments

This work was funded by the National Institute of Fisheries Science (R2023009). We would like to thank the researchers at the West Sea Fisheries Research Institute for their assistance in analyzing the sample and the anonymous reviewers and editors who provided comments to improve the quality of the paper.

Conflicts of Interest

The authors declare no conflict of interest.

References

  1. Chilton, D.E.; Beamish, R.J. Age determination methods for fishes studied by the Groundfish Program at the Pacific Biological Station. Can. Spec. Publ. Fish. Aquat. Sci. 1982, 60, 102. [Google Scholar]
  2. Campana, S.E. Age Determination of Elasmobranchs, with Special Reference to Mediterranean Species: A Technical Manual; Studies and Reviews; General Fisheries Commission for the Mediterranean: Rome, Italy, 2013; Volume 94, pp. 1–44. [Google Scholar]
  3. Campana, S.E. Accuracy, precision and quality control in age determination, including a review of the use and abuse of age validation methods. J. Fish Biol. 2001, 59, 197–242. [Google Scholar] [CrossRef]
  4. Nazir, A.; Khan, M.A. Stock-specific assessment of precise age and growth in the long-whiskered catfish Sperata aor from the Ganges River. Mar. Freshw. Res. 2020, 71, 1693–1701. [Google Scholar] [CrossRef]
  5. Khan, M.A.; Nazir, A.; Banday, U.Z. Utility of otolith weight to estimate age of Labeo bata (Actinopterygii: Cypriniformes: Cyprinidae) inhabiting the Ganga River. Acta Ichthyol. Piscat. 2018, 48, 257–260. [Google Scholar] [CrossRef] [Green Version]
  6. Cha, B.Y.; Park, Y.C.; Huh, S.H. Age and growth of the Yellow goosefish, Lophius litulon. J. Korea Fish. Soc. 1998, 31, 529–534. [Google Scholar]
  7. Smith, S.E.; Mitchell, R.A.; Fuller, D. Age-validation of a leopard shark (Triakis semifasciata) recaptured after 20 years. J. Fish. Bull. NOAA 2003, 101, 194–198. [Google Scholar]
  8. Kume, G.; Furumitsu, K.; Yamaguchi, A. Age, growth and age at sexual maturity of fan ray Platyrhina sinensis (Batoidea: Platyrhinidae) in Ariake Bay, Japan. Fish. Sci. 2008, 74, 736–742. [Google Scholar] [CrossRef]
  9. James, A.S.; Michael, D.M.; Seung, H.S.; William, H.H. Age and growth estimates of the winter skate (Leucoraja ocellata) in the western Gulf of Maine. J. Fish. Bull. 2003, 3, 161–168. [Google Scholar]
  10. Matta, M.E.; Kimura, D.K. Age Determination Manual of the Alaska Fisheries Science Center Age and Growth Program; NOAA: Anchorage, AK, USA, 2012; Volume 13, pp. 1–97. [Google Scholar]
  11. Beamish, R.J.; McFarlane, G.A. The forgotten requirement for age validation in fisheries biology. Trans. Am. Fish. Soc. 1983, 112, 735–743. [Google Scholar] [CrossRef]
  12. Kim, J.K.; Sim, D.S.; Jeong, S.D. Sexual maturity of Raja koreana (Elasmobranchii, Rajoidei) from Korea. Korean J. Ichthyol. 2005, 17, 229–235. [Google Scholar]
  13. Mcfarlane, G.A.; King, J.R. Age and growth of big skate (Raja binoculata) and longnose skate (Raja rhina) in British Columbia waters. J. Fish. Res. 2006, 78, 169–178. [Google Scholar] [CrossRef]
  14. Serra-Pereira, B.; Figueiredo, I.; Farias, I.; Moura, T.; Gordo, L.S. Description of dermal denticles from the caudal region of Raja clavata and their use for the estimation of age and growth. J. Mar. Sci. 2008, 65, 1701–1709. [Google Scholar] [CrossRef] [Green Version]
  15. Jang, M.H. Age and Growth of Mottled Skate (Bering Rajapulchra) in the Yellow Sea of Korea; Korean Inha University: Incheon, South Korea, 2014; pp. 1–49. [Google Scholar]
  16. Joung, S.J.; Chen, C.C.; Liu, K.M.; Hsieh, T.C. Age and Growth Estimates of the Kwangtung Skate Dipturus kwangtungensis in the Waters of Northern Taiwan; Cambridge University Press: Cambridge, UK, 2015; p. 28. [Google Scholar]
  17. Youn, B.I.; Choi, D.H.; Lee, S.H.; Han, K.H.; Lee, S.J.; Kwon, D.H.; Kim, M.J. Spawning Period and Size at Maturity of the Ocellate Spot skate Okamejei kenojei in the West Sea of Korea. J. Mar. Sci. Eng. 2022, 10, 1067. [Google Scholar] [CrossRef]
  18. Von Bertalanffy, L.A. quantitative theory of organic growth (Inquiries on growth laws. II). Hum. Biol. 1938, 10, 181–213. [Google Scholar]
  19. Hoff, G.R. A nursery site of the Alaska skate (Bathyraja parmifera) in the eastern Bering Sea. Fish. Bull. 2008, 106, 233–244. [Google Scholar]
  20. Hong, S.H.; Yeon, I.J.; Im, Y.J.; Hwang, H.J.; Ko, T.S.; Park, Y.C. Feeding Habits of the Ocellate Spot Skate (Okamejei kenojei) in the Yellow Sea of Korea; NIFS (National Institute of Fisheries Science) Press: Indianapolis, IN, USA, 2000; Volume 58, pp. 1–9. [Google Scholar]
  21. Zhang, C.I. Marine Fisheries Resource Ecology; Pukyong University Press: Busan, Korea, 2010; pp. 195–216. [Google Scholar]
  22. Jeon, J.C.; Lim, Y.J. Age and growth of Stone2 flounder, Kareius bicoloratus, in western coastal waters of Korea. Korean J. Ichthyol. 2004, 16, 173–180. [Google Scholar]
  23. Zhang, C.I. Age and growth of the flathead grey mullet (Mugil cephalus) in the coastal water of Yeosu. J. Fish. Ocean. Technol. Korean Soc. 2005, 47, 203–213. [Google Scholar] [CrossRef] [Green Version]
  24. Hara, K.; Furumitsu, K.; Aoshima, T.; Kanehara, H.; Yamaguchi, A. Age, growth, and age at sexual maturity of the commercially landed skate species, Dipturus chinensis (Basilewsky, 1855), in the northern East China Sea. J. Appl. Ichthyol. 2018, 34, 66–72. [Google Scholar] [CrossRef]
Figure 1. Location of the ocellate spot skate (Okamejei kenojei) sampling area in this study.
Fishes 08 00197 g001
Figure 2. Variability of vertebral centrum diameter for each vertebra.
Fishes 08 00197 g002
Figure 3. Measurement of the vertebral centrum radius in Okamejei kenojei, where rn represents the distance to the growth ring at = n and r0 represents the first growth ring.
Fishes 08 00197 g003
Figure 4. Frequency distribution of disc width measurements of Okamejei kenojei collected from the West Sea of South Korea.
Fishes 08 00197 g004
Figure 5. Relationship between body weight (BW) and disc width (L) of Okamejei kenojei collected from the West Sea of South Korea.
Fishes 08 00197 g005
Figure 6. Relationship between vertebral centrum radius and growth ring radius for (a) female and (b) male specimens of Okamejei kenojei collected from the West Sea of South Korea.
Fishes 08 00197 g006
Figure 7. Monthly variation of the marginal index (mean and standard deviation) of the vertebral centra in (a) female and (b) male specimens of Okamejei kenojei collected from the West Sea of South Korea.
Fishes 08 00197 g007
Figure 8. Monthly variation in the gonadosomatic index (GSI) of (a) female and (b) male specimens of Okamejei kenojei collected from January to December 2019 from the West Sea of South Korea.
Fishes 08 00197 g008
Figure 9. Relationship between vertebral centrum radius and disc width of (a) female and (b) male specimens of Okamejei kenojei collected from the West Sea of South Korea.
Fishes 08 00197 g009
Figure 10. Theoretical von Bertalanffy growth curves of disc width for (a) female and (b) male specimens of Okamejei kenojei collected from the West Sea of South Korea. Vertical bars represent standard deviations.
Fishes 08 00197 g010
Table 1. Number and size (disc width) of ocellate spot skate (Okamejei kenojei) individuals collected from the West Sea of South Korea throughout 2019.
YearMonthNo. of Fish (N)Disc Width Range (Mean (cm) ± SD)
FemaleMaleFemaleMale
2019Jan.303022.1–33.5 (27.5 ± 2.9)23.5–32.1 (28.0 ± 2.4)
Feb.303028.9–35.3 (31.7 ± 1.8)27.3–34.5 (30.6 ± 1.7)
Mar.303017.8–31.8 (23.9 ± 3.3)24.4–34.3 (29.7 ± 2.2)
Apr.302922.7–33.7 (28.7 ± 3.1)21.7–32.4 (28.5 ± 2.9)
May323312.1–33.2 (28.6 ± 5.8)10.5–33.3 (28.9 ± 6.3)
Jun.302321.0–32.0 (27.3 ± 2.2)19.3–32.9 (27.5 ± 3.4)
Jul.302926.7–33.5 (30.6 ± 1.8)25.5–31.3 (28.8 ± 1.5)
Aug.71324.5–31.6 (27.8 ± 2.3)22.3–31.0 (27.2 ± 2.2)
Sep.301521.0–33.6 (26.6 ± 2.8)20.2–29.1 (25.4 ± 2.6)
Oct.302022.9–33.1 (28.6 ± 2.2)23.1–31.3 (27.8 ± 2.1)
Nov.303020.7–35.0 (26.9 ± 4.5)21.0–30.5 (26.2 ± 2.2)
Dec.303023.6–32.5 (27.9 ± 2.1)26.1–33.4 (28.8 ± 1.9)
Total33931212.1–35.3(28.0 ± 3.7)10.5–34.5(28.3 ± 3.3)
Table 2. Egg capsule appearance rate in female Okamejei kenojei collected from the West Sea of South Korea.
YearMonthNumber of Individuals (A)Number of Individuals Possessing Egg Capsules (B)Egg Capsule Appearance Rate
(B/A, %)
2019Jan.30-0.0
Feb.30-0.0
Mar.3213.1
Apr.30310.0
May43920.9
Jun.301550.0
Jul.302170.0
Aug.7-0.0
Sep.3013.3
Oct.29-0.0
Nov.30-0.0
Dec.30-0.0
Table 3. von Bertalanffy growth equation (VBGE) results for Okamejei kenojei collected from the West Sea of South Korea (SS: sum of squares of deviation; L: theoretical maximum disc width; K: growth coefficient; SSQ: sum of squared error).
Female
t
(year)
Back-Cal. Disc Width
(cm)
VBGE
Disc Width (cm)
ResidualSSL
(cm)
Kt0SSQ
0.57.327.220.0990.01038.80.21−0.120.307
1.516.7217.06−0.3430.118
2.525.4125.020.3950.156
3.531.3031.45−0.1510.023
Male
0.57.107.040.0560.00339.080.26−0.050.108
1.517.4117.61−0.2000.040
2.526.0425.800.2380.056
3.532.0532.14−0.0930.009
Table 4. Comparison of growth parameters and growth performance indexes among different studies estimated by the von Bertalanffy growth equation.
SpeciesLocality of Study L
(cm)
Kt0Max. Age (years)MaterialReference
Okamejei kenojeiWest Sea, South KoreaF38.8(L)0.21−0.123.5VeterbralThis study
M39.1(L)0.29−0.05
Beringraja pulchraWest Sea, South KoreaF101.7(L)0.350.094.25Veterbral[15]
M72.5(L)0.550.08
Dipturus chinensisNorthern East China seaF83.1(TL)0.103−1.2015Veterbral[24]
M76.8(TL)0.109−1.2813
Raja clavataNorthern Atlantic CurrentF140.7(TL)0.097−0.8810Caudal thorn[14]
M117.1(TL)0.142−0.36
Disclaimer/Publisher’s Note: The statements, opinions and data contained in all publications are solely those of the individual author(s) and contributor(s) and not of MDPI and/or the editor(s). MDPI and/or the editor(s) disclaim responsibility for any injury to people or property resulting from any ideas, methods, instructions or products referred to in the content.

