Abstract
We previously reported on the comparison of proteomic data between seven tissue types of a novel “iron prawn” species. However, no transcripts or metabolic information are available for this species. We therefore performed shotgun LC–MS/MS metabonomic and RNA-seq analyses of the total protein from “iron prawns”. KEGG analysis revealed that the largest group consisted of a total of 114 KEGG pathway proteins, comparing the “iron prawns” with the normal prawns. A total of 423 peptides, corresponding to metabolic pathways, ABC transporters, starch and sucrose metabolism, insulin resistance/secretion, fatty digestion and absorption, and lipid metabolism, were identified. The pathways of carbohydrate and amino acid metabolism decreased in female iron prawns, while organic acid and its derivatives increased. However, the pathway of organic acid and its derivatives decreased and lipid metabolism increased in the male iron prawns. The pathways of choline metabolism in cancer and glycerophospholipid/histidine/propanoate metabolism have been significantly affected in iron prawns. Our work provides insight into the understanding of the formation mechanism of the “iron prawn”.
1. Introduction
Iron prawn syndrome (IPS) is a serious disease that endangers the development of Macrobrachium rosenbergii, with typical symptoms being sexual precocity and slow growth, resulting in substantial production losses. We previously reported proteomic data on the “iron prawn”; the results showed that the differentially expressed proteins are involved in metabolic processes, namely in muscle contraction, digestive system metabolism, cell differentiation, migration, and apoptosis [1]. Proteomics has only characterized the differentially expressed proteins among different tissues previously; as a technique to a mutually complement genomics, transcriptomics, and proteomics, metabolomics has been used to investigate the metabolic responses to environmental stresses in fish, such as in crucian carps infected by Edwardsiella tarda [2], Perna canaliculus [3], Coilia nasus [4], Eriocheir sinensis [5], Pseudosciaena crocea [6], Ctenopharyngodon idellus [7], Cynoglossus semilaevis [8], Litopenaeus vannamei [9], Danio rerio [10], and M. rosenbergii [11], among others.
Gas chromatography–mass spectrometry (GC–MS), liquid chromatography–mass spectrometry (LC–MS) and nuclear magnetic resonance (NMR) are the analytical technologies most frequently used in metabolomics investigations [12,13]. The characteristic beneficial metabolomics in the majority of metabolite structures are not species-specific [14,15]. However, fishes’ metabolic strategy for bacterial infections is largely unknown. In addition, in crustaceans, especially M. rosenbergii, researchers aim to identify the underlying pathways through which the animals are exposed to exogenous substances, such as the hepatopancreatic responses to starvation stress [16].
It appears that the differentially expressed metabolites and genes could be responsible for growth retardation in the “iron prawn”, but not for the prolonged molt cycle [17]. However, few studies of the transcriptomics and metabolomics of the “iron prawn” have previously been conducted. To the best of our knowledge, our report is the first to present transcriptomic and metabolomic data for M. rosenbergii. In this study, these data were obtained using shotgun LC–MS/MS (two-dimensional liquid chromatography–mass spectrometry) metabolomics strategies and RNA-seq, and the potential pathway and its relative metabolites have been reported. We report on the identification of a wide range of primitive metabolite components and genes, and provide an in-depth description of the transcriptomic and metabolomic data from M. rosenbergii.
2. Materials and Methods
2.1. Experimental Sample
This study was approved by Animal Experiment Ethics Committee of Applied Aquatic Genomics Center, Freshwater Fisheries Research Institute of Zhejiang Province. The body weights and lengths of the stunted individuals, obtained from a breeding farm in Gaoyou, Jiangsu Province, were (5.09 ± 0.69) g and (5.27 ± 0.46) cm. Iron and normal prawns (M. rosenbergii) both cultured in ponds for 40 days were selected (for the difference, see [1]), and the shrimp were temporarily raised in a 200 L plastic bucket at a temperature of 25 ± 1 °C for a photoperiod cycle of 12 h:12 h. The test water was chlorinated tap water, and pellet feed was supplied daily.
After the shrimp were killed, muscle tissue was collected on ice. In this study, female iron prawn (MA), male iron prawn (MB), female normal prawn (MC) and male normal prawn (MD) were sampled (n = 6 per group). Further comparisons (MA vs. MB, MC vs. MA, MC vs. MD, MD vs. MB) have been performed between different genders, normal and ion prawns. All muscle tissues were stored in a freezer at −80 °C until additional processing was conducted. The muscle was ultrasonically dismembered in 1 mL acidified methanol, and the extract was centrifuged (4 °C, 18,000× g, 20 min) to collect the supernatant, which was further processed for metabolomics analysis by shotgun LC–MS/MS. The samples were taken out from the −80 °C freezer and thawed on the ice. To 50 mg of sample, we added 1000 µL of precooled extractant (70% methanol aqueous solution, containing 1 µg/mL of 2-chlorophenylalanine as internal standard) as well as precooled steel balls. Homogenization was then conducted for 3 min at 30 Hz. The steel balls were removed before vortexing the solution for 1 min, which was then left to stand on ice for 15 min. Centrifuging was conducted for 10 min, 4 °C, 12,000 r/min, and the supernatant was transferred into the inner liner of an injection bottle for LC–MS/MS analysis.
2.2. Metabonomic Analysis
2.2.1. Total Protein Extraction and Peptide Digestion
The sample was ground into a fine powder, resuspended in a 1:3 ratio of BPP (triphenol protein extraction) solution and swirled at 4 °C for 4 min. Saturated phenol solution, ammonium acetate/methanol solution, pre-cooled acetone, and buffer solution (1% SDS, 8 M urea, protease inhibitor cocktail) were added. The protein concentration was determined using a BCA protein assay kit (Beyotime Biotechnology Co., Shanghai, China) in accordance with the manufacturer’s instructions. The samples were freeze-dried and resuspended in 40 μL trypsin buffer and incubated at 37 °C for 16–18 h.
2.2.2. Chromatographic Separation and Mass Spectrometry Identification
The mobile phase A was 0.1% formic acid (H2O) and the mobile phase B was 0.1% formic acid (ACN). For chromatographic separation, a column filled with C18 material (1.8 µm, 2.1 mm × 100 mm) from a Waters UPLC column was used. The samples were transferred to a Zorbax 300 sb-c18 peptide trap (Agilent Technologies, Wilmington, DE, USA) and then separated with a chromatographic column. The corresponding liquid gradient was set as 0 to 50 min, and the B-phase gradient was 4–50%. From 50 min to 54 min, the B-phase linear gradient was 50% to 100%. From 54 min to 60 min, the B phase remained at 100%. The hydrolysates were separated by capillary high-performance liquid chromatography and analyzed using a Q-extraction mass spectrometer (Thermo Fisher Scientific, Waltham, MA, USA). The analysis time was 60 min, and the positive-ion-detection method was used. Mass/charge (m/z) ratios of peptides and peptide fragments were collected according to the following purposes. Some 10 fragment maps (MS2 scan) were obtained after each full scan (m/z 400–1800). Mascot 2.2 software was used to search the Mascot database and obtain the protein identification results. Mascot is a free online search engine, and the following search parameters were used: enzyme digestion, trypsin /P; maximum allowable number of missing sites, 2; fixed modification type, urea methylation (c); variable modification type, oxidation (m); decoy database model, reverse; primary ion mass tolerance, ±20 ppm; secondary ion mass tolerance, 0.1 Da; and final filtration standard, ≥20.
2.2.3. Non-labeling Quantitation of the Metabonomics
Label-free quantification was used for semi-quantitative analysis of differences in total proteins in any sample and is suitable for semi-quantitative comparison of large sample sizes; instead of metabolites’ abundance and concentration, the SWATH technique was used for unlabeled semi-quantitative metabolomics, and significantly different results were obtained in the comparison. Peptide identification was performed using Proteome DiscovererTM (version 2.2, Thermo Scientific) and integrated error discovery rate (FDR) analysis. Search data in the metabolite sequence database were downloaded from UniProt in June 2020 (total: 562,755 entries). The MS/MS spectra were obtained by searching using the following custom search parameters: sample type, identified; cysteine alkylation, MMTS; digestion, trypsin; instrument, Q-Exactive MS; special factors, none; species, none; ID key, biological modification; database, 2020_june_uniprot-zebrafish.fasta; search intensity, thorough; and Roosevelt analysis, yes. Decoy databases were searched using MS/MS spectra to estimate the FDR of peptide identification. The bait database consists of reverse-translated protein sequences from the UniProt Zebrafish database. The FDR analysis was performed on the dataset considering peptides with confidence intervals of ≥95%.
The data acquisition instrument system mainly uses ultra-performance liquid chromatography (UPLC, shim pack UFLC Shimadzu CBM30A, https://www.shimadzu.com/, accessed on 1 January 2020) and tandem mass spectrometry (MS/MS) (QTRAP®, https://sciex.com/, accessed on 1 January 2020). Chromatographic column: Waters Acquity UPLC HSS T3 C18 1.8 µm, 2.1 mm × 100 mm. Mobile phase: phase A is ultra-pure water (0.04% acetic acid) and phase B is acetonitrile (0.04% acetic acid). Elution gradient: 0 min water/acetonitrile (95:5 v/v), 11.0 min 5:95 v/v, 12.0 min 5:95 v/v, 12.1 min 95:5 v/v, 14.0 min 95:5 v/v. Flow rate: 0.4 mL/min. Column temperature: 40 °C. Injection volume: 2 μL. The main mass spectrum conditions were as follows: electrospray ion source (ESI) temperature of 500 °C, mass spectrum voltages of 5500 V (positive) and −4500 V (negative), ion source gas I (GSI) at 55 psi, gas II (GS II) at 60 psi, and curtain gas (cur) at 25 psi; the collision-activated ionization (CAD) parameter was set to extreme. In the triple quadrupole (qtrap), each ion pair was scanned and detected according to the optimized clustering potential (DP) and collision energy (CE) [18].
Based on the self-built targeted standard database MWDB (hardware database), the information and secondary spectrum data were qualitatively analyzed according to the retention time RT (retention time) of the detected substance and the parent and daughter ions. Metabolite quantification was completed by multiple reaction monitoring (MRM) of triple-quadrupole mass spectrometry. In MRM mode, the first quadrupole screens the precursor ions (mother ions) of the target substance and excludes the precursor ions corresponding to other substances to preliminarily eliminate interference; after collision-induced ionization in the second quadrupole, the precursor ions are broken, and a series of distinct fragment ions of the substance are formed according to the structural characteristics of the substance itself. Next, the fragment ions are filtered through the third quadrupole to select a typical characteristic fragment ion. Unless the interference of the target ions is eliminated, the quantification is more accurate, and the repeatability is superior. After obtaining the data from different samples, the extracted ion chromatographic peaks of all metabolites are integrated under the peak area, and the chromatographic peaks of the same metabolite in different samples are integrated and corrected [19].
2.3. Transcriptomic Analysis, Gene Ontology (GO) and Kyoto Encyclopedia of Genes and Genomes (KEGG) Pathway Annotation
After the qualitative and semi-quantitative analysis of the detected significant different expression genes (DEGs) based on the data from RNA-seq (the parameter, see [4], and the log2fold change and FDR set at ≥2 and ≥95%), we compared the different multiple changes in the semi-quantitative information of DEGs in each group according to the grouping of specific samples. A volcano plot can be used to quickly view the differences in the expression levels of DEGs in two groups of samples, and the statistical significance of these differences. The relationship between different DEGs in each group is displayed in the form of a Venn diagram. By using the GO database, DEGs can be classified by their participation in biological processes (BPs), cellular components (CFs), and molecular functions (MFs). Blast2go software (http://www.blast2go.com/b2ghome, accessed on 10 June 2020) was used to transform the identified IDs from the UniProt accession number to GO IDs [4,16]. The GO IDs were submitted to the database for GO annotation. Using the KEGG database, genes can be classified by a participating pathway or function. The UniProt accession of each identified DEG was transformed into the KO ID, according to the ID mapping results of the UniProt database (http://www.uniprot.org/, accessed on 1 January 2019). Then, we annotated the DEGs in the KEGG database using the KO ID [4,16].
2.4. The Combined Analysis of Metabonomic and Transcriptomic Data
The combined analysis of metabolites and transcriptomes was performed via redundancy analysis (RDA) [4,7,15]. Integrative techniques are crucial for finding associations between distinct data types and filling mechanistic gaps. The KEGG paths enriched by the two genomics were used to draw bubble maps. Difference multiples for substances with Pearson correlation coefficients greater than 0.80 and p-values less than 0.05 in each difference group are shown by the nine quadrant plots [4,7,15,16]. The results of the correlation calculations for all differentially expressed genes and metabolites are plotted in the correlation-clustering heatmap. Correlations between metabolites and genes are represented by a network, and the results of correlations between differential genes and differential metabolites in each pathway with a Pearson correlation coefficient greater than 0.80 and corrected p-value less than 0.05 are selected for mapping. The O2PLS model was used to perform ensemble analysis between two datasets, including to determine the association between systems bionomics, the association between molecular regulatory mechanisms and phenotypes, and additional intrinsic relationships across a variety of large datasets [4,15]. All differentially expressed genes and metabolites were selected to build the O2PLS model, and variables with strong correlations and weights in different data groups were tentatively judged through load maps to screen out essential variables that influenced alternative omics [4,15].
2.5. Data Analysis
The number of metabolites, that is, the number of hits matched to the database, was expressed as mean ± standard deviation (SD). Statistically significant differences were determined using a one-way ANOVA and Duncan’s multiple range test, with a significance level of p < 0.05 [1,4,15,16].
3. Results and Discussion
The mass spectrometry data were processed using Software Analyst 1.6.3, and the results for the mixed QC sample are presented in Figure S1. Based on the local metabolic database, the metabolites in the samples were analyzed qualitatively and semi-quantitatively by mass spectrometry (Table S1). Figure S2a shows the semi-quantitative analysis of integral correction results for randomly selected metabolites in different samples [20]. The PCA results show the trend of metabolome separation among the groups, indicating whether there were fewer differences in the metabolome between the sample groups (Figure S2b–d), and whether the metabolites were adequately separated (Figure S2e). A total of 423 metabolites were found, as shown in Figure 1a; the results of the highest-ranked metabolites after differential multivariate log 2 processing in the group comparison are shown in Figure 1b. Overall, there were 35 and 34 significantly increased and decreased metabolites, respectively, when comparing between the MA and MC groups (Table 1); the volcano plot is shown in Figure 1c. The MEDN049 (L-saccharopine), MEDN049 (O-phospho-L-serine) and MEDN049 (P–hydroxyphenyl acetic acid) were more abundant in iron prawns, while the MEDN009 (L-aspartic acid), etc., were less abundant (Table 2); the violin chart is shown in Figure S3. The bubble diagram based on the KEGG signaling pathway between the two comparisons is shown in Figure 2. For both genders, vascular smooth muscle contraction, salivary/renin secretion, oxytocin/cGMP-PKG signaling and pathways in cancer, especially choline metabolism, are different. Regarding the differences between the iron and normal prawns, the pathways for histidine metabolism, neuroactive ligand–receptor interactions, and HIF-1 signaling were affected. The shared metabolites and DEGs in the comparisons for the female (with the same health status) gender and iron (with the same gender) were higher than those in the male and normal prawns (Figure 3). The reverse tendency was found in the correlation-clustering heat map (Figure 4), which was supported by the correlation network and the metabolite/DEG-loading diagram presented in Figure 5 and Figure 6. A previous study showed that choline metabolism in cancer and glycerophospholipid metabolism are significantly upregulated in three-year-old fish when compared with five-year-old fish after viral infection [21], which may be related to intestinal trimethylamine N-oxide release [22] and acetylcholinesterase/butyrylcholinesterase [23]. The hypoxia-inducible factor 1 signaling pathway, biosynthesis of amino acids, glycerophospholipid metabolism, and choline metabolism in cancer were enriched, and were found to be notable metabolic pathways that are closely related to temperature shifts in flounder metabolomic and lipidomic analyses [16]. The present study demonstrates that temperature shifts may shape energy metabolism and intestinal health, and alert the HIF-1 signaling pathway; finally, they may result in cancer pathways attributable to iron prawn formation [24].
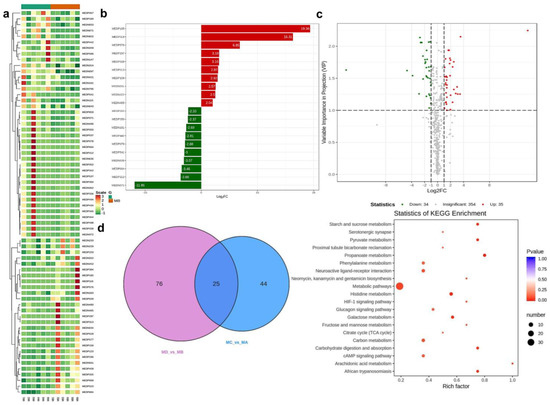
Figure 1.
The significant different metabolites in the “iron prawn” M. rosenbergii. (a): heatmap analysis was performed on all samples based on normalized data and clustering using R program scripts. (b): metabolite results at the top of the change list. In the (c) volcano plot, abscissa denotes the logarithm of the semi-quantitative difference multiple of a metabolite in the two samples; the ordinate indicates the VIP value. The green dots represent the down-regulated differential expression metabolite, the red dots represent the up-regulated differential expression metabolite, and the dots represent the metabolite detected with negligible differences. (d): Venn diagram for the shared and differing metabolites among the two comparisons (MC vs. MA, MD vs. MB). The richness factor is the ratio of the number of metabolites differentially expressed in the corresponding pathway to the total number of metabolites detected and annotated in the pathway. The larger the value, the greater the enrichment. The closer the p-value is to 0, the more significant the enrichment. The size of the points in Figure 1 indicates the number of significantly different metabolites enriched in the corresponding pathway.

Table 1.
Function annotation and analysis of the “iron prawn” M. rosenbergii.
Table 2.
The selected up- and down-regulated metabolites.
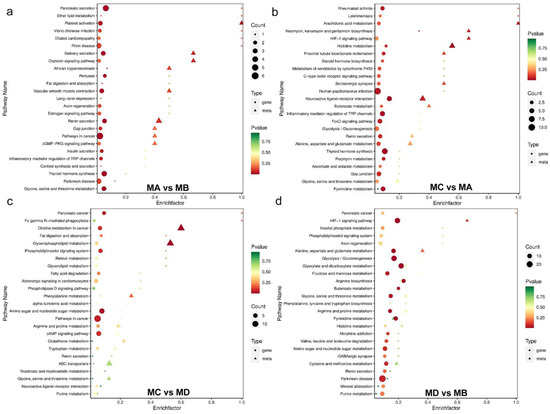
Figure 2.
Bubble diagram based on KEGG signaling pathways among the two comparisons of (a) MA vs. MB, (b) MC vs. MA, (c) MC vs. MD, and (d) MD vs. MB. The bubble diagram is a five dimensional diagram, that is, the KEGG path enriched by different assemblages is reflected through horizontal and vertical coordinates, bubble color gradient, shape and size. When the total number of KEGG paths exceeds 25, the transcriptome will prevail, and only the top 25 p-value pathways will be displayed. The abscissa represents the enrichment factor (Diff/Background) of the pathway in different omics, and the ordinate represents the name of the KEGG path; The gradual change of red yellow green represents that the significance of enrichment changes from high to medium to low, expressed by p-value; The shape of bubbles represents different genomics, and the size of bubbles represents the number of different metabolites or genes. The larger the number, the larger the point.
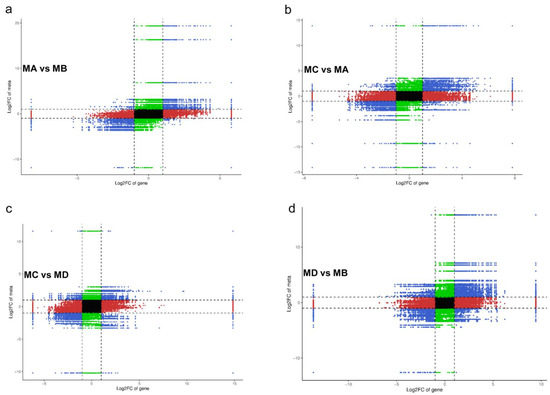
Figure 3.
Nine quadrant diagram of correlation analysis of (a) MA vs. MB, (b) MC vs. MA, (c) MC vs. MD, and (d) MD vs. MB). The nine quadrant diagram, which is divided into 1–9 quadrants from left to right and from top to bottom with black dotted line. The abscissa represents log2FC of gene, and the ordinate represents log2FC of metabolite. Quadrant 5 shows that the differential grouping gene and metabolite are not differentially expressed. Quadrant 3, 7 show that the gene and metabolite are consistent with the differential expression mode of the metabolite. The expression change in the metabolite may be positively regulated by the gene. Quadrant 1.9 shows that contrary to the differential expression pattern of quadrant genes and metabolites, genes and metabolites with inconsistent regulation trends may be negatively regulated by genes. The expression of metabolites in quadrants 2.4, 6, and 8 remains unchanged, the genes are up and down or the gene expression remains unchanged, and the metabolites are up and down.
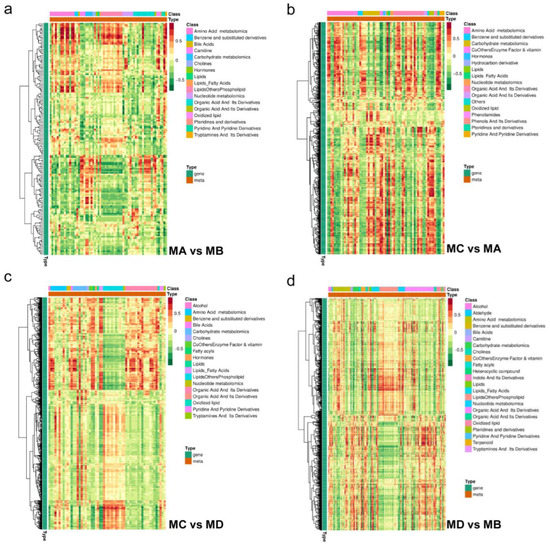
Figure 4.
Correlation clustering heat map of (a) MA vs. MB, (b) MC vs. MA, (c) MC vs. MD, and (d) MD vs. MB. Each line in the figure is a gene, and each column is a metabolite. Red represents a positive correlation between genes and metabolites, and green represents a negative correlation between genes and metabolites.
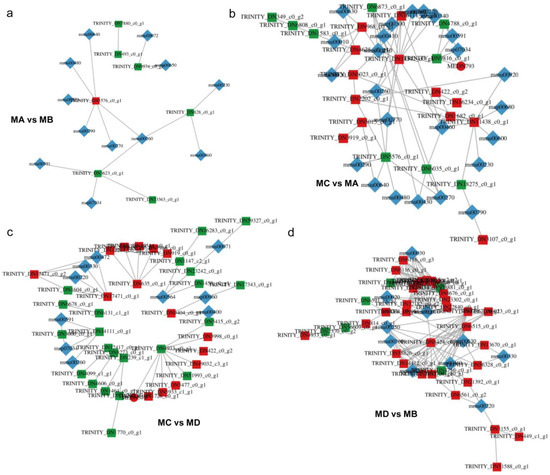
Figure 5.
Correlation network diagram of (a) MA vs. MB, (b) MC vs. MA, (c) MC vs. MD, and (d) MD vs. MB. In the figure, metabolites are marked with green squares, and genes are marked with red circles. The solid line represents positive correlation and the dotted line represents negative correlation. In the diagram, substances of different omics are marked with different shapes.
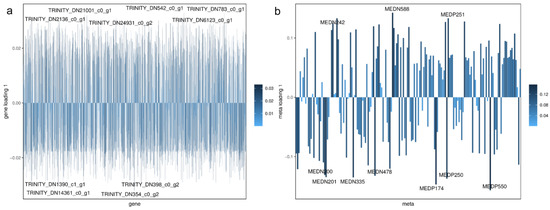
Figure 6.
DGEs (a) and Metabolite (b) loadings diagram. The distance from each point to the origin or the height of the histogram in the figure represents the magnitude of the correlation between the substance and another omics, and the darker the color is, the greater the correlation is. The figure shows the top ten substances that have a greater impact on the other omics.
The categorized KEGG pathways and the hit numbers (Figure S4) show that metabolic pathways were heavily enriched, as presented in Table 3. A search of the KEGG database revealed that these metabolites are distributed in 114 KEGG pathways. These pathways include metabolic pathways, biosynthesis of secondary metabolites, ABC transporters, glycine, serine and threonine metabolism, biosynthesis of unsaturated fatty acids, carbohydrate digestion and absorption, glucosinolate biosynthesis, fat digestion and absorption, insulin resistance/secretion, protein digestion and absorption, regulation of lipolysis in adipocytes, choline metabolism in cancer, central carbon metabolism in cancer, biosynthesis of amino acids, glycerophospholipid/carbon/glutathione/glycerolipid/glyoxylate and dicarboxylate metabolism, the glucagon/cAMP signaling pathway, glycolysis/gluconeogenesis, and vitamin digestion and absorption. The most heavily affected KEGG pathways are presented in Table 4, and the shared and specific metabolites between the two comparisons (MC vs. MA, MD vs. MB) are shown in Figure 1d. The shared and specific metabolite details of the “iron prawn”, M. rosenbergii (Table S2), included some metabolites associated with carbohydrate and amino acid metabolism that were decreased in the female iron prawns, while the organic acid and its derivatives increased. Metabolic pathways, ABC transporters, starch and sucrose metabolism, insulin resistance/secretion, fatty digestion and absorption, and lipid metabolism were enriched. These metabolic pathways have been reported in prawns with starvation [16], low pH [25], and salinity [26] stress. The pathways of starch and sucrose metabolism are enriched in Exopalaemon carinicauda under thermal stress [27]. The pathways of carbon/lipid/glycerolipid metabolism were reported in ammonia–nitrogen stress [28] and chronic lead exposure [29]. Among them, MEDP174 (purine) has been previously reported in ammonia–N-exposed prawn [28], fish species and other vertebrate animals [30], for example, MEDN201 (succinic Acid) in Litopenaeus vannamei [31], and MEDN588 (Glycerol 3-phosphate) in rainbow [32].
Table 3.
The selected pathways among the comparisons.
Table 4.
The enriched KEGG pathway among the comparisons.
With respect to the male iron prawn, the pathway for organic acids and their derivatives decreased and lipid metabolism increased. The pathways of starch, and sucrose/carbon/galactose metabolism were enriched (Figure 1d). The choline metabolism pathways in cancer and glycerophospholipid/histidine/propanoate metabolism were affected in the iron prawns. A recent study showed self-regulating mechanisms might be the factor preventing prawn from the lethality by obalt-60 gamma radiation, thanks to the existence of the choline metabolism [33]. The glycerophospholipid metabolism has been reported in Jiang et al. [17]; the histidine domain may be related to the activation of caspase-1 [34]. The glycerophospholipid metabolism has been reported in tilapia following microplastic exposure [35]. In the PM groups in our previous study, the voltage-dependent L-type calcium channel subunit alpha-1C was differentially expressed [1]. These metabolites are expressed differentially in the muscles of M. rosenbergii, indicating differences in the digestive system, energy usage, and lipid metabolism in the severe growth retardation of the “iron prawn”. The O2PLS model can be used to more accurately identify key regulatory phenomena based on reflecting the overall impact and variable shifts between different data groups, in addition to flexibly conducting omics data-mining to discover regulatory information at different levels, as well as help in establishing systems biology regulatory networks [36,37].
4. Conclusions
According to the GO and KEGG analysis results, 423 differentially expressed metabolites and genes were mainly distributed in metabolic pathways, ABC transporters, the starch and sucrose metabolism, insulin resistance/secretion, fat digestion and absorption, and lipid metabolism. Overall, 35 and 34 metabolites were significantly increased and decreased, respectively, in the comparison between the MA and MC groups. Compared with male iron prawns, the representations of the carbohydrate and amino acid metabolism pathways were lower, and organic acids and their derivatives were higher in female iron prawns. The pathways of starch and sucrose/carbon/galactose metabolism were enriched among different genders of normal and iron prawns. The pathways of choline metabolism in cancer, neuroactive ligand–receptor interactions, the HIF-1 signaling pathway and glycerophospholipid/histidine/propanoate metabolism were also distinguished in iron and normal prawns.
Supplementary Materials
The following supporting information can be downloaded at: https://www.mdpi.com/article/10.3390/fishes8040196/s1, Figure S1: Superposition diagram of total ion flow diagram (TIC diagram, a) detected by mass spectrometry, MRM metabolite detection multi peak (b) and Tic overlap diagram (c) of the mixed QC sample; Figure S2: The integral correction chart and variability for metabolite semi-quantitative analysis; Figure S3: The data distribution and its probability density via the violin diagram. Figure S4: A metabolite with significant difference, the classification diagram is made according to the types of pathways in KEGG according to the annotation results of KEGG; Table S1: The numbers of the significant expression metabolites and partial calculation results of orthogonal partial least squares discriminant analysis (OPLS-DA) metabolite database mapping table; Table S2: The shared and specific proteins in the detected tissues of the ‘iron prawn” M. rosenbergii.
Author Contributions
X.-L.L. and Q.G. defined the experimental design, managed the experiment, co-wrote the paper, and approved the final draft of the manuscript. P.-J.S., W.-P.J., J.-L.M. and H.-H.C. managed and analyzed the data, prepared figures and/or tables. X.-L.L. performed the statistical analysis. All authors collaborated to interpretation and discussion of the results. All authors have read and agreed to the published version of the manuscript.
Funding
This study was jointly supported by Key Scientific and Technological Grant of Zhejiang for Breeding New Agricultural Varieties (2021C02069-4), Scientific Research Institutes Special Project of Zhejiang Province (2023YSZX002), and Huzhou Special Project for “Rural Revitalization” (2021ZD2036).
Institutional Review Board Statement
The animal study protocol was approved by the Institutional Review Board (or Ethics Committee) of Agriculture Ministry Key Laboratory of Healthy Freshwater Aquaculture (protocol code 2011AA1004020012).
Data Availability Statement
All data generated or analyzed during this study are included in this published article.
Conflicts of Interest
The authors declare no conflict of interest.
References
- Li, X.L.; Gao, Q.; Shen, P.J.; Zhang, Y.F.; Jiang, W.P.; Huang, Z.Y.; Peng, F.; Gu, Z.M.; Chen, X.F. Proteomic analysis of individual giant freshwater prawn, Macrobrachium rosenbergii, growth retardants. J. Proteom. 2021, 241, 104224. [Google Scholar] [CrossRef]
- Guo, C.; Huang, X.Y.; Yang, M.J.; Wang, S.; Ren, S.T.; Li, H.; Peng, X.X. GC/MS-based metabolomics approach to identify biomarkers differentiating survivals from death in crucian carps infected by Edwardsiella tarda. Fish Shellfish Immunol. 2014, 39, 215–222. [Google Scholar] [CrossRef]
- Young, T.; Alfaro, A.C.; Villas-Bôas, S.G. Metabolic profiling of mussel larvae: Effect of handling and culture conditions. Aquac. Int. 2016, 24, 843–856. [Google Scholar] [CrossRef]
- Xu, G.; Du, F.; Li, Y.; Nie, Z.; Xu, P. Integrated application of transcriptomics and metabolomics yields insights into population-asynchronous ovary development in Coilia nasus. Sci. Rep. 2016, 6, 31835. [Google Scholar] [CrossRef]
- Ma, Q.; Chen, Q.; Shen, Z.; Li, D.; Han, T.; Qin, J.; Chen, L.; Du, Z. The metabolomics responses of Chinese mitten-hand crab (Eriocheir sinensis) to different dietary oils. Aquaculture 2017, 479, 188–199. [Google Scholar] [CrossRef]
- Liang, P.; Li, R.; Sun, H.; Zhang, M.; Cheng, W.; Chen, L.; Cheng, X.; Akoh, C.C. Phospholipids composition and molecular species of large yellow croaker (Pseudosciaena crocea) roe. Food Chem. 2018, 245, 806–811. [Google Scholar] [CrossRef]
- Zhao, H.; Chong, J.; Tang, R.; Li, L.; Xia, J.; Li, D. Metabolomics investigation of dietary effects on flesh quality in grass carp (Ctenopharyngodon idellus). Gigascience 2018, 7, giy111. [Google Scholar] [CrossRef]
- Jiang, W.; Tian, X.; Fang, Z.; Li, L.; Dong, S.; Li, H.; Zhao, K. Metabolic responses in the gills of tongue sole (Cynoglossus semilaevis) exposed to salinity stress using NMR-based metabolomics. Sci. Total Environ. 2019, 653, 465–474. [Google Scholar] [CrossRef] [PubMed]
- Liu, F.; Li, S.; Yu, Y.; Sun, M.; Xiang, J.; Li, F. Effects of ammonia stress on the hemocytes of the Pacific white shrimp Litopenaeus vannamei. Chemosphere 2020, 239, 124759. [Google Scholar] [CrossRef] [PubMed]
- Jiang, Y.X.; Shi, W.J.; Ma, D.D.; Zhang, J.N.; Ying, G.G.; Zhang, H.; Ong, C.N. Dydrogesterone exposure induces zebrafish ovulation but leads to oocytes over-ripening: An integrated histological and metabolomics study. Environ. Int. 2019, 128, 390–398. [Google Scholar] [CrossRef] [PubMed]
- Nguyen, T.M.T.; Chen, T.Y.; Shiau, C.Y.; Cheng, Y.T.; Chang, Y.W. Study on biochemical divergences of the meat and egg of freshwater prawns (Macrobrachium rosenbergii). Food Sci. Nutr. 2019, 7, 2017–2023. [Google Scholar] [CrossRef] [PubMed]
- Kuehnbaum, N.L.; Britz-McKibbin, P. New advances in separation science for metabolomics: Resolving chemical diversity in a post-genomic era. Chem. Rev. 2013, 113, 2437–2468. [Google Scholar] [CrossRef] [PubMed]
- Lulijwa, R.; Alfaro, A.C.; Young, T. Metabolomics in salmonid aquaculture research: Applications and future perspectives. Rev. Aquac. 2021, 14, 547–577. [Google Scholar] [CrossRef]
- Takahashi, H.; Kai, K.; Shinbo, Y.; Tanaka, K.; Ohta, D.; Oshima, T.; Altaf-Ul-Amin, M.; Kurokawa, K.; Ogasawara, N.; Kanaya, S. Metabolomics approach for determining growth-specific metabolites based on Fourier transform ion cyclotron resonance mass spectrometry. Anal. Bioanal. Chem. 2008, 391, 2769–2782. [Google Scholar] [CrossRef] [PubMed]
- Rise, M.L.; Martyniuk, C.J.; Chen, M. Comparative physiology and aquaculture: Toward Omics-enabled improvement of aquatic animal health and sustainable production. Comp. Biochem. Physiol. Part D Genom. Proteom. 2019, 31, 100603. [Google Scholar] [CrossRef]
- Li, F.; Fu, C.; Xie, Y.; Wang, A.; Li, J.; Gao, J.; Cui, X. Transcriptional responses to starvation stress in the hepatopancreas of oriental river prawn Macrobrachium nipponense. Environ. Pollut. 2019, 252 Pt A, 14–20. [Google Scholar] [CrossRef]
- Jiang, Q.; Qian, L.; Gu, S.; Guo, X.; Zhang, X.; Sun, L. Investigation of growth retardation in Macrobrachium rosenbergii based on genetic/epigenetic variation and molt performance. Comp. Biochem. Physiol. Part D: Genom. Proteom. 2020, 35, 100683. [Google Scholar] [CrossRef]
- Chen, W.; Gong, L.; Guo, Z.; Wang, W.; Zhang, H.; Liu, X.; Yu, S.; Xiong, L.; Luo, J. A Novel Integrated method for large-scale detection, identification, and quantification of widely targeted metabolites: Application in the study of rice metabolomics. Mol. Plant 2013, 6, 1769–1780. [Google Scholar] [CrossRef]
- Fraga, C.G.; Clowers, B.H.; Moore, R.J.; Zink, E.M. Signature-discovery approach for sample matching of a nerve-agent precursor using liquid chromatography-mass spectrometry, XCMS, and chemometrics. Anal. Chem. 2010, 82, 4165–4173. [Google Scholar] [CrossRef]
- Thévenot, E.A.; Roux, A.; Xu, Y.; Ezan, E.; Junot, C. Analysis of the human adult urinary metabolome variations with age, body mass index, and gender by implementing a comprehensive workflow for univariate and opls statistical analyses. J. Proteome Res. 2015, 14, 3322–3335. [Google Scholar] [CrossRef]
- He, L.; Zhu, D.; Liang, X.; Li, Y.; Liao, L.; Yang, C.; Huang, R.; Zhu, Z.; Wang, Y. Multi-omics sequencing provides insights into age-dependent susceptibility of grass carp (Ctenopharyngodon idellus) to reovirus. Front. Immunol. 2021, 12, 694965. [Google Scholar] [CrossRef]
- Ebert, T.; Painer, J.; Bergman, P.; Qureshi, A.R.; Giroud, S.; Stalder, G.; Kublickiene, K.; Göritz, F.; Vetter, S.; Bieber, C.; et al. Insights in the regulation of trimetylamine N-oxide production using a comparative biomimetic approach suggest a metabolic switch in hibernating bears. Sci. Rep. 2020, 10, 20323. [Google Scholar] [CrossRef]
- Akimov, M.G.; Kudryavtsev, D.S.; Kryukova, E.V.; Fomina-Ageeva, E.V.; Zakharov, S.S.; Gretskaya, N.M.; Zinchenko, G.N.; Serkov, I.V.; Makhaeva, G.F.; Boltneva, N.P.; et al. Arachidonoylcholine and other unsaturated long-chain acylcholines are endogenous modulators of the acetylcholine signaling system. Biomolecules 2020, 10, 283. [Google Scholar] [CrossRef]
- Sun, S.; Xuan, F.; Fu, H.; Ge, X.; Zhu, J.; Qiao, H.; Jin, S.; Zhang, W. Molecular characterization and mRNA expression of hypoxia inducible factor-1 and cognate inhibiting factor in Macrobrachium nipponense in response to hypoxia. Comp. Biochem. Physiol. Part B Biochem. Mol. Biol. 2016, 196–197, 48–56. [Google Scholar] [CrossRef]
- Lu, Z.B.; Li, Y.D.; Jiang, S.G.; Yang, Q.B.; Jiang, S.; Huang, J.H.; Yang, L.S.; Chen, X.; Zhou, F.L. Transcriptome analysis of hepatopancreas in penaeus monodon under acute low pH stress. Fish Shellfish Immunol. 2022, 131, 1166–1172. [Google Scholar] [CrossRef] [PubMed]
- Fan, Y.; Feng, J.; Xie, N.; Ling, F.; Wang, Z.; Ma, K.; Hua, X.; Li, J. RNA-seq provides novel insights into response to acute salinity stress in oriental river prawn Macrobrachium nipponense. Mar. Biotechnol. 2022, 24, 820–829. [Google Scholar] [CrossRef] [PubMed]
- Shi, K.; Li, J.; Lv, J.; Liu, P.; Li, J.; Li, S. Full-length transcriptome sequences of ridgetail white prawn Exopalaemon carinicauda provide insight into gene expression dynamics during thermal stress. Sci. Total Environ. 2020, 747, 141238. [Google Scholar] [CrossRef] [PubMed]
- Dong, X.; Liu, Q.; Kan, D.; Zhao, W.; Guo, H.; Lv, L. Effects of ammonia-N exposure on the growth, metabolizing enzymes, and metabolome of Macrobrachium rosenbergii. Ecotoxicol. Environ. Saf. 2020, 189, 110046. [Google Scholar] [CrossRef] [PubMed]
- Ding, Z.; Kong, Y.; Shao, X.; Zhang, Y.; Ren, C.; Zhao, X.; Yu, W.; Jiang, T.; Ye, J. Growth, antioxidant capacity, intestinal morphology, and metabolomic responses of juvenile Oriental river prawn (Macrobrachium nipponense) to chronic lead exposure. Chemosphere 2019, 217, 289–297. [Google Scholar] [CrossRef]
- Guasch-Ferré, M.; Bhupathiraju, S.N.; Hu, F.B. Use of metabolomics in improving assessment of dietary intake. Clin. Chem. 2018, 64, 82–98. [Google Scholar] [CrossRef]
- Duan, Y.; Wang, Y.; Xiong, D.; Zhang, J. RNA-seq revealed the signatures of immunity and metabolism in the Litopenaeus vannamei intestine in response to dietary succinate. Fish Shellfish Immunol. 2019, 95, 16–24. [Google Scholar] [CrossRef] [PubMed]
- Driedzic, W.R.; Ewart, K.V. Control of glycerol production by rainbow smelt (Osmerus mordax) to provide freeze resistance and allow foraging at low winter temperatures. Comp. Biochem. Physiol. B Biochem. Mol. Biol. 2004, 139, 347–357. [Google Scholar] [CrossRef]
- Stalin, A.; Suganthi, P.; Mathivani, S.; Broos, K.V.; Gokula, V.; Sadiq Bukhari, A.; Syed Mohamed, H.E.; Singhal, R.K.; Venu-Babu, P. Effect of cobalt-60 gamma radiation on total hemocyte content and biochemical parameters in Macrobrachium rosenbergii (De Man, 1879). Int. J. Radiat. Biol. 2019, 95, 753–763. [Google Scholar] [CrossRef] [PubMed]
- Yuan, H.; Zhang, W.; Jin, S.; Jiang, S.; Xiong, Y.; Chen, T.; Gong, Y.; Qiao, H.; Fu, H. Transcriptome analysis provides novel insights into the immune mechanisms of Macrobrachium nipponense during molting. Fish Shellfish Immunol. 2022, 131, 454–469. [Google Scholar] [CrossRef]
- Lu, X.; Zhang, J.X.; Zhang, L.; Wu, D.; Tian, J.; Yu, L.J.; He, L.; Zhong, S.; Du, H.; Deng, D.F.; et al. Comprehensive understanding the impacts of dietary exposure to polyethylene microplastics on genetically improved farmed tilapia (Oreochromis niloticus): Tracking from growth, microbiota, metabolism to gene expressions. Sci. Total Environ. 2022, 841, 156571. [Google Scholar] [CrossRef] [PubMed]
- Bouhaddani, S.E.; Houwing-Duistermaat, J.; Salo, P.; Perola, M.; Jongbloed, G.; Uh, H.W. Evaluation of O2PLS in Omics data integration. BMC Bioinform. 2016, 17 (Suppl. S2). [Google Scholar] [CrossRef]
- Fuady, A.M.; El Bouhaddani, S.; Uh, H.W.; Houwing-Duistermaat, J. Estimation of the effect of surrogate multi-omic biomarkers. Theor. Biol. Forum. 2021, 114, 59–73. [Google Scholar]
Disclaimer/Publisher’s Note: The statements, opinions and data contained in all publications are solely those of the individual author(s) and contributor(s) and not of MDPI and/or the editor(s). MDPI and/or the editor(s) disclaim responsibility for any injury to people or property resulting from any ideas, methods, instructions or products referred to in the content. |
© 2023 by the authors. Licensee MDPI, Basel, Switzerland. This article is an open access article distributed under the terms and conditions of the Creative Commons Attribution (CC BY) license (https://creativecommons.org/licenses/by/4.0/).