Article

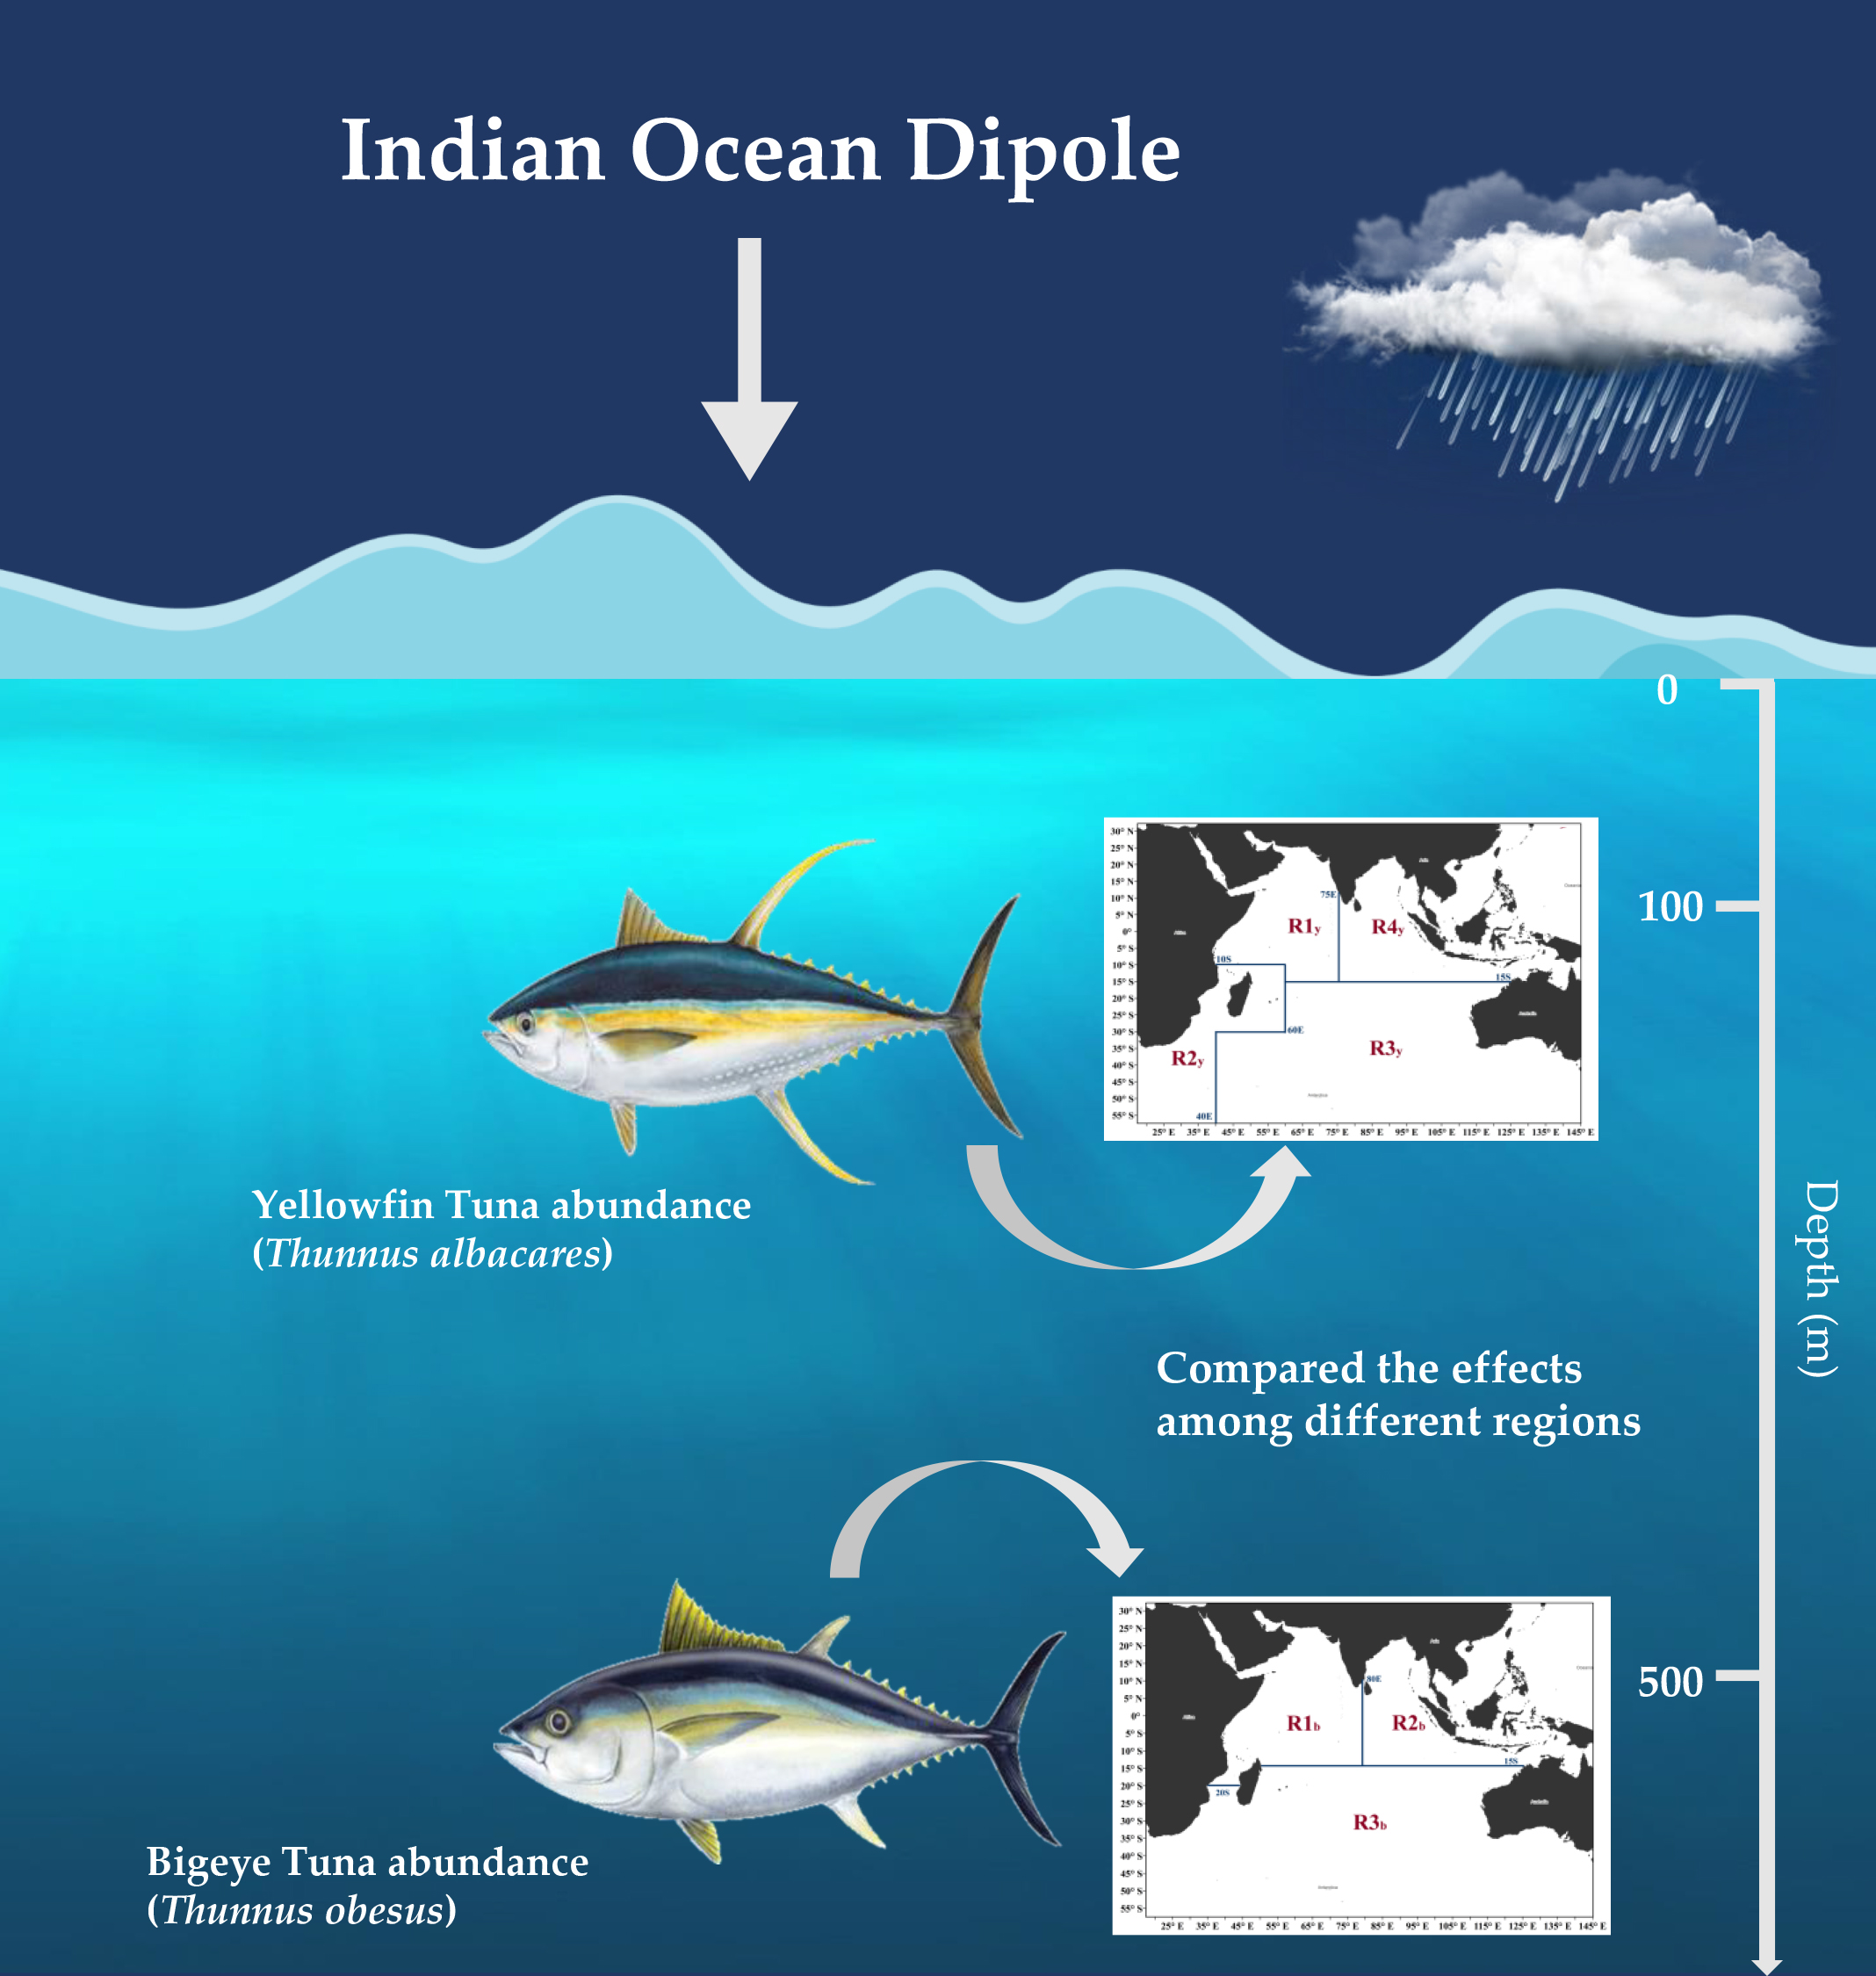
Effects of Climate Variability on Two Commercial Tuna Species Abundance in the Indian Ocean

1
College of Marine Sciences, Shanghai Ocean University, 999 Hucheng Huan Road, Shanghai 201306, China
2
Key Laboratory of Sustainable Exploitation of Oceanic Fisheries Resources, Ministry of Education, Shanghai Ocean University, Shanghai 201306, China
3
Department of Biological Sciences, Florida International University (Biscayne Bay Campus), North Miami Beach, FL 33181, USA
*
Author to whom correspondence should be addressed.
Fishes 2023, 8(2), 99; https://doi.org/10.3390/fishes8020099
Submission received: 10 January 2023 / Revised: 30 January 2023 / Accepted: 2 February 2023 / Published: 7 February 2023

Abstract

:
Oceanic temperature fluctuations are one of the leading factors affecting marine fish populations. Indian Ocean Dipole (IOD), characterized as the sea surface temperature (SST) anomaly change, is an ocean–atmosphere interactive process causing interannual climate variability in the Indian Ocean. Influences of the IOD on the tuna catch rates are supported by previous research. Yet, there remains limited information about the impacts on the abundance of tuna stocks. In this study, we used the standardized Catch Per Unit Effort (CPUE) index to present the stock abundance and compared the effects of the IOD on the bigeye tuna (Thunnus obesus) and yellowfin tuna (Thunnus albacares) among different management areas of the Indian Ocean Tuna Commission (IOTC). Results show significant correlations between IOD events on both species’ abundance in the tropical western Indian Ocean. However, in the tropical eastern Indian Ocean and the southern Indian Ocean, neither bigeye nor yellowfin tuna abundances were significantly correlated by the IOD. For the whole Indian Ocean, IOD was significantly correlated uniquely with the yellowfin tuna abundance. Our results emphasized the importance of evaluating the climate variability effects over fisheries abundance species by species and per fishing areas analyses.

Graphical Abstract

1. Introduction

Large-scale climate regime shifts affect fish population dynamics by altering their distribution, growth, reproduction, and so on. The most common phenomenon is the fluctuating ocean temperature. In response to the oscillation of sea surface temperature (SST), fish may move to different ocean areas or depths. In the northwest Atlantic Ocean, commercially important fish stocks such as alewife (Alosa pseudoharengus), silver hake (Merluccius bilinearis), and red hake (Urophycis chuss) showed obvious poleward migrations. This is associated with the Atlantic Multidecadal Oscillation positive events in the late 1990s and 2000s [1]. The longitudinal gravity center of fishing grounds of the skipjack tuna (Katsuwonus pelamis) in the western and central Pacific Ocean varied by up to 40° of longitude between strong El Niño and La Niña conditions [2]. Demersal fish assemblage in the North Sea deepened by about 3.6 m per decade as the bottom water temperature gets warmer [3]. Temperature is also a critical spawning cue that greatly influences the recruitment success of fish populations [4,5]. For example, recruitments of tropical skipjack tuna and yellowfin tuna in the Pacific Ocean increased during El Niño events; whereas subtropic albacore (Thunnus alalunga) had lower recruitment during El Niño, yet higher recruitment during La Niña [6]. Reef fishes in the western-central Atlantic Ocean showed lower fecundity, smaller eggs, or reduced pairing due to warmer water temperatures caused by climate change [7].
Climate variability could also affect fisheries by changing the habitat environment of fish populations. For example, the availability of Peruvian hake (Merluccius gayi peruanus), especially juvenile abundance, increased during El Niño events which were coupled with the elevated oxygen content and water temperature in the Peruvian coastal [8,9]. North Atlantic Oscillation (NAO) was negatively correlated with the landings of anchovy stock (Engraulis encrasicolus) in the Gulf of Cadiz due to changes in the sea temperature, run-off, and nutrient mixtures [10].
The Indian Ocean Dipole (IOD), a climate oscillation, occurs in the Indian Ocean due to the interaction of the SST and winds [11,12]. IOD events characterized the SST anomaly change associated with wind direction and precipitation deviations. IOD events experience two phases: positive and negative. During the positive phase, the winds at the surface across the Indian Ocean become more easterly bringing warmer waters to the west. This causes the temperature of the sea to be higher than average in the western Indian Ocean, while lower than average in the eastern Indian Ocean. The opposite is observed during the negative phase of IOD; westerly winds intensify, allowing warmer waters to the east. The SST becomes cooler in the western Indian Ocean and warmer in the eastern Indian Ocean [11,13].
After the Pacific Ocean, the Indian Ocean is the second ocean area to support the world’s largest tuna fisheries, which accounts for 23.3% of worldwide tuna catches (in live weight) in 2020. Yellowfin tuna (Thunnus albacares) and bigeye tuna (Thunnus obesus) are two important commercial tuna species inhabit tropical and subtropical waters, therefore they are commonly referred to as tropical tuna. Combined with skipjack tuna (Katsuwonus pelamis), these three tropical tuna species accounted for 94.2% of global tuna catch in 2020. Tropical tuna are also the main target species in the Indian Ocean. Of the tropical tunas, skipjack tuna contributes the most to catches (51.6%), followed by yellowfin (40.6%) and bigeye (7.8%) tuna in the Indian Ocean in 2020 (data from FAO FishStat database, available at https://www.fao.org/fishery/statistics-query/en/capture/capture_quantity, accessed on 21 January 2023). Yellowfin and bigeye tuna were both distributed in the pelagic zone. However, yellowfin tuna generally spreads in the mixing layer or at the top of the thermocline [14]. Both temperature and dissolved oxygen can affect its vertical distribution [15,16]. Dissimilarly, bigeye tuna has a higher O2 affinity that can adapt to deeper waters [17]. Therefore, the habitats of bigeye tuna are usually wider than yellowfin tuna [18,19,20,21]. Based on their diverse habitats, we hypothesize that IOD events may have different effects on bigeye and yellowfin tuna.
There are some studies explaining the influence of IOD on tuna stock. However, as the catch data are readily available, most of them mainly focus on the effects on the catch rates. For example, study found that the catch rates of longline yellowfin tuna in the tropical western Indian Ocean decreased during the positive IOD phase, and the fishing grounds were hampered in the northern and western margins of the western Indian Ocean. In contrast, during the negative IOD phase, the catch rates increased, and the fishing grounds expanded into the central regions of the western Indian Ocean [22]. In the eastern Indian Ocean off of Java Island (Indonesia), catch rates of the longline bigeye tuna fisheries tend to increase in the positive IOD phase [23]. Although it is meaningful to learn and predict the environmental impacts on fisheries, it is also important to study the effects on tuna stock abundance and provide valuable information for stock conservation and management. Therefore, in this study, we used the standardized Catch Per Unit Effort (CPUE) index to present the stock abundance and compared the IOD events effects on bigeye and yellowfin tuna across different regions of the Indian Ocean.

2. Materials and Methods

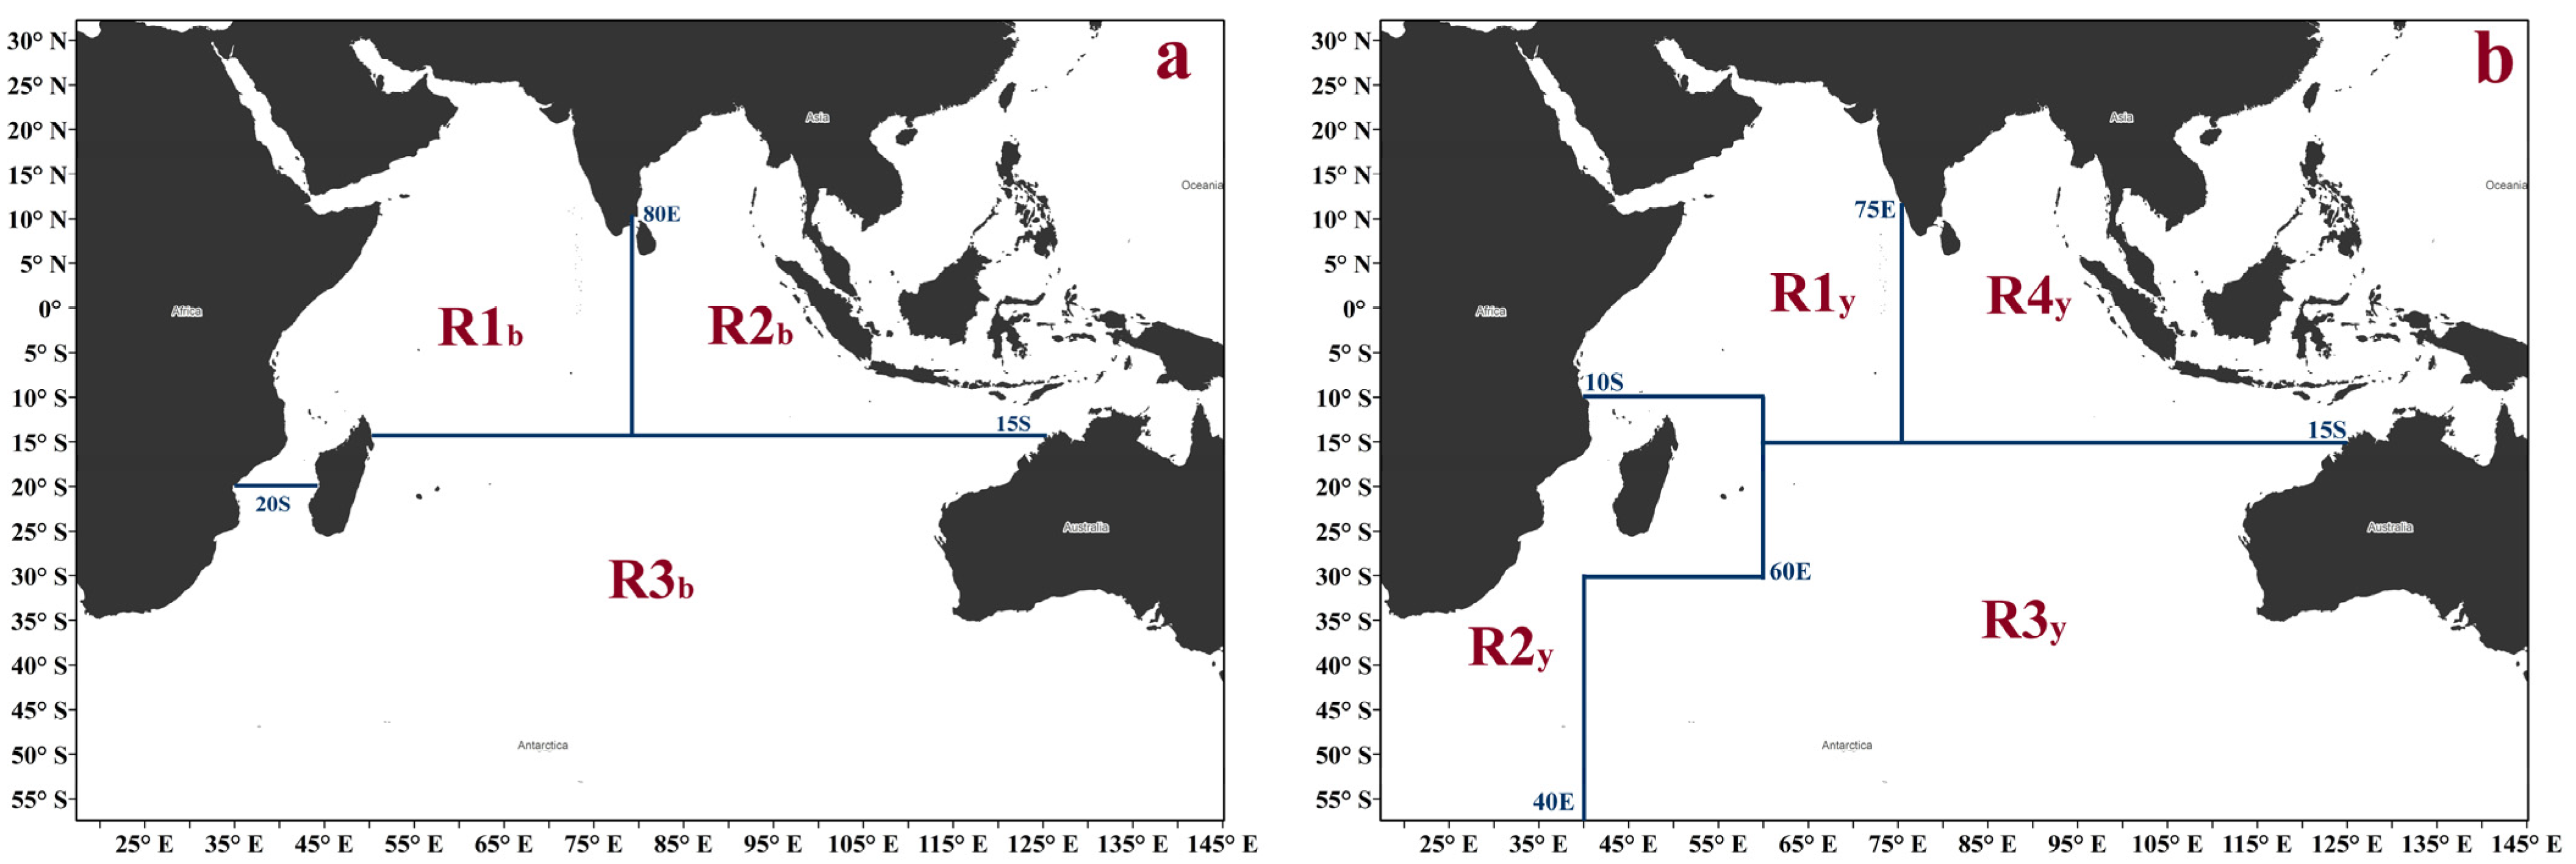
2.1. Spatial Structure

The research area of this study covered the whole Indian Ocean, which was divided into different regions based on the spatial structures carried out by the Indian Ocean Tuna Commission (IOTC). The spatial stratifications were used to account for the differences in biological characteristics of the species, fisheries/gears, and the availability of data [24]. In the Indian Ocean, the definitions of spatial structures mainly depend on the spatially distinct fisheries and the availability of the CPUE indices [25,26]. The main fishing gear of bigeye tuna is longline (38% in 2020) in the Indian Ocean, whereas the yellowfin tuna is mainly caught by purse seine (34% of the catch in 2020) [27]. Therefore, the spatial structures are different as their distinct patterns of fishery operation. The bigeye tuna stock was stratified into the western tropical region (R1b), eastern tropical region (R2b), and southern region (R3b) [25] (Figure 1a). The spatial structure of yellowfin tuna comprises of four regions (Figure 1b): western tropical region (R1y), the eastern tropical region (R4y), the southern area divided into the southwestern area (R2y), and the southeastern area (R3y) [26].

2.2. Standardized CPUE Data

Standardized CPUE can be assumed to be proportional to stock abundance, and often treated as the indices of relative abundance in the stock assessment [28]. Quarterly standardized CPUE data were available from the IOTC 21st working party on tropical tuna (data available at: https://iotc.org/WPTT/21/Data/13a-CPUE_BET_YFT_joint, accessed on 2 February 2022). Standardized CPUE indices of bigeye tuna and yellowfin tuna were derived using generalized linear models (GLM) from operational longline catch and effort data provided by Japan, Korea, Taiwan, China, and Seychelles [29]. CPUE indices were calculated as:
ln ( C P U E + k ) ~ y r q t r + v e s s i d + l a t l o n g 5 + t a r g e t + ϕ ( h o o k s ) + ε
where CPUE is the nominal CPUE, k is 10% of the mean CPUE to account for the zero catches. The covariates were year-quarter (yrqtr), vessel identifier (vessid), 5° square location (latlong5). The targeting variable (target) was either cluster, hooks between floats (hbf), or both cluster and hbf, and a cubic spline function ϕ with 10 degrees of freedom applied to the continuous variable hooks [29].
The CPUE data of bigeye and yellowfin tuna are available from 1979 to 2018 and 1975 to 2018, respectively. However, before 2000, there were dramatic declines in abundance with the increasing fishing activities. After the establishment of the IOTC in 1996, the fisheries have been effectively managed, and the abundance of bigeye and yellowfin tuna was relatively stable compared to the early years. To avoid the impact of the IOD on tuna abundance offset by fishery activities, we selected the standardized CPUE data from the recent stable catch mode years: 2000~2018 (Table S1).

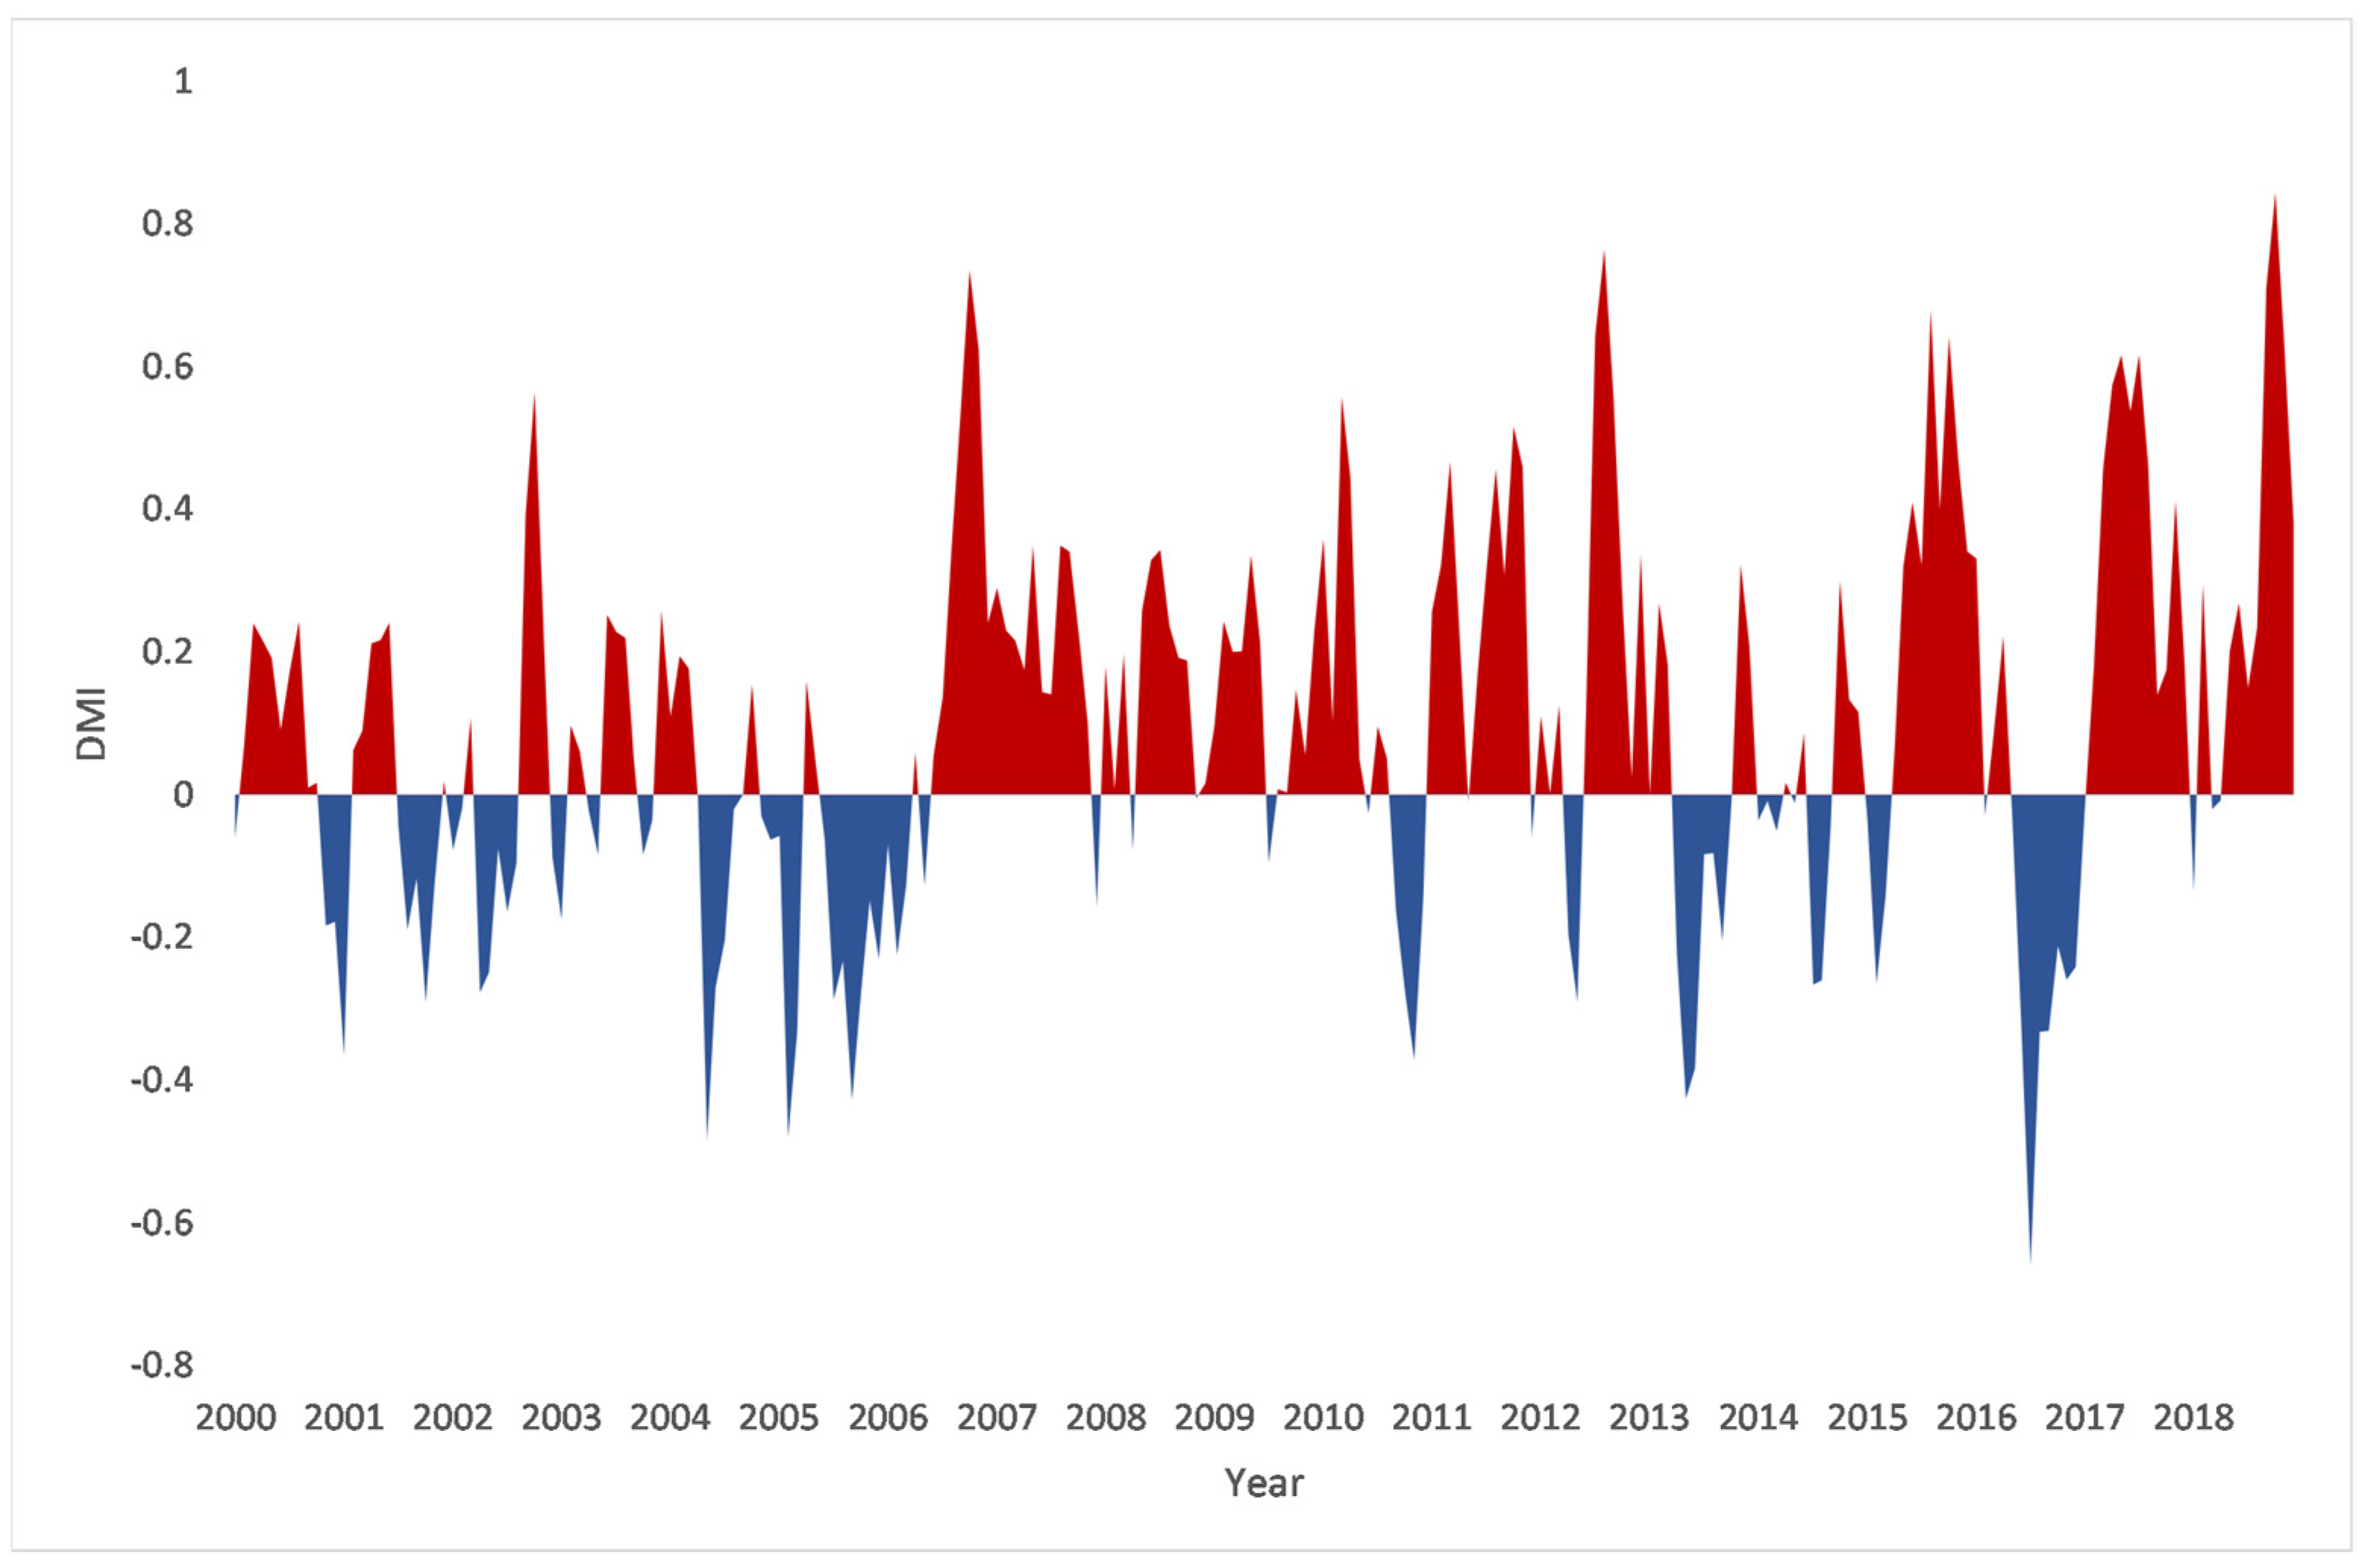
2.3. Indian Ocean Dipole

The Dipole Modular Index (DMI) is used to monitor IOD events, which is calculated by anomalous sea surface temperature (SST) gradient between the tropical western Indian Ocean (50° E–70° E and 10° S–10° N) and the southeastern tropical Indian Ocean (90° E–110° E and 10° S–0° N). The monthly DMI from 2000 to 2018 can be obtained from the National Oceanic and Atmospheric Administration (NOAA) website (https://psl.noaa.gov/gcos_wgsp/Timeseries/DMI/, accessed on 2 February 2022). Each month has one value for the entire Indian Ocean; positive and negative DMI are referred to as positive and negative IOD phases, respectively. The time series of DMI is shown in Figure 2.

2.4. Statistical Analyses
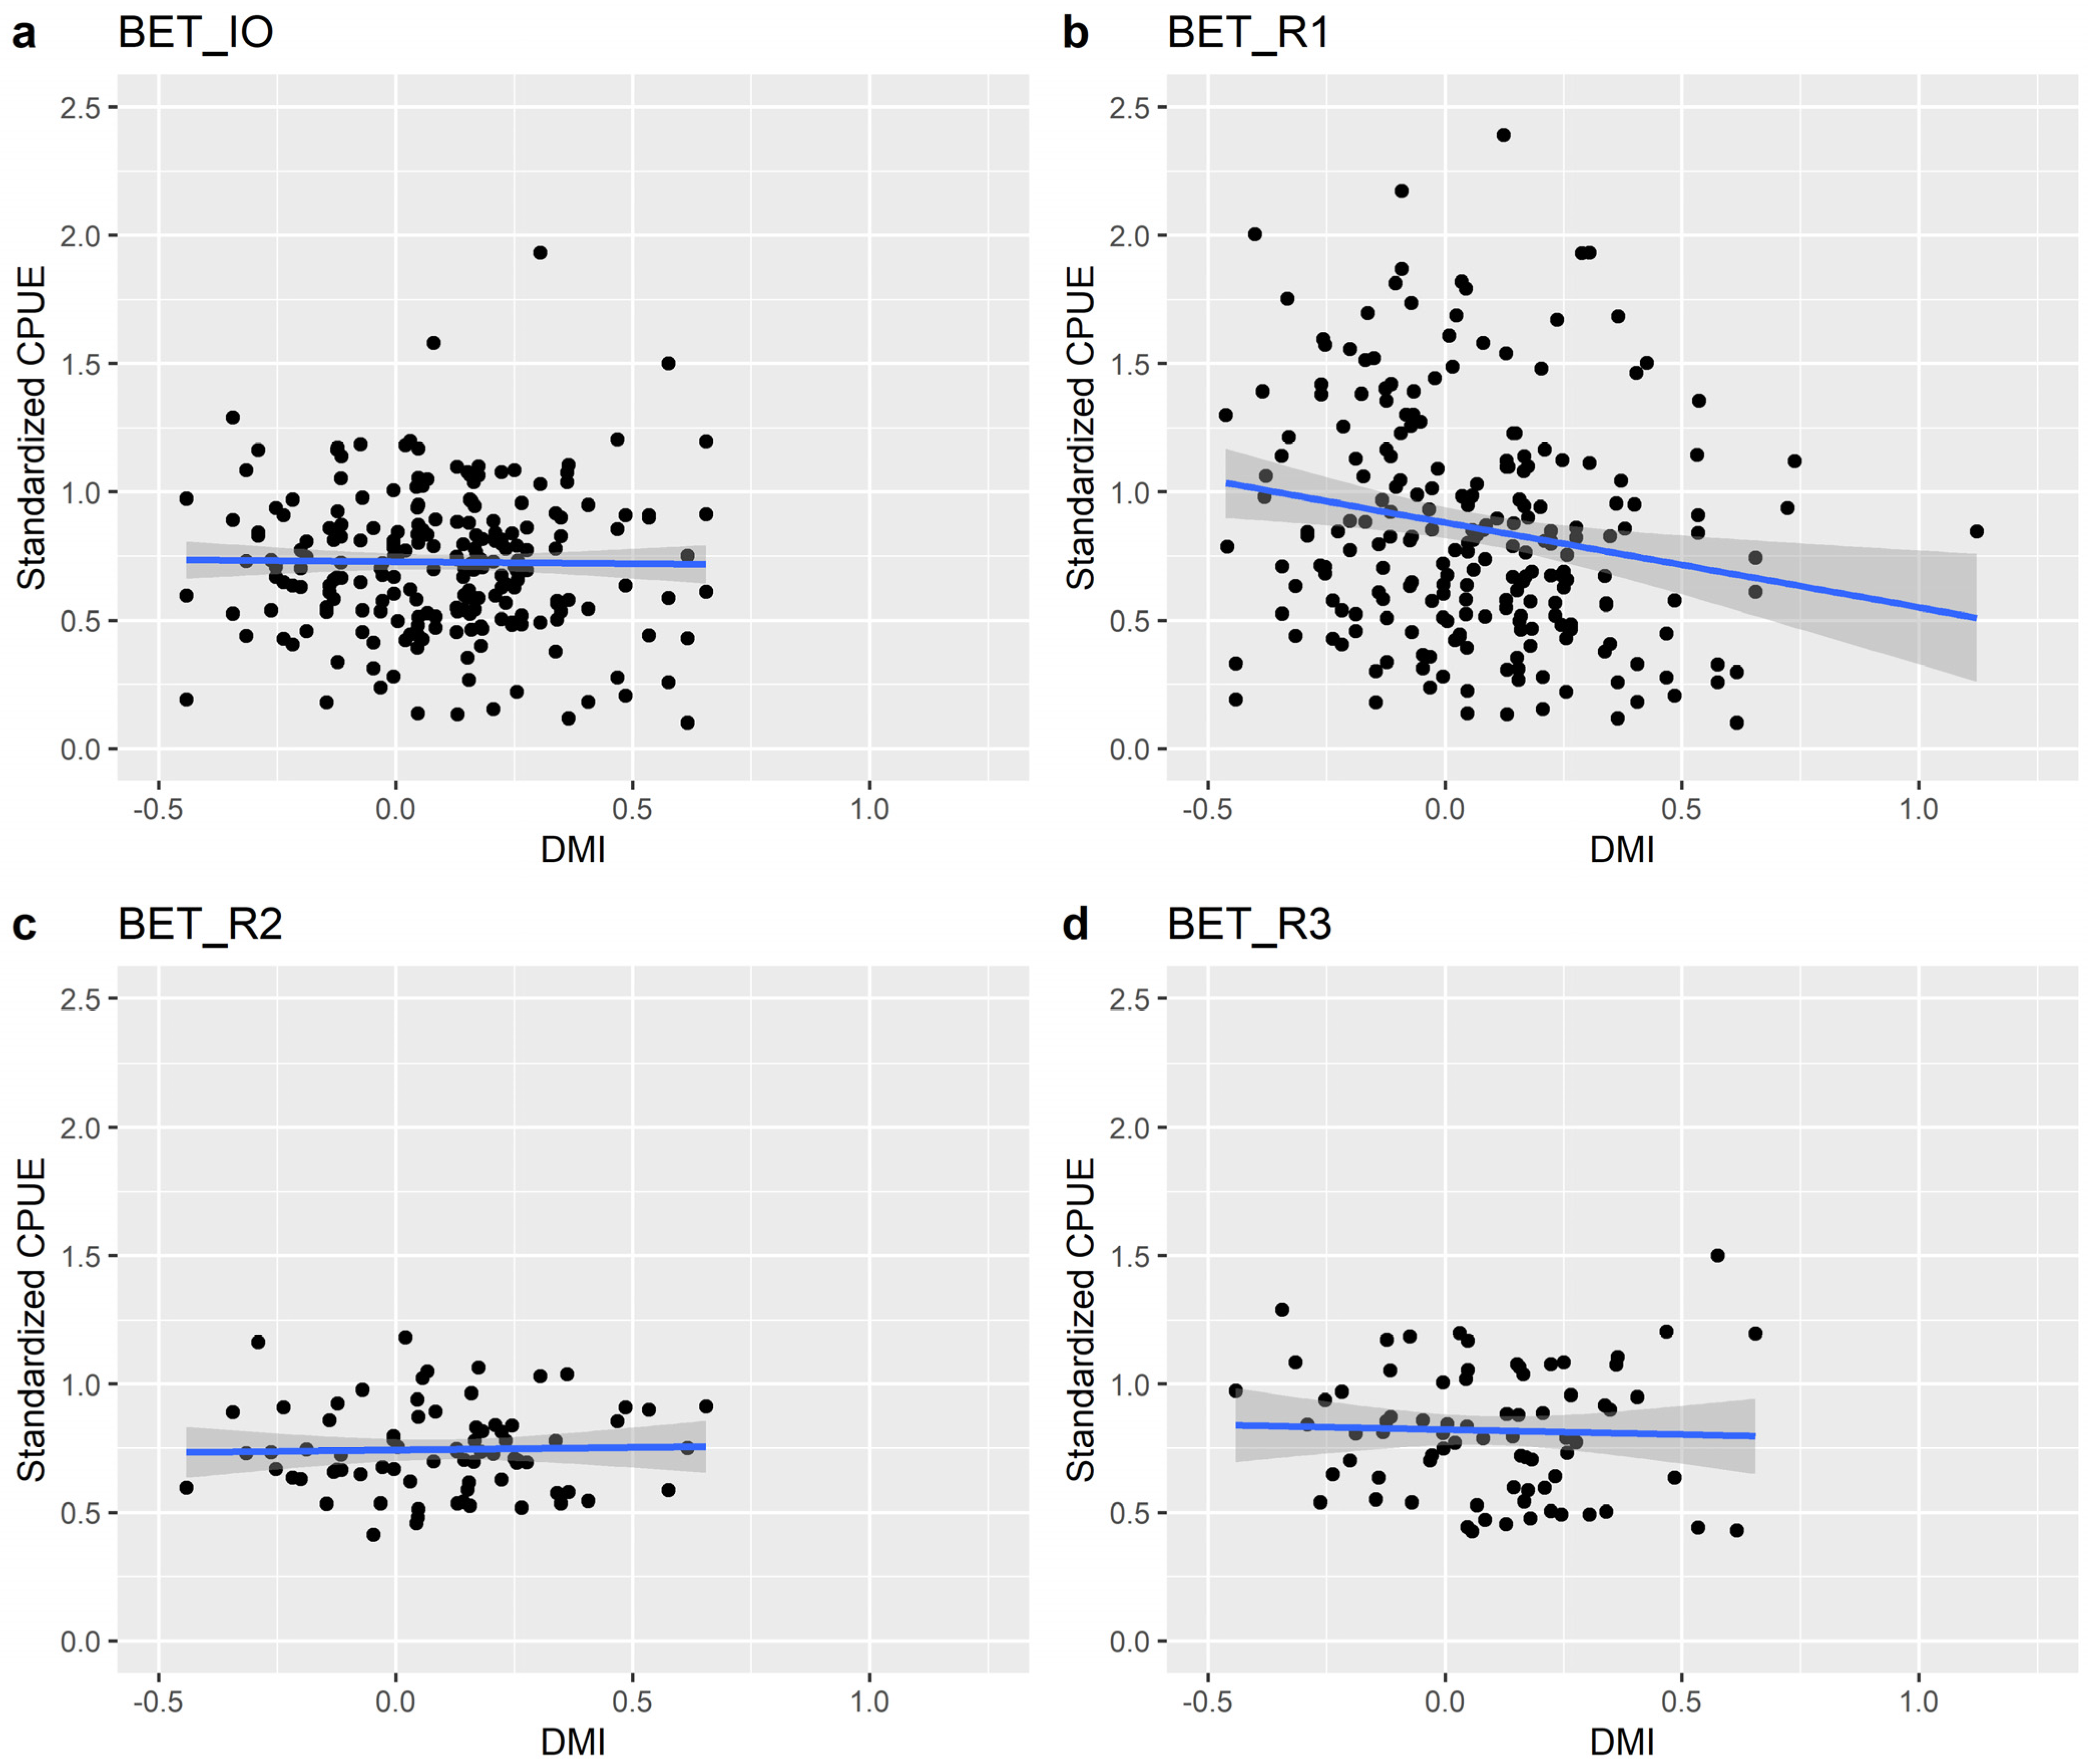
Akaike Information Criteria (AIC) is a mathematical method used to compare different possible models and select the best fitting model [30]. To better understand the relationship, we have tested various link functions (e.g., “identity”, “inverse”, and “log”) both in the generalized additive model and the generalized linear model; and the best-fitted model was the generalized linear model with the “identity” link function. Therefore, we used linear regression model to investigate the relationships between the DMI and the standardized CPUE of bigeye and yellowfin tuna.
Linear regression models were applied to each of the subareas, as well as the whole Indian Ocean. When the p-value of the DMI index is smaller than 0.05, the relationship between standardized CPUE and IOD is considered statistically significant. The linear function was constructed in the R software using the “mgcv” package. We also used the “ggplot2” package in R to visualize the results. The R script was uploaded as Supplementary Material (File S1).

3. Results

The IOD events experienced three distinct regimes since 1880: negative IOD events played a major role before 1920; weak positive IOD events occurred during 1920–1949; and the occurrence of strong positive IOD events increased largely after 1960 [31] (Figure S1). For the research period, the DMI index in the positive and negative phases were similar from 2000 to 2006. After that, positive dipoles occurred more frequently than negative dipoles (Figure 2). The increasing positive IOD events may associate with the more frequent El Niño events, the high phase of the southern annular mode, and the onset of monsoon [31,32].
For the whole Indian Ocean, DMI had no significant relationship with bigeye tuna (p > 0.05, t = −0.248). The regression line showed no obvious trend (Figure 3a). However, DMI significantly correlated with yellowfin tuna abundance (p-value equals 0.041, t = 2.057) (Table 1). The regression line showed a slight negative relationship between DMI and the CPUE of yellowfin tuna (Figure 4a). Hence, when the IOD was in the negative phase, it would positively affect yellowfin tuna. As the DMI turned positive, IOD in the positive phase negatively influenced yellowfin tuna. However, the adjusted R-square is small (0.011).
In the tropical western Indian Ocean (R1b, R1y), DMI has significant correlations on both bigeye (p < 0.05, t = −3.758) and yellowfin tuna (p < 0.05, t = −2.624). The values of adjusted R-square are 0.054 for bigeye tuna and 0.072 for yellowfin tuna are still low (Table 1). The linear regression indicates the negative correlations of DMI on yellowfin and bigeye tuna (Figure 3b and Figure 4b).
In the tropical eastern and southern Indian Ocean, DMI did not have significant correlations with bigeye tuna (Table 1). The p-values and t-values are 0.813 and 0.237 in the tropical eastern Indian Ocean (R2b), 0.754 and −0.315 in the southern Indian Ocean (R3b), respectively. No significant trends between DMI and bigeye tuna were detected (Figure 3c,d). For yellowfin tuna, p-values and t-values of yellowfin tuna are 0.116 and −1.59 in the tropical eastern Indian Ocean (R4y), 0.925 and −0.061 in the southwestern Indian Ocean (R2y), and 0.458 and −0.745 in the southeastern Indian Ocean (R3y), respectively. No significant trends were found in R2y, R3y and R4y (Figure 4c–e).

4. Discussion

4.1. The Reasons Why IOD Could Affect Tuna

In the tropical western Indian Ocean, when a negative IOD event occurs, the thermocline becomes shallow, and productivity compresses to the sea surface. The depth of habitats of tuna becomes more superficial than usual, and the vertical movement range becomes limited. In contrast, when a positive IOD event occurs, the habitat expands in the horizontal and vertical directions, the level of surface productivity decreases, the distribution of tuna tends to disperse [22,33,34]. Consequently, in the tropical western Indian Ocean, DMI positively affected bigeye and yellowfin tuna during negative IOD events; while it had negative impacts on tunas’ abundance during positive IOD events (Figure 3b and Figure 4b).
Although DMI showed a significant correlation on bigeye and yellowfin tuna in the tropical western Indian Ocean, the values of adjusted R-square were very low. The strong IOD events are driven by the thermocline-SST coupling, and are intensely interactive with the atmosphere, whereas the weak IOD events are a mere response to surface winds without such a dynamic coupling [35]. Therefore, studies focusing on strong IOD years could capture stronger effects of the IOD [22,36,37]. However, fishery management is based on the stock assessment which uses long-term continuous data. Our aim is to provide direct scientific advice for management. Therefore, we tested the influence of the IOD by using time series data containing both strong and weak IOD years, which may weaken the effects of the IOD.

4.2. The Effects of Climate Change Differ among Species and Regions

For the whole Indian Ocean, IOD showed a significant correlation on the yellowfin tuna but not on bigeye tuna. Yellowfin and bigeye tuna have distinctive depth distributions and vertical movement patterns. As mentioned before, bigeye tuna can live in wider waters than yellowfin tuna. It is also found that bigeye tuna can exploit deeper food resources than yellowfin tuna [18]. Therefore, when IOD occurs, yellowfin tuna stocks inhabiting more superficial layers may be more vulnerable to environmental changes. Impacts in the species-specific difference also occurred in other marine creatures. Lynam et al. [38] detected the relationship between jellyfish abundance and the NAO in the North Sea. They investigated three jellyfish species Aurelia aurita, Cyanea lamarckii, and Cyanea capillata, and found that the abundance of A. aurita and C. lamarckii were significantly negatively related to the NAO in the west of northern Denmark and east of Scotland. The fluctuations in the abundance of these two species might be connected to hydroclimatic variations caused by atmospheric influences on the wind stress, temperature, and currents. However, there were no substantial effects on C. capillata. It should be noted that climate variability may have the same correlations among different species. Rubio et al. [39] investigated the effects of NAO on Spanish catches of albacore and yellowfin tuna in the northeast Atlantic Ocean. The results showed positive correlations between the NAO and the CPUE for both albacore and yellowfin tuna.
There were differences in the impacts of climate variability on the same species across different regions. In contrast to the northern part of the Indian Ocean, IOD did not show a significant relationship with bigeye and yellowfin tuna in the southern Indian Ocean. As we mentioned before, the formation of IOD is due to anomalous surface wind. The wind fields spread over the tropical Indian Ocean, particularly along the equator zone. Thus, during a dipole mode event, the rainfall changes over the oceanic tropical convergence zone (OTCZ). Then through the tropical precipitation field, there exists a strong coupling between SST and the wind field [11]. Therefore, the changes in the marine environment caused by the IOD mainly occur in the equatorial region, which may not influence the bigeye and yellowfin tuna in the southern Indian Ocean. Another study also showed the spatial variability: in the south Pacific Ocean, the influence of the PDO on the albacore CPUE became more prominent from east to west [40]. Regional differences were also emphasized in a follow-up study [41]. A. aurita and C. lamarckii in the northwest and southeast North Sea showed contrasting correlations with the NAO: positive relationships were found in the north of Scotland; whereas, as mentioned before, A. aurita and C. lamarckii had negative relationships with the NAO in the northern Denmark area waters. The effects on jellyfish can vary regionally as the distinct environmental processes among different regions in the North Sea.

4.3. The Debates about the IOD Influence on Bigeye and Yellowfin Tuna in the Tropical Eastern Indian Ocean

As the IOD events were occurred in the whole tropical Indian Ocean, they had inverse influences for the western and eastern Indian Ocean. Our initial hypothesis is that IOD will have opposite effects on tuna in the tropical western and eastern Indian Ocean. However, in this study, the p-value suggested that there was no significant relationship between the tuna and the IOD in the tropical eastern Indian Ocean (Table 1).
Other studies also showed some different results. Lan et al. found that there is a negative relationship between IOD and yellowfin tuna in the tropical western Indian Ocean [22]. However, from Figure 1 in this study, the results showed that the standardized CPUE of yellowfin tuna has a lower value at the positive IOD phase than at the negative phase [22]. This means there still exists a negative relationship in the tropical eastern Indian Ocean. They further detected the IOD influence on yellowfin tuna for the whole Indian Ocean and suggested a negative correlation between IOD and yellowfin tuna [42]. However, Amri et al. investigated the impact of IOD on the catches of yellowfin tuna in the eastern Indian Ocean off West Java; the results showed that a high increase of the CPUE occurred during an intense positive IOD event (2006) [36]. This means CPUE has a positive correlation with IOD index in the eastern Indian Ocean coastal waters. For the bigeye tuna, a higher catch rate also occurred in the positive IOD in the eastern Indian Ocean off Java Island (Indonesia) [23]. Therefore, due to the complexity of climate variability impact mechanisms, further studies still need to explore the relationship between IOD and tuna in the tropical eastern Indian Ocean.

4.4. Consider Climate Variabilities in Fishery Management

Our results suggested that climate variability could have spatially distinct effects on fish populations. From the results, for the whole Indian Ocean, the IOD did not have a significant effect on bigeye tuna. However, it does not mean we do not need to consider the effects of climate variability on bigeye tuna, which still has a significant relationship with the IOD in the tropical western Indian Ocean. Additionally, as yellowfin tuna are also affected by the IOD in this area, we suggested that the western tropical Indian Ocean is the most important area that the fisheries managers need to pay attention to. Thus, implementing spatial management is important for fishery management. In practice, the IOD events dramatically reduced the catch rates of the purse seine fleets in the western Indian Ocean [43]. Whereas, longline fleets may be less directly affected by the IOD events because they can change the target species to offset the reduced catch rates for a given species. Moreover, the gear of the longline is adjustable so that the hooks can be set at various depths to exploit different tuna habitats [44]. As the climate models project that the frequency of the positive IOD events would continue to increase in the future [31], stakeholders (especially the purse seine fisheries) and managers could develop resilient management measures and responsive harvest control rules in advance. Close collaboration and communication among scientists, managers, and stakeholders are also important. Through regular workshops or meetings, managers and stakeholders could gain timely information from scientists, and also give feedback to improve scientific research [45].
Recently, building marine protected areas (MPAs) or implementing time/area fishery closures have been recognized as effective ways of spatial management. Effective MPAs could mitigate and recover from the damage caused by climate variability, and also have more fish species, higher and larger fish biomass [46,47]. However, effective MPA design requires skillful consideration; most MPAs failed to meet their management objectives [48]. Researchers also found that this kind of static spatial closure may not be suitable for the Indian Ocean tuna due to the strong environmental fluctuations, large observed tuna displacement distances, high fisher mobility, and so on [49,50]. Future improvements in management and information collection may enhance our ability in spatial management.
Projecting climate trends and the potential impacts on fish populations is another tool for management. The managers can adjust management strategies to reduce the risks posed by climate variability. For example, one of the project models designed for tuna fisheries is the Spatial Ecosystem And Populations Dynamics Model (SEAPODYM; https://www.spc.int/ofp/seapodym/, accessed on 2 February 2022) [51], a numerical model created to investigate the physical–biological interactions between tuna populations and the Pacific Ocean’s pelagic environment. SEAPODYM has been used for four tuna species (e.g., skipjack, bigeye, yellowfin, albacore) in the western and central Pacific Ocean to evaluate the potential impacts of climate variabilities [52,53,54,55]. Other methods such as the bioclimate envelop model [56] or combined physical–biogeochemical and size-based ecosystem model [57] can be also used to project the potential impacts of changing ocean conditions on marine creatures.

5. Conclusions

Using standardized CPUE to represent stock abundance, we detected the influence of the IOD on the bigeye and yellowfin tuna in the Indian Ocean. Our results suggest that the effects seem different between the two species. For the whole Indian Ocean, the IOD had a significantly negative correlation on yellowfin tuna but not the bigeye tuna. Moreover, spatial differences in the influence were also observed. Both for bigeye and yellowfin tuna, there were significant negative relationships with the IOD only in the tropical western Indian Ocean.
This study provides preliminary insights into species–specific and spatially-explicit effects of climate variability on tuna abundance. However, although there were significant relationships in the tropical western Indian Ocean, the R-square values were small. Thus, there could have other environmental or fishery factors that drive the fluctuations in tuna abundance. To better understand the impacts of the climate variability on tuna abundance, combining with other factors would be the next step. Additionally, the effect of the IOD in the tropical eastern Indian Ocean is still unclear. Further studies needed to focus on the tropical eastern Indian Ocean to provide more specific advice for managers. Furthermore, we used the standardized CPUE, which was calculated by the longline fishery data in this study. Recent years, CPUE standardization data based on purse seine fisheries were also provided by the IOTC, which could also used as an abundance index in the future. Finally, examining the ability of the IOD as the predictor of the abundance changes is also an important topic for the future.

Supplementary Materials

The following supporting information can be downloaded at: https://www.mdpi.com/article/10.3390/fishes8020099/s1, Figure S1: Distribution of DMI from 1870 to 2020. Positive DMI is referred to as positive IOD (red); negative DMI represents the negative IOD phenomenon (blue); Table S1: The joint CPUE data of the bigeye and yellowfin tuna in the Indian Ocean from 2000 to 2018; File S1: R-script for the statistical analyses of bigeye and yellowfin tunas in the Indian Ocean. Information about the script (not run) are preceded by a hash symbol (#) and shaded in grey.

Author Contributions

Conceptualization, J.Z. and Y.W.; methodology, F.Z. and Y.Z.; software, Z.G. and Y.W.; formal analysis, all; investigation, all; data curation, all; writing—original draft preparation, Y.W.; writing—review and editing, F.Z. and Y.Z.; supervision, X.D.; project administration, J.Z.; funding acquisition, J.Z. All authors have read and agreed to the published version of the manuscript.

Funding

This research was supported by the National Natural Science Foundation of China (#41676120 and #32002393).

Institutional Review Board Statement

Not applicable.

Data Availability Statement

Data are contained within this article, and are available upon request to the corresponding author.

Acknowledgments

We are grateful to the working party on tropical tuna (WPTT) of the IOTC for the standardized CPUE data. We thank the two anonymous reviewers for their comments which improved the manuscript.

Conflicts of Interest

The authors declare that they have no known competing financial interest or personal relationship that could have appeared to influence the work reported in this paper.

References

  1. Nye, J.A.; Link, J.S.; Hare, J.A.; Overholtz, W.J. Changing spatial distribution of fish stocks in relation to climate and population size on the Northeast United States continental shelf. Mar. Ecol. Prog. Ser. 2009, 393, 111–129. [Google Scholar] [CrossRef]
  2. Lehodey, P.; Bertignac, M.; Hampton, J.; Lewis, A.; Picaut, J. El Niño Southern Oscillation and tuna in the western Pacific. Nature 1997, 389, 715–718. [Google Scholar] [CrossRef]
  3. Dulvy, N.K.; Rogers, S.I.; Jennings, S.; Stelzenmüller, V.; Dye, S.R.; Skjoldal, H.R. Climate change and deepening of the North Sea fish assemblage: A biotic indicator of warming seas. J. Appl. Ecol. 2008, 45, 1029–1039. [Google Scholar] [CrossRef]
  4. Houde, E.; Hoyt, R. Fish early life dynamics and recruitment variability. Am. Fish. Soc. Symp. 1987, 2, 17–29. [Google Scholar]
  5. Rijnsdorp, A.D.; Peck, M.A.; Engelhard, G.H.; Möllmann, C.; Pinnegar, J.K. Resolving the effect of climate change on fish populations. ICES J. Mar. Sci. 2009, 66, 1570–1583. [Google Scholar] [CrossRef]
  6. Lehodey, P.; Chai, F.; Hampton, J. Modelling climate-related variability of tuna populations from a coupled ocean–biogeochemical-populations dynamics model. Fish. Oceanogr. 2003, 12, 483–494. [Google Scholar] [CrossRef]
  7. Pratchett, M.S.; Wilson, S.K.; Munday, P.L. Effects of Climate Change on Coral Reef Fishes; Cambridge University Press: Cambridge, UK, 2015; pp. 127–134. [Google Scholar]
  8. Guevara-Carrasco, R.; Lleonart, J. Dynamics and fishery of the Peruvian hake: Between nature and man. J. Mar. Syst. 2008, 71, 249–259. [Google Scholar] [CrossRef]
  9. Lehodey, P.; Bertrand, A.; Hobday, A.J.; Kiyofuji, H.; McClatchie, S.; Menkès, C.E.; Pilling, G.; Polovina, J.; Tommasi, D. ENSO impact on marine fisheries and ecosystems. In El Niño Southern Oscillation in a Changing Climate; American Geophysical Union: Washington, DC, USA, 2020; pp. 429–451. [Google Scholar] [CrossRef]
  10. Báez, J.C.; Real, R. The North Atlantic Oscillation affects landings of anchovy Engraulis encrasicolus in the Gulf of Cádiz (South of Spain). J. Appl. Ichthyol. 2011, 27, 1232–1235. [Google Scholar] [CrossRef]
  11. Saji, N.H.; Goswami, B.N.; Vinayachandran, P.N.; Yamagata, T. A dipole mode in the tropical Indian Ocean. Nature 1999, 401, 360–363. [Google Scholar] [CrossRef]
  12. Saji, N.H.; Yamagata, T. Possible impacts of Indian Ocean Dipole mode events on global climate. Clim. Res. 2003, 25, 151–169. [Google Scholar] [CrossRef]
  13. Feng, M.; Meyers, G. Interannual variability in the tropical Indian Ocean: A two-year time-scale of Indian Ocean dipole. Deep. Sea Res. Part II Top. Stud. Oceanogr. 2003, 50, 2263–2284. [Google Scholar] [CrossRef]
  14. Brill, R.W.; Block, B.A.; Boggs, C.H.; Bigelow, K.A.; Freund, E.V.; Marcinek, D.J. Horizontal movements and depth distribution of large adult yellowfin tuna (Thunnus albacares) near the Hawaiian Islands, recorded using ultrasonic telemetry: Implications for the physiological ecology of pelagic fishes. Mar. Biol. 1999, 133, 395–408. [Google Scholar] [CrossRef]
  15. Cayré, P.; Marsac, F. Modelling the yellowfin tuna (Thunnus albacares) vertical distribution using sonic tagging results and local environmental parameters. Aquat. Living Resour. 1993, 6, 1–14. [Google Scholar] [CrossRef]
  16. Zhu, G.P.; Xu, L.X.; Zhou, Y.Q.; Song, L.M. Reproductive Biology of Yellowfin Tuna T. albacares in the West-Central Indian Ocean. J. Ocean. Univ. China 2008, 7, 327–332. [Google Scholar] [CrossRef]
  17. Lowe, T.E.; Brill, R.W.; Cousins, K.L. Blood oxygen-binding characteristics of bigeye tuna (Thunnus obesus), a high-energy-demand teleost that is tolerant of low ambient oxygen. Mar. Biol. 2000, 136, 1087–1098. [Google Scholar] [CrossRef]
  18. Brill, R.W.; Bigelow, K.A.; Musyl, M.K.; Fritsches, K.A.; Warrant, E.J. Bigeye tuna (Thunnus obesus) behavior and physiology and their relevance to stock assessments and fishery biology. Col. Vol. Sci. Pap. ICCAT 2005, 57, 142–161. [Google Scholar]
  19. Dagorn, L.; Holland, K.N.; Itano, D.G. Behavior of yellowfin (Thunnus albacares) and bigeye (T. obesus) tuna in a network of fish aggregating devices (FADs). Mar. Biol. 2007, 151, 595–606. [Google Scholar] [CrossRef]
  20. Holland, K.N. Horizontal and vertical movements of yellowfin and bigeye tuna associated with fish aggregating devices. Fish Bull. 1990, 88, 493–507. [Google Scholar]
  21. Sabarros, P.S.; Romanov, E.V.; Bach, P. Vertical Behavior and Habitat Preferences of Yellowfin and Bigeye Tuna in the South West Indian Ocean Inferred from PSAT Tagging Data. IOTC–2015–WPTT17–42. 2015. Available online: https://iotc.org/documents/vertical-behavior-and-habitat-utilization-yellowfin-and-bigeye-tuna-south-west-indian (accessed on 6 February 2022).
  22. Lan, K.-W.; Evans, K.; Lee, M.-A. Effects of climate variability on the distribution and fishing conditions of yellowfin tuna (Thunnus albacares) in the western Indian Ocean. Clim. Chang. 2012, 119, 63–77. [Google Scholar] [CrossRef]
  23. Lumban-Gaol, J.; Leben, R.R.; Vignudelli, S.; Mahapatra, K.; Okada, Y.; Nababan, B.; Mei-Ling, M.; Amri, K.; Arhatin, R.E.; Syahdan, M. Variability of satellite-derived sea surface height anomaly, and its relationship with Bigeye tuna (Thunnus obesus) catch in the Eastern Indian Ocean. Eur. J. Remote Sens. 2015, 48, 465–477. [Google Scholar] [CrossRef]
  24. Vincent, M.T.; Hampton, J. Incorporation of updated growth information within the 2017 WCPO bigeye stock assessment grid, and examination of the sensitivity of estimates to alternative model spatial structures. In Proceedings of the 14th Regular Session of the Scientific Committee of the WCPFC, Busan, Republic of Korea, 8–16 August 2018; Available online: https://meetings.wcpfc.int/node/10717 (accessed on 6 February 2022).
  25. Fu, D. Preliminary Indian Ocean Bigeye Tuna Stock Assessment 1950–2018 (Stock Synthesis). IOTC–2019–WPTT21–61. 2019. Available online: https://iotc.org/documents/preliminary-indian-ocean-bigeye-tuna-stock-assessment-1950-2018-ss3 (accessed on 6 February 2023).
  26. Urtizberea, A.; Fu, D.; Merino, G.; Methot, R.; Cardinale, M.; Winker, H.; Walter, J.; Murua, H. Preliminary Assessment of Indian Ocean Yellowfin Tuna 1950–2018 (Stock Synthesis, v3. 30). IOTC-2019-WPTT21-50. 2019. Available online: https://iotc.org/documents/WPTT/21/50 (accessed on 6 February 2023).
  27. ISSF. Status of the World Fisheries for Tuna; ISSF Technical Report 2022-15; International Seafood Sustainability Foundation: Pittsburgh, PA, USA, 2022. [Google Scholar]
  28. Maunder, M.N.; Punt, A.E. Standardizing catch and effort data: A review of recent approaches. Fish. Res. 2004, 70, 141–159. [Google Scholar] [CrossRef]
  29. Holye, S.D.; Chang, S.T.; Fu, D.; Kim, D.N.; Lee, S.I.; Matsumoto, T.; Chassot, E.; Yeh, Y.M. Collaborative Study of Bigeye and Yellowfin Tuna CPUE from Multiple Indian Ocean Longline Fleets in 2019, with Consideration of Discarding. IOTC-2019-WPM10-16. 2019. Available online: https://iotc.org/documents/WPM/10/16 (accessed on 6 February 2023).
  30. Akaike, H. A new look at the statistical model identification. IEEE Trans. Autom. Control. 1974, 19, 716–723. [Google Scholar] [CrossRef]
  31. Cai, W.; Cowan, T.; Sullivan, A. Recent unprecedented skewness towards positive Indian Ocean Dipole occurrences and its impact on Australian rainfall. Geophys. Res. Lett. 2009, 36, 11. [Google Scholar] [CrossRef]
  32. Ratna, S.B.; Cherchi, A.; Osborn, T.J.; Joshi, M.; Uppara, U. The extreme positive Indian Ocean dipole of 2019 and associated indian summer monsoon rainfall response. Geophys. Res. Lett. 2021, 48, e2020GL091497. [Google Scholar] [CrossRef]
  33. Corbineau, A.; Rouyer, T.; Cazelles, B.; Fromentin, J.-M.; Fonteneau, A.; Menard, F. Time series analysis of tuna and swordfish catches and climate variability in the Indian Ocean (1968–2003). Aquat. Living Resour. 2008, 21, 277–285. [Google Scholar] [CrossRef]
  34. Horii, T.; Ueki, I.; Ando, K. Coastal upwelling events along the southern coast of Java during the 2008 positive Indian Ocean Dipole. J. Oceanogr. 2018, 74, 499–508. [Google Scholar] [CrossRef]
  35. Deshpande, A.; Chowdary, J.S.; Gnanaseelan, C. Role of thermocline-SST coupling in the evolution of IOD events and their regional impacts. Clim. Dyn. 2014, 43, 163–174. [Google Scholar] [CrossRef]
  36. Amri, K.; Suman, A.; Irianto, H.E.; Wudianto, W. Effects of dipole mode and El-nino events on catches of yellowfin tuna (Thunnus albacares) in the eastern Indian ocean off west java. Indones. Fish. Res. J. 2015, 21, 75–90. [Google Scholar] [CrossRef]
  37. Kumar, P.S.; Pillai, G.N.; Manjusha, U. El Nino Southern Oscillation (ENSO) impact on tuna fisheries in Indian Ocean. Springerplus 2014, 3, 591. [Google Scholar] [CrossRef]
  38. Lynam, C.P.; Hay, S.J.; Brierley, A.S. Interannual variability in abundance of North Sea jellyfish and links to the North Atlantic Oscillation. Limnol. Oceanogr. 2004, 49, 637–643. [Google Scholar] [CrossRef]
  39. Rubio, C.; Macías, D.; Camiñas, J.; Fernández, I.; Báez, J. Effects of the North Atlantic Oscillation on Spanish catches of albacore, Thunnus alalunga, and yellowfin tuna, Thunnus albacares, in the North–East Atlantic Ocean. Anim. Biodivers. Conserv. 2016, 39, 195–198. [Google Scholar] [CrossRef]
  40. Singh, A.A.; Sakuramoto, K.; Suzuki, N. Impact of Climatic Factors on Albacore Tuna Thunnus alalunga in the South Pacific Ocean. Am. J. Clim. Chang. 2015, 4, 295–312. [Google Scholar] [CrossRef] [Green Version]
  41. Lynam, C.P.; Hay, S.J.; Brierley, A.S. Jellyfish abundance and climatic variation: Contrasting responses in oceanographically distinct regions of the North Sea, and possible implications for fisheries. J. Mar. Biol. Assoc. UK 2005, 85, 435–450. [Google Scholar] [CrossRef]
  42. Wu, Y.-L.; Lan, K.-W.; Tian, Y. Determining the effect of multiscale climate indices on the global yellowfin tuna (Thunnus albacares) population using a time series analysis. Deep. Sea Res. Part II Top. Stud. Oceanogr. 2020, 175, 104808. [Google Scholar] [CrossRef]
  43. Marsac, F. Outlook of Ocean Climate Variability in the West Tropical Indian Ocean, 1997–2008. IOTC-2008-WPTT-27. 2008. Available online: https://iotc.org/documents/outlook-ocean-climate-variability-tropical-indian-ocean-1997-2008 (accessed on 6 February 2023).
  44. Marsac, F. The Seychelles tuna fishery and climate change. In Climate Change Impacts on Fisheries and Aquaculture: A Global Analysis; John Wiley & Sons: Hoboken, NJ, USA, 2017; Volume 2, pp. 523–568. [Google Scholar] [CrossRef]
  45. Karp, M.A.; Peterson, J.O.; Lynch, P.D.; Griffis, R.B.; Adams, C.F.; Arnold, W.S.; Barnett, L.A.K.; deReynier, Y.; DiCosimo, J.; Fenske, K.H.; et al. Accounting for shifting distributions and changing productivity in the development of scientific advice for fishery management. ICES J. Mar. Sci. 2019, 76, 1305–1315. [Google Scholar] [CrossRef]
  46. Edgar, G.J.; Stuart-Smith, R.D.; Willis, T.J.; Kininmonth, S.; Baker, S.C.; Banks, S.; Barrett, N.S.; Becerro, M.A.; Bernard, A.T.F.; Berkhout, J.; et al. Global conservation outcomes depend on marine protected areas with five key features. Nature 2014, 506, 216–220. [Google Scholar] [CrossRef]
  47. Roberts, C.M.; O’Leary, B.C.; McCauley, D.J.; Cury, P.M.; Duarte, C.M.; Lubchenco, J.; Pauly, D.; Sáenz-Arroyo, A.; Sumaila, U.R.; Wilson, R.W.; et al. Marine reserves can mitigate and promote adaptation to climate change. Proc. Natl. Acad. Sci. USA 2017, 114, 6167–6175. [Google Scholar] [CrossRef]
  48. Jameson, S.C.; Tupper, M.H.; Ridley, J.M. The three screen doors: Can marine “protected” areas be effective? Mar. Pollut. Bull. 2002, 44, 1177–1183. [Google Scholar] [CrossRef]
  49. Curnick, D.J.; Collen, B.; Koldewey, H.J.; Jones, K.E.; Kemp, K.M.; Ferretti, F. Interactions between a large marine protected area, pelagic tuna and associated fisheries. Front. Mar. Sci. 2020, 7, 318. [Google Scholar] [CrossRef]
  50. Kaplan, D.M.; Chassot, E.; Amandé, J.M.; Dueri, S.; Demarcq, H.; Dagorn, L.; Fonteneau, A. Spatial management of Indian Ocean tropical tuna fisheries: Potential and perspectives. ICES J. Mar. Sci. 2014, 71, 1728–1749. [Google Scholar] [CrossRef]
  51. Lehodey, P.; Senina, I.; Murtugudde, R. A spatial ecosystem and populations dynamics model (SEAPODYM)–Modeling of tuna and tuna-like populations. Prog. Oceanogr. 2008, 78, 304–318. [Google Scholar] [CrossRef]
  52. Bell, J.D.; Ganachaud, A.; Gehrke, P.C.; Griffiths, S.P.; Hobday, A.J.; Hoegh-Guldberg, O.; Johnson, J.E.; Le Borgne, R.; Lehodey, P.; Lough, J.M.; et al. Mixed responses of tropical Pacific fisheries and aquaculture to climate change. Nat. Clim. Chang. 2013, 3, 591–599. [Google Scholar] [CrossRef]
  53. Lehodey, P.; Senina, I.; Calmettes, B.; Hampton, J.; Nicol, S. Modelling the impact of climate change on Pacific skipjack tuna population and fisheries. Clim. Chang. 2013, 119, 95–109. [Google Scholar] [CrossRef]
  54. Lehodey, P.; Senina, I.; Nicol, S.; Hampton, J. Modelling the impact of climate change on South Pacific albacore tuna. Deep. Sea Res. Part II Top. Stud. Oceanogr. 2015, 113, 246–259. [Google Scholar] [CrossRef]
  55. Loukos, H.; Monfray, P.; Bopp, L.; Lehodey, P. Potential changes in skipjack tuna (Katsuwonus pelamis) habitat from a global warming scenario: Modelling approach and preliminary results. Fish. Oceanogr. 2003, 12, 474–482. [Google Scholar] [CrossRef]
  56. Cheung, W.W.L.; Lam, V.W.Y.; Sarmiento, J.L.; Kearney, K.; Watson, R.; Pauly, D. Projecting global marine biodiversity impacts under climate change scenarios. Fish Fish. 2009, 10, 235–251. [Google Scholar] [CrossRef]
  57. Blanchard, J.L.; Jennings, S.; Holmes, R.; Harle, J.; Merino, G.; Allen, J.I.; Holt, J.; Dulvy, N.K.; Barange, M. Potential consequences of climate change for primary production and fish production in large marine ecosystems. Philos. Trans. R. Soc. B Biol. Sci. 2012, 367, 2979–2989. [Google Scholar] [CrossRef]
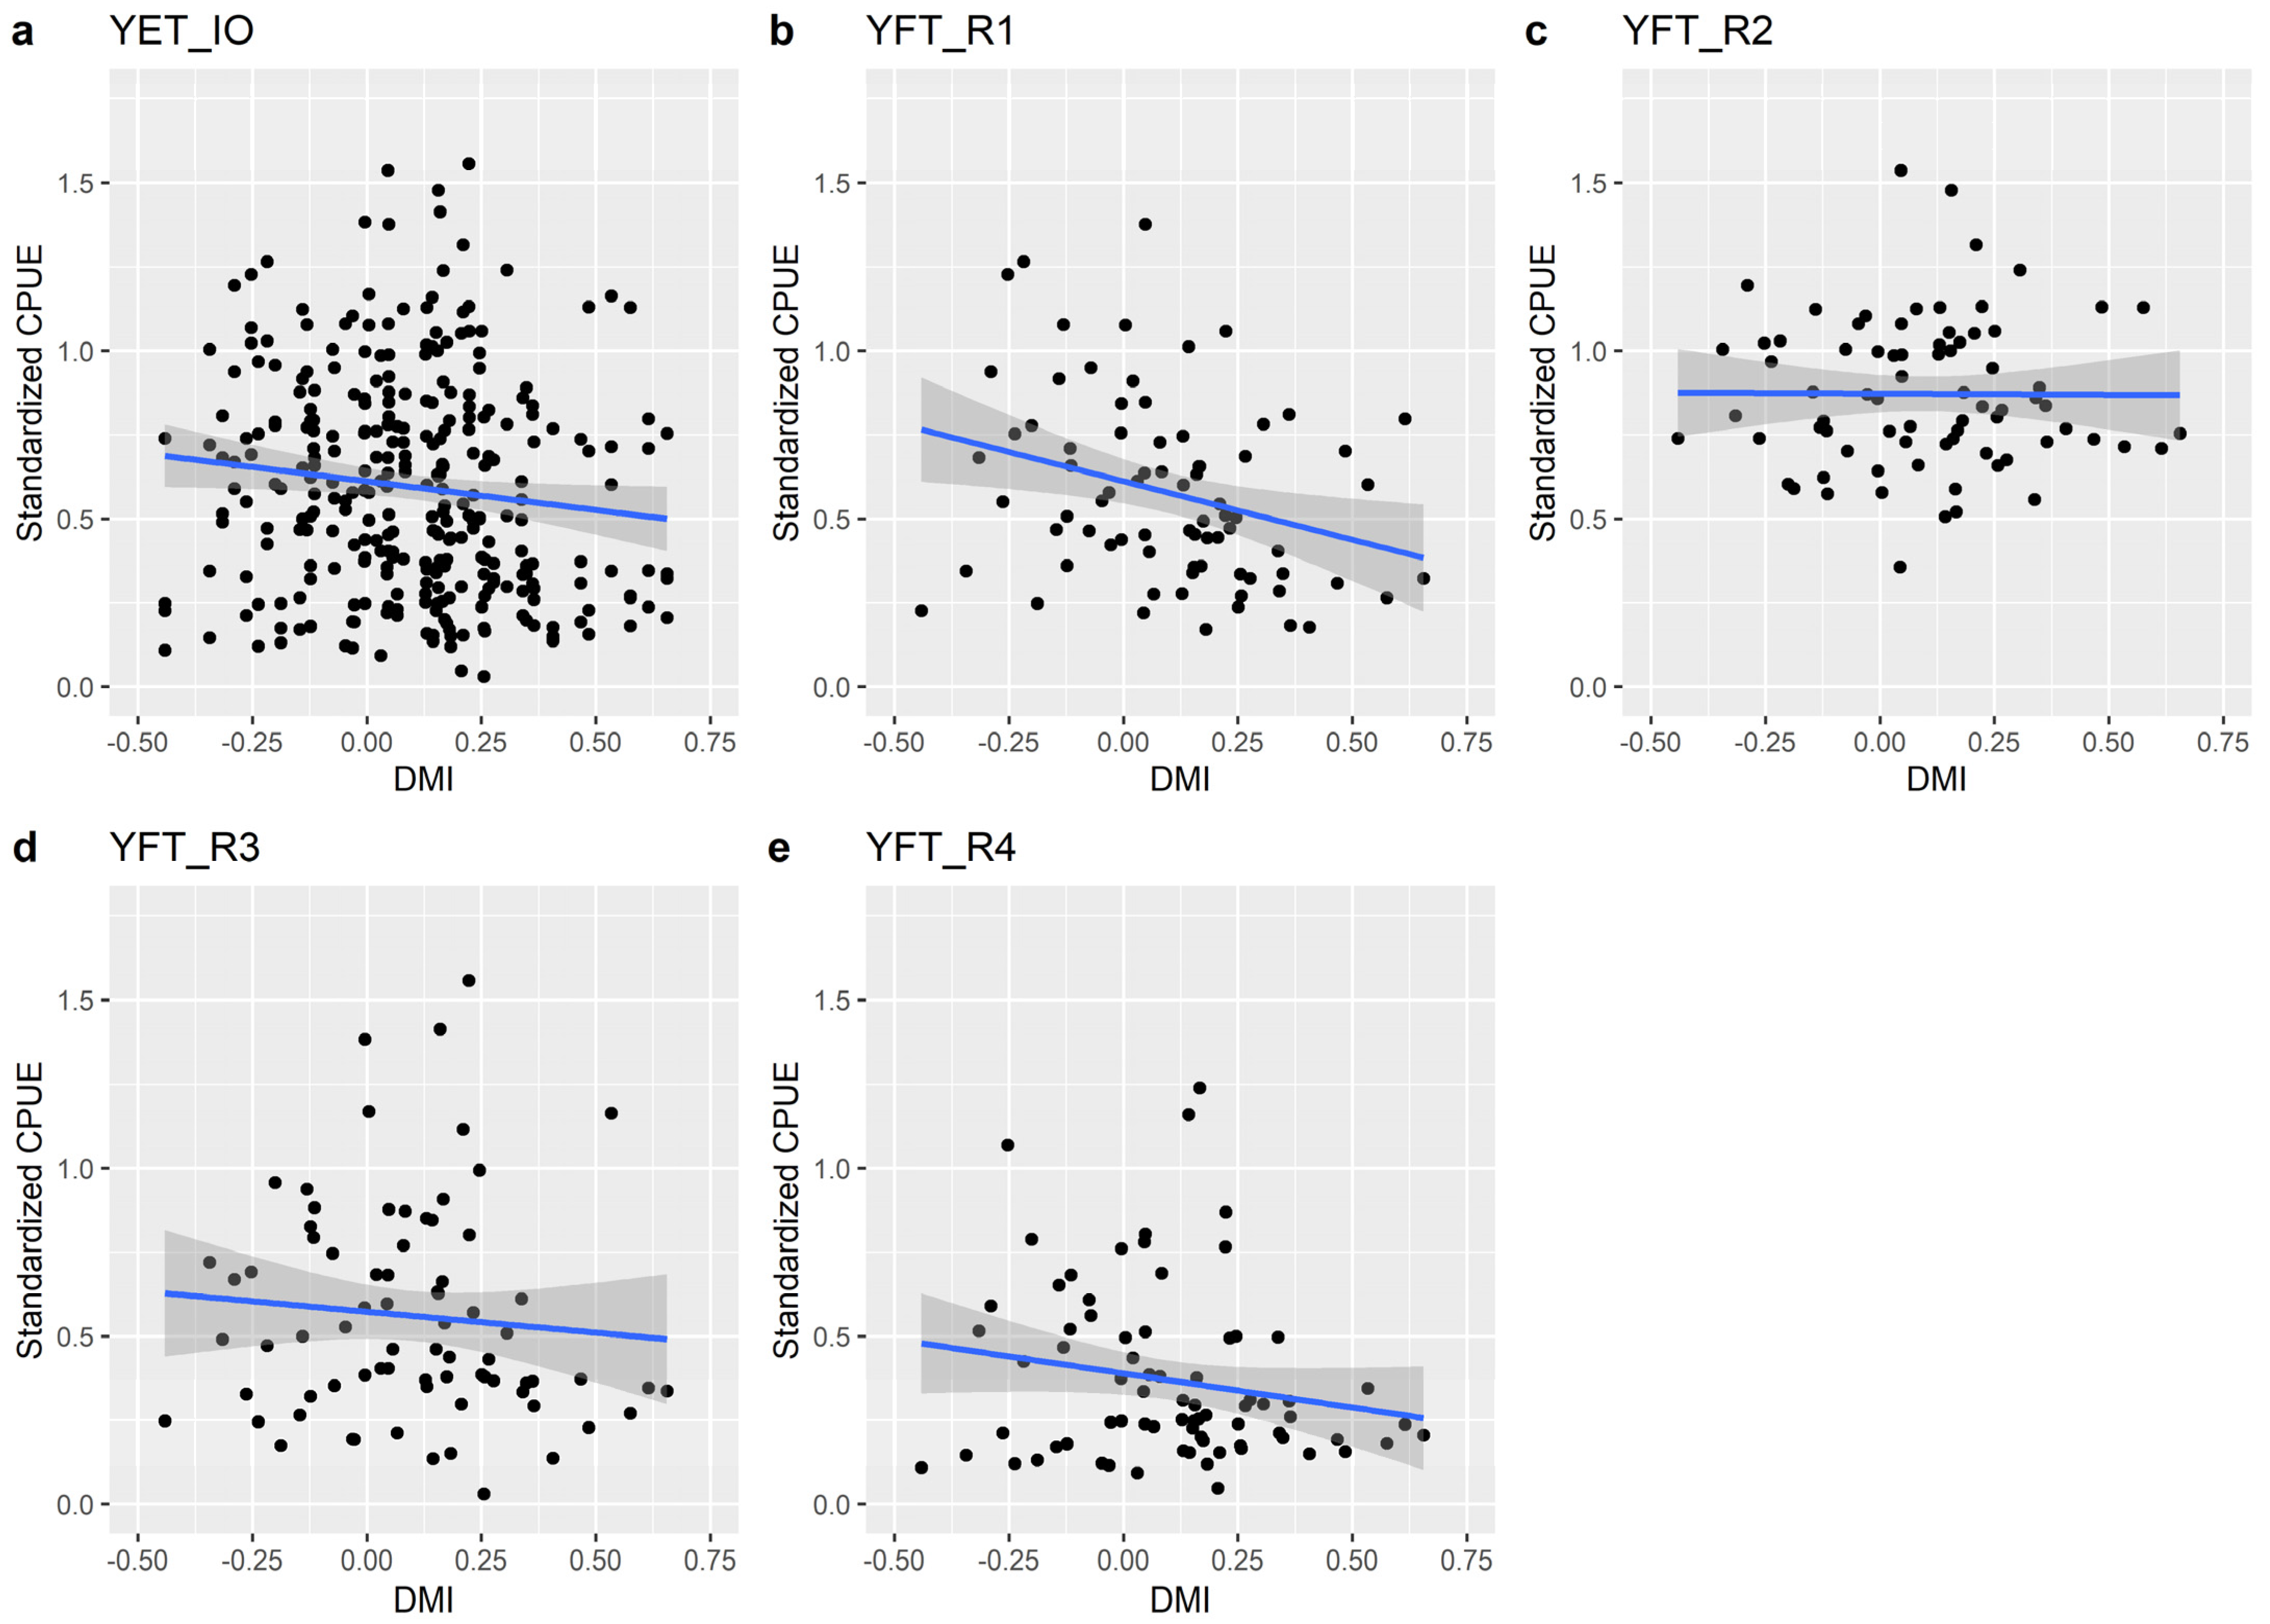
Figure 1. Regional stratification of bigeye tuna (a) and yellowfin tuna (b) in the Indian Ocean [25,26].
Fishes 08 00099 g001
Figure 2. Distribution of DMI from 2000 to 2018. Positive DMI is referred to as positive IOD; negative DMI represents the negative IOD phenomenon.
Fishes 08 00099 g002
Figure 3. Scatter plots of standardized CPUE and DMI with linear regression line of bigeye tuna. Grey shade represented 95% confidence intervals. (a) IO: Indian Ocean; (b) R1: the tropical western Indian Ocean; (c) R2: the tropical eastern Indian Ocean; (d) R3: the southern Indian Ocean. BET: bigeye tuna.
Fishes 08 00099 g003
Figure 4. Scatter plots of standardized CPUE and DMI with linear regression line of yellowfin tuna. Grey shade represented 95% confidence intervals. (a) IO: Indian Ocean; (b) R1: the tropical western Indian Ocean; (c) R2: the southwestern Indian Ocean; (d) R3: the southeastern Indian Ocean; (e) R4: the tropical eastern Indian Ocean. YFT: yellowfin tuna.
Fishes 08 00099 g004
Table 1. Results including estimate, std. error, t-value, p-value, adjusted R-squared, which derived from the linear regression analyses of bigeye tuna and yellowfin tuna for the whole Indian Ocean, western Indian Ocean, east Indian Ocean, and south Indian Ocean during 2000–2018. IO: Indian Ocean; WIO: the tropical western Indian Ocean; EIO: the tropical eastern Indian Ocean; SIO: the southern Indian Ocean. BET: bigeye tuna; YFT: yellowfin tuna.
EstimateStd. Errort-Valuep-ValueAdjusted R-Squared
IOBET(Intercept)
DMI
0.730.016
−0.020.063−0.2480.804−0.003
YFT(Intercept)0.6190.021
DMI−0.170.086−2.0570.0410.011
WIOBET(R1b)(Intercept)0.8910.029
DMI−0.3920.104−3.7580.00020.054
YFT(R1y)(Intercept)0.6120.033
DMI−0.3480.132−2.6240.01060.072
EIOBET(R2b)(Intercept)0.7420.021
DMI0.020.0850.2370.813−0.013
YFT(R4y)(Intercept)0.3880.032
DMI−0.20.127−1.590.1160.019
SIOBET(R3b)(Intercept)0.8220.031
DMI−0.0380.123−0.3150.754−0.012
YFT(R2y)(Intercept)0.8720.028
DMI−0.00680.1121−0.0610.925−0.013
YFT(R3y)(Intercept)0.6040.051
DMI−0.150.203−0.7450.458−0.006
Disclaimer/Publisher’s Note: The statements, opinions and data contained in all publications are solely those of the individual author(s) and contributor(s) and not of MDPI and/or the editor(s). MDPI and/or the editor(s) disclaim responsibility for any injury to people or property resulting from any ideas, methods, instructions or products referred to in the content.

